Article

Geospatial Techniques for Improved Water Management in Jordan

1
Department of Land, Water and Environment, Faculty of Agriculture, The University of Jordan, Amman 11942, Jordan
2
The Ministry of Water and Irrigation, Amman 11181, Jordan
*
Author to whom correspondence should be addressed.
These authors contributed equally to this work.
Water 2016, 8(4), 132; https://doi.org/10.3390/w8040132
Submission received: 24 November 2015 / Revised: 14 March 2016 / Accepted: 30 March 2016 / Published: 2 April 2016
(This article belongs to the Special Issue Water Resources Assessment and Management in Drylands)

Abstract

:
This research shows a case from Jordan where geospatial techniques were utilized for irrigation water auditing. The work was based on assessing records of groundwater abstraction in relation to irrigated areas and estimated crop water consumption in three water basins: Yarmouk, Amman-Zarqa and Azraq. Mapping of irrigated areas and crop water requirements was carried out using remote sensing data of Landsat 8 and daily weather records. The methodology was based on visual interpretation and the unsupervised classification for remote sensing data, supported by ground surveys. Net (NCWR) and gross (GCWR) crop water requirements were calculated by merging crop evapotranspiration (ETc), calculated from daily weather records, with maps of irrigated crops. Gross water requirements were compared with groundwater abstractions recorded at a farm level to assess the levels of abstraction in relation to groundwater safe yield. Results showed that irrigated area and GCWR were higher than officially recorded cropped area and abstracted groundwater. The over abstraction of groundwater was estimated to range from 144% to 360% of the safe yield in the three basins. Overlaying the maps of irrigation and groundwater wells enabled the Ministry of Water and Irrigation (MWI) to detect and uncover violations and illegal practices of irrigation, in the form of unlicensed wells, incorrect metering of pumped water and water conveyance for long distances. Results from the work were utilized at s high level of decision-making and changes to the water law were made, with remote sensing data being accredited for monitoring water resources in Jordan.

Graphical Abstract

1. Introduction

Drylands are limited by soil moisture due to low rainfall and high evaporation. They show a gradient of increasing primary productivity in the order of hyper-arid, arid, and semiarid to dry sub-humid areas [1]. Drylands represent fragile ecosystems that are highly susceptible to environmental changes. Nevertheless, they provide important ecosystem services in terms of land and water, particularly in developing countries [2]. The limited surface water resources of drylands makes water management a challenge for planners and decision-makers, as groundwater will be pumped for different uses to compensate for the limited surface water. The indiscriminate use of groundwater, particularly for irrigation, may result in aquifer depletion and salinization of soil and water. The problems resulting from groundwater depletion are usually aggravated in countries with high population growth and limited water resources [3].
Among the countries of the Middle East, Jordan represents a challenging case in terms of dryland water management, as the country’s water resources are limited and its population is growing at high rates [3]. In terms of water availability, Jordan is among the four poorest countries in the world, with a per capita share of less than 146 m3 per year, which is far below the international water poverty line of 500 m3 per year [
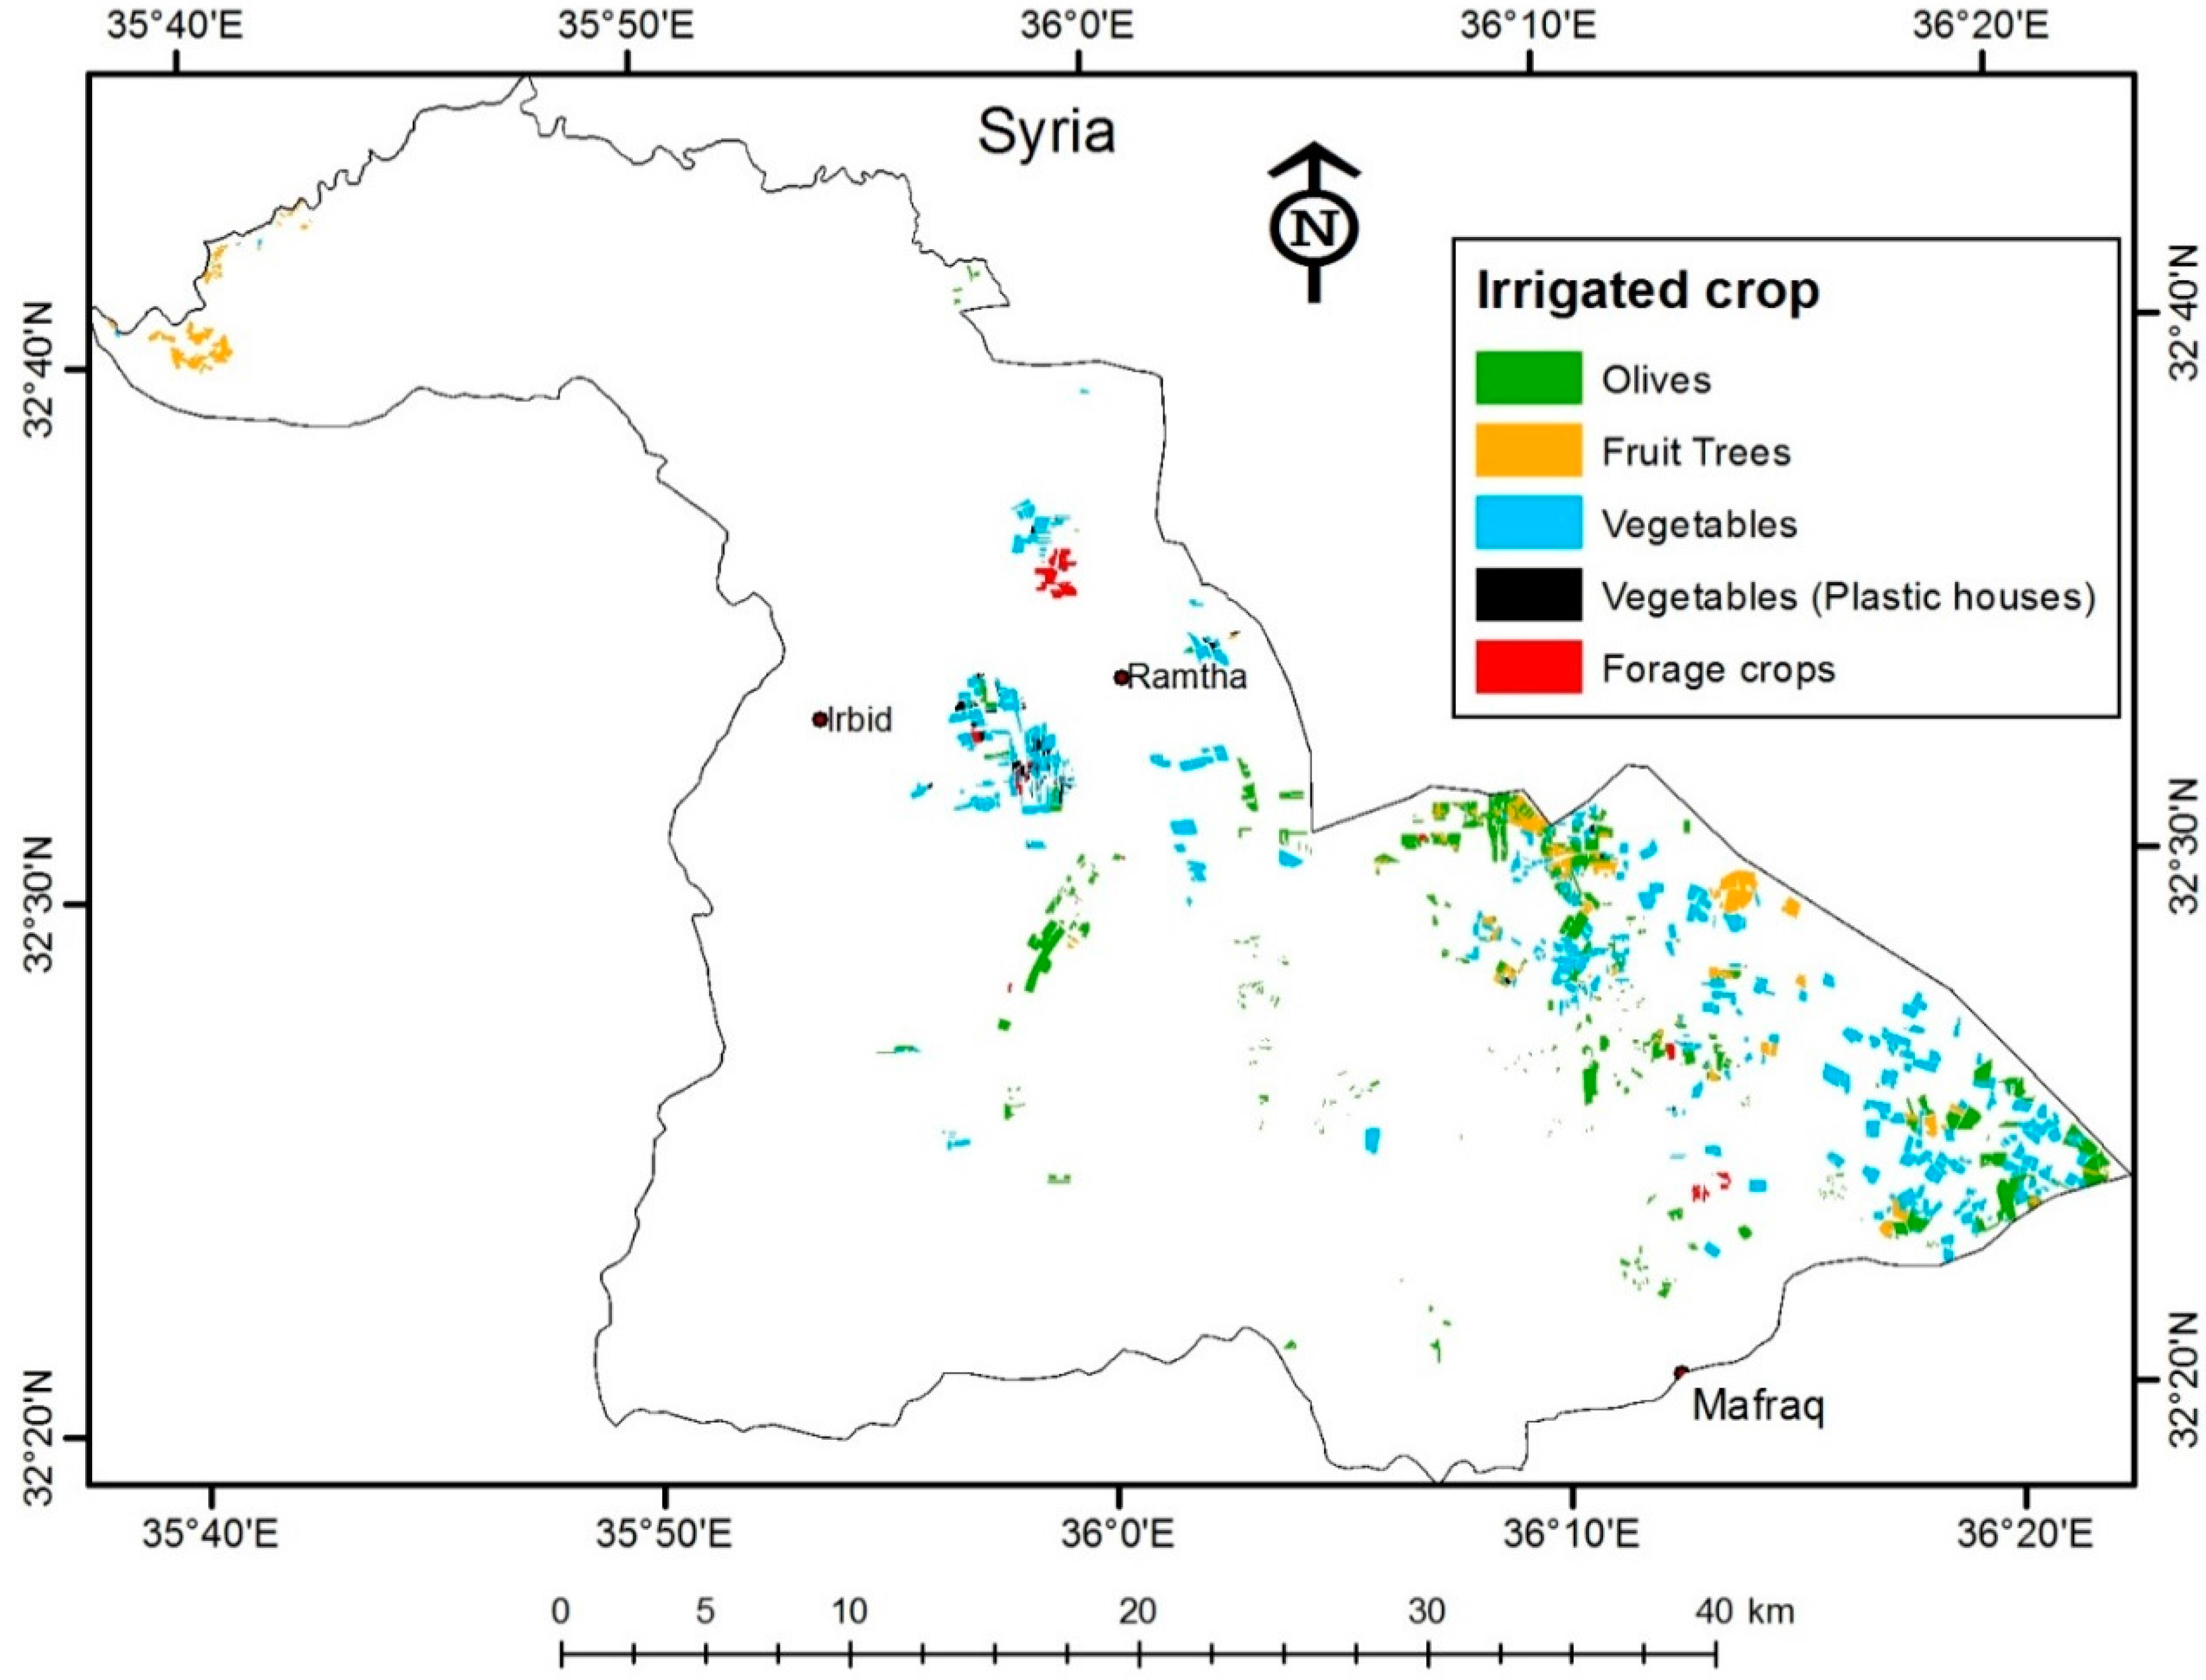
4]. Drylands dominate most of Jordan, where more than 90% of the country’s land is arid and receives low rainfall amounts (Figure 1). Therefore, agricultural production in the country depends on irrigation using both developed surface and groundwater resources. At present, agriculture consumes more than 60% of the developed water resources. This share is expected to decrease in the near future as the population is increasing at high rates that reached an average of 2.9% during 2000–2012 [3,5]. According to Jordan’s Department of Statistics [6], the population of Jordan increased from 5 million in 2002 to 6.7 million in 2014. The problem of population growth during 2002–2012 was aggravated by the influx of 0.45 and 1.5 million refugees from Iraq and Syria, respectively [7,8]. Such conditions of scarce resources and high population would put more stresses on water use and management. In addition, they might create environmental threats resulting from the use of marginal water resources [9].
Managing water resources under the conditions of limited rainfall and increased competition among sectors requires updated information on water consumption by the different sectors. For domestic and industrial sectors, this can be achieved by the use of direct metering and information from pumping stations operated by the Government. For agricultural water use, the information on water consumption becomes more difficult when groundwater is used for irrigation. In Jordan, most of the figures on groundwater consumption for irrigation are inaccurate due to the lack of information on the actual irrigated area and crop water consumption. Information on the spatial distribution of irrigation with accurate areas for the different irrigated crops is still needed by the Ministry of Water and Irrigation (MWI) to assess and improve water management at the country level. The use of ground surveys to map irrigation is impractical, particularly when information is annually needed for water budget calculations and for revising plans of water management. Alternatively, remote sensing data and geospatial techniques can be used for this purpose. The improvements in spatial, spectral and temporal resolution of remote sensing data and the access to different sources of earth observation systems justify the adoption of geospatial techniques for managing water resources. The most important application in this regard is the use of medium and high resolution data to map crops and to estimate their evapotranspiration, the major component of crop water requirements or consumption use [10,11,12,13,14].
The use of remote sensing and geospatial techniques in water management took a new turn as these techniques were utilized in new approaches of assessment, generally called water accounting systems [15]. At the water basin level, the major components of these systems are the resource base, which represents water supply, crop evapotranspiration and water withdrawal, which represent water depletion, and the biomass production, which represents water productivity [16,17,18]. The most important inputs provided by remote sensing to the abovementioned components are the crop evapotranspiration and the land use maps [19]. The contribution of remote sensing and geospatial techniques will become more important in ungauged and poorly gauged basins as inputs will be provided with low cost and at reasonable accuracy [19]. Whether water accounting systems are implemented or not, remote sensing and geospatial techniques will continue to support water managers and decision makers with information needed for improved water management.
Within Jordan’s efforts to manage its scarce water resources, MWI is in the stage of adopting geospatial techniques to improve water management at the country level. Recently, the MWI implemented a study in two pilot areas (Azraq and Mafraq) to map irrigated crops and to estimate agriculture water use using remote sensing data [20]. Initial results of the study showed that remote sensing maps were more accurate than estimates and records obtained by field crews of MWI. The difference between actual and estimated areas was important in terms of water consumption. Although the differences between both estimates could be attributed to the non-extensive ground survey that was limited by the available resources, they could, however, indicate possible violations of illegal drilling of wells and inaccurate metering of pumped water [
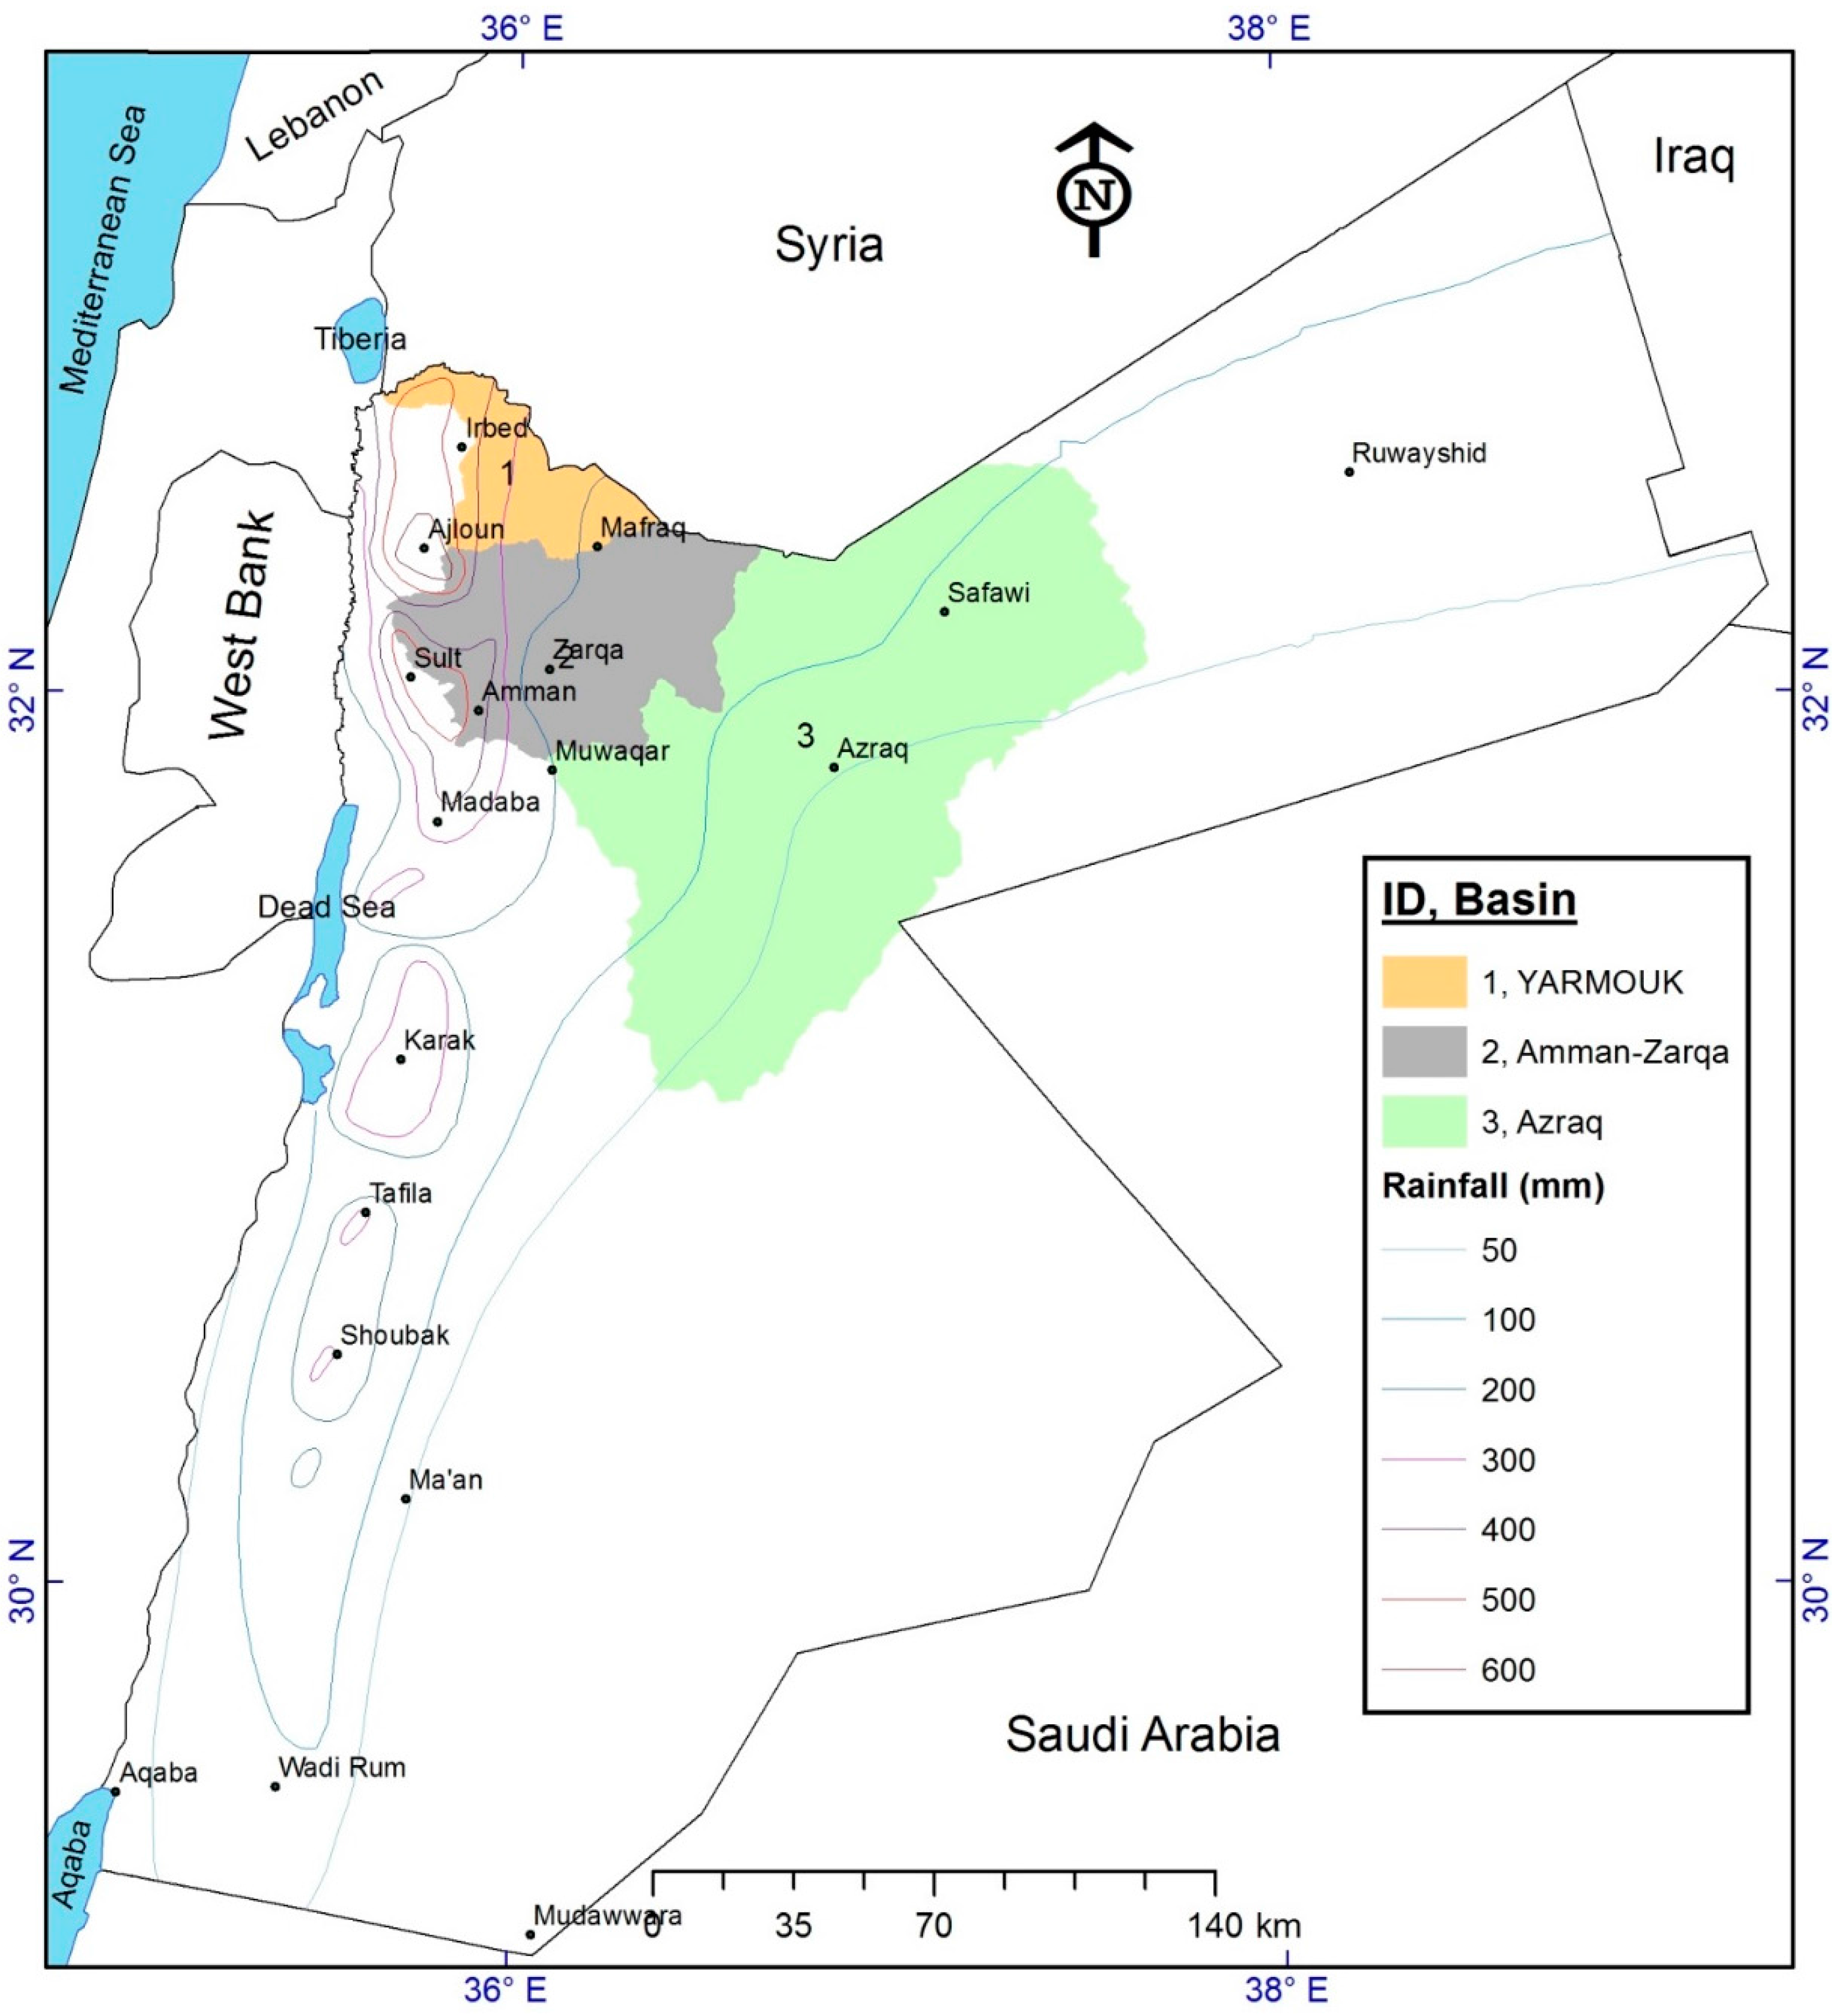
21]. Therefore, the MWI adopted remote sensing for crop mapping and for auditing agricultural water consumption in the main irrigated areas in highlands. The areas included Jordan’s parts of Yarmouk, Amman-Zarqa and Azraq basins (Figure 1). The overall aim of crop mapping using remote sensing data, presented in this work, is to provide MWI with information on the gap between official records and remote sensing estimates so that decisions can be taken to manage water resources in the three basins. Other objectives include the utilization of remote sensing data to map irrigated crops and the capacity building for MWI staff in using geospatial techniques for managing water resources. Despite their importance, spatial distribution of irrigated lands and their areas in Jordan were based on estimates, as the MWI lacked the capacity needed to fully utilize geospatial techniques. The inaccurate estimate of irrigated lands is also a worldwide problem and still remains uncertain [22]. Furthermore, the political nature of irrigation in countries that share water resources across borders often sets the stage for under-reporting of water use [23]. Therefore, this work provides proposed methods for mapping irrigated crops in Jordan’s drylands and similar environments and will thus help in downscaling irrigation mapping to the basin level and provide important information that can be used for auditing records of water abstraction.

2. Study Areas and Data Collection

2.1. Study Areas

The first basin considered in this study was Yarmouk (Figure 1). About 30% (1393 km
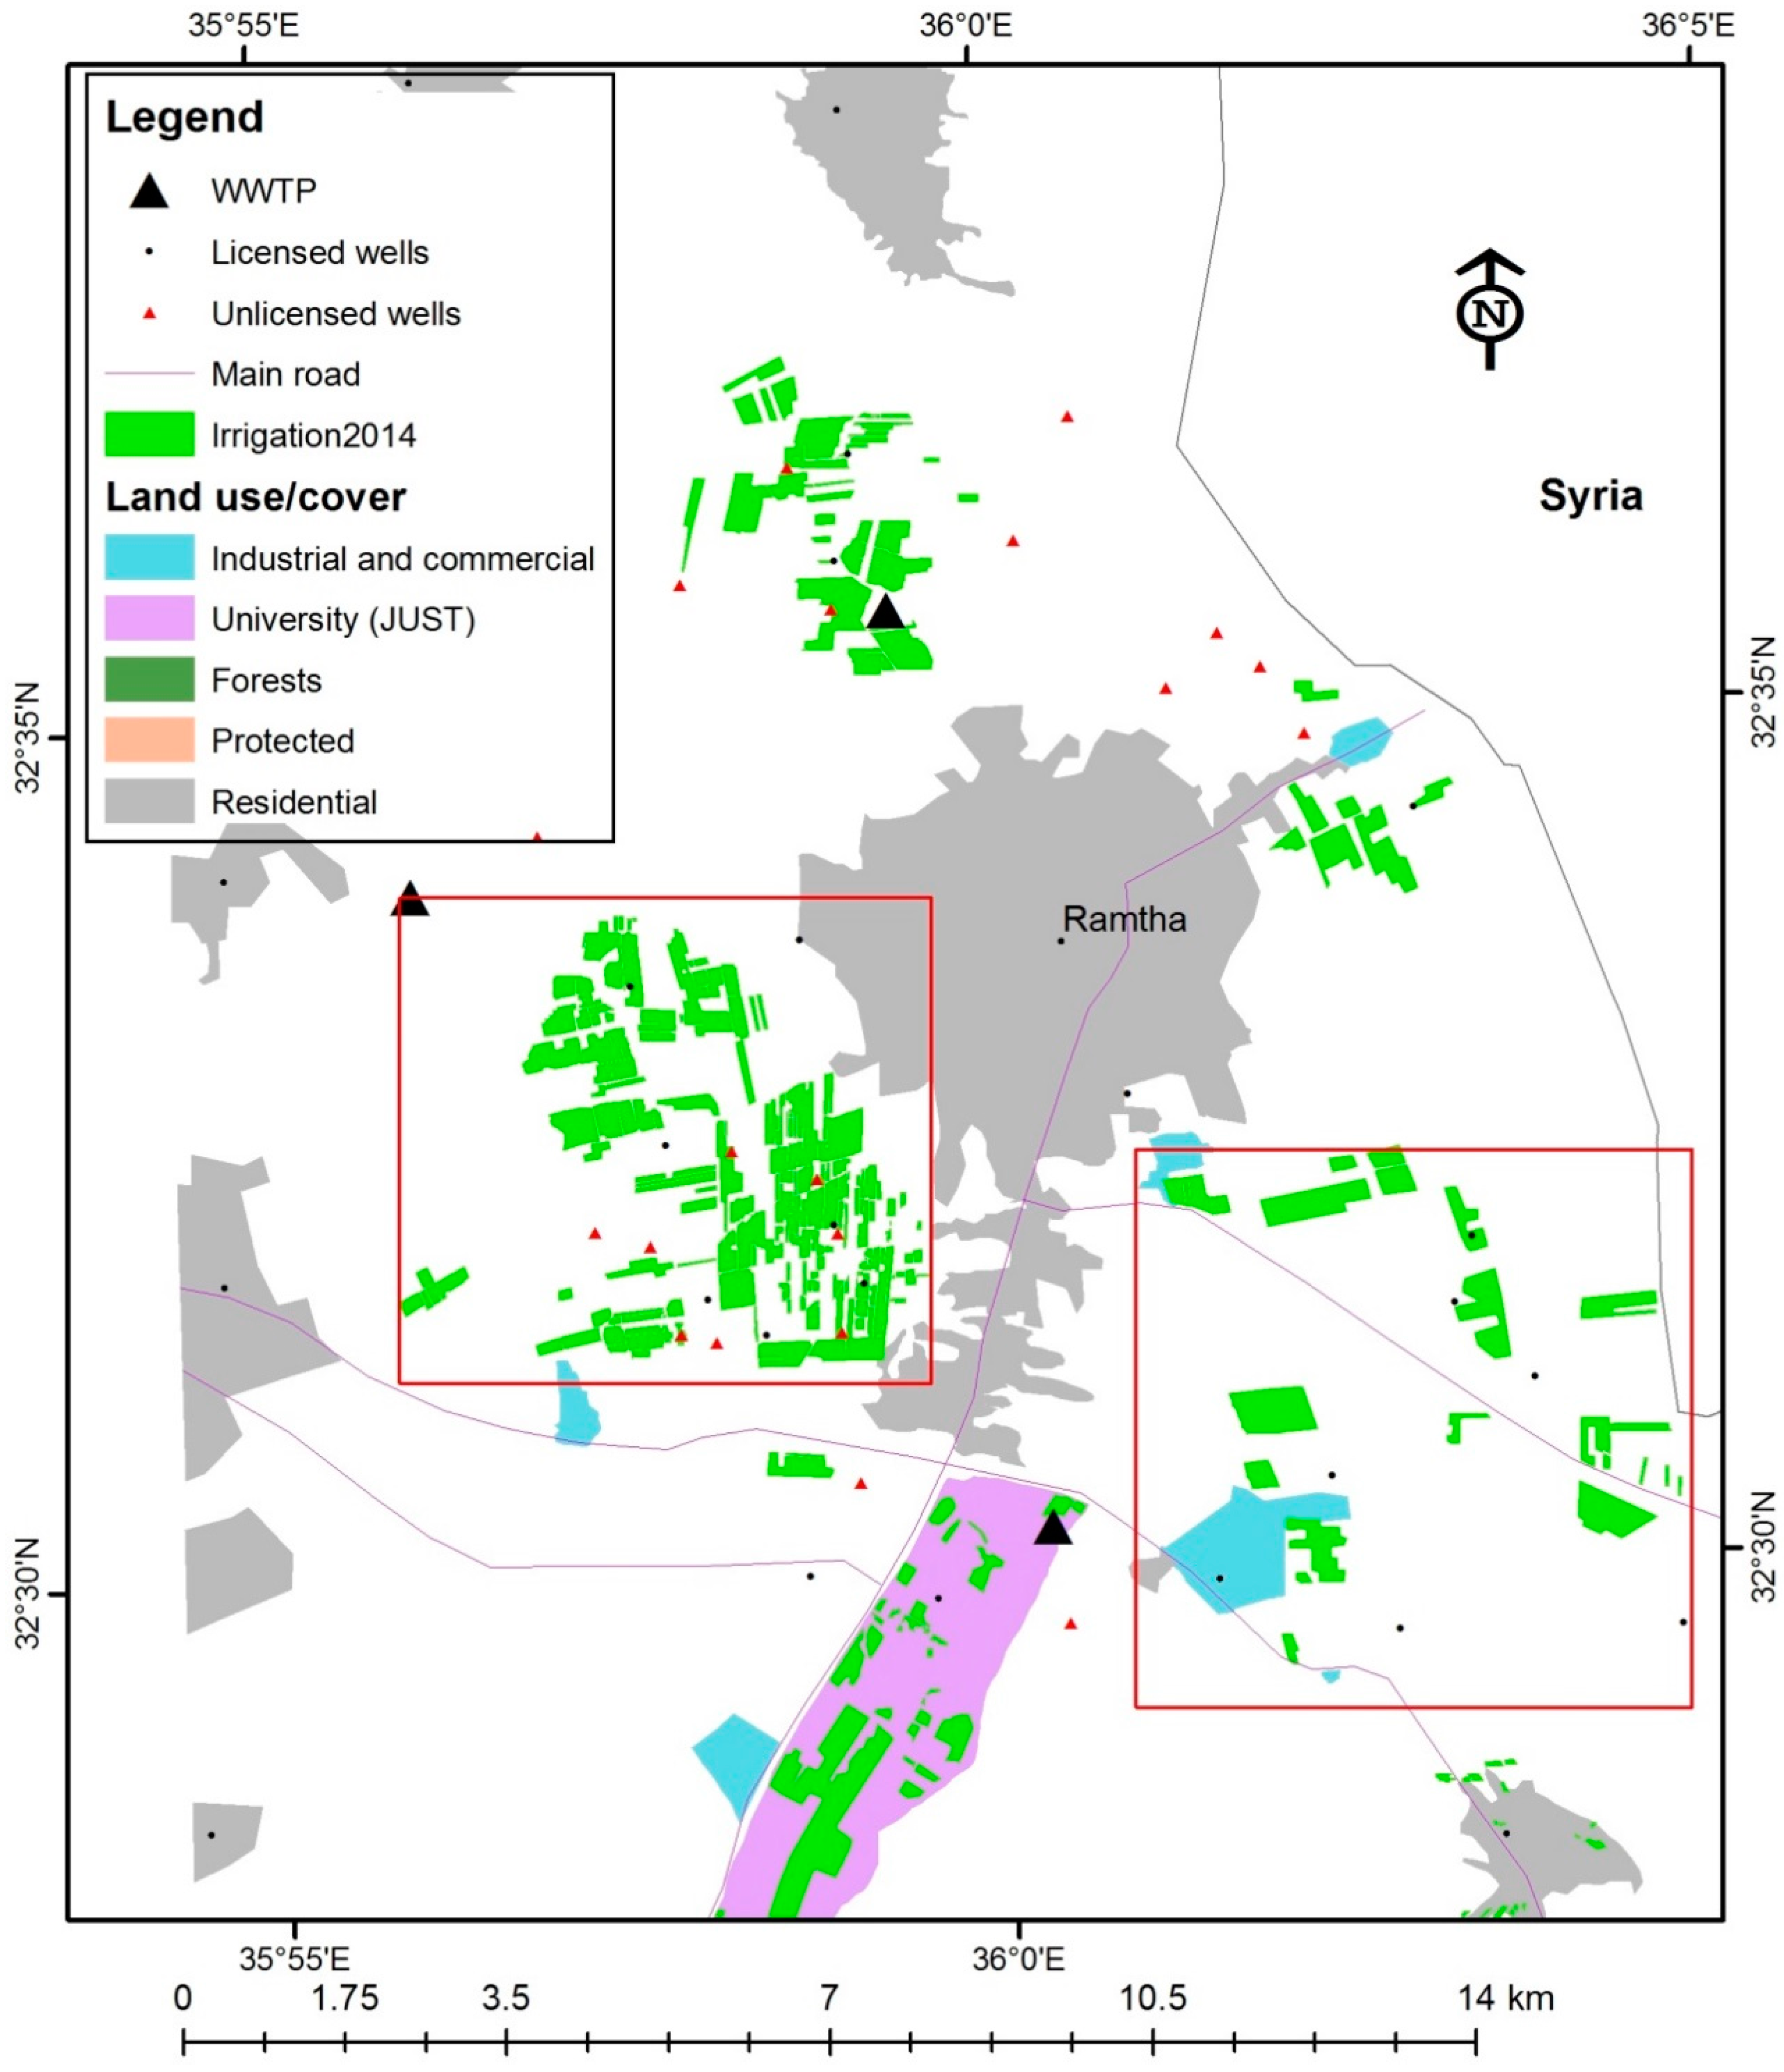
2) of the basin’s land is located in Jordan, while 70% is located in Syria. The basin has a semiarid Mediterranean climate in the west and an arid climate in the east. A rainfall gradient is obvious across the east-west direction, where the mean annual rainfall is 600 mm in the west and 150 mm in the east. The rainy season starts in November and ends by early May. The mean annual minimum and maximum temperatures in the west are 12.3 °C and 23.1 °C, respectively. The mean annual minimum and maximum temperatures in the east are 9.3 °C and 24.0 °C, respectively. The western parts of the basin are mainly rainfed areas cultivated with field crops, olives and vegetables, while the eastern parts extend to the low rainfall zone of the country where irrigation occurs using groundwater. Irrigation also occurs around Ramtha and in the northern parts of Jordan valley where citrus and vegetable crops are cultivated.
The second study area where irrigation was mapped is the Amman-Zarqa basin, also known as the Zarqa River basin. The basin has an area of 3600 km2, where 95% of its area is inside Jordan and 5% is in the south of Syria. The basin has an arid climate in the east and the southeast, while the western parts have typical Mediterranean climates that are semiarid in Amman (Capital of Jordan) and dry sub-humid in Ajloun, where rainfall exceeds 560 mm. The western parts are mountainous and characterized by cool temperature in winter and mild temperature in summer. The annual rainfall ranges from more than 500 mm in the northwest to less than 100 mm in the east, with an average annual precipitation of 250 mm.
The third study area is Azraq basin (Figure 1), which has a total area 11,742 km2. In this basin, water drains from all directions to the center (depression), which used to be a permanent oasis in Jordan’s desert. The climate of Azraq Basin is arid with hot and dry conditions, leading to very high evapotranspiration rates. The mean annual temperature ranges between 7.4 and 24.5 °C in the west (Mafraq area) and between 2.6 to 36.6 °C in Azraq. The maximum air temperature in 2014 reached 42 °C. The mean annual rainfall is about 150 mm in the west and decreases to 70 mm in the east and south and to less than 50 mm in the center of the basin (Azraq depression). Over-pumping of groundwater for irrigation and drinking is noticed in this basin [24,25] and has resulted in the loss of wetlands surrounding the depression.
In terms of surface water resources, both the Yarmouk and Amman-Zarqa basins have perennial rivers that drain to Al-Wehdah and King Talal Dams (KTD), respectively. The collected water in both dams is used to irrigate different crops in Jordan Valley. Surface water resources in Azraq are mainly small desert dams that are used to irrigate small farms of olives and barley. Among the three basins, the Amman-Zarqa aquifer system is the most important groundwater supply in Jordan. This basin hosts more than half of Jordan’s population [5] and more than 85 % of the industries in Jordan [26]. Groundwater resources in Yarmouk and Azraq basins, on the other hand, are also used for drinking and irrigation. Other sources of water include the treated wastewater from different plants in the three basins. Part of the effluent from treated wastewater plants (WWTP) is used for restricted agriculture, according to agreements between MWI and local farmers. The annual amount of treated wastewater effluent in Amman-Zarqa basin is 98 million cubic meters (MCM). About 15 MCM are used for irrigating forage crops in the basin, while the remaining is mixed with stored rainfall water in KTD and used to irrigate crops in Jordan Valley. The total amount of treated wastewater allocated for irrigation in Yarmouk is 3.8 MCM. Table 1 summarizes available water resources in the three basins and their use in 2014. All of the above figures were used in calculating gross groundwater amounts used for irrigation. In addition to over-pumping, other threats to water resources in the three basins are the trends of climate change, droughts and desertification [3,27,28,29].

2.2. Remote Sensing Data

The main data used to map crop types were the images of the Operational Land Imager (OLI) of Landsat 8. The images have medium spatial resolution of 30 m. A higher resolution data of RapidEye, with 5-m pixel size, was used to delineate parcels of irrigated fields. The OLI data covered the period October 2013–September 2014, corresponding to a one-year period for calculating the water budget by the MWI. The data of RapidEye included two sets of cloud free images acquired in May and August 2014. Specifications of Landsat and RapidEye bands (B) used in the study are shown in Table 2.

2.3. Ground Data

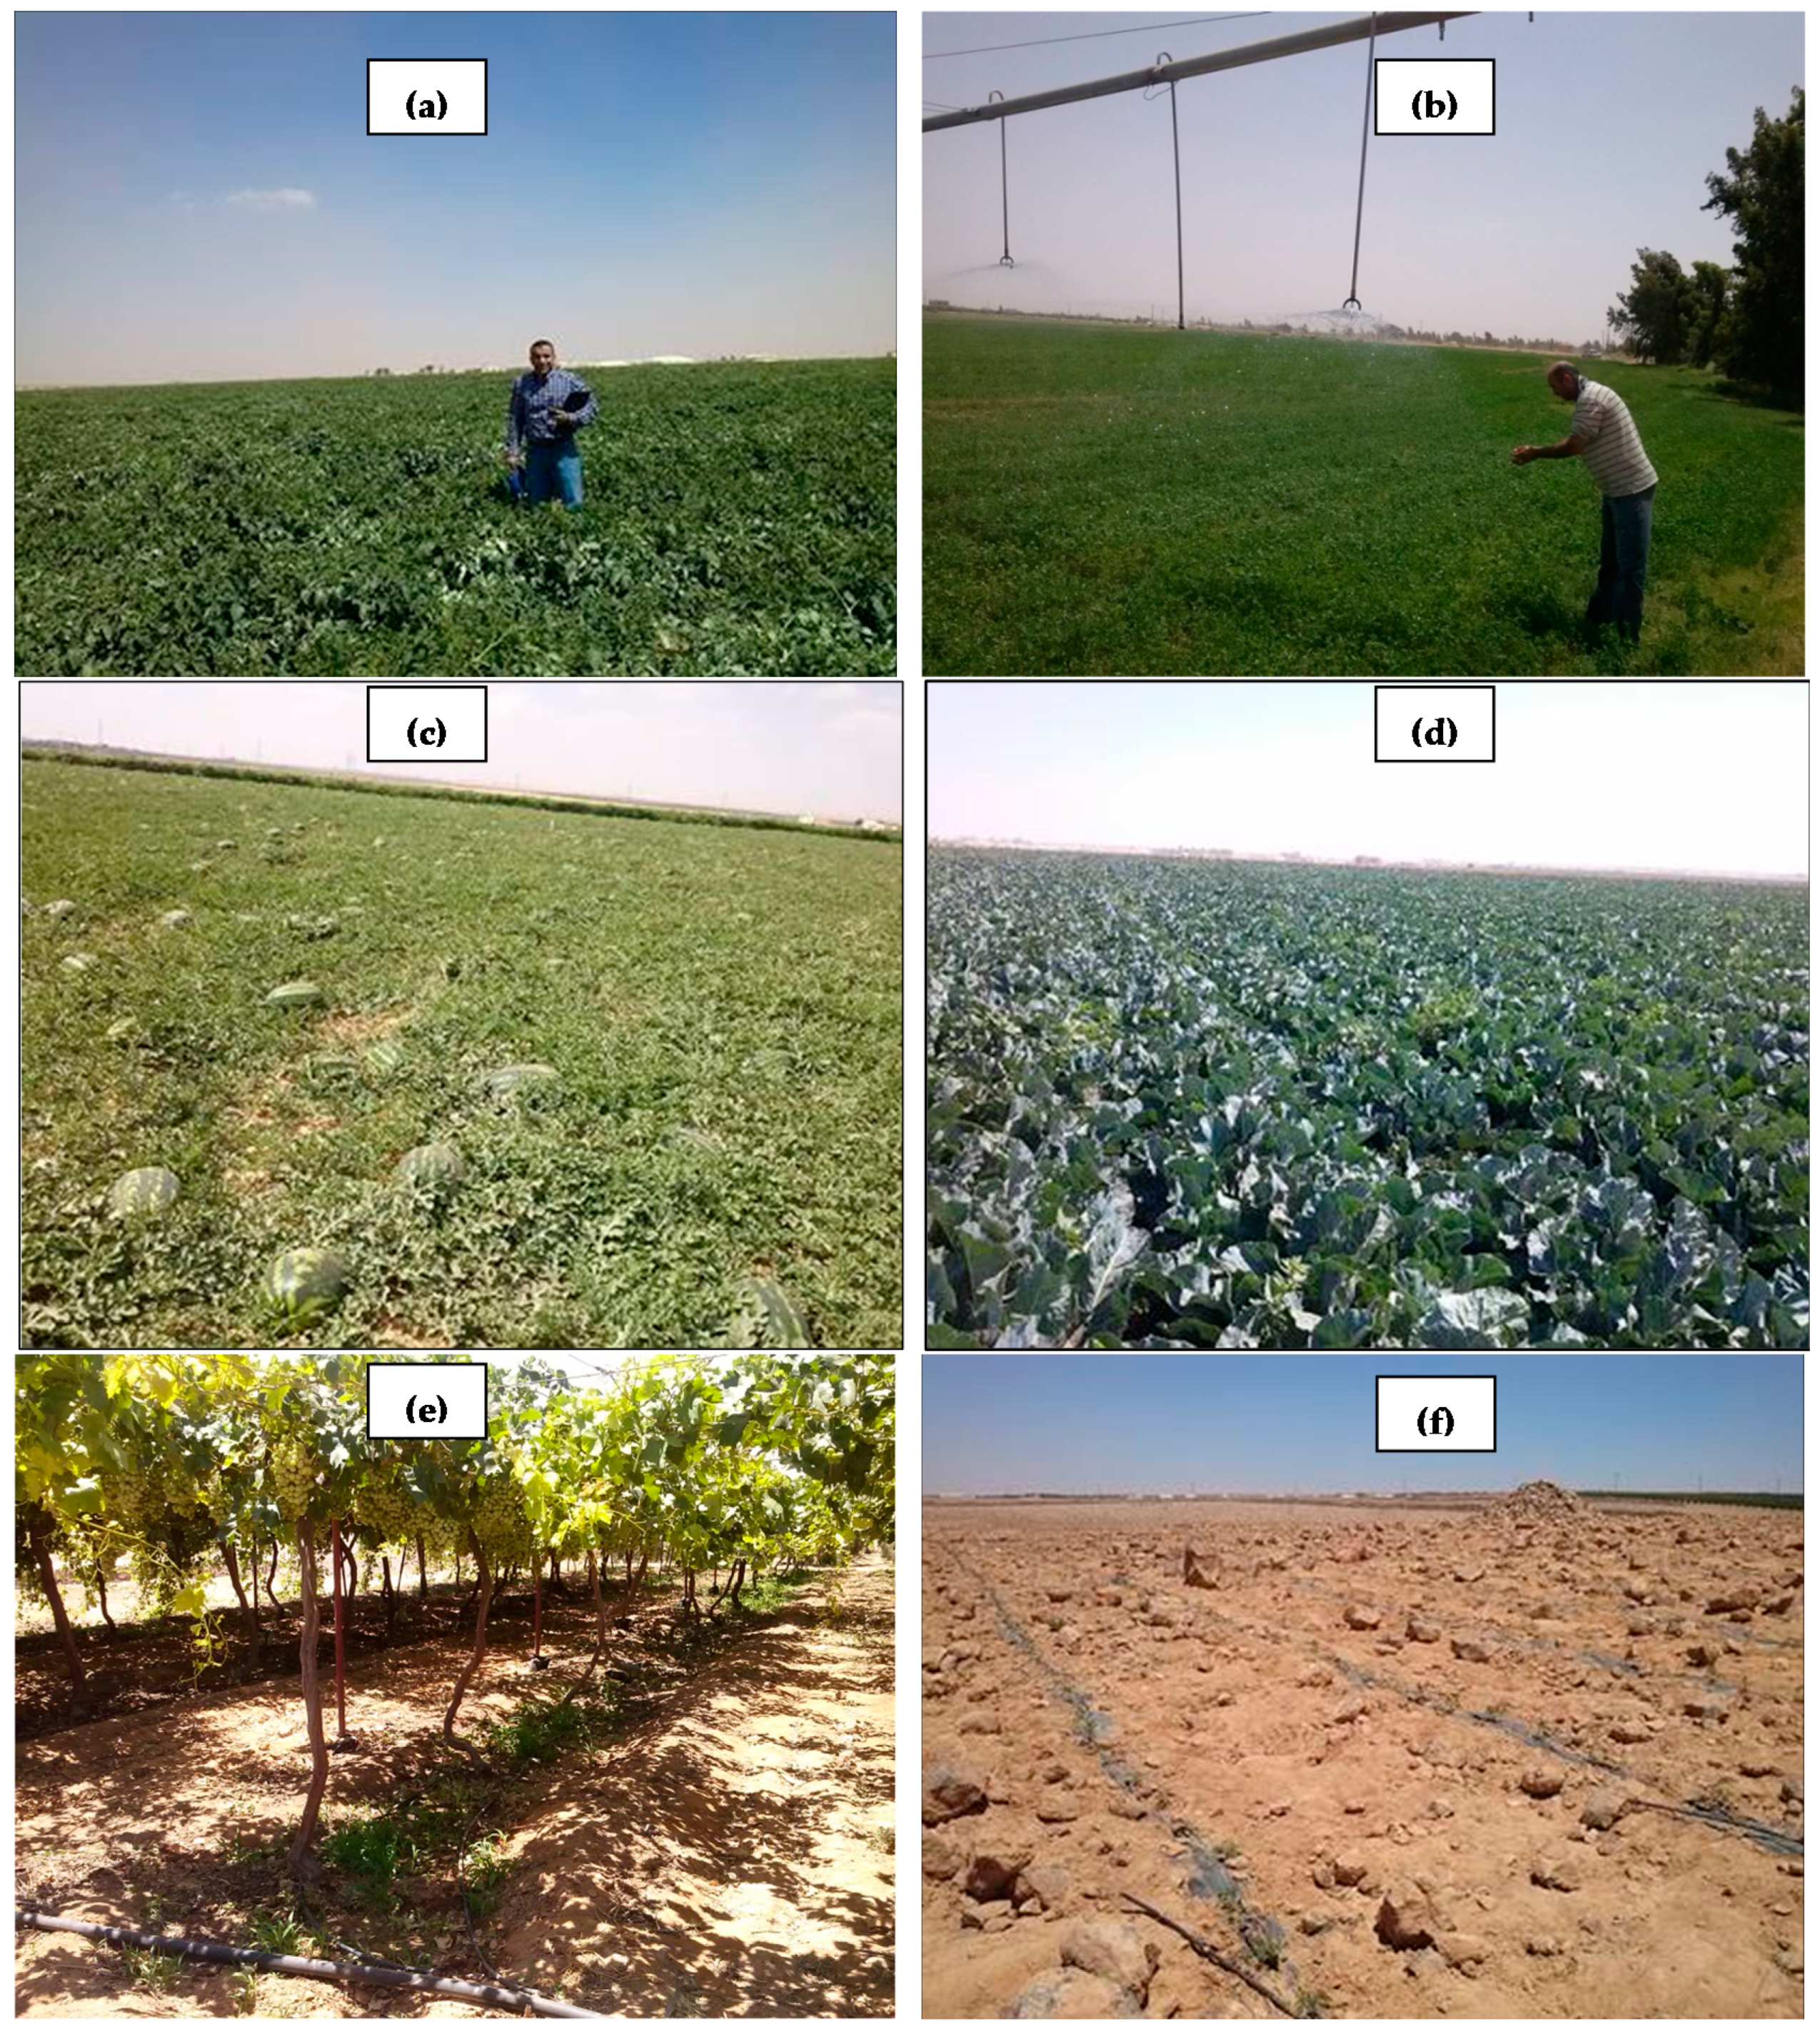
Ground surveys were conducted during May–October 2014 to collect data on the different irrigated crops in the three basins. During these surveys, information was collected on the types of crops, growth stage, planting and harvesting dates, in addition to irrigation systems and agricultural management followed for the different crops. This information was critical for verifying crop maps and for calculating water consumption for irrigated crops in the three basins. In total, field surveys covered 310 farms in the three basins.
Other ground data were collected for atmospheric correction of OLI images. Since remote sensing data of Landsat 8 were provided in digital numbers (DN) corresponding to radiance values at the top of atmosphere, it was important to convert the data into reflectance values at ground level. For this purpose, a handheld multispectral radiometer was used to collect ground measurements for target objects with standard or reference reflectance. The target objects were newly paved car parks (Dark objects) in front of Azraq Syrian Refugees Camp, dry desert mud flat, fields of parsley and tomatoes with full vegetation cover and bright surfaces (floors of abandoned quarries and desert surfaces). The selected locations were large enough so that they appeared in the form of several pixels on the images. Collection of ground data with the handheld radiometer was carried out within one hour of the satellite overpass on the 30 June 2014. The Landsat 8 image acquired for the day in which measurements were made was LC81730382014181LGN00.

2.4. MWI Data

Data of air temperature, relative humidity, wind speed and solar radiation were provided by the MWI. The data included daily records for the stations of Azraq, Safawi Um Ejjmal in Mafraq, Khirbet Samra, KTD, Amman, Ramtha and Irbed. The data were arranged in a spreadsheet and processed to interpolate missing records before being used for calculating crop water requirements. In addition, the MWI provided maps of groundwater wells, with attributes that included amounts of monthly abstraction, in addition to data on irrigated crops and crop management practices in Azraq and Amman-Zarqa basin. The data, originally collected from members of the highland water forum [30], were used for calculating crop water requirement and for verifying crop maps.

3. Methodology

Geospatial techniques and remote sensing data can be used for mapping irrigated lands at local, regional and global scales, according to objective, cost and time. The methods for crop mapping at local scales would include the visual interpretation or a digital classification method or a combination of both [10]. The improvement in remote sensing data encouraged researchers to implement and adopt digital classification methods, which are cost effective and consume less time when compared with the visual interpretation method [31]. The most commonly used approaches of digital classification include the parametric methods of supervised and unsupervised clustering [32]. These methods depend on the use of a single image acquired during the period of peak growth of crops. Due to multi-cropping and varying cropping calendars, a single image may not adequately characterize irrigated areas [33]. More advanced techniques may implement decision tree classifications, which are based on ground data, in addition to knowledge and experience of the classifier [10,34,35]. Further, the use of multi-temporal images of vegetation indices will increase the accuracy of mapping, as temporal resolution may compensate for the poor or moderate spatial resolution [10,36,37]. Among vegetation indices, the normalized difference vegetation index (NDVI) is considered a useful remote sensing product for mapping irrigation at local scales [36,
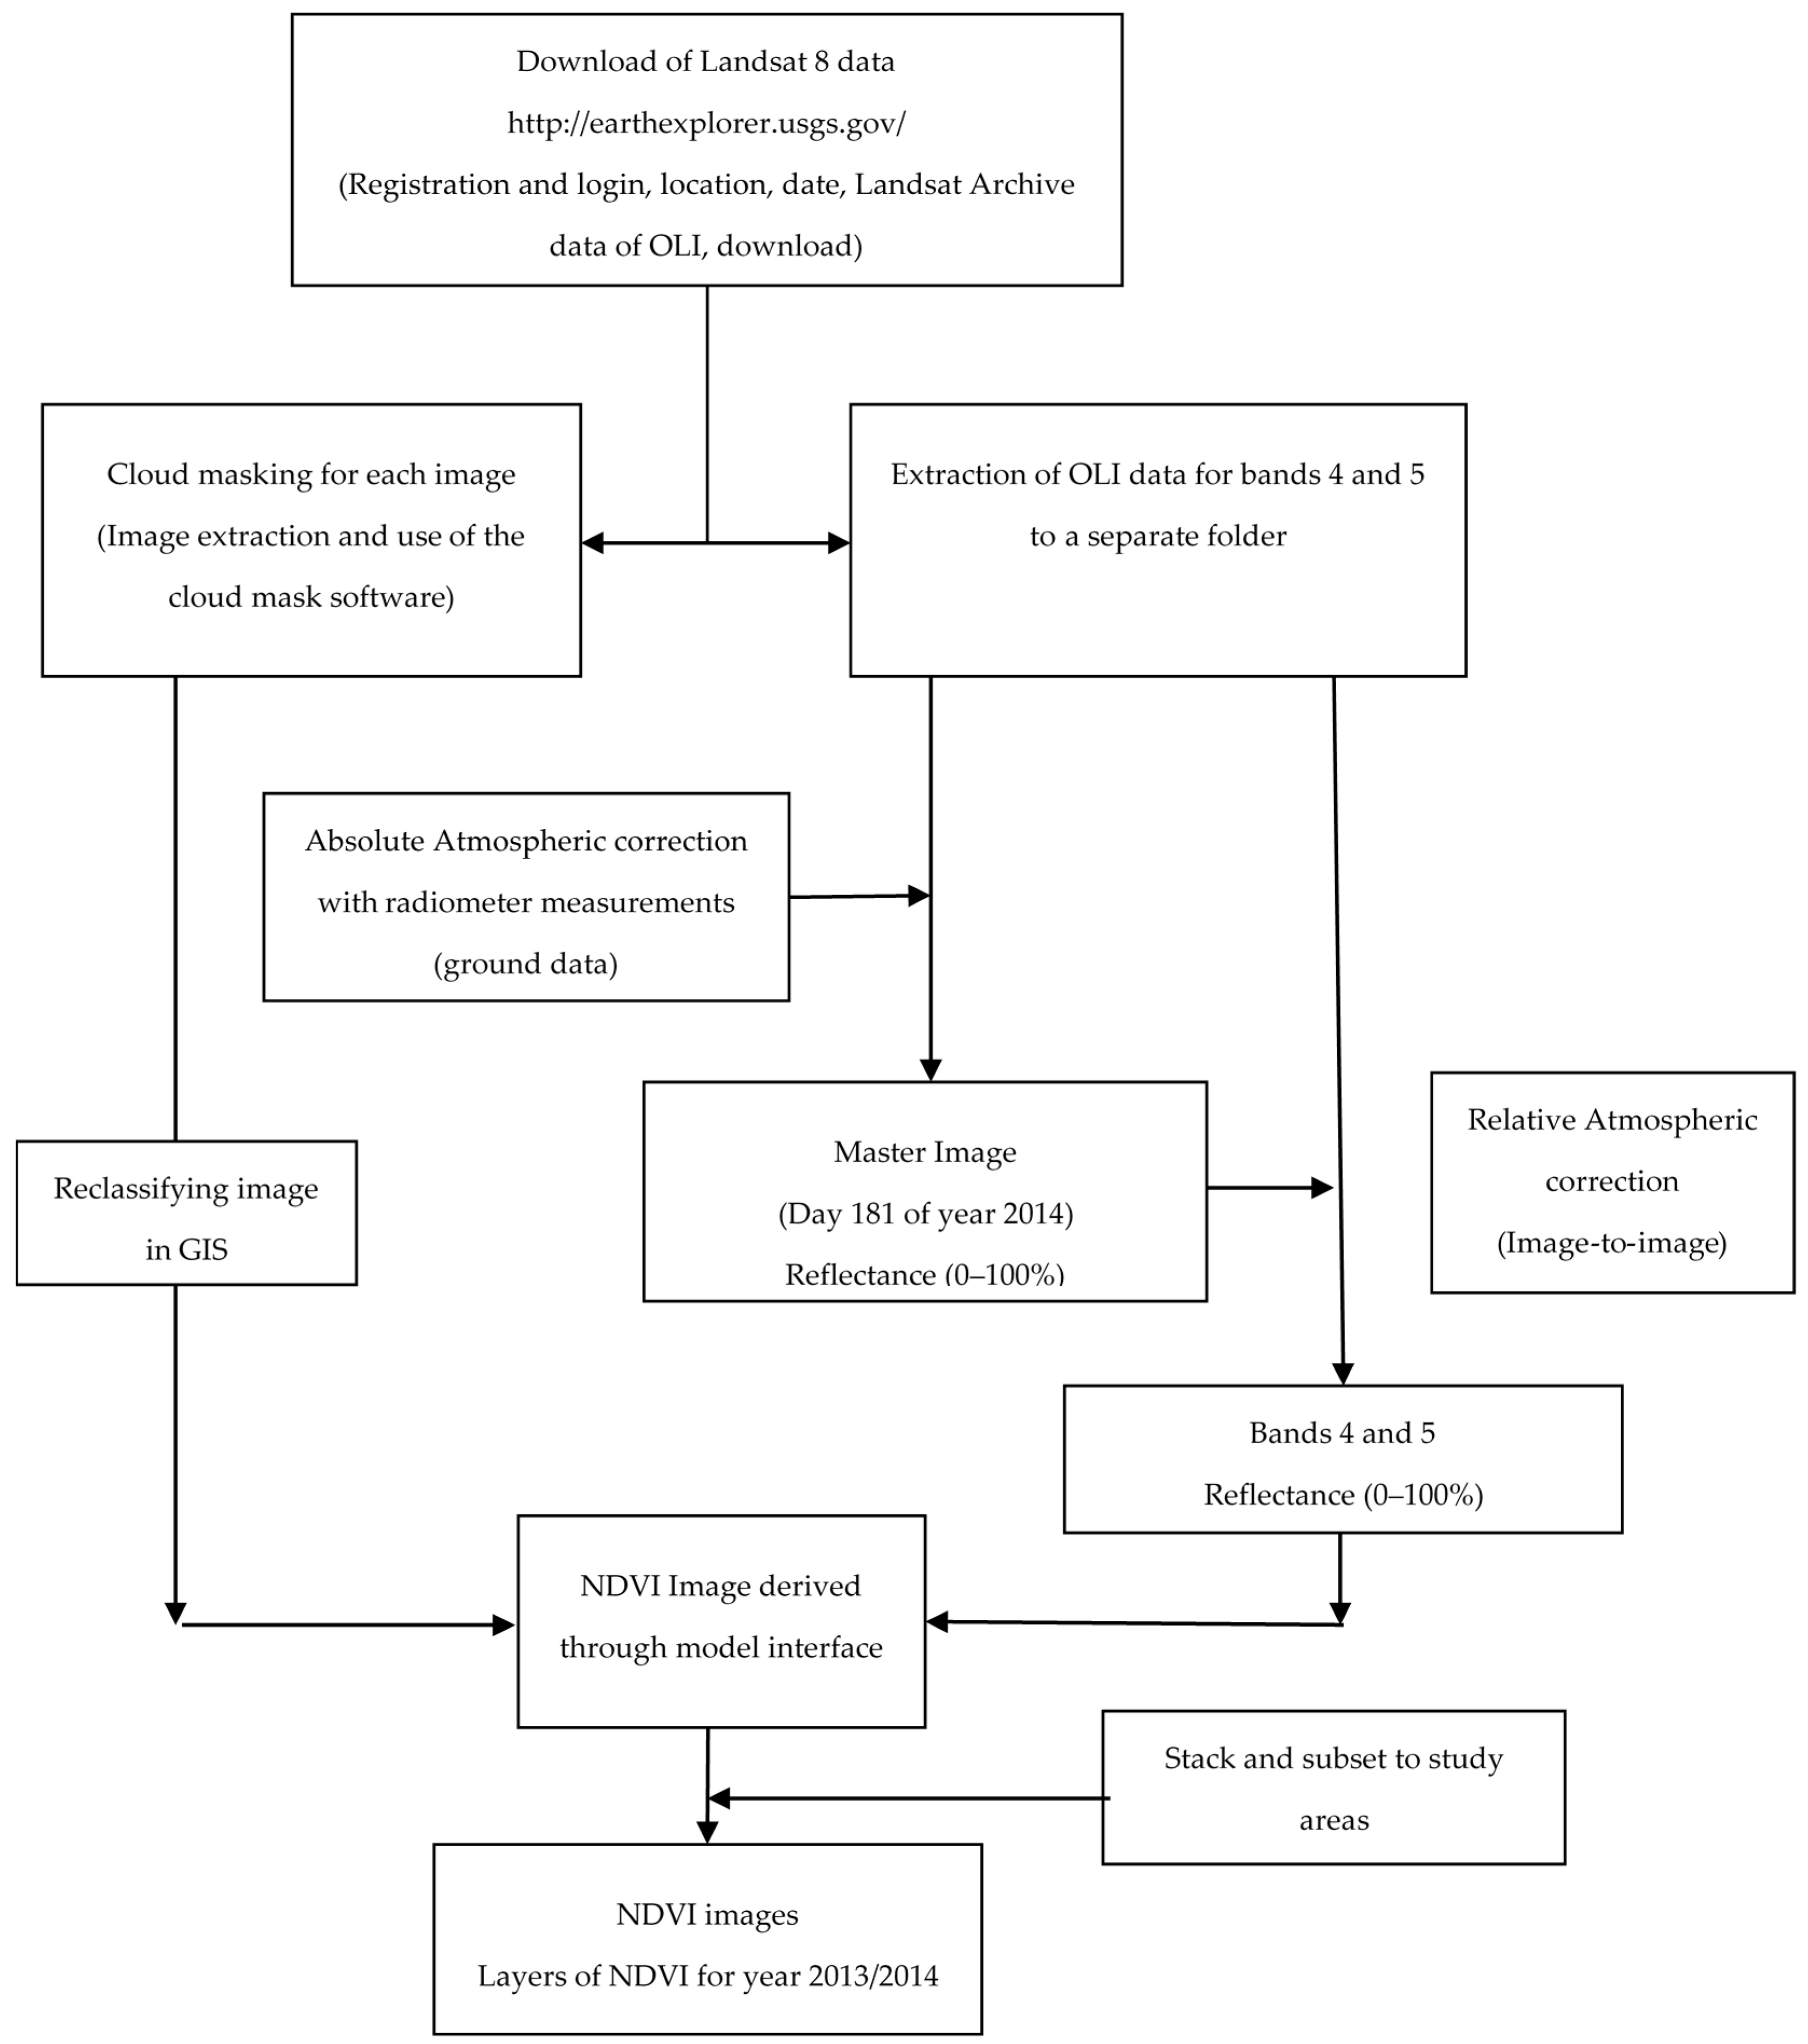
37]. In this study, crop identification was based on the outputs from digital classification techniques of multi-temporal images of Landsat 8 (
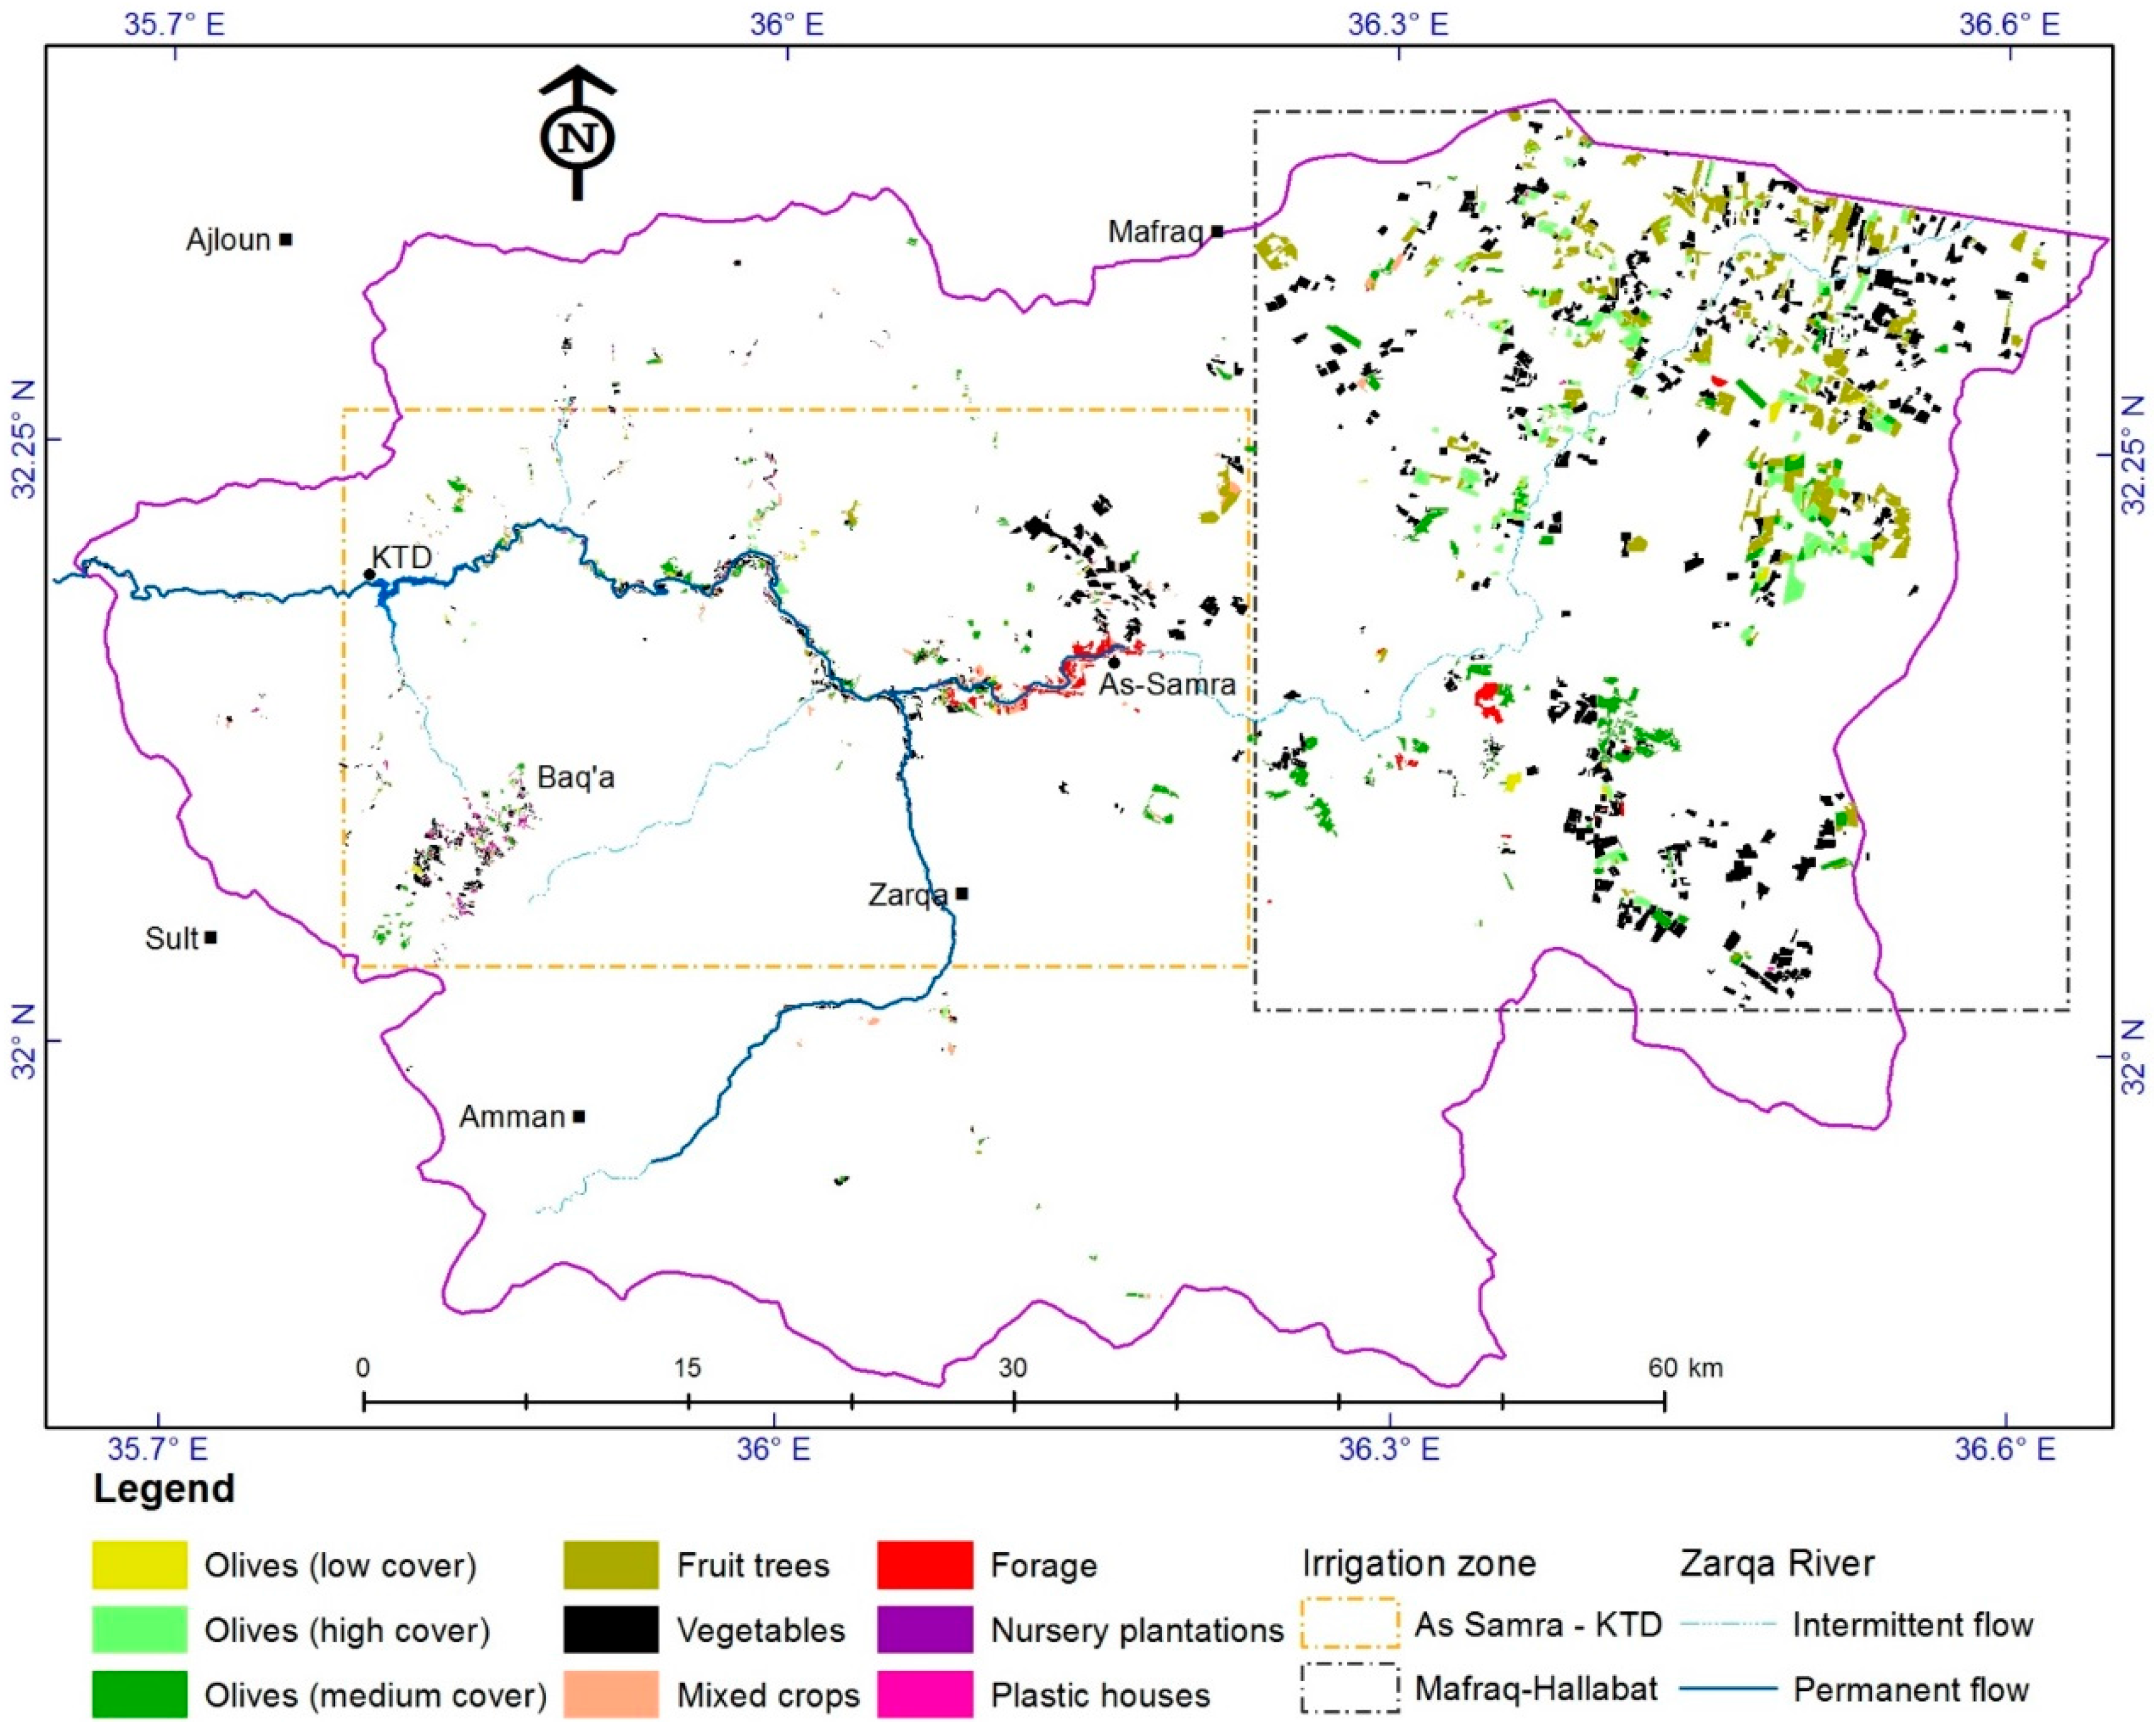
Figure 2), while boundaries of irrigated fields were digitized from very high resolution images of Google Earth (GE) and RapidEye (Figure 3), as described in the following subsections.

3.1. Processing of Remote Sensing Data

The set of downloaded images was processed to identify and exclude images with high cloud cover. A cloud mask was applied to each image using open source software [38]. Using the capabilities of a geographic information system (GIS), each image derived from the cloud mask was decoded using reclassification functions. The output images of cloud cover were displayed and processed in GIS to interpolate cloudy pixels in each image from previous and subsequent images. The total number of OLI images was 23 per year. However, the images with good quality and minimum cloud cover were only ten for Azraq and twelve for the two other basins. For the period of irrigation during April–September, most of images were free of clouds.
Remote sensing data of OLI were corrected to obtain reflectance values at ground level. This was carried out using measurements from the handheld multispectral radiometer (with similar spectral regions to OLI). The data of the handheld radiometer were used for correcting one image (Day 181 of year 2014). This absolute atmospheric correction was based on empirical line calibration [39] derived from linear equations that correlated ground measurements of spectral reflectance with DN for locations of target objects that had unchangeable spectral reflectance among the set of OLI images. The multiple-date image normalization, using linear regression equations, was carried out to correct other images [40]. This relative atmospheric correction method was based on the use of invariant features that had unchangeable spectral reflectance among the set of OLI images. Both methods of absolute and relative atmospheric corrections were considered as standard methods that would not require information about atmospheric conditions at the time of image acquisition [41]. The correction was carried out for the red and near infrared bands of OLI. The corrected bands were then used to derive NDVI, based on the following equation:
N D V I = B 5 B 4 B 5 + B 4 ,
where B4 and B5 are the red and near infrared bands, respectively. Both bands represent spectral reflectance at ground level. The steps of processing OLI images to derive NDVI are summarized in Figure 2.

3.2. Extraction and Analysis of NDVI Profiles

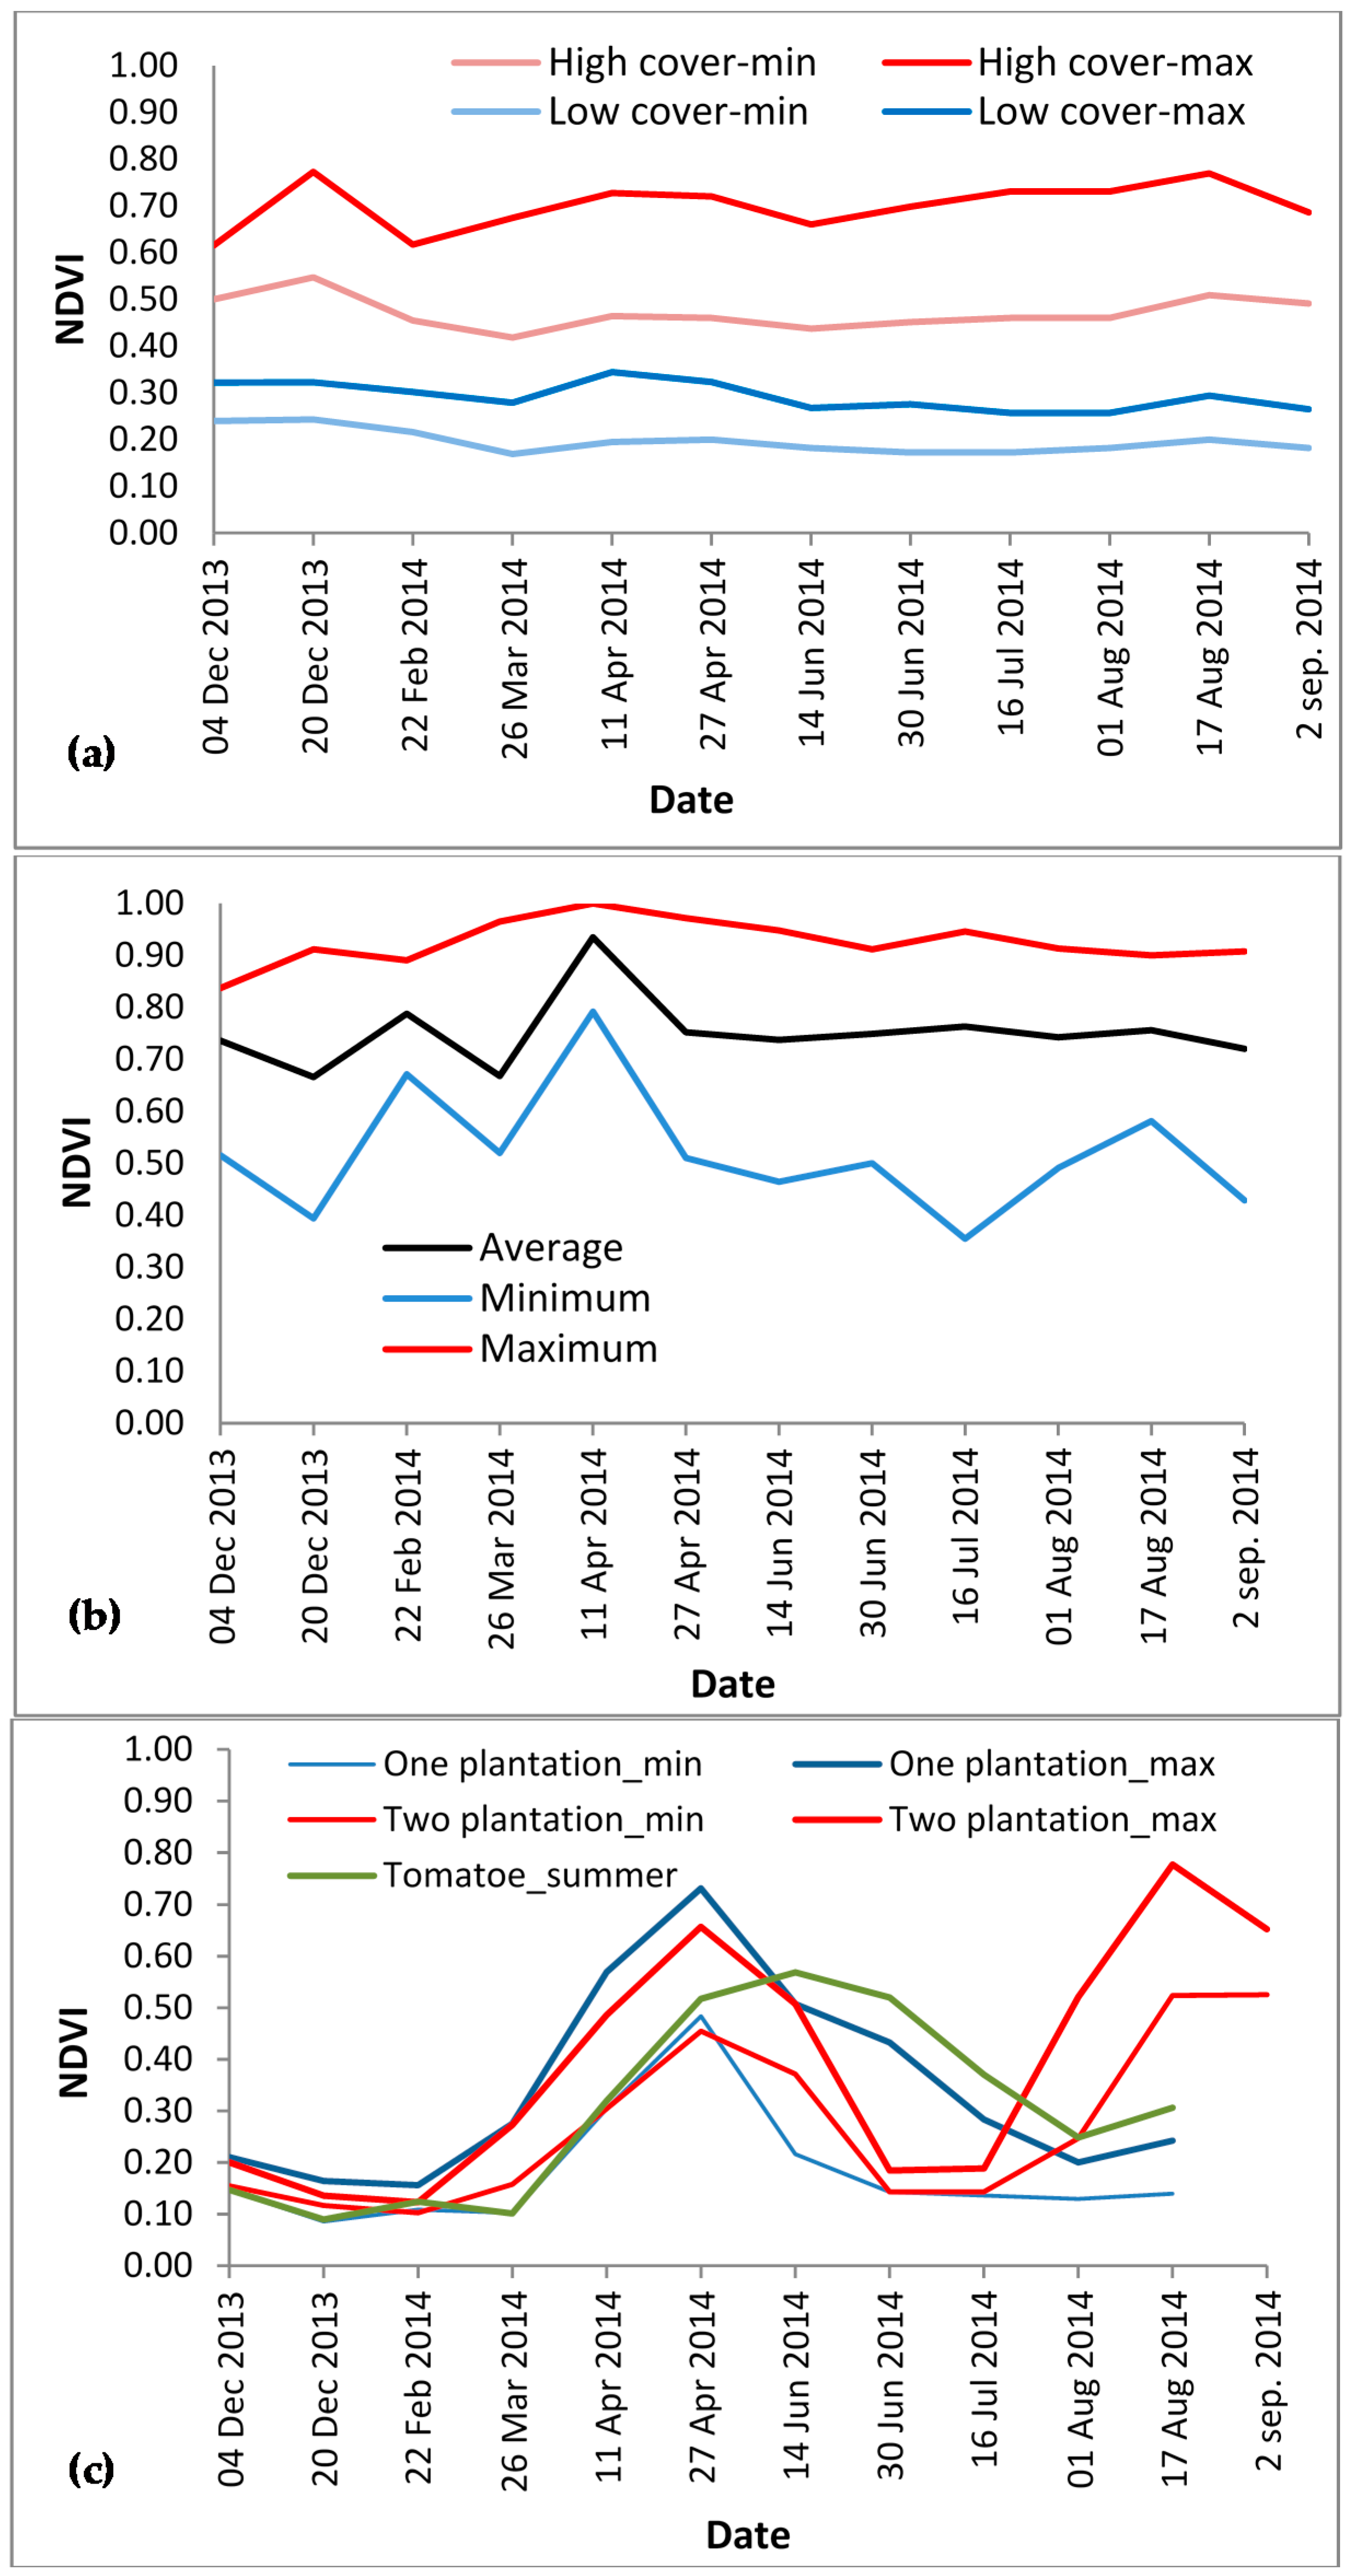
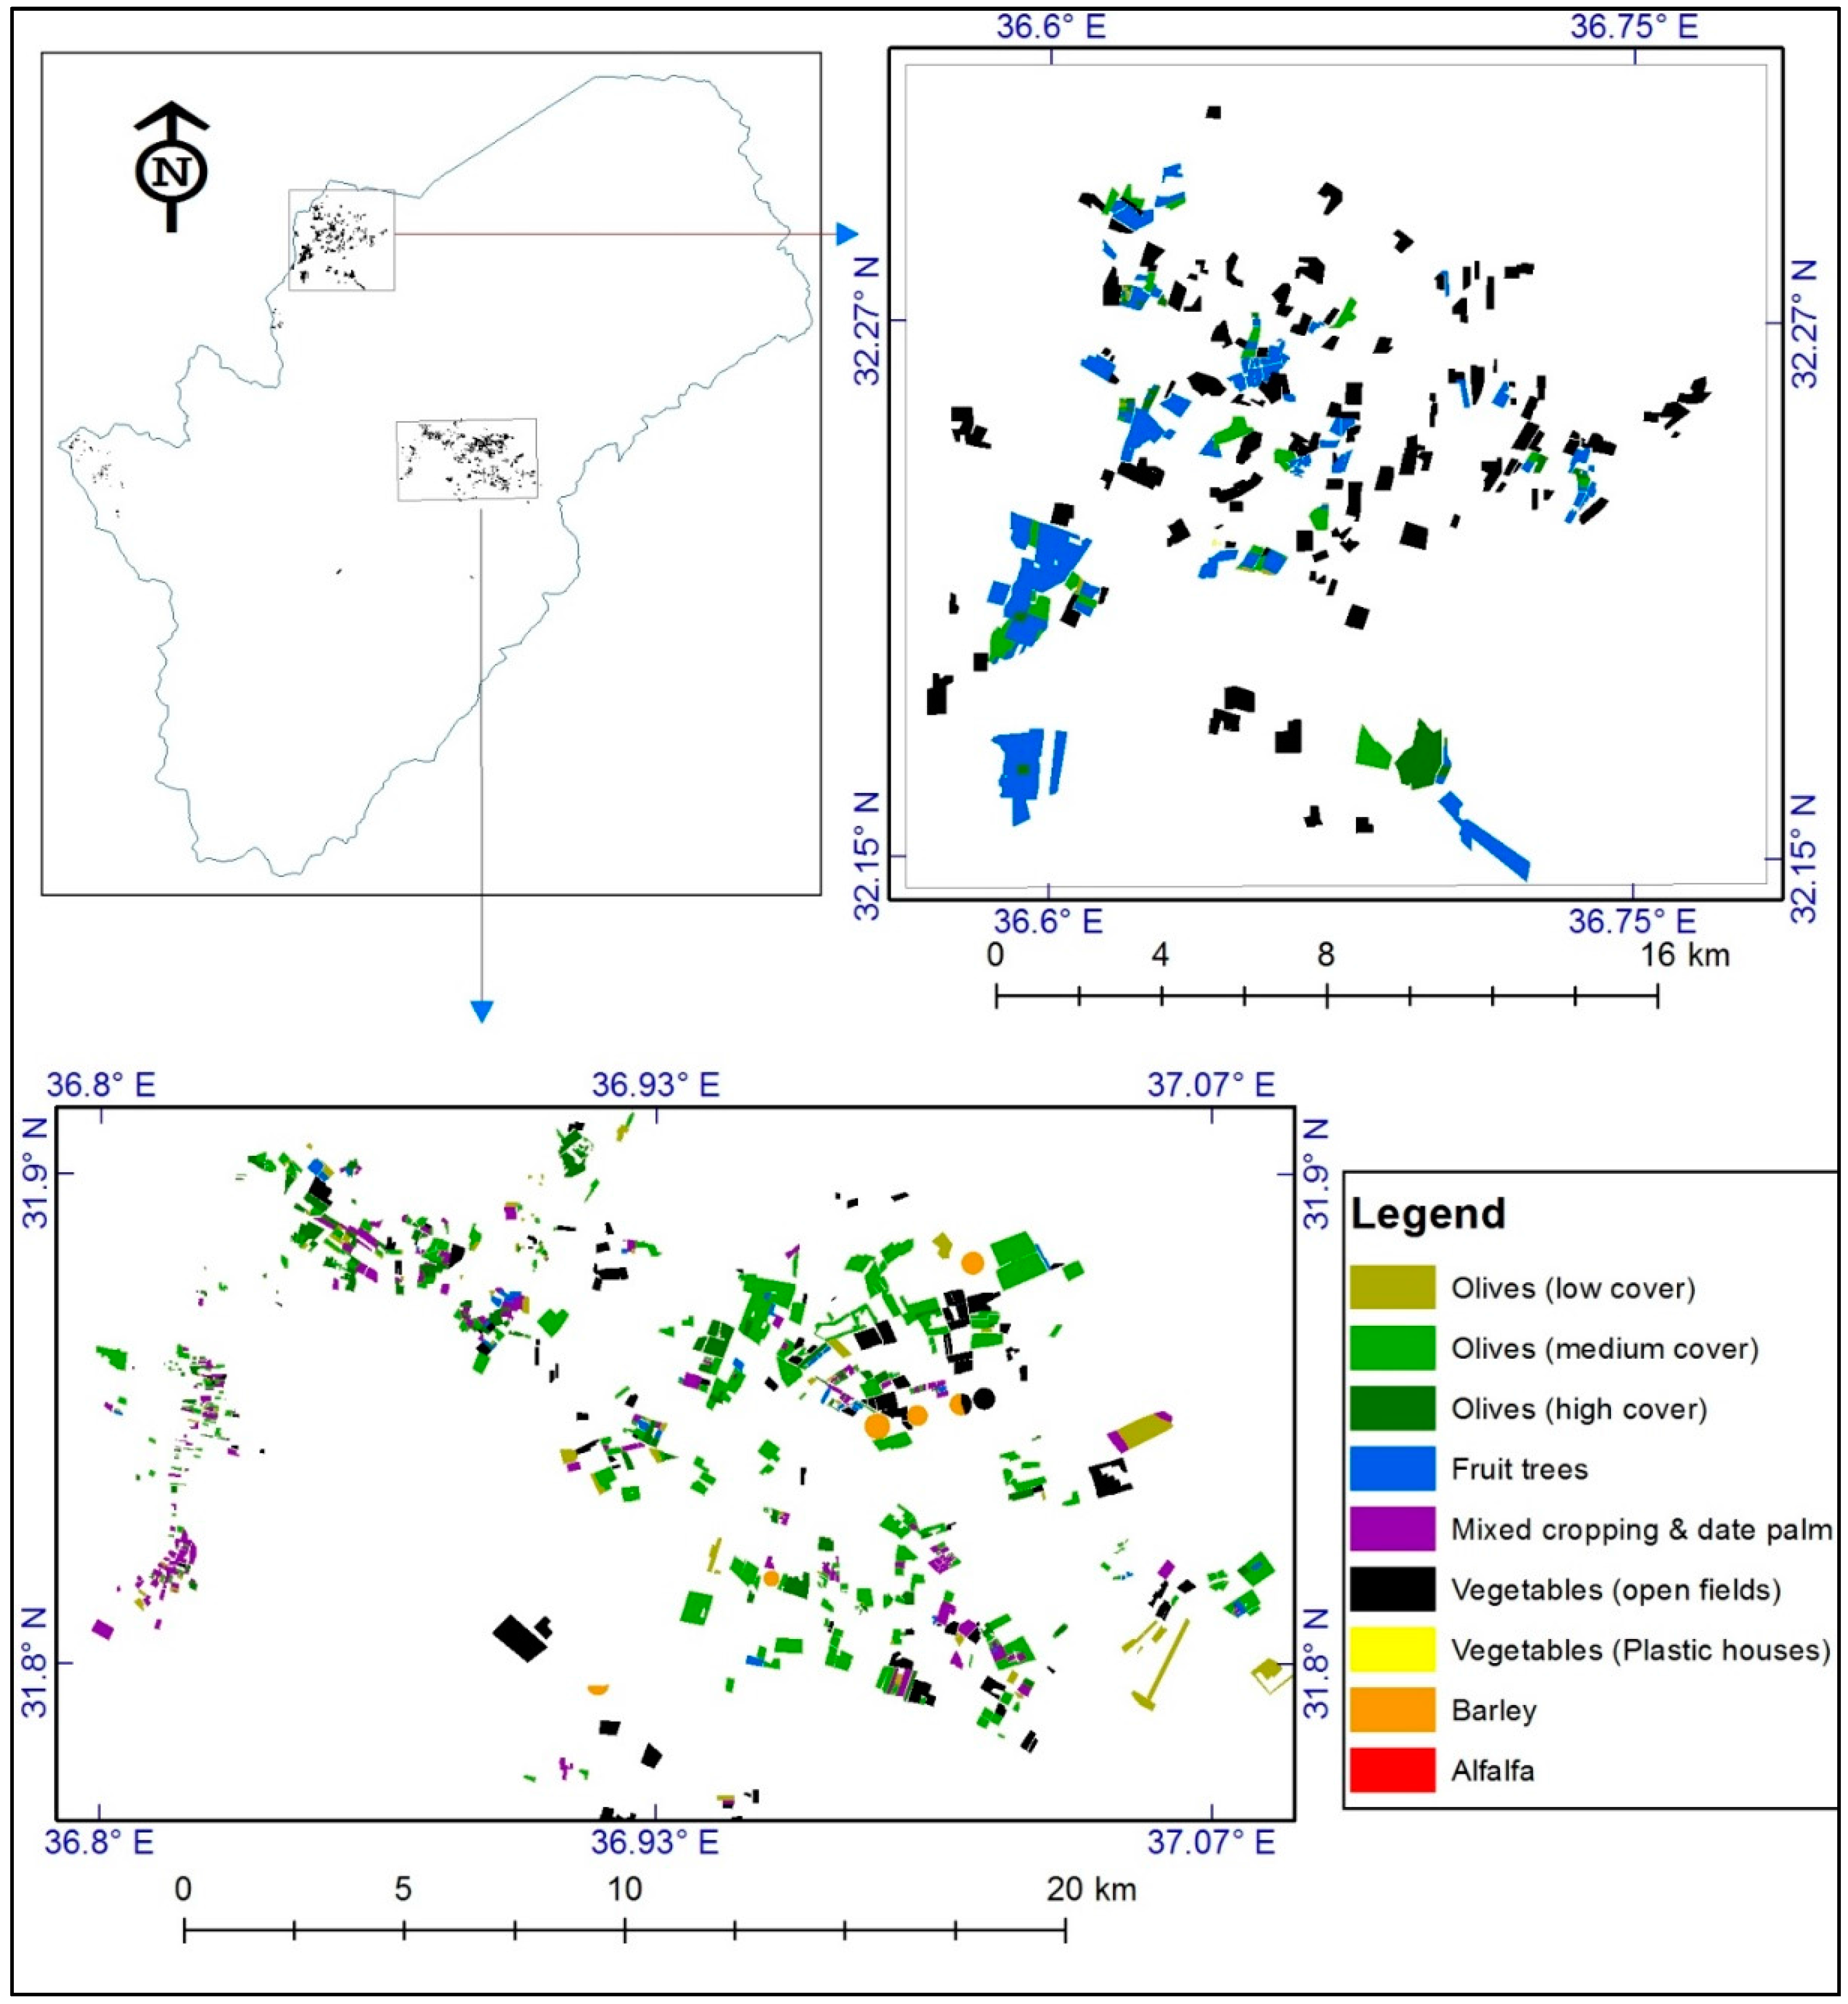
Observations collected during ground surveys were transferred into a GIS layer, representing points with different types of irrigated crops. The map was intersected with the layer of NDVI images to assign NDVI values for each crop type in the form of a profile that represented temporal changes in this index during the year. Examples of these profiles for Azraq are shown in 
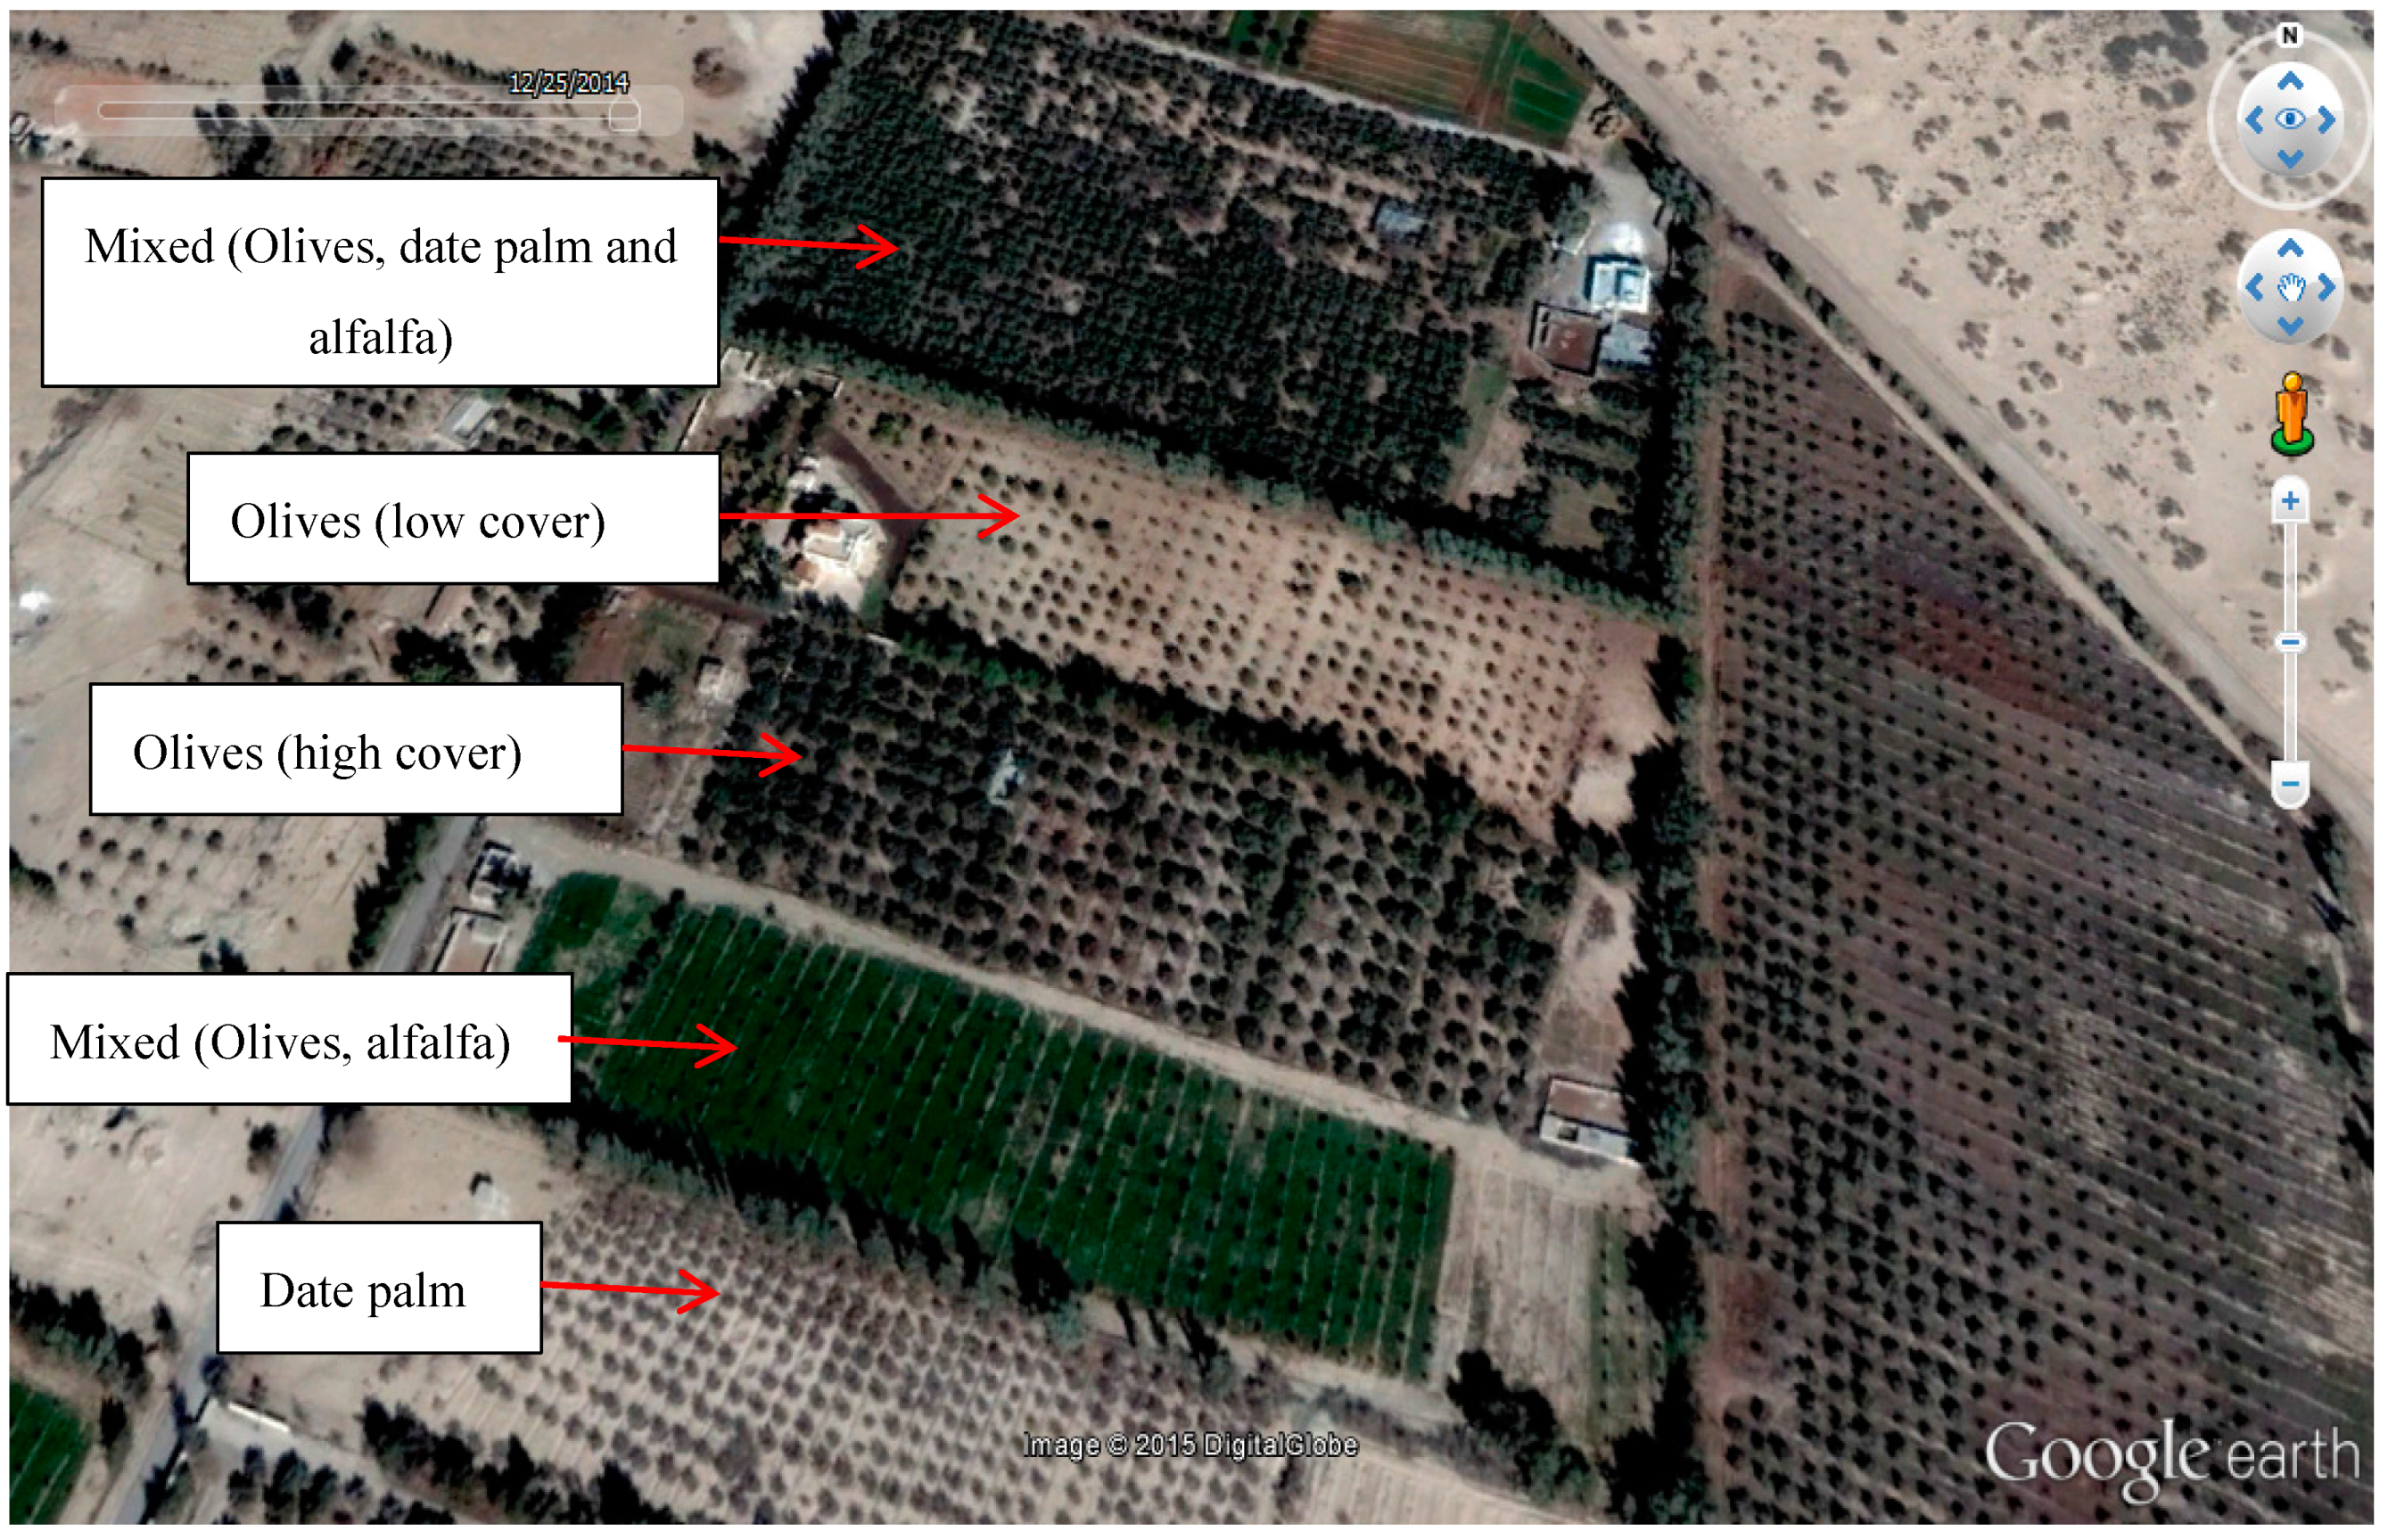
Figure 4. The data of NDVI profiles were exported to spreadsheets and NDVI values were plotted for growing seasons. Statistical functions were applied in the spreadsheets to identify ranges of NDVI and to aid in building a decision tree for creating crop maps. Analysis of NDVI profiles showed that separation of the irrigated crops was possible with the use of multi-temporal images. NDVI profiles showed that alfalfa was characterized by the highest NDVI that reached its maximum theoretical value (1.0), with fluctuations resulting from crop cutting. Olives, on the other, had stable NDVI profiles (with a nearly constant value that was slightly above 0.50 for old plantations). Younger olives (3–4 years) had a straight line NDVI that was in the range of 0.20 to 0.30. The profiles for vegetables varied according to crop type and growing season, with peak NDVI values occurring during the midseason for each vegetable crop.
Following the stage of NDVI extraction and analysis, decisions were developed to identify the NDVI ranges (bounds) for each crop and for each time of the season. These decisions were mainly developed for Azraq and Amman-Azraq basins, while for Yarmouk, the unsupervised classification method was used to separate rainfed from irrigated areas. The NDVI range for each vegetable crop was based on the mean and standard deviation for NDVI image, as profiles of NDVI showed normal distribution patterns during the growing seasons. For alfalfa and olives, the range was modified according to the degree of agreement between classified pixels and ground observations. The NDVI profiles were also used to identify the length of the growing season, which was crucial for calculating crop evapotranspiration. Based on ground observations and analysis of NDVI, a classification scheme (Table 3) was adopted for mapping the different irrigated crops. The scheme included the different classes and sub-categories that included all irrigated crops and growing seasons in the three basins.

3.3. Mapping Irrigated Fields

Parcels of irrigated fields were mapped using an on-screen digitizing process with high resolution images of RapidEye and images of GE as backgrounds for delineation. The GE images were very useful as they had very high spatial resolution and horizontal accuracy that could reach 1 m [42]. RapidEye images, on the other hand, provided recent data that covered irrigated lands in year 2014, while GE images were mainly used in separating tree crops from vegetables. Identification of crop type, on the other hand, was based on outputs from the unsupervised classification of the multi-temporal images of Landsat 8 OLI. For Azraq and Amman-Zarqa basins, crop identification was carried out by the application of models that included decisions based on NDVI ranges derived from the multi-temporal images. The decisions were based on conditional statements that identified the range of NDVI for each crop and for each date in the set of the multi-temporal images of OLI. The models were applied in a sequence that prioritized crops according to their proportions, as observed during ground surveys. Subsequently, the sequence of models started with olives, followed by vegetables, fruit trees and other crops.
In Yarmouk basin, initial results showed some mixing between rainfed and irrigated areas. Therefore, principal component analysis (PCA) was used to transfer NDVI images of Yarmouk into three principal components. Applying the PCA to NDVI images resulted in transferring these images into three principal components that accounted for all seasonal changes in NDVI, as indicated by previous research [43]. Results from the unsupervised classification of PCA showed six distinguished spectral classes. The PCA images were then incorporated into unsupervised classifications with the ISODATA algorithm to derive spectral classes of irrigated and rainfed areas in this basin. Visual inspection of the output image showed that irrigated areas were distributed among three out of the six classes. In order to increase accuracy of mapping, models of knowledge based classifiers were used to refine the map of irrigated crops by incorporating layers of digital elevation model (DEM), rainfall and images of minimum NDVI values in these models. The DEM was used to exclude areas with high altitudes, where Jordan’s forests were located. A rainfall map was used to exclude areas with high rainfall, as rainfed agriculture was dominant in these locations. The map of minimum NDVI separated irrigated areas from natural vegetation in the low rainfall zone. Accuracy assessment was made for the output maps using the confusion-matrix method [44], which compared remote sensing results with observations collected during ground surveys.

3.4. Assessment of Groundwater Abstraction Records

Assessment of groundwater abstraction for irrigation would require the use of ground measurements to compare amounts of abstraction with crop water consumption. Ground measurements of crop water requirements, however, are time consuming and become very expensive for large geographical areas. Therefore, crop water requirements can be calculated using crop maps and meteorological data. Remote sensing techniques can also provide spatial estimates of crop evapotranspiration (ETc), which is the main component of net crop water requirements (NCWR). This can be achieved by the surface energy balance models that utilize remote sensing data to derive the main factors controlling water evaporation from soil and plants and thus calculate ETc [45]. These models, however, require validation before being adopted for calculating ETc [46]. Therefore, crop maps were utilized in this study to calculate the crop ETc using the standard method of Food and Agricultural Organization [47]. The other component included in calculations of NCWR was the salt leaching requirement, which depended on water salinity and crop type. Rainfall in Yarmouk and Amman basin was also considered in these calculations. The FAO56, based on Penman-Monteith method, was used to calculate ETc as follows [47]:
ETc = ETo × Kc,
where ETc is the actual crop evapotranspiration (mm); Kc is the mean monthly crop coefficient; and ETo is the grass reference evapotranspiration. The NCWR, in million cubic meters (MCM), was calculated by multiplying the seasonal ET of the crop with its corresponding area, taking rainfall into consideration.
The FAO56 method calculates the theoretical crop water requirements and assumes standard conditions of crop spacing, ground cover and growing periods. These assumed conditions might not be valid in all fields in the three basins. Therefore, crop spacing and cover were considered in the calculations by adjusting Kc values based on ground cover fraction [48]. Ground cover was derived from the high resolution images of GE (Figure 3) and the data collected during ground surveys. The length of each growing stage was adjusted from NDVI profiles (Figure 4), which showed some differences between the values reported by the FAO56 method and the actual growing periods. Following this step, daily weather records of MWI were used to calculate ETo using an ETo calculator, developed by FAO [49]. The outputs of daily ETo were summed for each month to calculate monthly ETc. Values of Kc were adjusted using NDVI profiles and data collected during ground surveys. The adjustment was made according to ground cover and used a linear interpolation to derive monthly Kc. Irrigation efficiency was used to convert the NCWR to gross crop water requirements (GCWR). The average irrigation efficiency in the three basins was about 80% [50]. The calculated GCWR were compared with the records of groundwater abstraction for irrigation purposes to assess the compliance between the recorded abstraction in relation to crop water requirements and safe yields in the three basins. For vegetables cultivated in plastic houses and nurseries, the GCWR were given an average value of 800 m3 per year, based on the average for tomato [51,52] for two cultivations per year.

4. Results and Discussion

4.1. Ground Surveys

Observations from ground surveys showed that olives, fruit trees and vegetables were the main irrigated crops in the three basins. Irrigated vegetables included tomato as the main crop and other crops of melon, water melon, eggplant, zucchini, cauliflower and lettuce. Fruit trees included peaches, apricots, table grapes, pomegranate and date palm (in Azraq only). The size of some irrigated farms reached 400 ha (equivalent to 4000 dunums in the locally used unit), while the size of vegetable farms (open fields) was in the range of 20–30 ha and reached 70 ha in some areas, indicating considerable investment in irrigated agriculture. In the area of Mafraq in Amman-Zarqa basin, many of the drylands were turned into agricultural fields by clearing soil surface from basalt rocks. This practice, shown in Figure 5, had been conducted since the 1980s, when irrigation started in the drylands of Mafraq [53]. Ground observations also showed different planting and harvesting dates for vegetables, which were confirmed by the NDVI profiles (Figure 4).

4.2. Crop Maps and Irrigated Areas

4.2.1. Irrigation in Yarmouk

The crop map of Yarmouk showed that the total irrigated area was 5.9 thousand ha, distributed in different parts of this basin (Figure 6). The main irrigated crops were tree crops (olives and fruits) and vegetables. Analysis of the crop map (Table 4) showed that vegetables constituted about half of the irrigated area, while the other half included olives and fruit trees (48%), with a small proportion of forage crops and nurseries. Most irrigation was practiced in the drylands of Mafraq, followed by the north middle areas. In addition, irrigation was practiced in the western parts of Ramtha, where the total irrigated area in that part constituted 21% of irrigation taking place in the basin. Irrigation was limited in the southwestern parts, as the area was mountainous and lacked irrigation infrastructure (dams and groundwater wells). The absence of irrigation to the west and north of Irbid would be mainly attributed to the high rainfall that supported the rainfed agriculture, which included olives and field crops. Further, urbanization was encroaching into these areas and was competing with other land uses.
In terms of irrigated areas, this study provided detailed maps of irrigation in Yarmouk basin. Previous work [28,29] showed similar spatial distribution of irrigation in the middle and eastern parts of this basin without details on crop types. Therefore, this study contributed to the governmental efforts in managing water resources by providing more detailed maps for irrigation, particularly in the western parts of the basin. The best estimate of MWI for irrigated lands in the basin was 2.1 thousand ha, while initial results obtained from the digital classification of PCA images of NDVI showed that the irrigated area was more than 5.1 thousand ha [21,54]. The reason behind these counterintuitive findings could be the non-extensive ground survey carried out by MWI, which was limited by time and cost. Such results, therefore, encouraged MWI to take more actions toward the adoption of remote sensing technology for mapping irrigation in the basin and to audit data of groundwater abstraction.

4.2.2. Irrigation in Amman-Zarqa

The total irrigated area in Amman-Zarqa basin was 18.1 thousand ha. Vegetables constituted 43% of this area, while olives and fruit trees constituted more than half of the irrigated lands. Irrigation was practiced in two areas: Mafraq-Hallabat and on both sides of Zarqa River (Figure 7). This distribution could be attributed to the sources of irrigation water, which were groundwater in the Mafraq-Hallabat and the surface water of Zarqa River. The disposed treated wastewater was used for irrigating forage crops and tree plantations in nurseries, although some violations were observed on some farms on the sides of the river. Further analysis of the irrigation map showed that 77% of irrigation was taking place in Mafraq-Hallabat, indicating that groundwater was the main source for irrigating these drylands. The area to the north of KTD had limited irrigation, as the high rainfall encouraged rainfed agriculture in this mountainous area. In terms of irrigated areas in the basin, figures from this study were less than those reported by a previous study [26], which used unsupervised classification of a single image of Landsat ETM+ and reported a total irrigated area of 27 thousand ha. This could be attributed to the different crops cultivated during these periods and the time difference between this study and previous ones.

4.2.3. Irrigation in Azraq

Analysis of the irrigation map showed that the total irrigated area in Azraq basin was 7.8 thousand ha, mainly distributed in two strips in the basin, Azraq depression and northwest of Azraq (Figure 8). The reason behind this spatial distribution could be attributed to the characteristics of groundwater in these two parts, where the irrigated areas were located in the unconfined aquifer of quaternary basalt outcrop overlaying the aquifer A7/B2. The A7/B2 aquifer, which has two joined and fissured formations (Amman formation (B2) and the older Wadi Es-Sir formation (A7)), is characterized by high conductivity in the form of solution channels and karstic features and extends into the northern parts of Jordan [24,55]. The absence of irrigation in the southern parts of the basin would be attributed to the distribution of B4 (very low transmissivity aquifer) in these areas [24,55]. Analysis of the crop map showed that the main irrigated crops were olives (39%), followed by vegetables (32%) and fruit trees (17%), while other crops were alfalfa and mixed crops (Table 4). In terms of irrigated areas, figures from this study agreed with those obtained in previous work that used visual interpretation of satellite images [24]. On the other hand, an estimate that was based on administrative boundaries of the basin reported that the total irrigated area in Azraq would be in the range of 11.5 thousand ha [50]. These findings clearly indicated the improvement in mapping irrigated areas when multi-temporal remote sensing data were used.

4.3. Mapping Accuracy

Although remote sensing data could provide important maps for irrigated lands, their accuracy should be assessed before being used. Comparing field observations (310 points) with maps of irrigated crops showed a good agreement between irrigation maps and ground data, with an overall accuracy of 87% (Table 5). The minimum accuracy was observed for fruit trees, which were mixed, in terms of classification, with olives. Considering the calculations of NCWR from ETc (Table 6), this would mean that NCWR (Table 7) for fruit trees was nearly 10% more than olives. For other irrigated crops, the level of mapping accuracy was relatively high and would be acceptable for the purpose of mapping and for estimating agricultural water consumption in the three basins.

4.4. Assessment of Groundwater Abstraction Records

One important tool for water management would be the use of outputs from crop mapping for water accounting and auditing. This was possible by deploying crop maps and weather records to calculate evapotranspiration, which is considered as the main component of net crop water requirements (NCWR). Results showed relatively high ETc values for forage, olives and tree crops in the three basins, particularly Azraq (Table 6). For vegetable crops, the NCWR varied according to cultivation season, which was accurately detected by the NDVI profiles. Although not investigated in this study, these profiles could have higher contribution to NCWR by deriving Kc with reasonable accuracy [56].
Variations in the ETc level among the three basins could be attributed to several factors including climatic conditions, the length of growing seasons and management practices that included different tree spacing in the three basins. Considering ETc and the area of each irrigated crop, the NCWR was calculated in the three basins (Table 7). Results showed that olives and fruit trees were the main consumers of water in the three basins. The NCWR for vegetables was variable according to planting and harvesting dates (Table 6). These results emphasized that cropping patterns in the three basins should be revised and changed to sustain groundwater resources. Proposed actions could include the prohibition of irrigating olives and alfalfa with fresh water resources of the three basins and the gradual replacement of both crops with other crops that consume less water. In addition, cultivation of vegetables during the summer season should be discouraged as it would increase water consumption by 30% (as implied from the ETc calculations). Another aspect of water management could be the use of flexible water allocation and pricing according to crop type and cropping season. A previous study in Jordan highlands showed that there was a potential to decrease water consumption and to reallocate it in an optimal way that considered cropping pattern and income from the irrigated area [57].
Outputs from crop mapping and NCWR calculations were used to assess groundwater abstraction records obtained by the MWI. The assessment was made by comparing MWI records with the NCWR, calculated by the FAO56 method after modifying Kc and the length of the growing season. This water auditing task was achieved by considering NCWR, irrigation efficiency and water resources used in irrigation to calculate GCWR. Results are summarized in Table 8. For the three basins, the GCWR were higher than the safe yield of groundwater. In Jordan, the term of groundwater safe yield is based on water balance models calibrated with data from groundwater monitoring wells [58].
In terms of agricultural water use, irrigation consumed considerable amounts of water that exceeded the safe yields in the three basins. Considering all uses of water, the over abstraction of groundwater was in the range of 144% in Yarmouk to 367% in Azraq. These results were in line with findings from the study on a groundwater aquifer in the north of Jordan [58], which indicated a decline of groundwater levels by 40–60 m during 1986–2014. This decline resulted in changing water flow directions from Zarqa towards the east of Mafraq and to the north in Yarmouk basin, i.e., an opposite direction to its movement 40 years before [58]. Further, the results from Azraq indicated an over-abstraction of groundwater that could result in negative consequences resulting from groundwater depletion. The results for Azraq were also supported by findings from a previous study [59] that indicated a decline and lowering of the water table of the upper aquifer by 20 m during 1983–2003, the period during which irrigation had expanded in this basin.
Findings from crop mapping and GCWR calculations were alarming to MWI as they indicated that expansion in irrigation and adoption of inappropriate cropping patterns could result in future loss of groundwater resources. In addition, the shift between MWI records and remote sensing estimates indicated uncovered violations pertaining to groundwater use. Therefore, the work of crop mapping was extended to study the spatial distribution of irrigated areas in relation to water sources. The disagreement between water sources and irrigated areas was used to highlight areas with possible violations pertaining to water use or even possible water theft. The first map was prepared for the area around Ramtha City in Yarmouk basin (Red boxes in Figure 9).
Results from crop mapping showed that the irrigated area was nearly twice the area estimated by the field crew of MWI, while GCWR values were nearly three times higher than the recorded abstraction. Overlaying maps of irrigated crops and groundwater sources (Figure 9) showed that many irrigated fields were located in areas without groundwater wells or available surface water sources, indicating an illegal practice or violation to water use. In such cases, the concept of violation or illegal irrigation would be related to water pumping and conveyance over long distances rather than to cultivation of certain crops. Therefore, ground visits were carried out in fields that were located far away from water resources to uncover these violations, which were mainly in the form of water conveyance with pipelines for long distances or unlicensed groundwater wells [21]. In some areas, irrigation pipelines were illegally connected to the domestic water network and water was transferred to irrigate fields of vegetables. These findings urged MWI to carry out official campaigns to uncover these violations and to announce findings through mass media [54].
The outputs from this work were reflected in MWI decisions to improve water management and to activate water accounting and auditing. At present, amendments made to the “Water Law” state that satellite images and remote sensing techniques are officially adopted for auditing and estimating amounts of abstracted groundwater through crop mapping and estimation of water requirements for the different irrigated crops [60]. According to Article 4 of the new “Water Law”, satellite images are among the accredited means that can be used by MWI to map irrigated areas and crop type and to estimate amounts of groundwater abstraction for irrigated farms. Therefore, it is hoped that the robust methods used in this study would contribute to MWI efforts in improving water management by applying remote sensing methods to uncover violations related to irrigational water use and to audit annual records of water abstraction. Adoption of these methods towards water accounting systems, however, would require capacity building in the use and utilization of remote sensing data and geospatial techniques.

5. Conclusions

Remote sensing data and geospatial techniques act as good sources and tools for providing data needed for managing the scarce water resources of drylands. The study showed that the improved techniques for identifying irrigated areas and crops using remote sensing would include the use of multi-temporal imagery and ancillary data. The contribution of geospatial techniques was mainly in water auditing as they provided crucial information on irrigated areas, cropping patterns and estimates of groundwater abstraction in relation to available water resources and irrigated crops. In terms of water use, the study showed intensive irrigation in the drylands of Jordan, particularly in Amman-Zarqa basin. At present, irrigation is consuming invaluable water resources and resulting in groundwater depletion. It can be concluded that inappropriate cropping patterns may threat scarce water resources of drylands. However, information provided through remote sensing and geospatial techniques may provide solutions that optimize cropping pattern and water use. This fact was recognized by decision makers in Jordan and amendments were made to the “Water Law” so that water accounting and auditing by means of these contemporary techniques were approved. The remaining challenge, however, will be the capacity building needed for adopting and implementing these techniques. Once this target is achieved, then it is hoped that remote sensing and geospatial techniques are taken one step further towards the development of water accounting systems for the different basins in Jordan.

Acknowledgments

This publication and crop mapping work were supported by Ministry of Water and Irrigation (MWI), Jordan. The work was carried out through a project “Regional Coordination on Improved Water Resources Management and Capacity Building Project" funded by the Global Environment Facility (GEF), managed by the World Bank (Project ID P117170), and jointly implemented in Cooperation with NASA. The authors acknowledge the cooperation of MWI and its staff, particularly the Secretary General Eng. Basim Telfah and the Ministry Technical Assistant Eng. Ali Subh for their full support and cooperation. The authors appreciate the efforts and cooperation of Su’ad Nasser, Ali Hayjneh and Issa Al-Obra. The authors would like to thank partners from NASA, particularly Dr. Shahid Habib.

Author Contributions

Jawad Al-Bakri worked on the methodology for crop mapping and NCWR comparisons. All authors were involved in calculations and comparisons made in the manuscript. Jawad Al-Bakri led the manuscript writing with contribution from other authors, who were also involved in field data collection and image processing stage.

Conflicts of Interest

The authors declare no conflict of interest.

References

  1. Safriel, U.; Adeel, Z.; Niemeijer, D. Drylands Systems. In Ecosystems and Human Wellbeing: Current State and Trends; Hassan, R., Scholes, R., Ash, N., Eds.; Island Press: Washington, DC, USA, 2005; Volume 1, pp. 623–662. [Google Scholar]
  2. IUCN Global Drylands Initiative. Available online: http://www.iucn.org/drylands (accessed on 25 August 2015).
  3. Al-Bakri, J.T.; Salahat, M.; Suleiman, A.; Suifan, M.; Hamdan, M.R.; Khresat, S.; Kandakji, T. Impact of climate and land use changes on water and food security in Jordan: Implications for transcending “The Tragedy of the Commons”. Sustainability 2013, 5, 724–748. [Google Scholar] [CrossRef]
  4. MWI (Ministry of Water and Irrigation, Jordan). Water for Life: Jordan’s Water Strategy, 2008–2022; MWI: Amman, Jordan, 2009.
  5. Al-Bakri, J.T.; Duqqah, M.; Brewer, T. Application of remote sensing and GIS for modeling and assessment of land use/cover change in Amman/Jordan. J. Geogr. Inf. Syst. 2013, 5, 509–519. [Google Scholar] [CrossRef]
  6. Department of Statistics, Jordan. Available online: http://www.dos.gov.jo (accessed on 20 September 2015).
  7. UNHCR (The UN Refugee Agency). A Briefing Note on Syrian Refugees, 2013. Available online: http://www.unhcr.org/ (accessed on 20 September 2015).
  8. DoS (Department of Statistics, Jordan). Iraqis in Jordan: Their Number and Characteristics; DoS, Fafo and UNFPA: Amman, Jordan, 2007.
  9. Schacht, K.; Gönster, S.; Jüschke, E.; Chen, Y.; Tarchitzky, J.; Al-Bakri, J.; Al-Karablieh, E.; Marschner, B. Evaluation of soil sensitivity towards the irrigation with treated wastewater in the Jordan River region. Water 2011, 3, 1092–1111. [Google Scholar] [CrossRef]
  10. Ozdogan, M.; Yang, Y.; Allez, G.; Cervantes, C. Remote sensing of irrigated agriculture: Opportunities and challenges. Remote Sens. 2010, 2, 2274–2304. [Google Scholar] [CrossRef]
  11. Inglada, J.; Arias, M.; Tardy, B.; Hagolle, O.; Valero, S.; Morin, D.; Dedieu, G.; Sepulcre, G.; Bontemps, S.; Defourny, P.; Koetz, B. Assessment of an operational system for crop type map production using high temporal and spatial resolution satellite optical imagery. Remote Sens. 2015, 7, 12356–12379. [Google Scholar] [CrossRef]
  12. Bastiaanssen, W.G.; Karimi, P.; Rebelo, L.-M.; Duan, Z.; Senay, G.; Muthuwatte, L.; Smakhtin, V. Earth observation based assessment of the water production and water consumption of Nile Basin agro-ecosystems. Remote Sens. 2014, 6, 10306–10334. [Google Scholar] [CrossRef]
  13. Gowda, P.H.; Chávez, J.L.; Howell, T.A.; Marek, T.H.; New, L.L. Surface Energy balance based evapotranspiration mapping in the Texas High Plains. Sensors 2008, 8, 5186–5201. [Google Scholar] [CrossRef]
  14. Liou, Y.-A.; Kar, S.K. Evapotranspiration estimation with remote sensing and various surface energy balance algorithms—A Review. Energies 2014, 7, 2821–2849. [Google Scholar] [CrossRef]
  15. Godfrey, J.M.; Chalmers, K. Water Accounting: International Approaches to Policy and Decision-Making; Edward Elgar Publishing: Cheltenham, UK, 2012; p. 336. [Google Scholar]
  16. Dost, R.; Bastidas; Obando, E.B.; Bastiaanssen, W. Water Accounting through Remote Sensing; A Background Report on Water Accounting Plus (WA+) in the Awash River Basin; Land and Water Division, Food and Agriculture Organization of the United Nations (FAO): Rome, Italy, 2013; p. 56. [Google Scholar]
  17. Karimi, P.; Bastiaanssen, W.; Molden, D. Water Accounting Plus (WA+)—A water accounting procedure for complex river basins based on satellite measurements. Hydrol. Earth Syst. Sci. 2013, 17, 2459–2472. [Google Scholar] [CrossRef]
  18. Karimi, P.; Bastiaanssen, W.; Molden, D.; Cheema, M. Basin-wide water accounting using remote sensing data: The case of transboundary Indus Basin. Hydrol. Earth Syst. Sci. 2013, 17, 2473–2486. [Google Scholar] [CrossRef]
  19. Karimi, P.; Bastiaanssen, W.G.M.; Sood, A.; Hoogeveen, J.; Peiser, L.; Dost, R. Spatial evapotranspiration, rainfall and land use data in water accounting—Part 2: Reliability of water accounting results for policy decisions in the Awash basin. Hydrol. Earth Syst. Sci. Discuss. 2015, 19, 1125–1167. [Google Scholar]
  20. Al-Bakri, J.T. Crop Mapping and Validation of ALEXI-ET in Azraq and Mafraq Areas; A Report for Regional Coordination on Improved Water Resources Management and Capacity Building; Ministry of Water and Irrigation: Amman, Jordan, 2015; pp. 19–31.
  21. Al-Bakri, J.T. Crop Mapping for Azraq and Ramtha Areas; A Report for the Advanced on-job Training on the Use of Remote Sensing in Crop Mapping and Evapotranspiration; Ministry of Water and Irrigation: Amman, Jordan, 2014. [CrossRef]
  22. Vörösmarty, C.J. Global water assessment and potential contributions from Earth Systems Science. Aqua. Sci. 2002, 64, 328–351. [Google Scholar] [CrossRef]
  23. Bastiaanssen, W.G.M.; Molden, D.J.; Makin, I.W. Remote sensing for irrigated agriculture: Examples from research and possible applications. Agric. Water Manag. 2000, 46, 137–155. [Google Scholar] [CrossRef]
  24. GIZ (Gesellschaft für Internationale Zusammenarbeit). The Azraq Dilemma: Past, Present and Future Groundwater Management; German-Jordanian Programme “Management of Water Resources”, MWI (Ministry of Water and Irrigation, Jordan): Amman, Jordan, 2012; pp. 6–12.
  25. MWI (Ministry of Water and Irrigation, Jordan). Water Budget for Year 2013; Ministry of Water and Irrigation: Amman, Jordan, 2014; pp. 14–17.
  26. Al-Wer, I. Zarqa River Rehabilitation and Sustainable Management. Master’s Thesis, Department of Land and Water Resources Engineering, KTH Stockholm, Sweden, 2009. [Google Scholar]
  27. Abdulla, F.; Eshtawi, T.; Assaf, H. Assessment of the impact of potential climate Change on the water balance of semi-arid watershed. Water Resour. Manag. 2009, 23, 2051–2068. [Google Scholar]
  28. Al-Bakri, J.T.; Suleiman, A.; Abdulla, F.; Ayad, J. Potential impacts of climate change on the rainfed agriculture of a semi-arid basin in Jordan. Phys. Chem. Earth 2011, 35, 125–134. [Google Scholar] [CrossRef]
  29. Al-Bakri, J.T.; Brown, L.; Dedalof, Z.; Berg, A.; Nickling, W.; Khresat, S.; Salahat, M.; Saoub, H. Modelling desertification risk in the north-west of Jordan using geospatial and remote sensing techniques. Geomatics Nat. Hazards Risk 2014. [Google Scholar] [CrossRef]
  30. The Highland Water Forum: Dialogue for Sustainability. Available online: https://highlandwaterforum.wordpress.com/ (accessed on 17 October 2015).
  31. Jensen, J.R. Introductory Digital Image Processing: A Remote Sensing Perspective, 3rd ed.; Prentice Hall: Upper Saddle River, NJ, USA, 2006; pp. 337–406. [Google Scholar]
  32. El-Magd, I.A.; Tanton, T.W. Improvements in land use mapping for irrigated agriculture from satellite sensor data using a multi-stage maximum likelihood classification. Int. J. Remote Sens. 2003, 24, 4197–4206. [Google Scholar] [CrossRef]
  33. Simonneaux, V.; Duchemin, B.; Helson, D.; Raki, E.; Olioso, A.; Chehbouni, A. The use of high-resolution image time series for crop classification and evapotranspiration estimate over an irrigated area in central Morocco. Int. J. Remote Sens. 2008, 29, 95–116. [Google Scholar] [CrossRef] [Green Version]
  34. Mclver, D.K.; Friedl, M.A. Estimating pixel-scale land cover classification confidence using non-parametric machine learning methods. IEEE Trans. Geo-Sci. Remote Sens. 2001, 39, 1959–1968. [Google Scholar] [CrossRef]
  35. Mclver, D.K.; Friedl, M.A. Using prior probabilities in decision-tree remotely sensed data. Remote Sens. Environ. 2002, 81, 253–261. [Google Scholar] [CrossRef]
  36. Gumma, M.K.; Thenkabail, P.S.; Nelson, A. Mapping irrigated areas using MODIS 250 meter time-series data: A study on Krishna River Basin (India). Water 2011, 3, 113–131. [Google Scholar] [CrossRef]
  37. Gumma, M.K.; Thenkabail, P.S.; Hideto, F.; Nelson, A.; Dheeravath, V.; Busia, D.; Rala, A. Mapping irrigated areas of Ghana using fusion of 30 m and 250 m resolution remote-sensing data. Remote Sens. 2011, 3, 816–835. [Google Scholar] [CrossRef]
  38. Zhu, Z.; Woodcock, C.E. Object-based cloud and cloud shadow detection in Landsat imagery. Remote Sens. Environ. 2012, 118, 83–94. [Google Scholar] [CrossRef]
  39. Smith, M.; Milton, E. The use of Empirical Line Method to Calibrate Remotely Sensed Data to Reflectance. Int. J. Remote Sens. 1999, 20, 2653–2662. [Google Scholar] [CrossRef]
  40. Du, Y.; Teillet, P.; Cihlar, J. Radiometric Normalization of Multitemporal High-resolution Satellite Images with Quality Control of Land Cover Change Detection. Remote Sens. Environ. 2002, 82, 123–134. [Google Scholar] [CrossRef]
  41. Jensen, J.R. Introductory Digital Image Processing: A Remote Sensing Perspective, 3rd ed.; Prentice Hall: Upper Saddle River, NJ, USA, 2005; pp. 337–406. [Google Scholar]
  42. Pulighe, G.; Baiocchi, V.; Lupia, F. Horizontal accuracy assessment of very high resolution Google Earth images in the city of Rome, Italy. Int. J. Digital Earth. 2015. [Google Scholar] [CrossRef]
  43. Eastman, J.R.; Filk, M. Long sequence time series evaluation using standardized principal components. Photogramm. Eng. Remote Sens. 1993, 59, 991–996. [Google Scholar]
  44. Congalton, R.G. A review of assessing the accuracy of classifications of remotely sensed data. Remote Sens. Environ. 1991, 37, 35–46. [Google Scholar] [CrossRef]
  45. Bastiaanssen, W.; Menenti, M.; Feddes, R.; Holtslag, A. A remote sensing surface energy balance algorithm for land (SEBAL) 1. Formulation. J. Hydrol. 1998, 212, 198–212. [Google Scholar] [CrossRef]
  46. Bastiaanssen, W.; Pelgrum, H.; Wang, J.; Ma, Y.; Moreno, J.; Roerink, G.; van der Wal, T. A remote sensing surface energy balance algorithm for land (SEBAL) 2. Validation. J. Hydrol. 1998, 212, 213–229. [Google Scholar] [CrossRef]
  47. Allen, R.G.; Pereira, L.A.; Raes, D.; Smith, M. Crop Evapotranspiration; FAO Irrigation and Drainage Paper 56; Food and Agriculture Organization of the United Nations (FAO): Rome, Italy, 1998; p. 293. [Google Scholar]
  48. Allen, R.G.; Pereira, L.A. Estimating crop coefficients from fraction of ground cover and height. Irrig. Sci. 2009, 28, 17–34. [Google Scholar] [CrossRef]
  49. FAO (Food and Agriculture Organization of UN), Land and Water Division: ETo Calculator. Available online: http://www.fao.org/nr/water/eto.html (accessed on 22 October 2015).
  50. Abu-Awwad, A.; Blair, S. Economic Efficiency of Water Use by Irrigated Crops in Al’Azraq Area. Jordan J. Agric. Sci. 2013, 9, 525–543. [Google Scholar]
  51. Mazahrih, N.T. Evapotranspiration Measurements and Modeling for Bermuda Grass, Alfalfa, Cucumber, and Tomato Grown under Protected Cultivation in the Central Jordan Valley. Ph.D. Thesis, The University of Jordan, Amman, Jordan, 2011. [Google Scholar]
  52. Suwwan, M.; Judah, O. Influence of Plastic Mulching on Growth, yield and Soil Moisture Conservation in Plastic House Tomatoes. Dirasat 1985, 12, 21–32. [Google Scholar]
  53. Al-Bakri, J.T.; Taylor, J.C.; Brewer, T.R. Monitoring land use change in the Badia transition zone in Jordan using aerial photography and satellite imagery. Geogr. J. 2001, 167, 248–262. [Google Scholar]
  54. JTN (The Jordan Times). Satellite Remote Sensing Uncovers violations on Underground Water Resources. Available online: http://www.jordantimes.com/news/local/satellite-remote-sensing-uncovers-violations-underground-water-resources#sthash.f4mMEUaF.dpufhttp://www.jordantimes.com/news/local/satellite-remote-sensing-uncovers-violations-underground-water-resources (accessed on 25 October 2015).
  55. Hamdan, I. Hydrogeological and Hydrological Investigation for Azraq Basin—North East Jordan; Deutsche Gesellschaft für Internationale Zusammenarbeit (GIZ): Amman, Jordan, 2010. [Google Scholar]
  56. Campos, I.; Neale, C.M.U.; Calera, A.; Balbontín, C.; González-Piqueras, J. Assessing satellite-based basal crop coefficients for irrigated grapes (Vitis vinifera L.). Agricul. Water Manag. 2010, 98, 45–54. [Google Scholar] [CrossRef]
  57. Salman, A.Z.; Al-Karablieh, E. Measuring the willingness of farmers to pay for groundwater in the highland areas of Jordan. Agricul. Water Manag. 2004, 68, 61–76. [Google Scholar] [CrossRef]
  58. Margane, A.; Al-Qadi, M.; Al-Kurdi, O. Updating the Groundwater Contour Map of the A7/B2 Aquifer in North Jordan; Technical Cooperation Project ’Syrian Refugee Response’, Technical Report No. 1; Bundesanstalt für Geowissenschaften und Rohstoffe (BGR) and Ministry of Water and Irrigation, Jordan (MWI): Amman, Jordan; p. 129.
  59. El-Naqa, A.; Al-Momani, M.; Kilani, S.; Hammouri, N. Groundwater Deterioration of Shallow Groundwater Aquifers Due to Overexploitation in Northeast Jordan. Clean 2007, 35, 156–166. [Google Scholar] [CrossRef]
  60. Law Amending the Law of the Water Authority (In Arabic). Law number 22, 2014. Jordan Prime Ministry, Official Gazette: Amman, Jordan, 2014; pp. 3385–3390. [Google Scholar]
Figure 1. Location of the groundwater basins of Yarmouk, Amman-Zarqa and Azraq.
Water 08 00132 g001
Figure 2. Flowchart of the image processing steps followed to derive NDVI images.
Water 08 00132 g002
Figure 3. Use of high resolution images for digitizing parcels of irrigated lands and identifying ground cover for the different crops (Source: Google Earth).
Water 08 00132 g003
Figure 4. NDVI profiles of olives (a); Alfalfa (b) and vegetable crops (c) in Azraq area.
Water 08 00132 g004
Figure 5. Examples on irrigated crops and irrigation practices in the three basins including fields of tomatoe under drip irrigation (a) and alfalfa under center pivot irrigation (b); watermelon at harvest stage (c); fields of cauliflower cultivated during March–July (d); an irrigated farm of table grapes (e) and a piece of land in Mafraq (inside Amman-Zarqa basin) with the soil surface partially cleared from basalt rocks to cultivate tomatoes (f).
Water 08 00132 g005
Figure 6. Distribution of irrigated crops in Yarmouk basin, as derived from remote sensing data.
Water 08 00132 g006
Figure 7. Map of irrigation in the Amman-Zarqa basin as derived from remote sensing data.
Water 08 00132 g007
Figure 8. Map of irrigation in Azraq basin as derived from remote sensing data.
Water 08 00132 g008
Figure 9. Map of irrigated areas and distribution water sources around Ramtha City.
Water 08 00132 g009
Table 1. Summary of water resources in the study areas and their use in year 2014 (Source: MWI report of water budget [25]).
BasinGroundwater Safe Yield (MCM)Number of Agricultural WellsGroundwater Use (MCM)Surface Water Used in Irrigation (MCM)
AgriculturalNon-Agricultural
Yarmouk4012936.49.43.8
Amman-Zarqa8859063.992.415
Azraq2448837.621.0-
Table 2. Specification of Landsat OLI and RapidEye images used in crop mapping for the three basins.
Satellite DataPath/RowBand (Wavelength in µm)UseProcessing
Landsat 8 OLI174/37 for Yarmouk, 174/37 and 174/38 for Amman-Zarqa, and 173/38 for Azraq.B1 (0.43–0.45), B2 (0.45–0.51), B3 (0.53 –0.59), B4 (0.64–0.67), B5 (0.85–0.88), B6 (1.57–1.65), B7 (2.11–2.29).Crop type identification1. Atmospheric correction
2. Vegetation index
RapidEyeMosaic datasets covering the three basins.B1 (0.44–0.51), B2 (0.52–0.59), B3 (0.63 –0.68), B4 (0.69–0.73), B5 (0.76–0.85).Delineation of fields1. Geometric correction.
2. Visual interpretation
Table 3. Classification scheme of irrigated crops in Azraq and Mafraq.
Crop CategorySub-Categories and Description
OlivesFarms of irrigated olive trees with different ground cover, depending on age and spacing. The class included three levels of cover that were grouped in the final map: low (<40%); medium (40%–60%); and high (>60%).
Fruit treesFarms of deciduous orchards of peaches, apricots, stone fruits and table grapes grown on trellis. The sub-category of this class includes citrus in the northwest of Yarmouk.
Alfalfa and forage cropsOpen spaces and farms cultivated with alfalfa under center pivot and solid sets of sprinkler irrigation systems in Azraq and fields of alfalfa and forage crops in the two other basins. The class includes barley fields cultivated under sprinkler irrigation.
Mixed croppingFarms with two or more crop types, found mainly in Azraq. The fields include combinations of date palm, olives and alfalfa in the small landholdings near urban areas. The class is characterized by 100% ground cover for farms that included alfalfa in combination with olives, date palm and fruit trees.
Vegetables (Open fields)Vegetables grown during February-June, March-July, April-August, June-September, July-October and September-December. The main irrigated crop is tomato. Other irrigated crops are melon, water melon, eggplant, zucchini, cauliflower, pepper and lettuce.
Vegetables and nursery plantations (Plastic houses)Vegetables grown in plastic houses in the area of Mafraq and near Muwaqar in the middle west of the basin. The main crops are tomato and watermelon in Mafraq, and tomato and other vegetables in Muwaqar. The other sub-category of this class includes nurseries the lower part of Zarqa River between the WWTP and KTD and in the area of Baqa’a where some of the plastic houses are used as nurseries.
Table 4. Analysis of irrigated areas in the three basins, as mapped from remote sensing data for the period October 2013–September 2014.
ClassYarmoukAmman-ZarqaAzraq
Area (ha)%Area (ha)%Area (ha)%
Olives201834.1498627.5305039.0
Fruit trees83714.1411822.7128616.5
Alfalfa and forage crops1873.26383.55877.5
Mixed cropping--4392.44255.4
Vegetables (Open fields)276346.7773742.7246531.6
Vegetables and nursery plantations (Plastic houses)1151.92101.2--
Total5920 18,128 7811
Table 5. Analysis of irrigated areas in the three basins, as mapped from remote sensing data for the period October 2013–September 2014.
Classified Image DataReference Data
ClassOlivesAlfalfa & ForageFruit TreesVegetablesBarleyMixedTotalsMapping Accuracy (%)
Olives89 62--9792
Alfalfa & Forage232----3494
Fruit Trees24-44---6865
Vegetables-1-75-37995
Barley- --911090
Mixed-2-- 202291
Totals11535507792431086.8
Table 6. Monthly evapotranspiration for the main irrigated crops in Azraq area.
Month *ETo (mm)Crop Evapotranspiration (ETc) in mm
OlivesFruit TreesMixedAlfalfaVegetables
October10467678097----77
November6239254555-----
December3610--1541-----
January4515--1043-----
February6522--287526----
March102624972887241---
April15810211012214715811063--
May176102116129157101176123--
June2031191831581904111720381-
July242149218188226--4813916297
August237130190184221----47213158
September15696109121145------130140
Total1586915106711511484397493576586472
* Starting from November 2013 to September 2014, corresponding to one year of water budget at MWI.
Table 7. Summary of irrigated crops and their net annual water consumption.
Class YarmoukAmman-ZarqaAzraq
ETc * (mm)NCWR (MCM)ETc * (mm)NCWR (MCM)ETc * (mm)NCWR (MCM)
Olives70014.172636.288727.0
Fruit trees7146.076531.57629.8
Alfalfa and forage crops12132.312067.713207.8
Mixed cropping--8883.911484.9
Vegetables (Open fields)53814.544134.149412.2
Vegetables and nursery plantations (Plastic houses)8000.98001.7---
Total 37.8 115.1 61.7
* Weighted average for all crop sub-categories.
Table 8. Groundwater abstraction records compared with estimates from remote sensing.
BasinSafe Yield (MCM)Groundwater Abstraction for IrrigationAgricultural Abstraction/Safe Yield (%)Abstraction/Safe Yield * (%)
MWI RecordsRemote Sensing
Yarmouk4036.448120144
Amman-Zarqa8863.9104118224
Azraq2437.667279367
* Including non-agricultural water uses (Table 1) and calculated as abstraction/safe yield.

