An Optofluidic Lens Array Microchip for High Resolution Stereo Microscopy

Abstract
:
1. Introduction
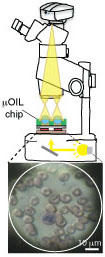
2. The μOIL Chip
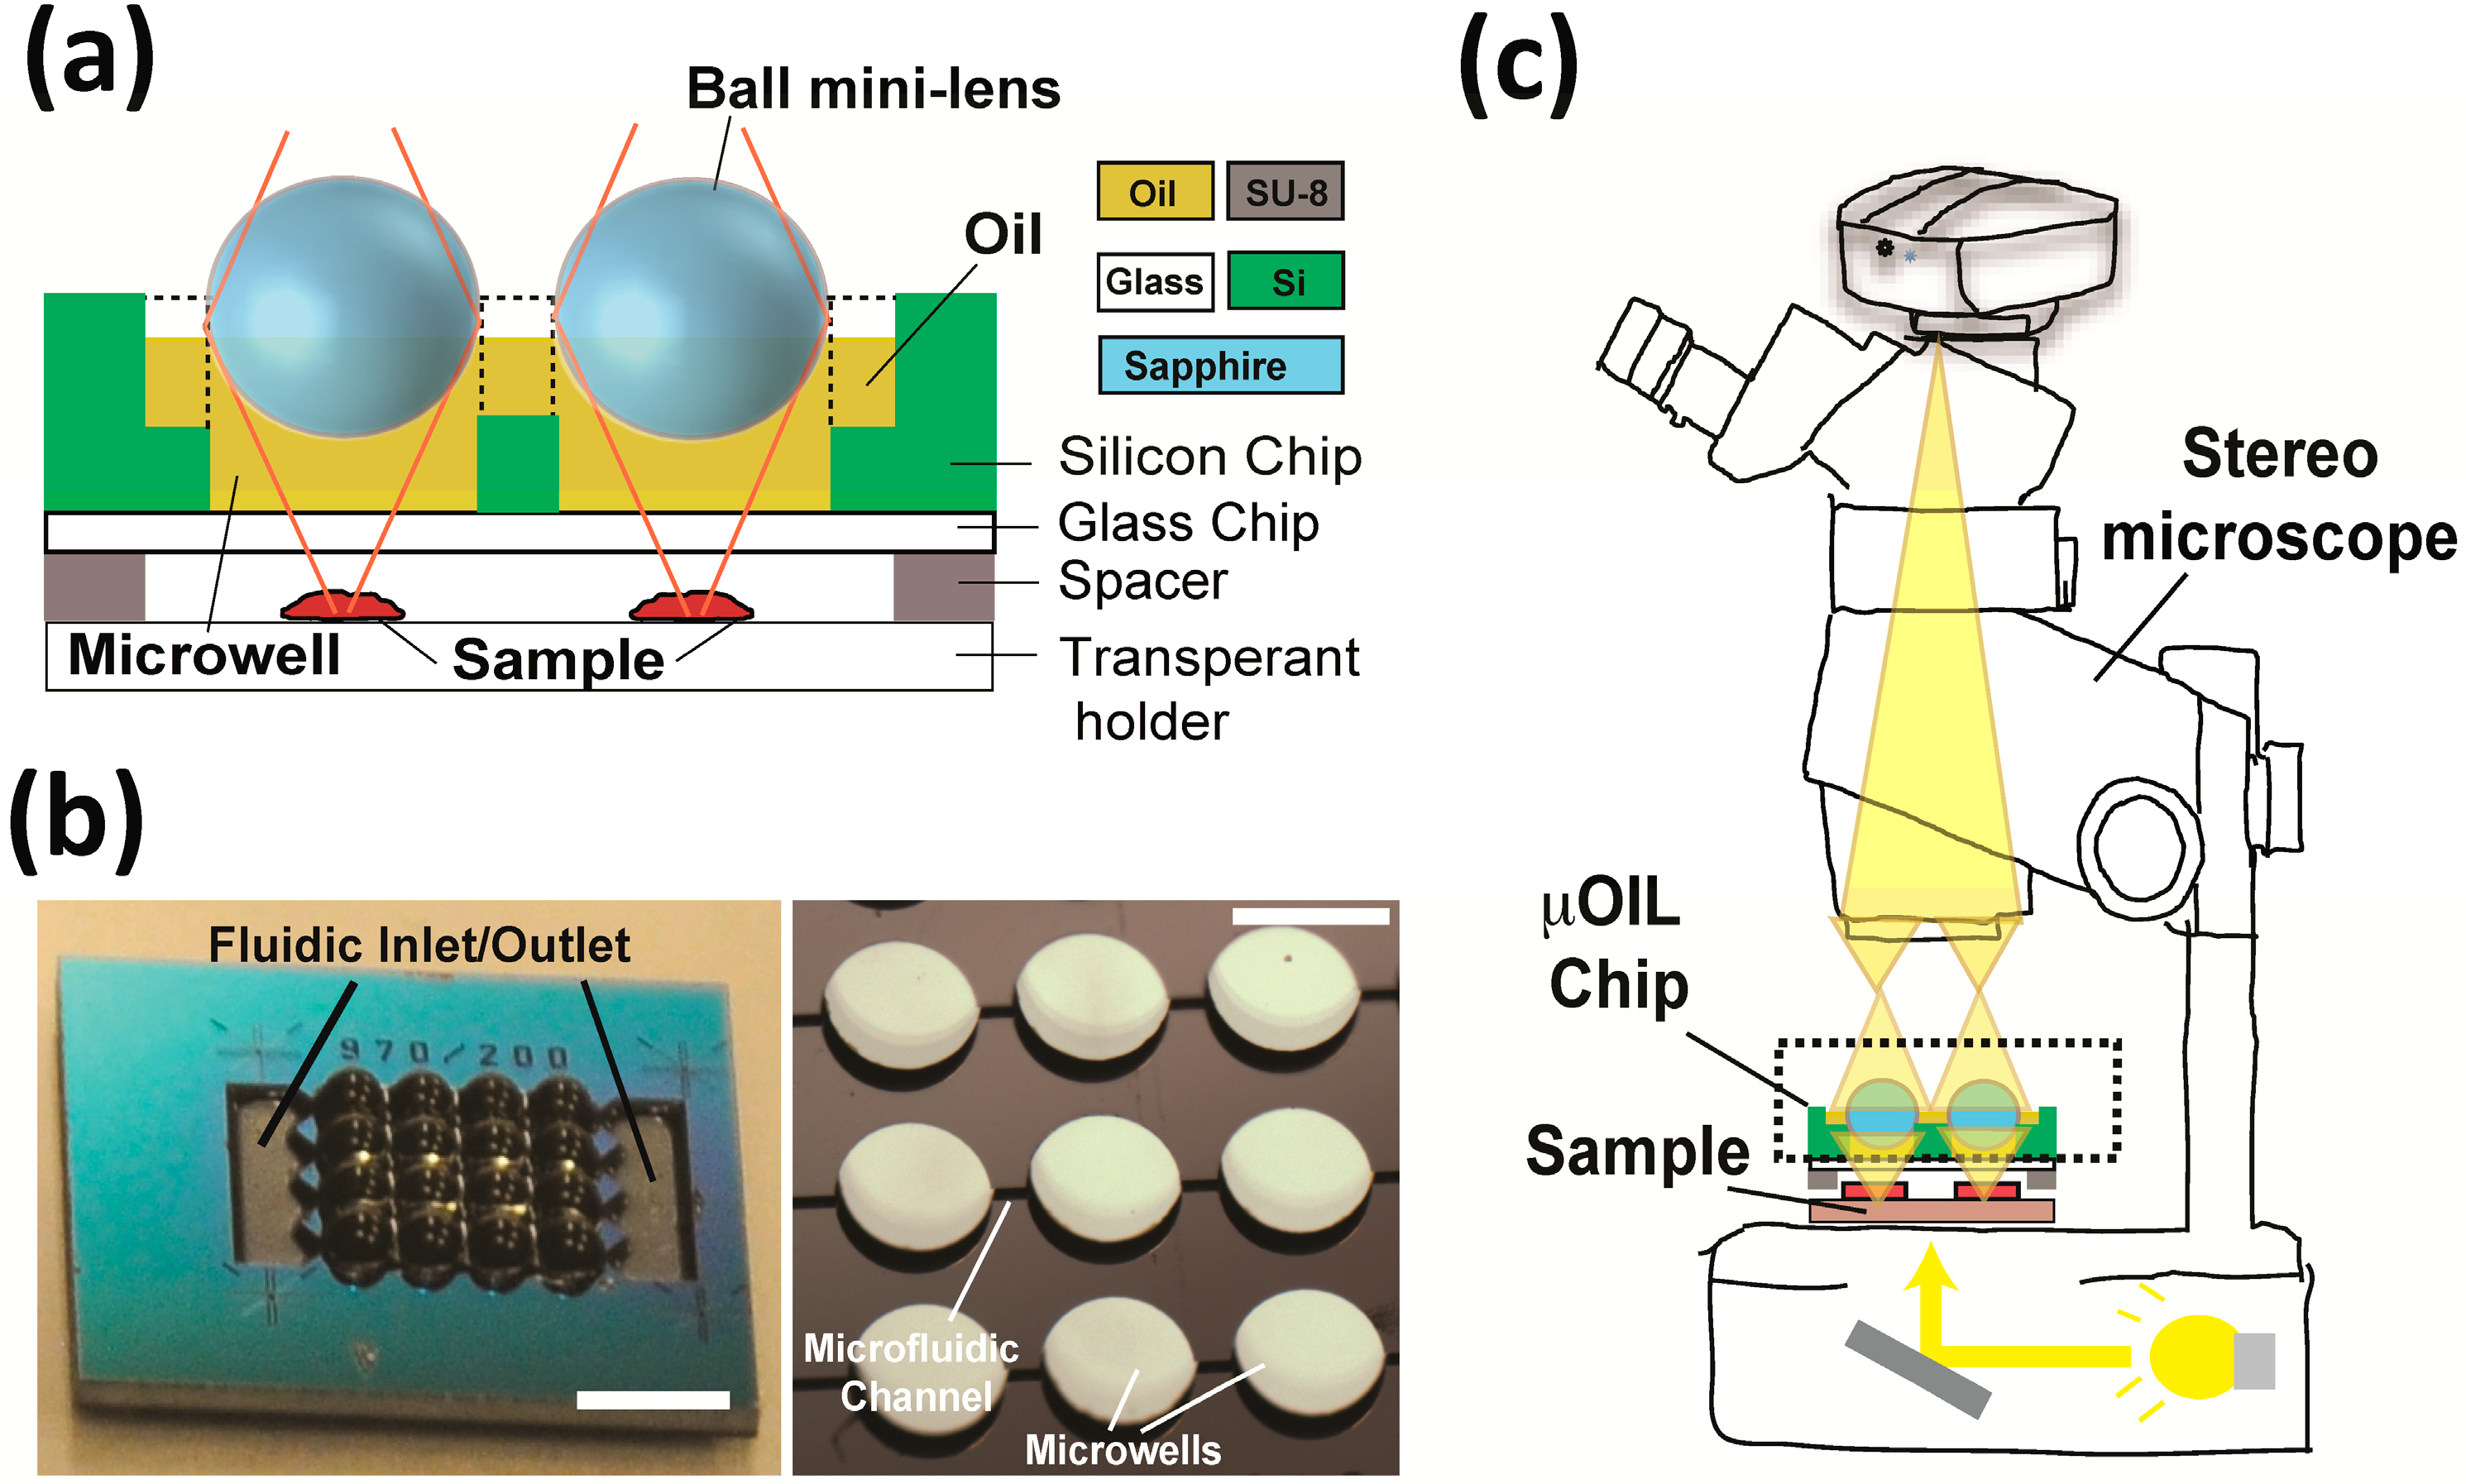
2.1. Architecture of the μOIL Chip

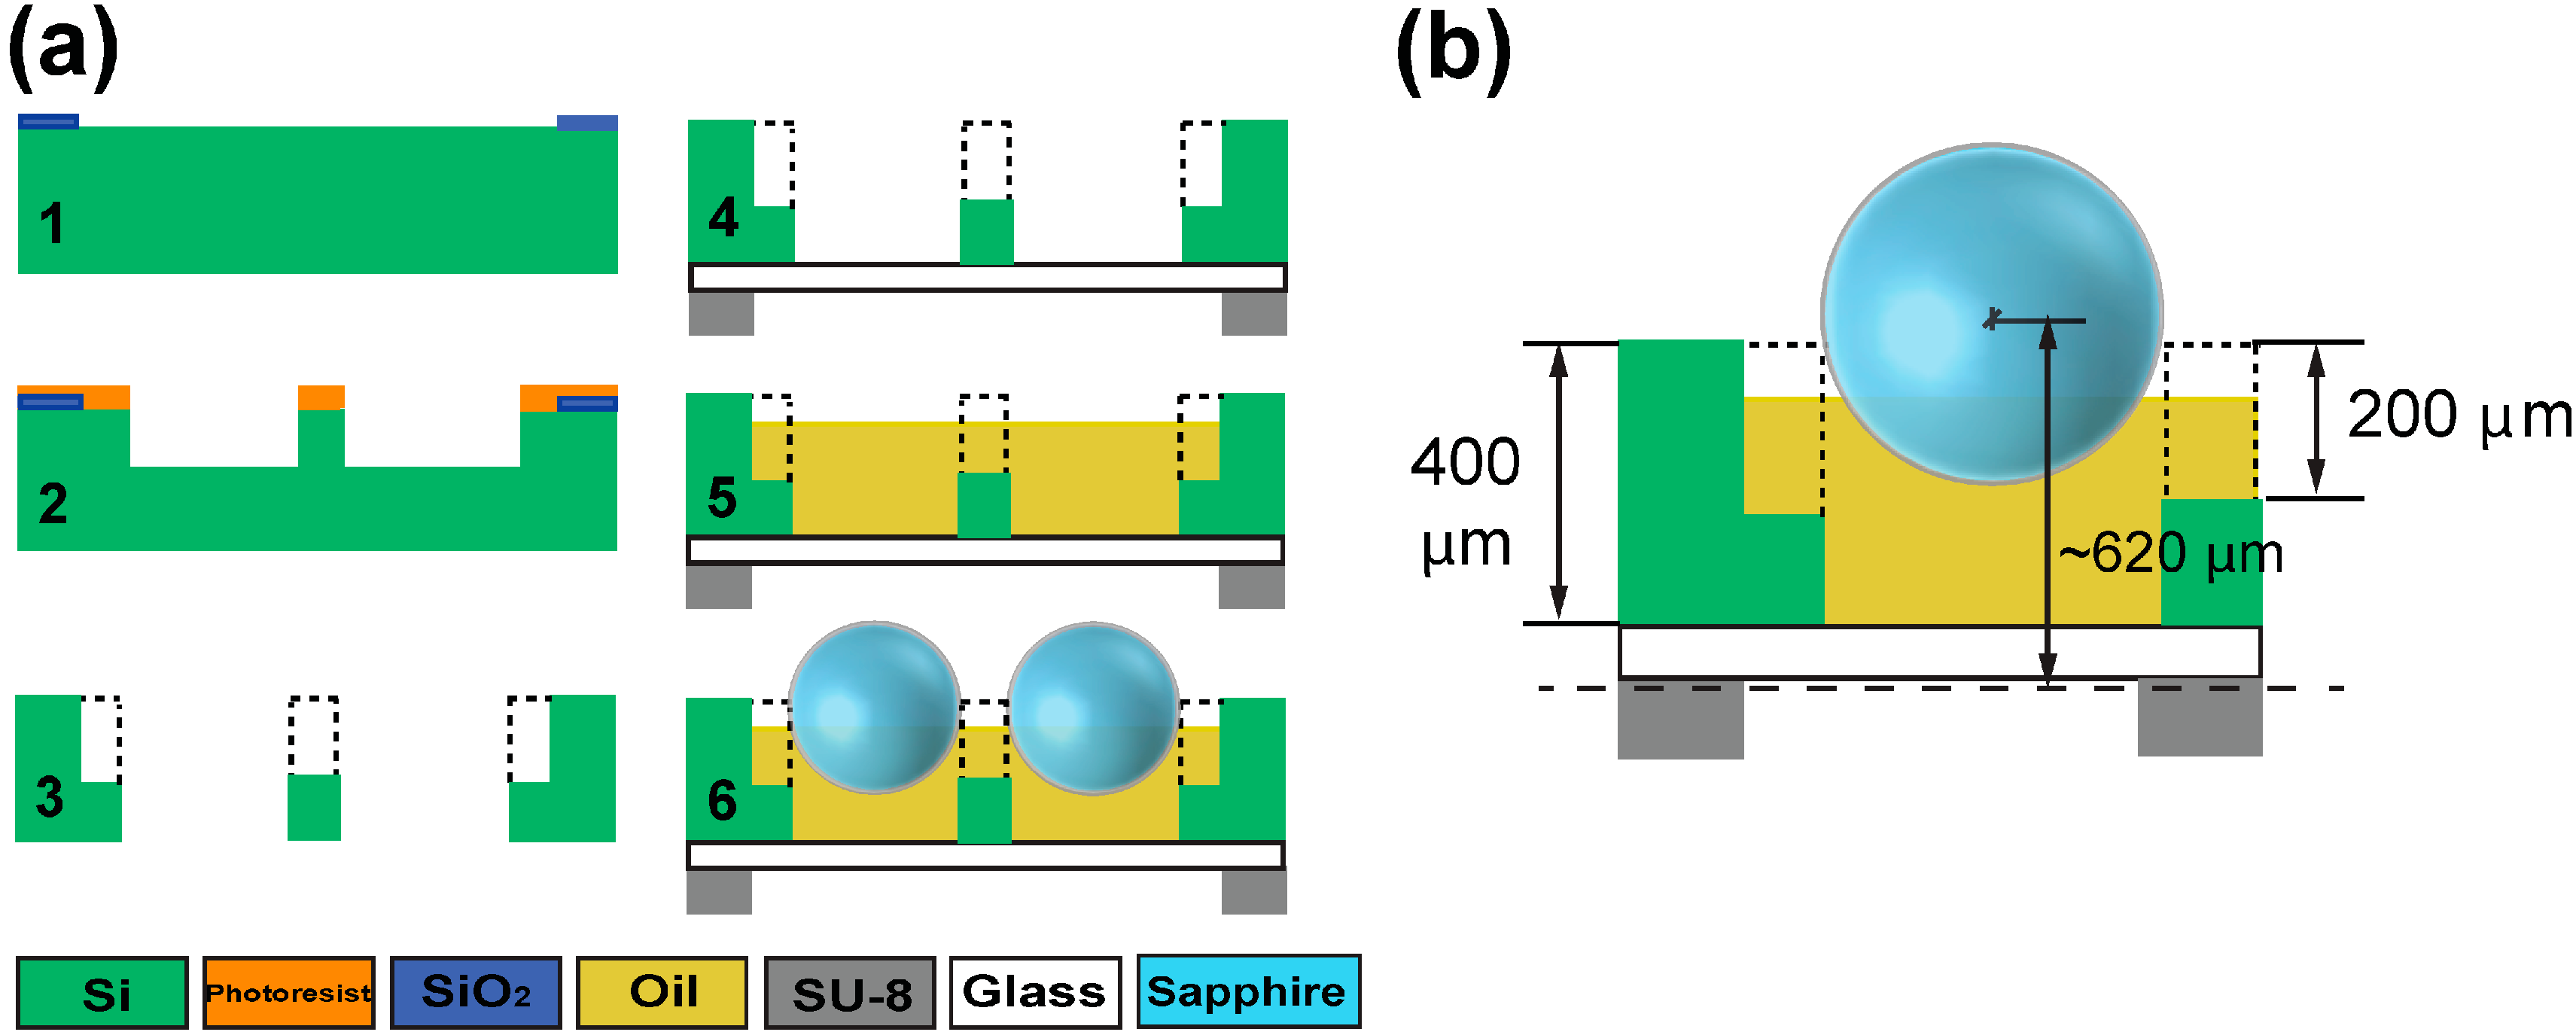
2.2. Microfabrication
3. Results and Discussion
3.1. The μOIL Module
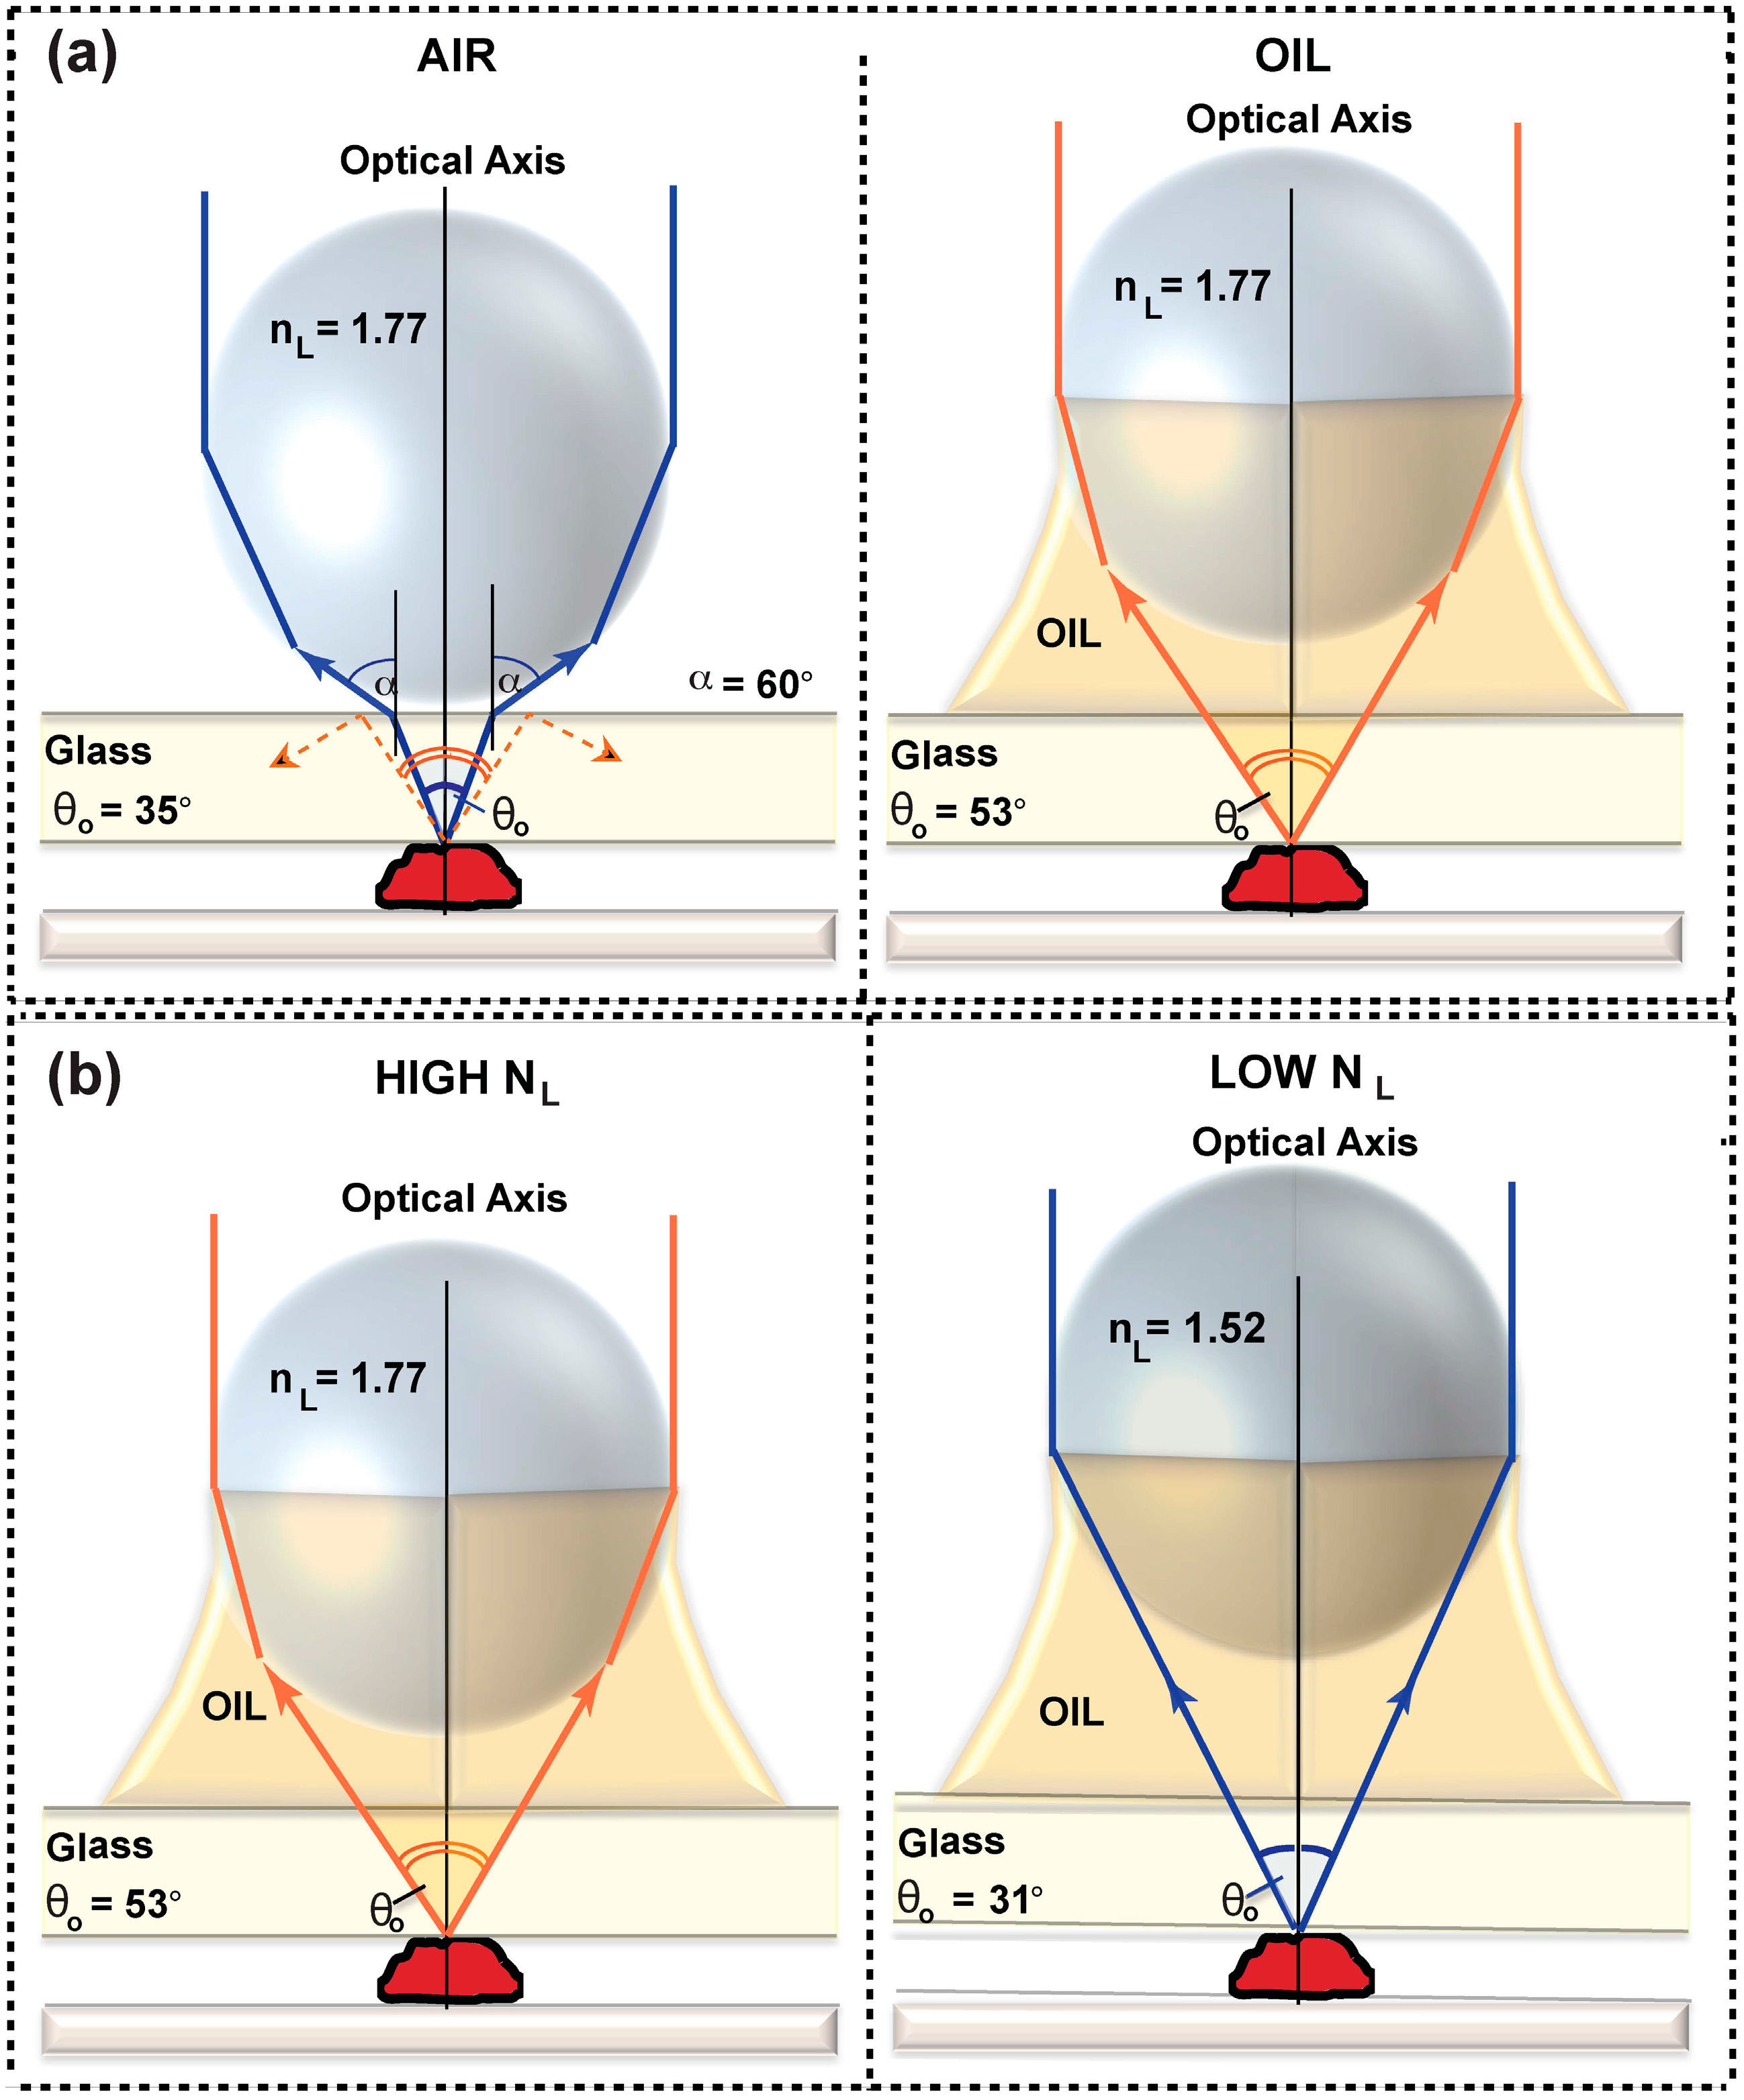
3.1.1. Material Considerations


| Parameter | Value |
|---|---|
| Ball mini-lens Diameter (D) | D = 1 mm |
| Ball mini-lens Refractive index (nL) | nL = 1.77 (sapphire) |
| Back Focal Length (BFL) | 124 μm (see supplementary materials) |
| Numerical Aperture (NA) | 1.2 (from Equation (2)) |
| Lens power (φ) | 1.6 mm−1 (from Equation (3)) |
| Magnification | ~130× (see Figure 5) |
| Resolution (center) | 0.7 μm (see Figure 7) |
| Depth of Field (DOF) | 0.38 μm (from λ/NA2) [13,19] |
| Field of View (FOV) | 60–140 μm/lens (see Figure 8) |
| F-number | 0.62 (from EFL */D) |
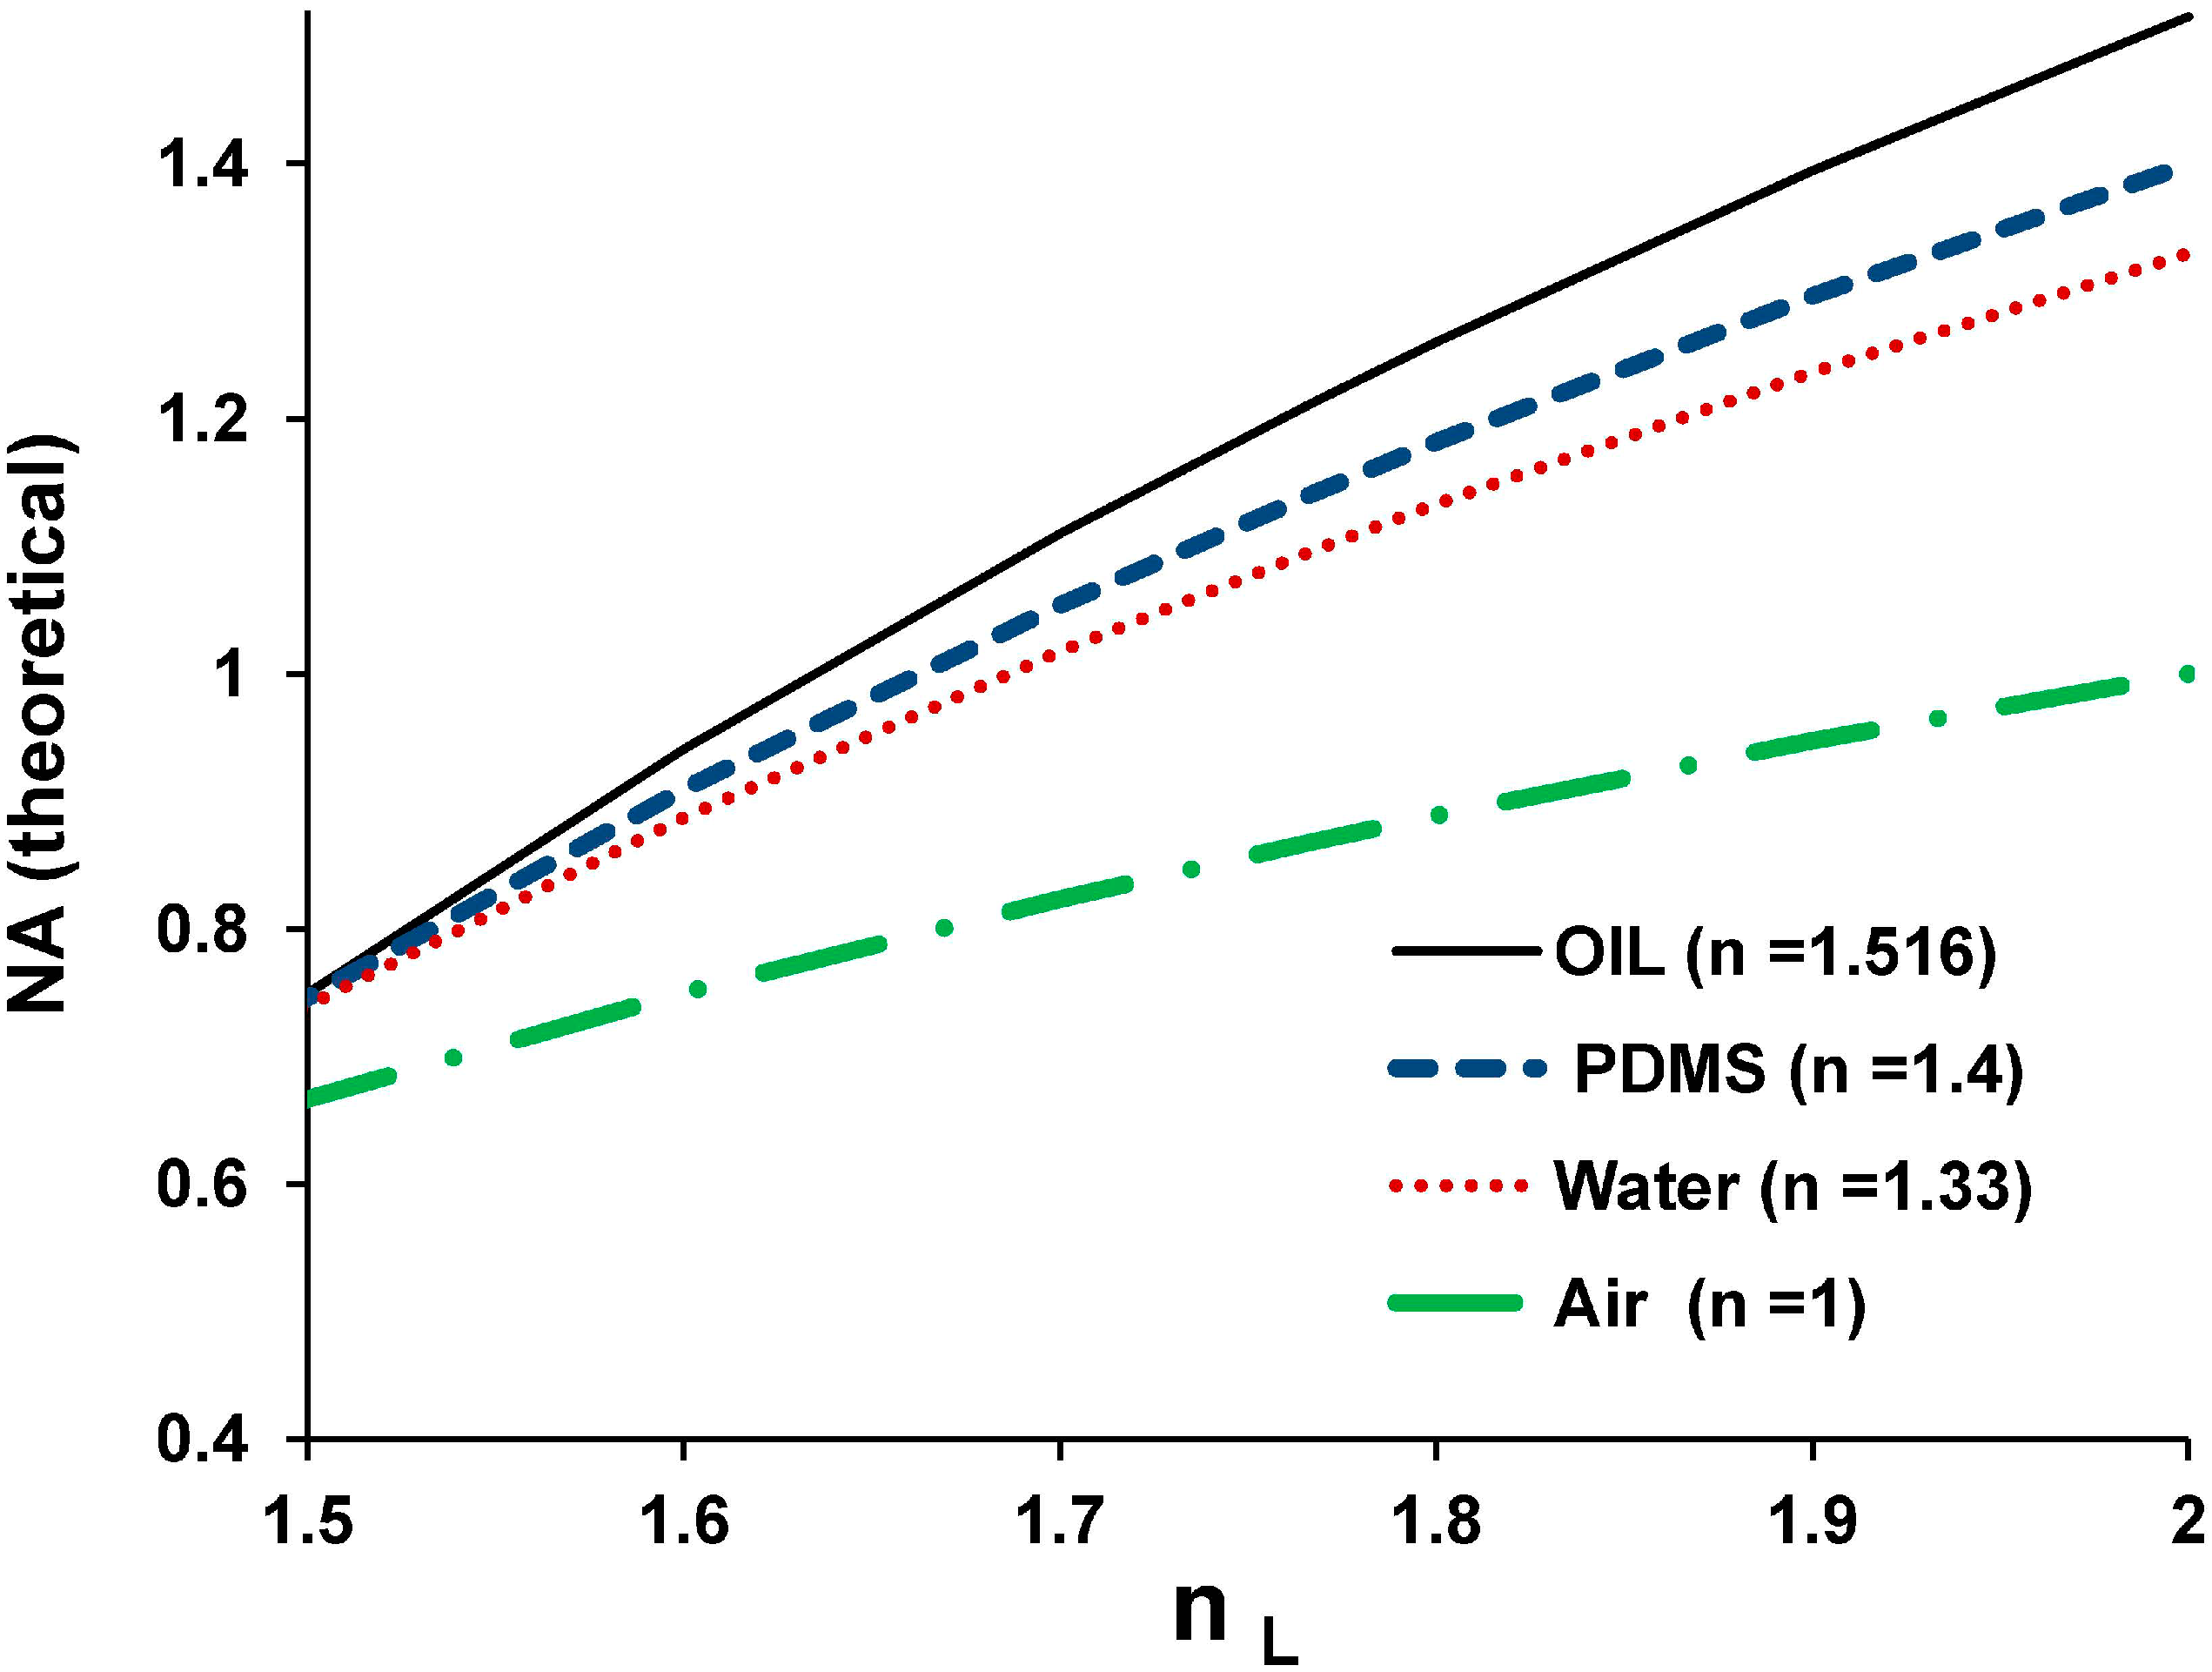
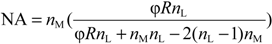
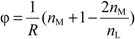
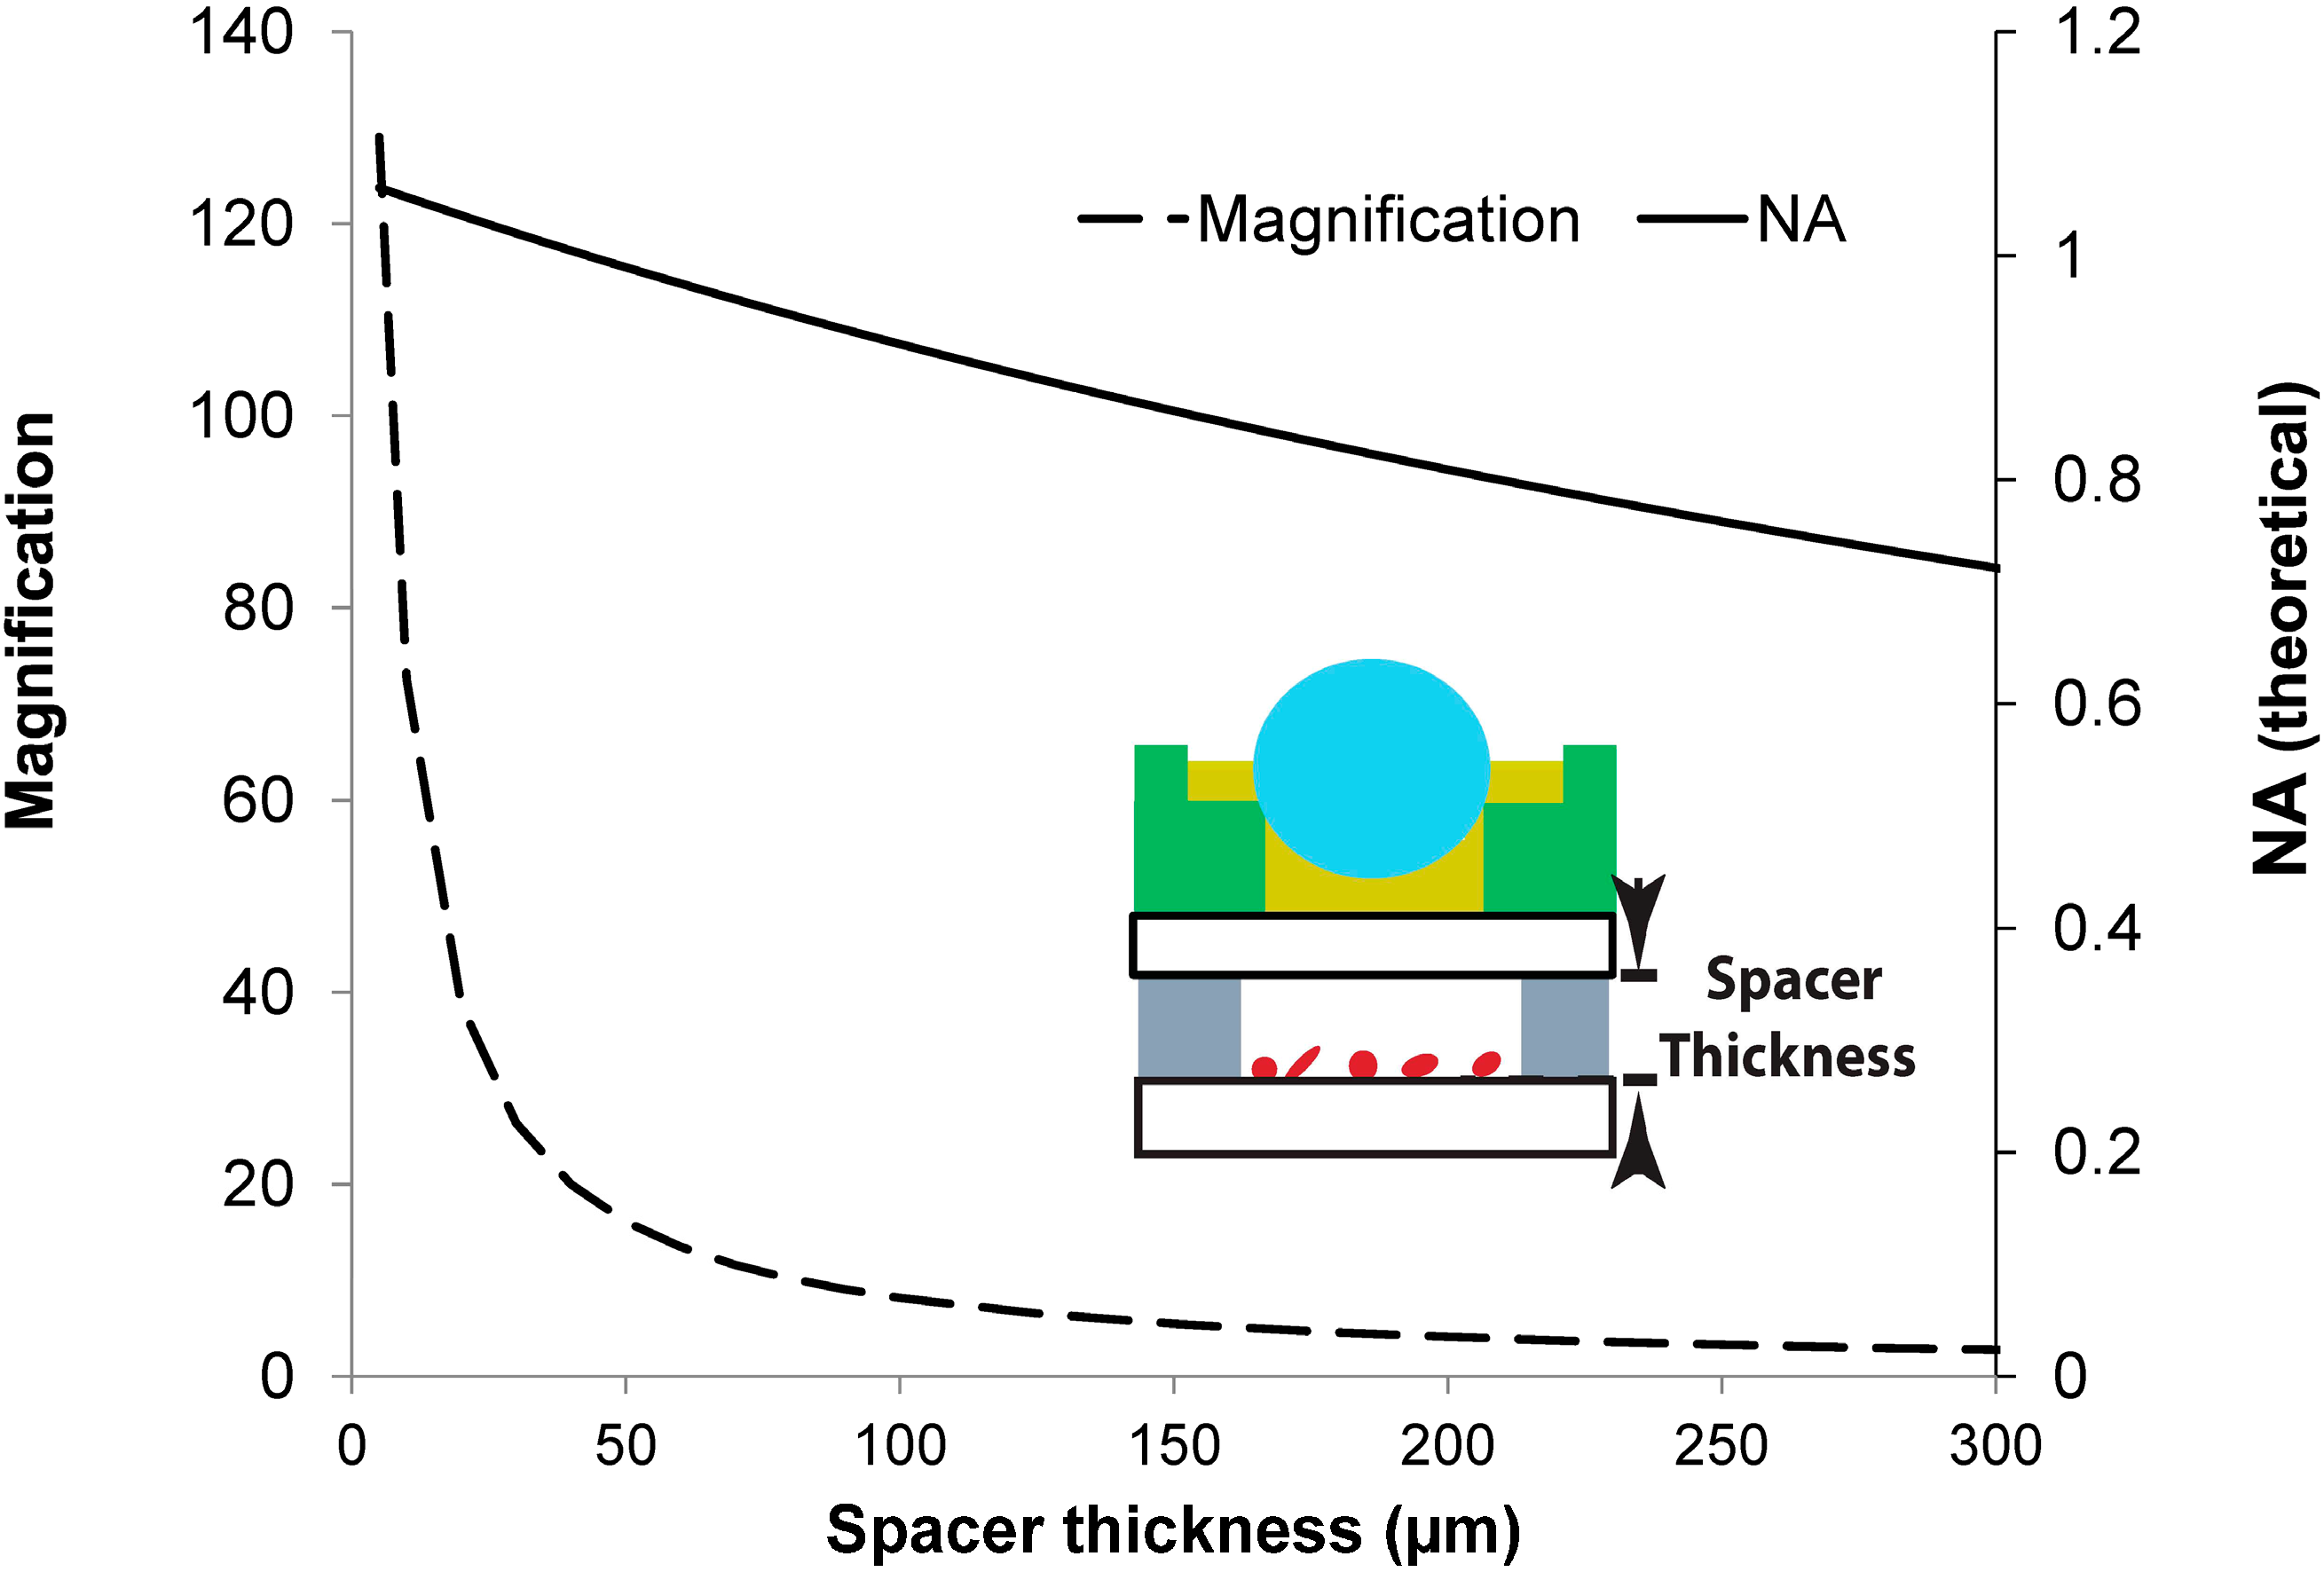
3.1.2. The Numerical Aperture (NA) of the μOIL Chip

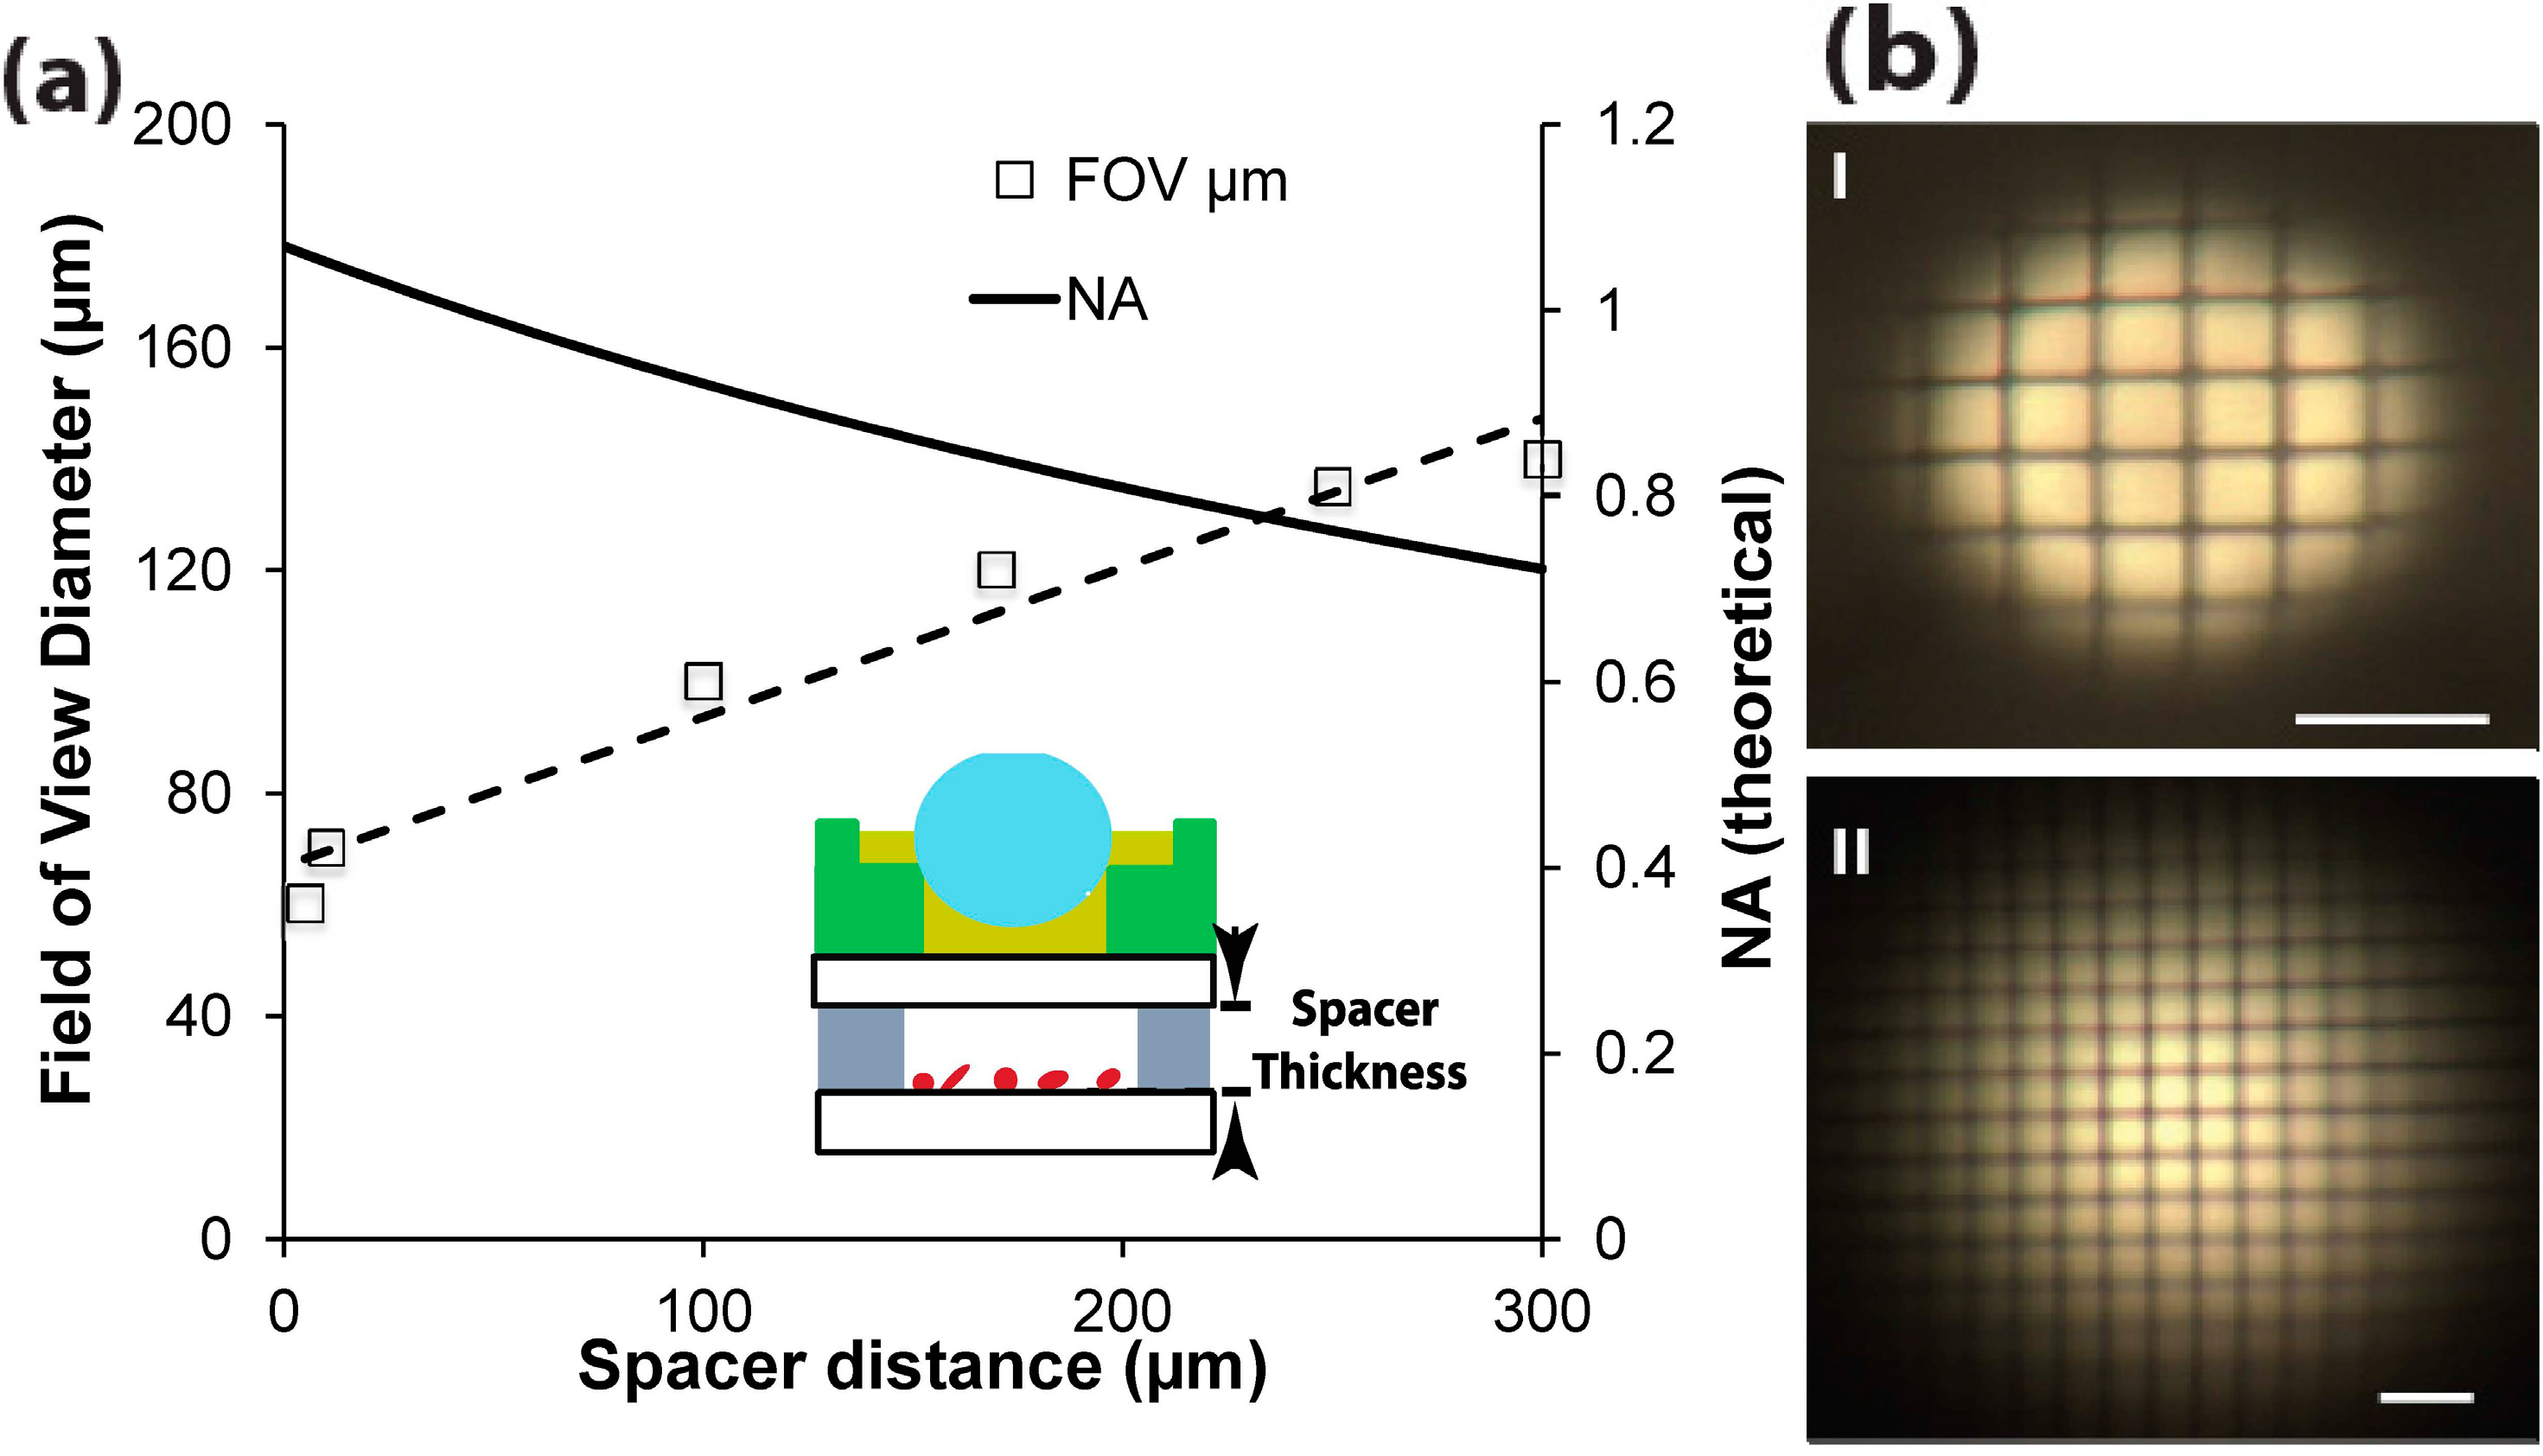
3.1.3. Magnification and NA versus Spacer Thickness
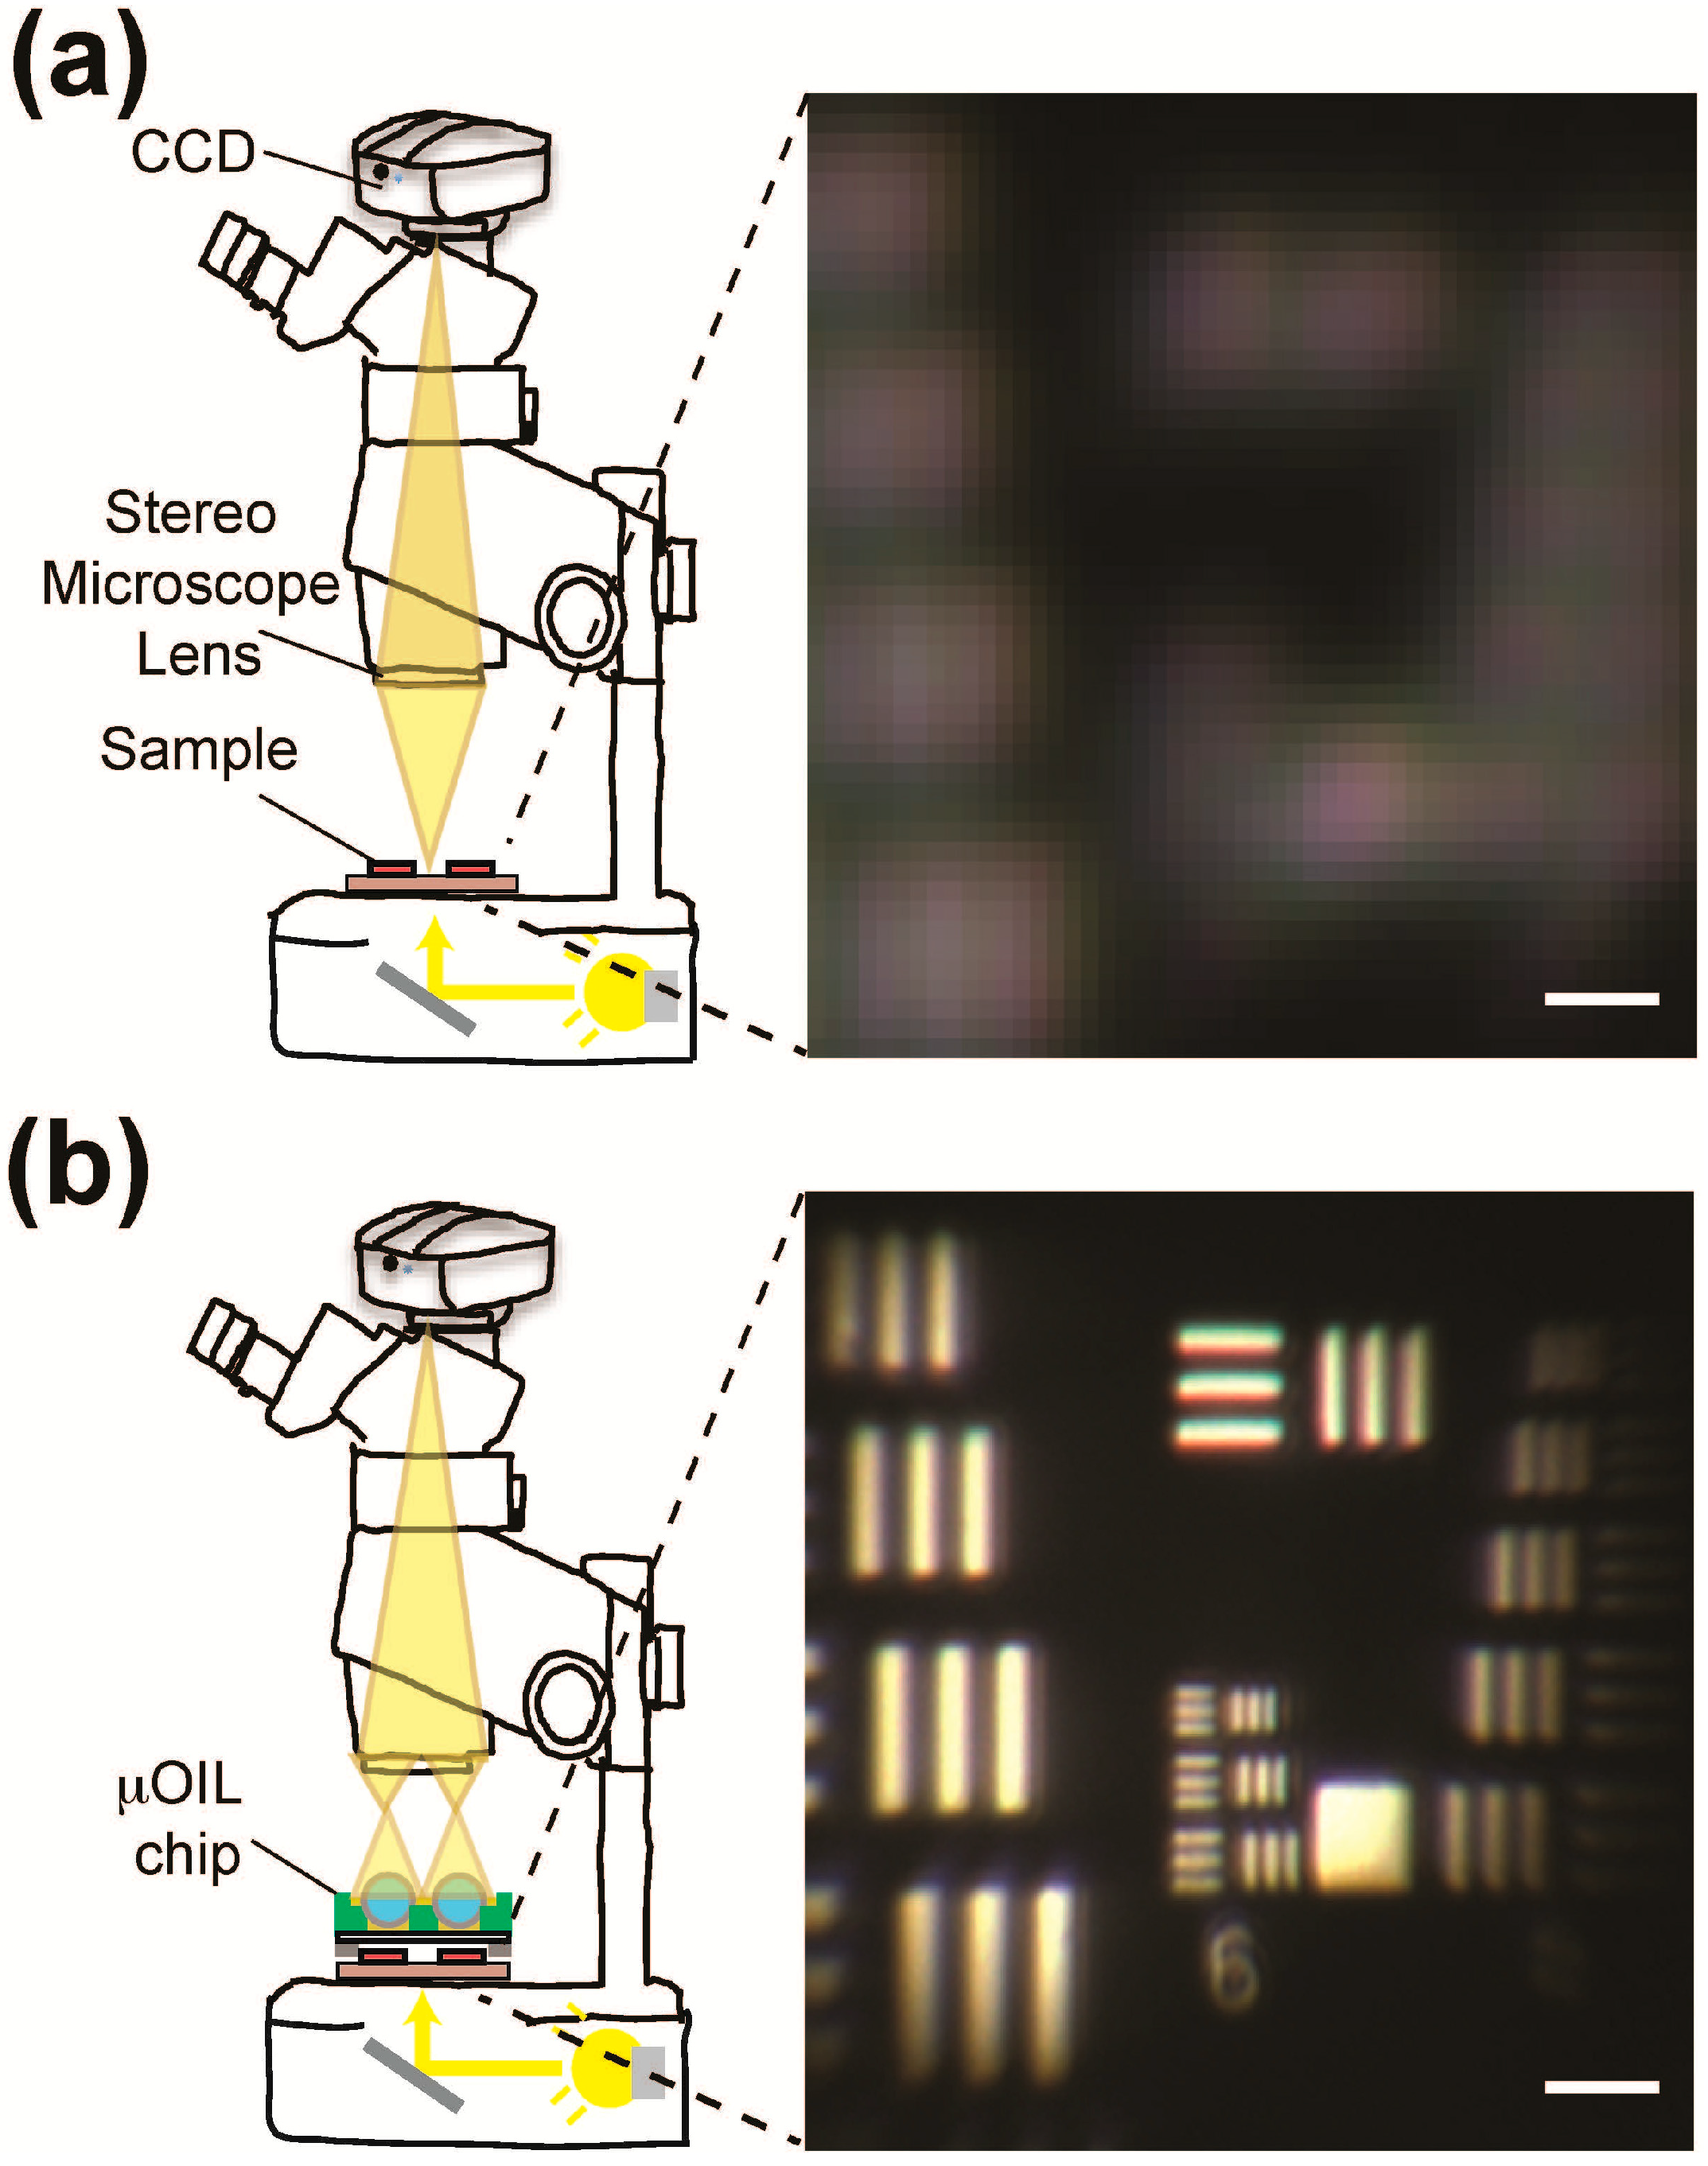
3.2. The Combined μOIL Chip/Stereo Microscope Assembly
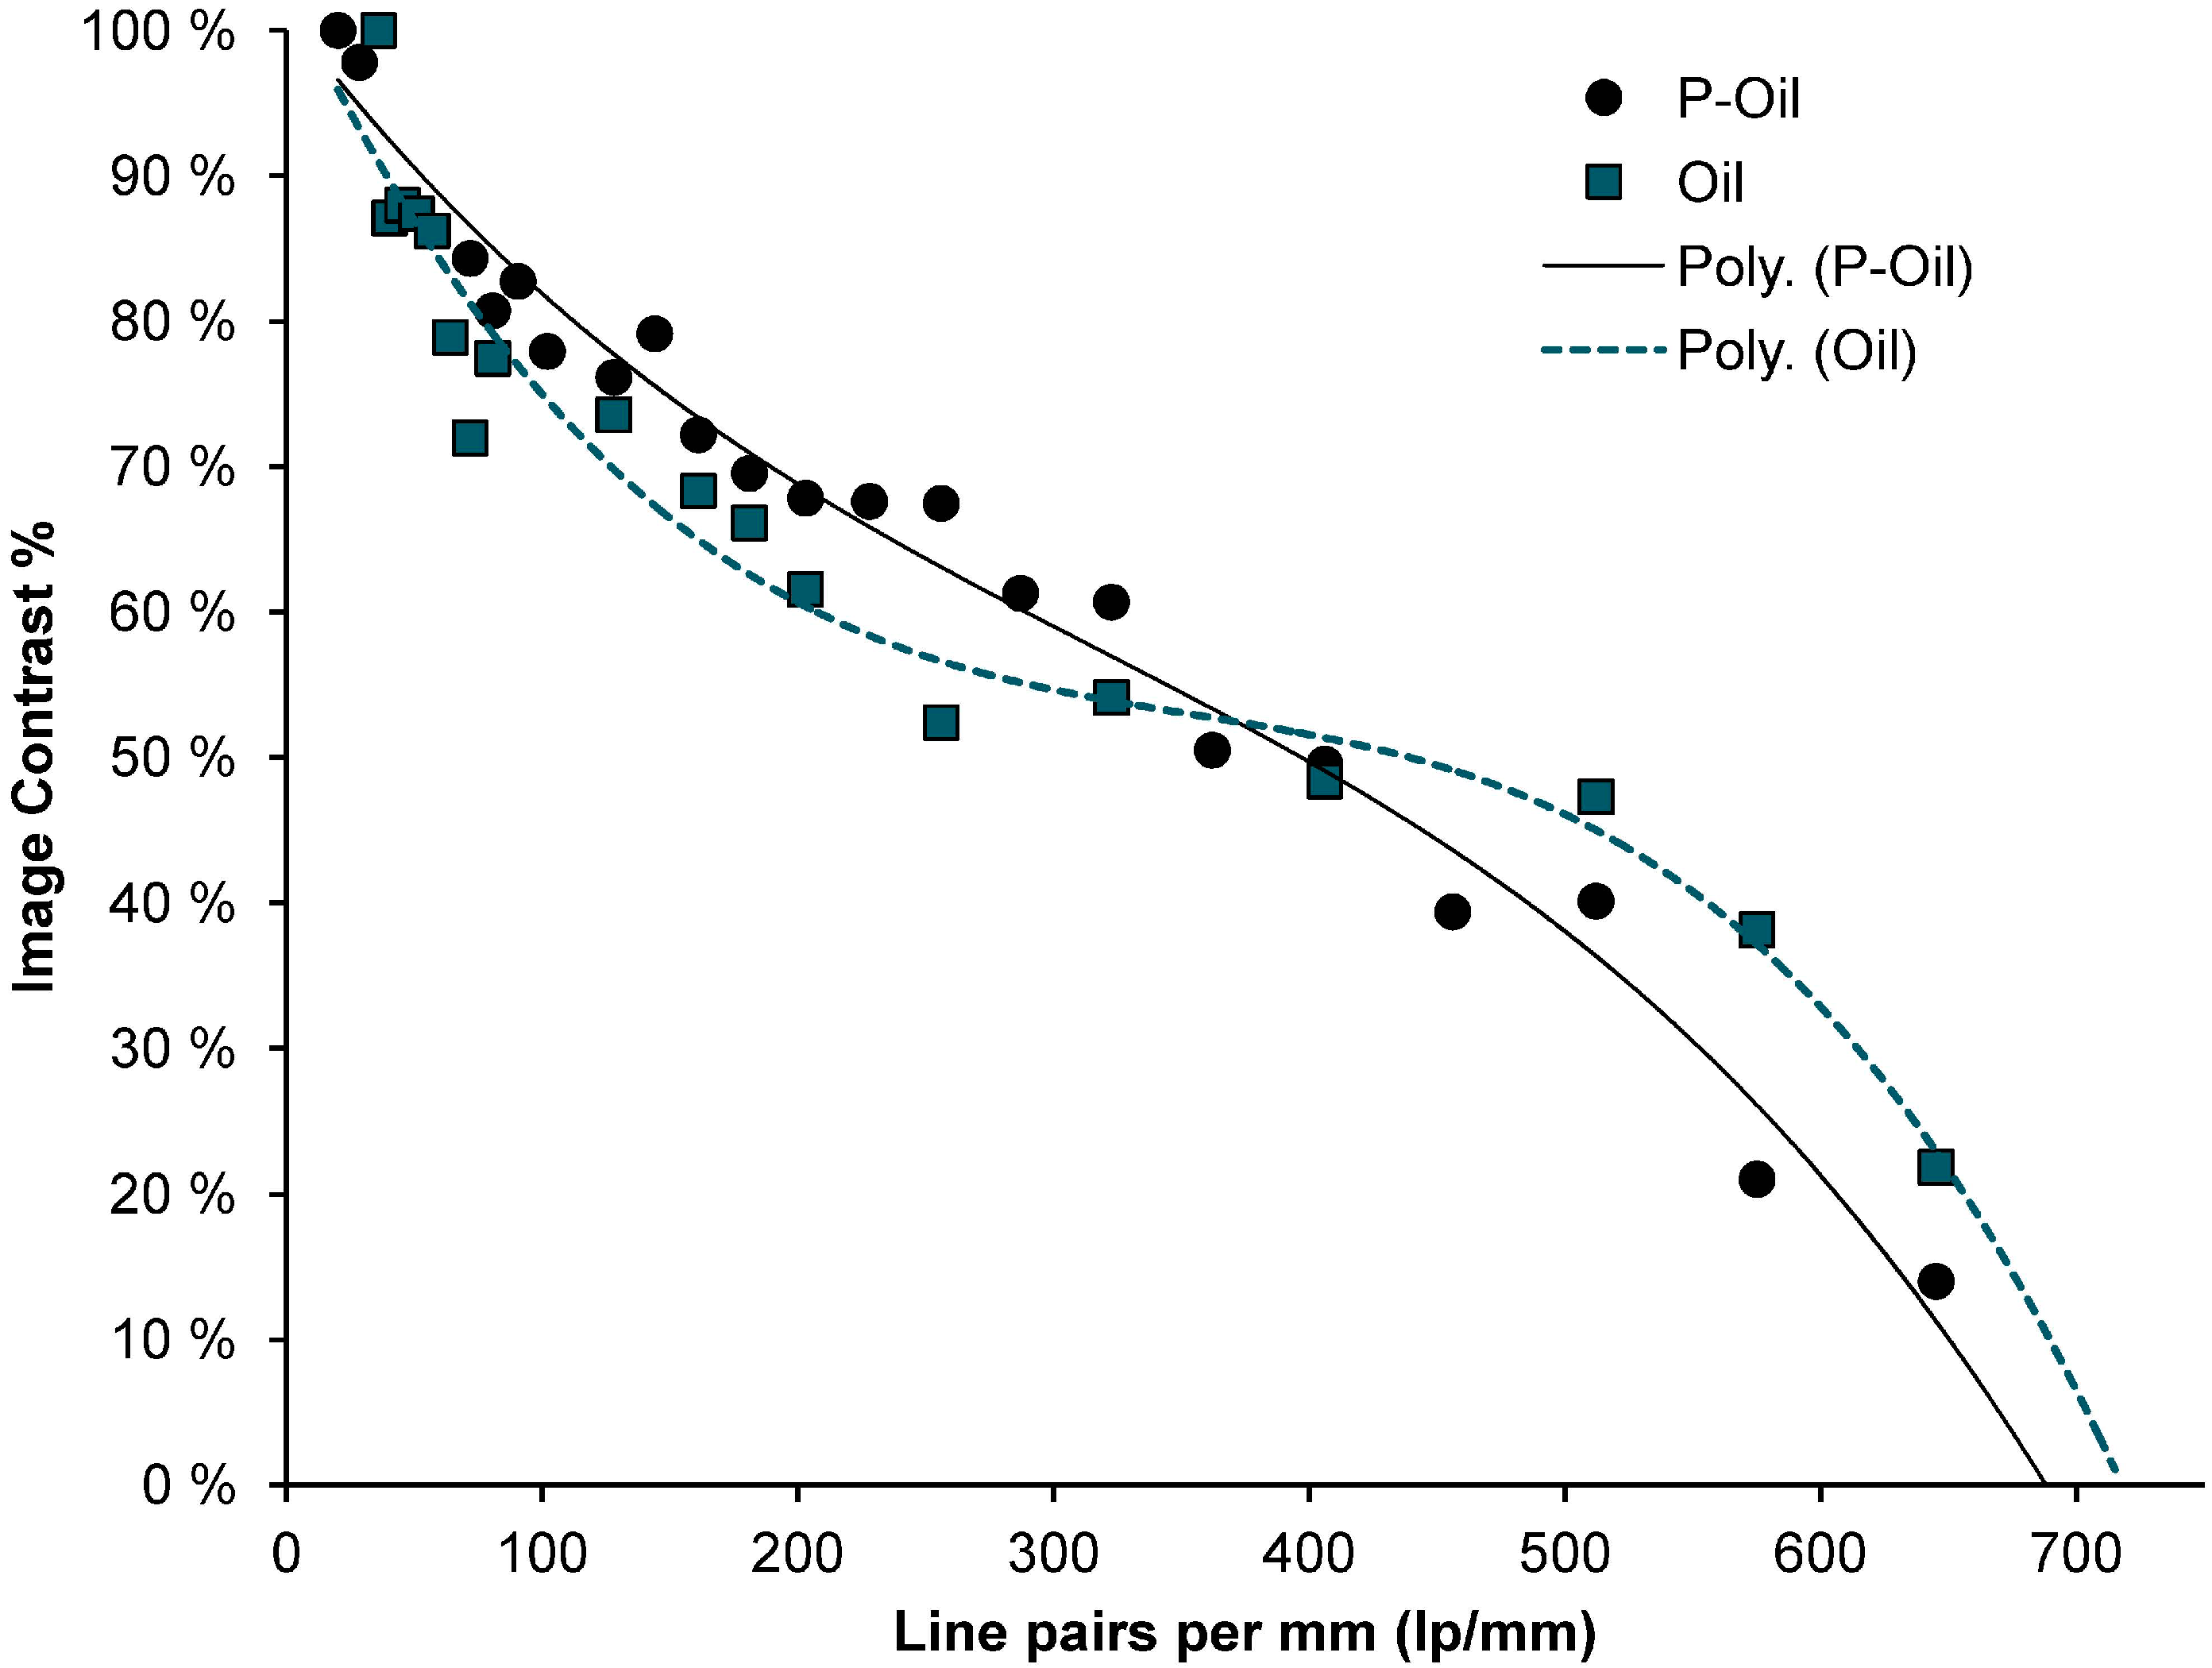
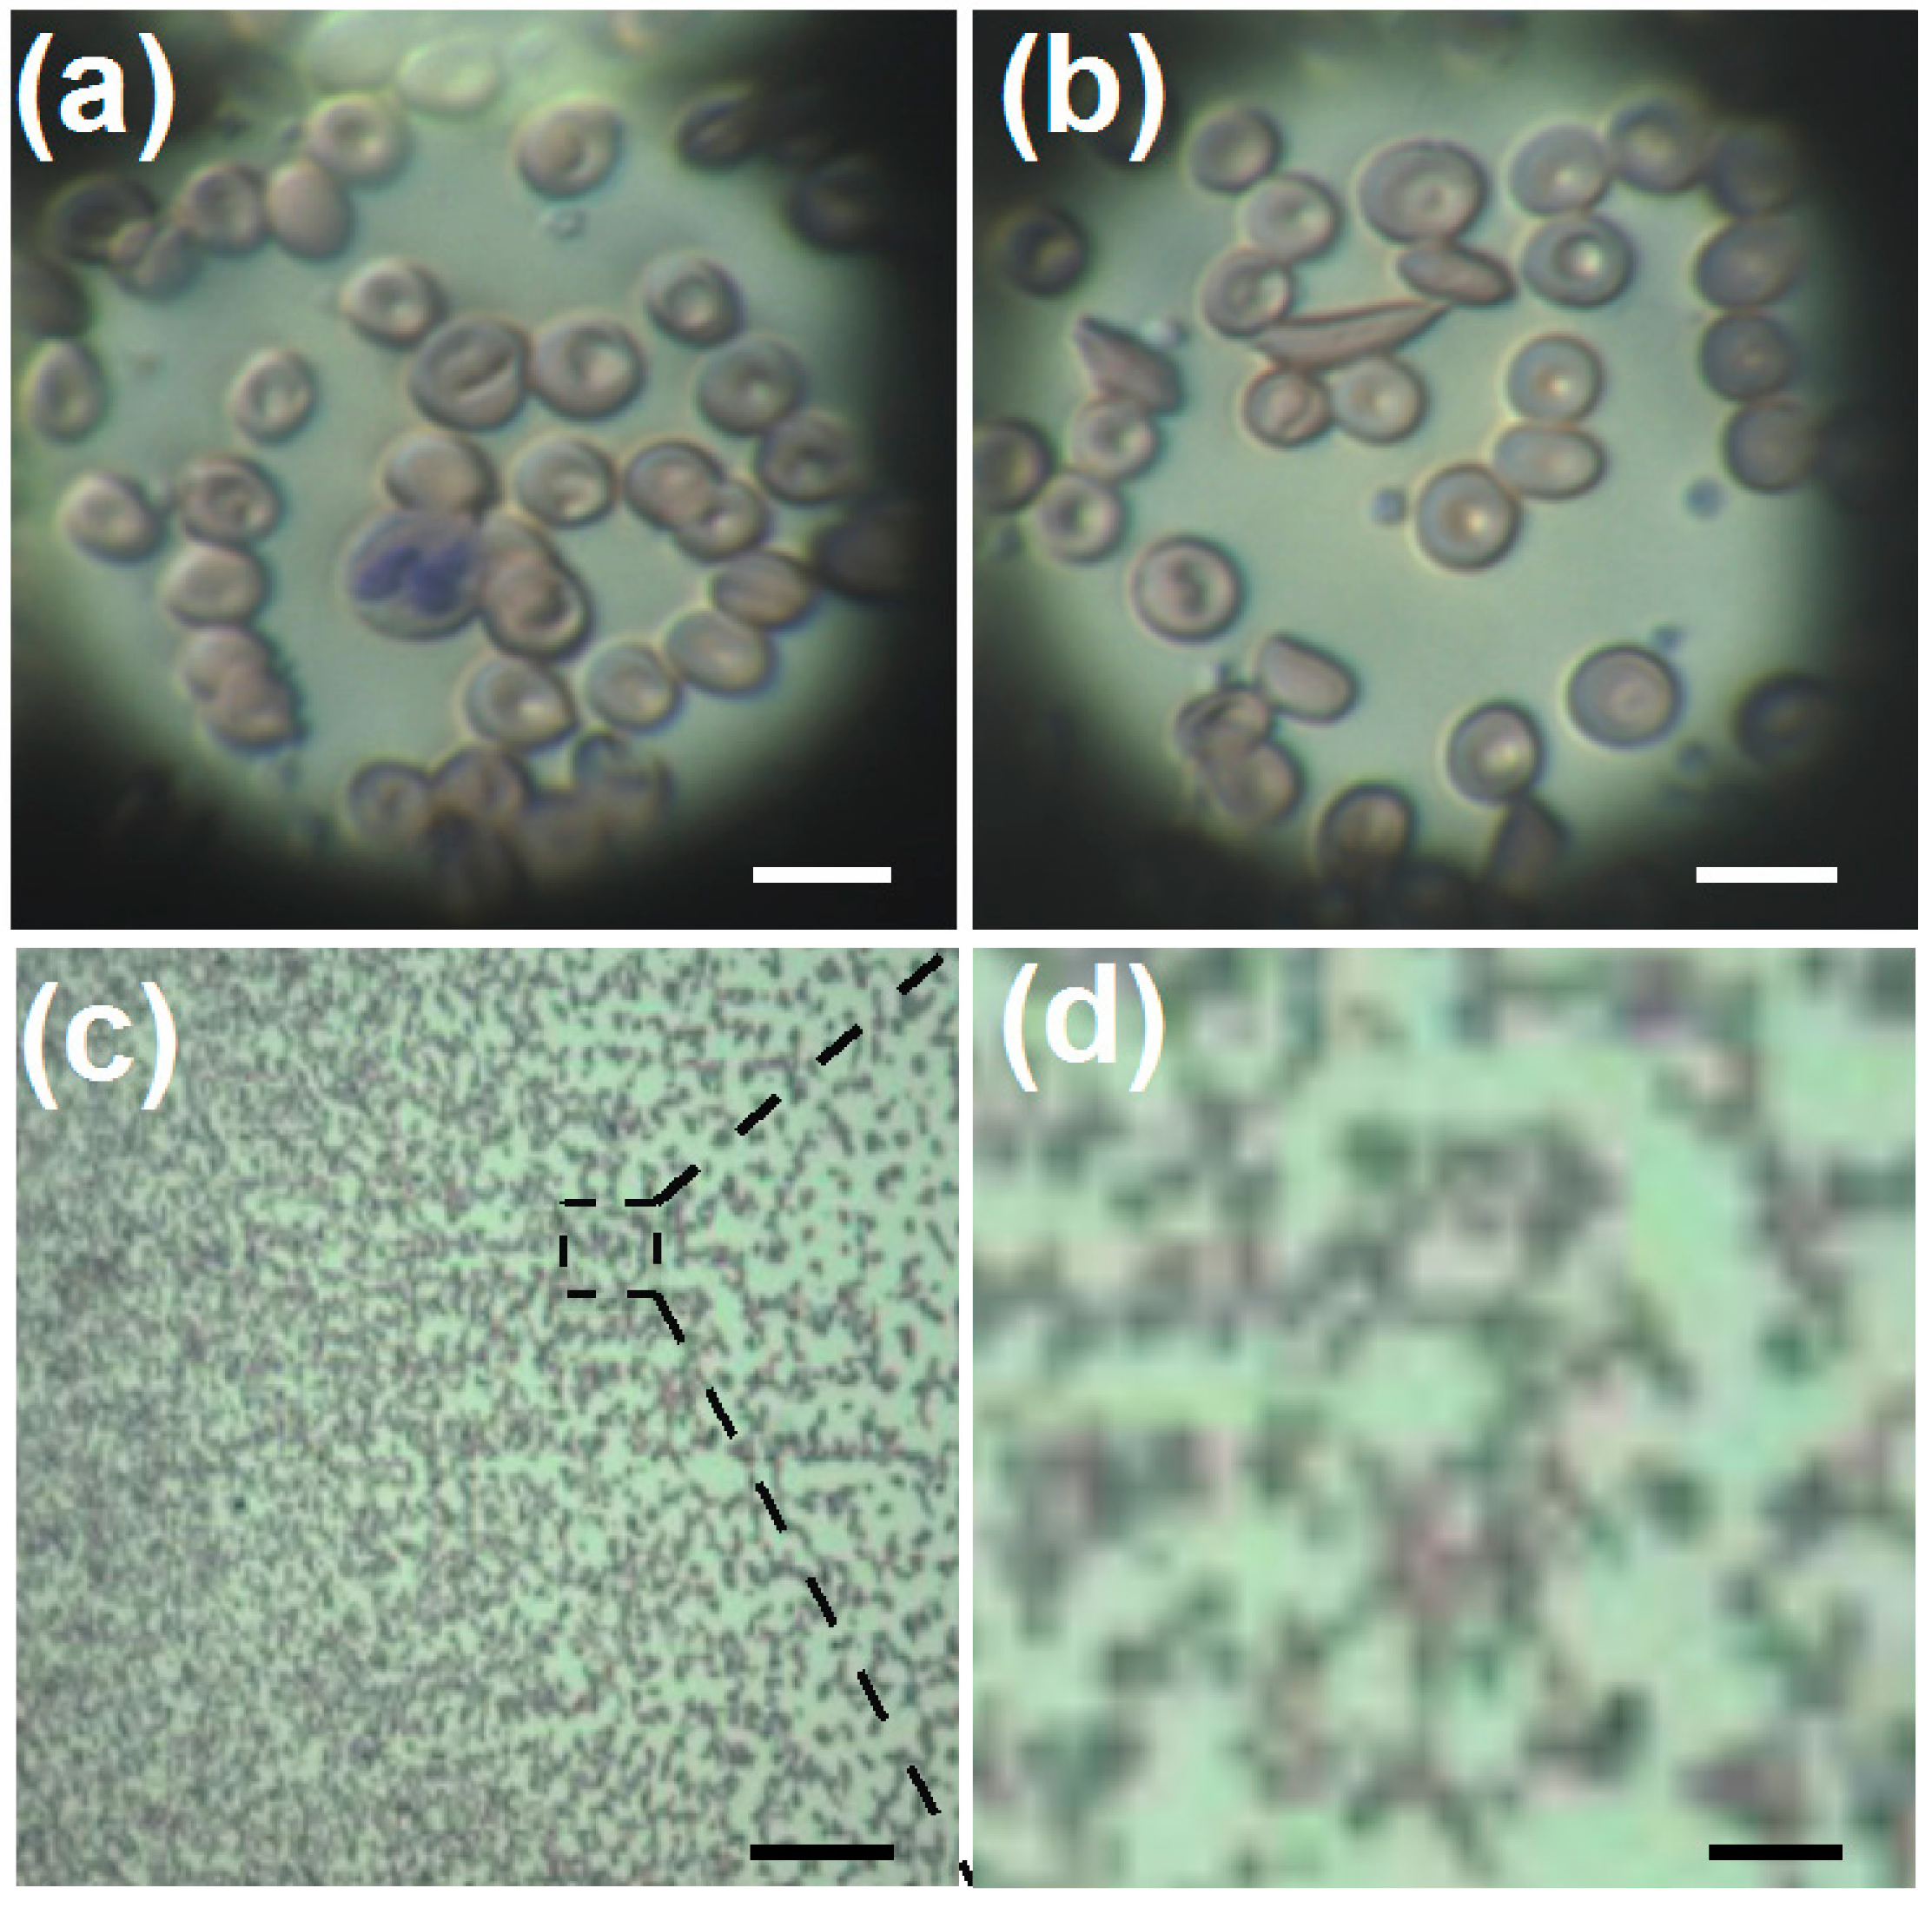
3.2.1. Resolution

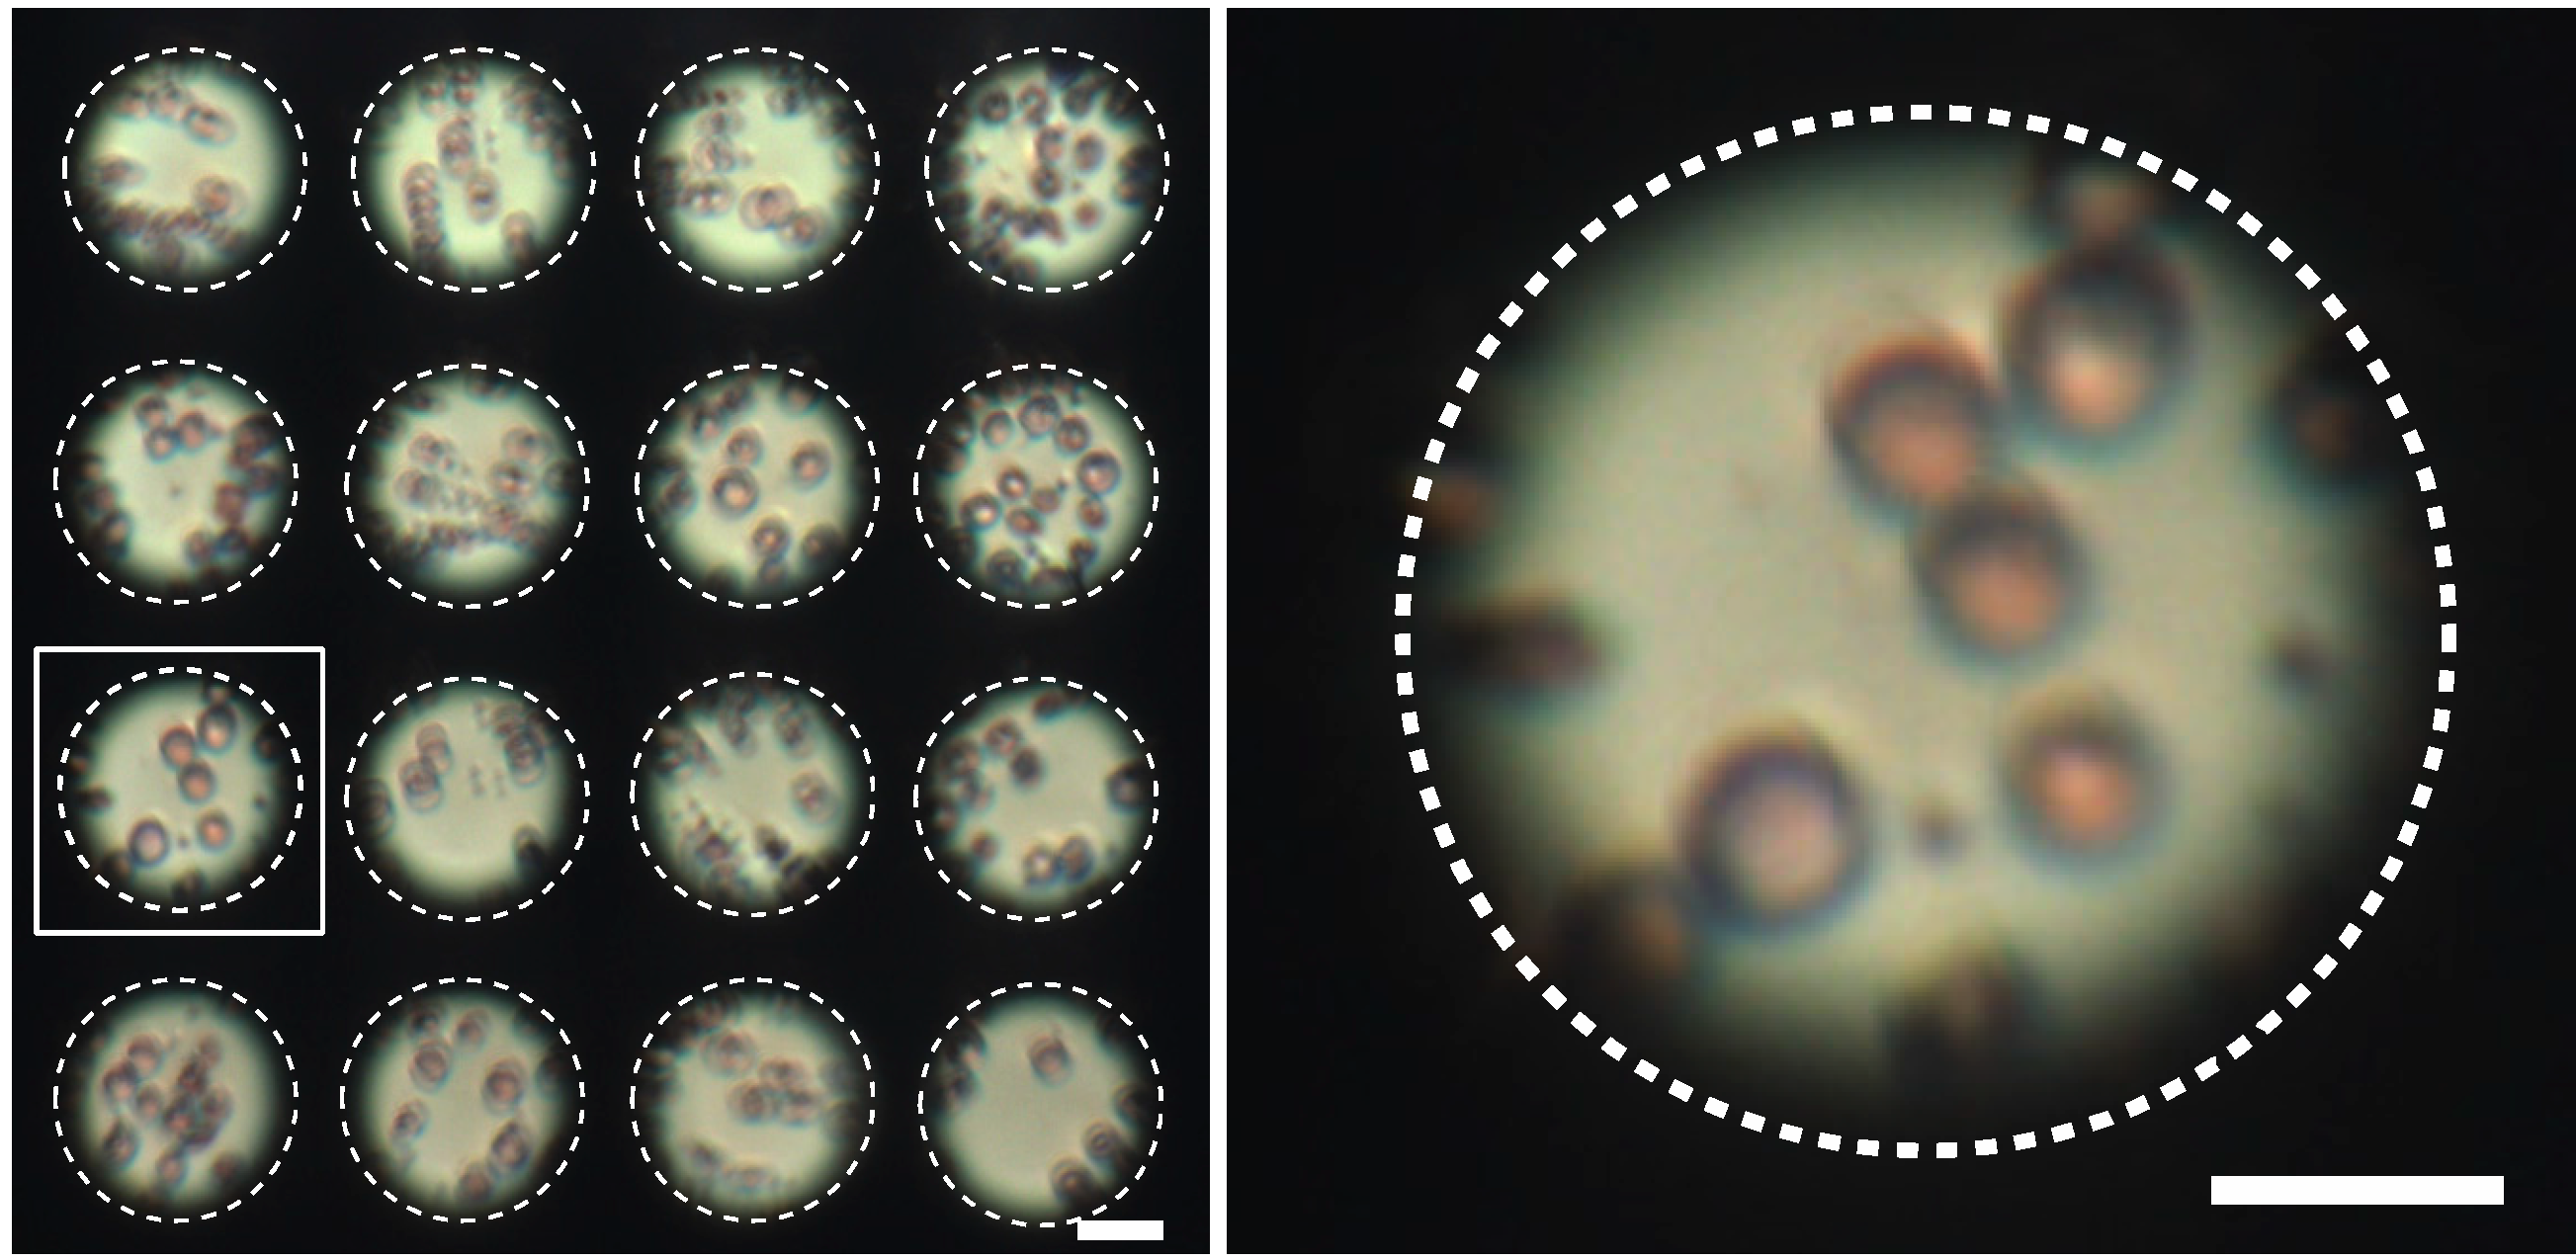
3.2.2. Field of View (FOV)
3.2.3. Biological Imaging

4. Conclusions
Supplementary Materials
Acknowledgments
Author Contributions
Conflicts of Interest
References
- Bradbury, S.; Bracegirdle, D.B. Introduction to Light Microscopy; BIOS Scientific Publishers Limited: Milton Park, UK, 1998; p. 123. [Google Scholar]
- Spellman, F.R. The Microscope. In Microbiology for Water and Wastewater Operators (Revised Reprint); CRC Press: Boca Raton, FL, USA, 1999; pp. 11–17. [Google Scholar]
- Peyman, G.A.; Koziol, J.E.; Fried, W.I.; Sanders, D.R. Operating Microscope with Two Pairs of Stereo Eye-Piece Lenses. U.S. Patent 4,138,191, 6 February 1979. [Google Scholar]
- Muller, O.; Biber, K.; Jakubowski, H.; Hanemann, G. Operation Microscope. U.S. Patent 4,448,498, 15 May 1984. [Google Scholar]
- Fukaya, T.; Hamada, M.; Nakamura, S.; Hanzawa, T.; Kinukawa, M.; Ishikawa, T.; Fujiwara, H.; Tokunaga, S. Stereomicroscope. U.S. Patent 5,552,929, 3 September 1996. [Google Scholar]
- Woolnough, L. Starting with Stereomicroscopes—Quekett Microscopical Club. Available online: http://www.quekett.org/starting/stereo-microscopes/stereo-microscopes (accessed on 8 May 2014).
- Krupenkin, T.; Yang, S.; Mach, P. Tunable liquid microlens. Appl. Phys. Lett. 2003, 82, 316–318. [Google Scholar] [CrossRef]
- Cadarso, V.J.; Llobera, A.; Villanueva, G.; Dominguez, C.; Plaza, J.A. 3-D modulable PDMS-based microlens system. Opt. Express 2008, 16, 4918–4929. [Google Scholar] [CrossRef]
- Dong, L.; Agarwal, A.K.; Beebe, D.J.; Jiang, H. Adaptive liquid microlenses activated by stimuli-responsive hydrogels. Nature 2006, 442, 551–554. [Google Scholar] [CrossRef]
- Chen, J.; Wang, W.; Fang, J.; Varahramyan, K. Variable-focusing microlens with microfluidic chip. J. Micromech. Microeng. 2004, 14, 675–680. [Google Scholar] [CrossRef]
- Chronis, N.; Liu, G.; Jeong, K.H.; Lee, L. Tunable liquid-filled microlens array integrated with microfluidic network. Opt. Express 2003, 11, 2370–2378. [Google Scholar] [CrossRef]
- He, M.; Yuan, X.C.; Ngo, N.; Bu, J.; Tao, S. Low-cost and efficient coupling technique using reflowed sol-gel microlens. Opt. Express 2003, 11, 1621–1627. [Google Scholar] [CrossRef]
- Nussbaum, P.; Volkrl, R.; Herzig, H.P.; Eisner, M.; Haselbeck, S. Design, fabrication and testing of microlens arrays for sensors and microsystems. Pure Appl. Opt. 1996, 6, 617–636. [Google Scholar]
- Aristizabal, S.L.; Cirino, G.A.; Montagnoli, A.N.; Sobrinho, A.A.; Rubert, J.B.; Hospital, M.; Mansano, R.D. Microlens array fabricated by a low-cost grayscale lithography maskless system. Opt. Eng. 2013, 52. [Google Scholar] [CrossRef]
- Kozma, P.; Lehmann, A.; Wunderlich, K.; Michel, D.; Schumacher, S.; Ehrentreich-Förster, E.; Bier, F.F. A novel handheld fluorescent microarray reader for point-of-care diagnostic. Biosens. Bioelectron. 2013, 47, 415–420. [Google Scholar] [CrossRef]
- Orth, A.; Crozier, K. Microscopy with microlens arrays: High throughput, high resolution and light-field imaging. Opt. Express 2012, 20, 13522–13531. [Google Scholar] [CrossRef]
- Kim, J.Y.; Pfeiffer, K.; Voigt, A.; Gruetzner, G.; Brugger, J. Directly fabricated multi-scale microlens arrays on a hydrophobic flat surface by a simple ink-jet printing technique. J. Mater. Chem. 2012, 22, 3053–3058. [Google Scholar] [CrossRef]
- Tripathi, A.; Chronis, N. A doublet microlens array for imaging micron-sized objects. J. Micromech. Microeng. 2011, 21. [Google Scholar] [CrossRef]
- Volkel, R.; Herzig, H.P.; Nussbaum, P.; Dandliker, R.; Hugle, W.B. Microlens array imaging system for photolithography. Opt. Eng. 1996, 35, 3323–3330. [Google Scholar] [CrossRef]
- Aldalali, B.; Kanhere, A.; Fernandes, J.; Huang, C.C.; Jiang, H. Fabrication of polydimethylsiloxane microlenses utilizing hydrogel shrinkage and a single molding step. Micromachines 2014, 5, 275–288. [Google Scholar] [CrossRef]
- Gulari, M.N.; Tripathi, A.; Chronis, N. Microfluidic-based oil-immersion lenses for high resolution microscopy. In Proceedings of the 16th International Conference on Miniaturized Systems for Chemistry and Life Sciences (μTAS’12), Okinawa, Japan, 28 October–1 November 2012; pp. 49–51.
- Brückner, A.; Duparre, J.; Wippermann, F.; Leitel, R.; Dannberg, P.; Brauer, A. Ultra-compact close-up microoptical imaging system. Proc. SPIE 2010, 7786. [Google Scholar] [CrossRef]
- Knieling, T.; Shaf, M.; Lang, W.; Benecke, W. Microlens array production in a microtechnological dry etch and reflow process for display applications. J. Eur. Opt. Soc. Rap. Publ. 2012, 7. [Google Scholar] [CrossRef]
- Tripathi, A.; Chokshi, T.V.; Chronis, N. A high numerical aperture, polymer-based, planar microlens array. Appl. Opt. 2009, 17, 19908–19918. [Google Scholar]
- Pang, S.; Han, C.; Erath, J.; Rodriguez, A.; Yang, C. Wide field-of-view Talbot grid-based microscopy for multicolor fluorescence imaging. Opt. Express 2013, 21, 14555–14565. [Google Scholar]
- Schonbrun, E.; Gorthi, S.S.; Schaak, D. Microfabricated multiple field of view imaging flow cytometry. Lab Chip 2012, 12, 268–273. [Google Scholar] [CrossRef]
- Cui, X.; Lee, L.; Heng, M.X.; Zhong, W.; Sternberg, P.W.; Psaltis, D.; Yang, C. Lensless high-resolution on-chip optofluidic microscopes for Caenorhabditis elegans and cell imaging. Proc. Natl. Acad. Sci. USA 2008, 105, 10670–10675. [Google Scholar] [CrossRef]
- Wu, J.; Zheng, G.; Lee, L.M. Optical imaging techniques in microfluidics and their applications. Lab Chip 2012, 12, 3566–3575. [Google Scholar] [CrossRef]
- Itatani, J.; Levesque, J.; Zeidler, D.; Niikura, H.; Pépin, H.; Kieffer, J.C.; Corkum, P.B.; Villeneuve, D.M. Tomographic imaging of molecular orbitals. Nature 2004, 432, 867–871. [Google Scholar] [CrossRef]
- Chen, Z.; Milner, T.E.; Dave, D.; Nelson, J.S. Optical Doppler tomographic imaging of fluid flow velocity in highly scattering media. Opt. Lett. 1997, 22, 64–66. [Google Scholar] [CrossRef]
- Foldscope: Microscopy for everyone. Available online: http://www.foldscope.com/ (accessed on 3 June 2014).
- Bogoch, I.I.; Andrews, J.R.; Speich, B.; Utzinger, J.; Ame, S.M.; Ali, S.M.; Keiser, J. Mobile phone microscopy for the diagnosis of soil-transmitted helminth infections: A proof-of-concept study. Am. J. Trop. Med. Hyg. 2013, 88, 626–629. [Google Scholar] [CrossRef]
- Arpa, A.; Wetzstein, G.; Lanman, D.; Raskar, R. Single lens off-chip cellphone microscopy. In Proceedings of Computer Vision and Pattern Recognition Workshops (CVPRW), 2012 IEEE Computer Society Conference on, Providence, RI, USA, 16–21 June 2012; pp. 23–28.
- Smith, Z.J.; Chu, K.; Espenson, A.R.; Rahimzadeh, M.; Gryshuk, A.; Molinaro, M.; Dwyre, D.M.; Lane, S.; Matthews, D.; Wachsmann-Hogiu, S. Cell-phone-based platform for biomedical device development and education applications. PLoS One 2011, 6. [Google Scholar] [CrossRef]
- Frank, S.J.; Pedrotti, L.; Pedrotti, L.M.; Pedrotti, L.S. Introduction to Optics; Pearson Education: Upper Saddle River, NJ, USA, 2008. [Google Scholar]
- Solinski, W.; Olympus, Tokyo, Japan. Personal communication. 2012.
- Basic Concepts and Formulas in Microscopy: Resolution. Available online: http://www.microscopyu.com/articles/formulas/formulasresolution.html (accessed on 22 May 2014).
- Hubers, H.W.; Schubert, J.; Krabbe, A.; Birk, M.; Wagner, G.; Semenov, A.; Goltsman, G.; Voronov, B.; Gershenzon, E. Parylene anti-reflection coating of a quasi-optical hot-electron-bolometric mixer at terahertz frequencies. Infrared Phys. Technol. 2001, 42, 41–47. [Google Scholar] [CrossRef]
© 2014 by the authors; licensee MDPI, Basel, Switzerland. This article is an open access article distributed under the terms and conditions of the Creative Commons Attribution license (http://creativecommons.org/licenses/by/3.0/).
Share and Cite
Gulari, M.N.; Tripathi, A.; Ghannad-Rezaie, M.; Chronis, N. An Optofluidic Lens Array Microchip for High Resolution Stereo Microscopy. Micromachines 2014, 5, 607-621. https://doi.org/10.3390/mi5030607
Gulari MN, Tripathi A, Ghannad-Rezaie M, Chronis N. An Optofluidic Lens Array Microchip for High Resolution Stereo Microscopy. Micromachines. 2014; 5(3):607-621. https://doi.org/10.3390/mi5030607
Chicago/Turabian StyleGulari, Mayurachat Ning, Anurag Tripathi, Mostafa Ghannad-Rezaie, and Nikos Chronis. 2014. "An Optofluidic Lens Array Microchip for High Resolution Stereo Microscopy" Micromachines 5, no. 3: 607-621. https://doi.org/10.3390/mi5030607