Remote Sens. 2023, 15(7), 1792; https://doi.org/10.3390/rs15071792 - 27 Mar 2023
Cited by 4 | Viewed by 1914
Abstract
Long-time coherent integration works to significantly increase the detection probability for maneuvering targets. However, during the observation time, the problems that often tend to occur are range cell migration (RCM) and Doppler frequency cell migration (DFCM), due to the high velocity and acceleration
[...] Read more.
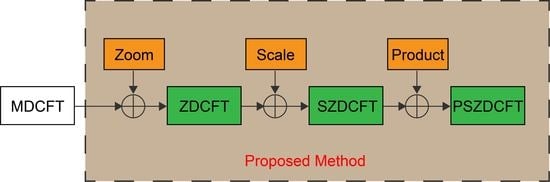
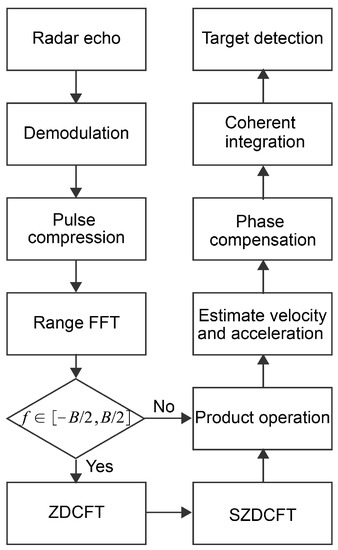
Long-time coherent integration works to significantly increase the detection probability for maneuvering targets. However, during the observation time, the problems that often tend to occur are range cell migration (RCM) and Doppler frequency cell migration (DFCM), due to the high velocity and acceleration of the maneuvering target, which can reduce the detection of the maneuvering targets. In this regard, we propose a new coherent integration approach, based on the product scale zoom discrete chirp Fourier transform (PSZDCFT). Specifically, by introducing the zoom operation into the modified discrete chirp Fourier transform (MDCFT), the zoom discrete chirp Fourier transform (ZDCFT) can correctly estimate the centroid frequency and chirp rate of the linear frequency-modulated signal (LFM), regardless of whether the parameters of the LFM signal are outside the estimation scopes. Then, the scale operation, combined with ZDCFT, is performed on the radar echo signal in the range frequency slow time domain, to remove the coupling. Thereafter, a product operation is executed along the range frequency to inhibit spurious peaks and reinforce the true peak. Finally, the velocity and acceleration of the target estimated from the true peak position, are used to construct a phase compensation function to eliminate the RCM and DFCM, thus achieving coherent integration. The method is a linear transform without energy loss, and is suitable for low signal-to-noise (SNR) environments. Moreover, the method can be effectively fulfilled based on the chirp-z transform (CZT), which prevents the brute-force search. Thus, the method reaches a favorable tradeoff between anti-noise performance and computational load. Intensive simulations demonstrate the effectiveness of the proposed method.
Full article
(This article belongs to the Special Issue Advanced Radar Signal Processing and Applications)
►
Show Figures
Graphical abstract


