Remote Sens. 2023, 15(3), 765; https://doi.org/10.3390/rs15030765 - 28 Jan 2023
Cited by 6 | Viewed by 3396
Abstract
Accurate knowledge of urban forest patterns contributes to well-managed urbanization, but accurate urban tree canopy mapping is still a challenging task because of the complexity of the urban structure. In this paper, a new method that combines double-branch U-NET with multi-temporal satellite images
[...] Read more.
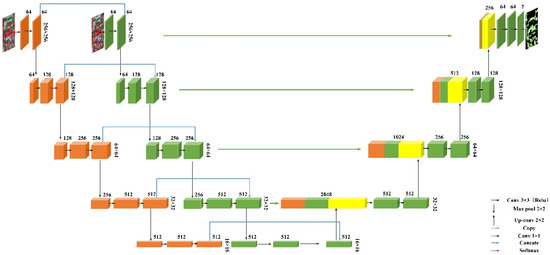
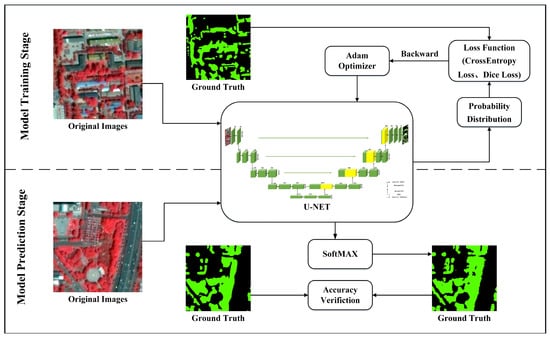
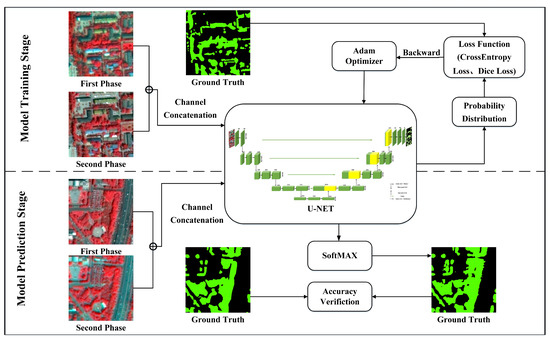
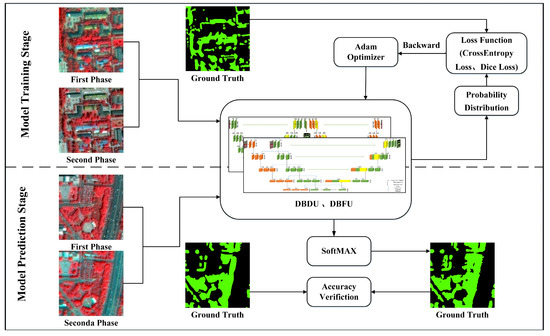
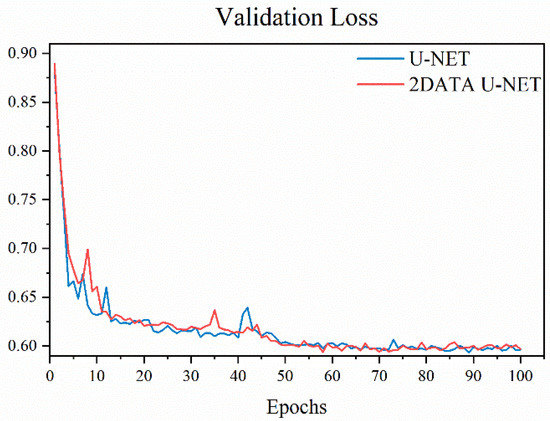
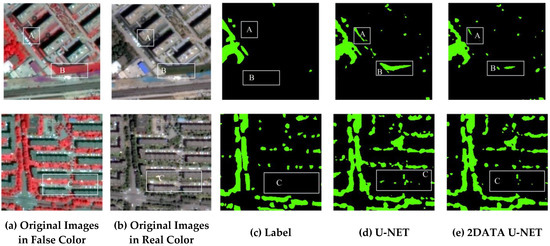
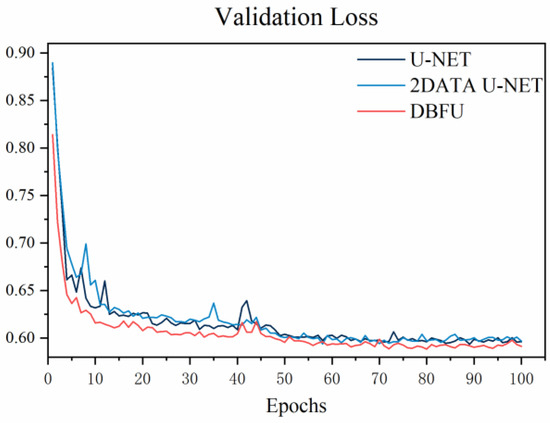
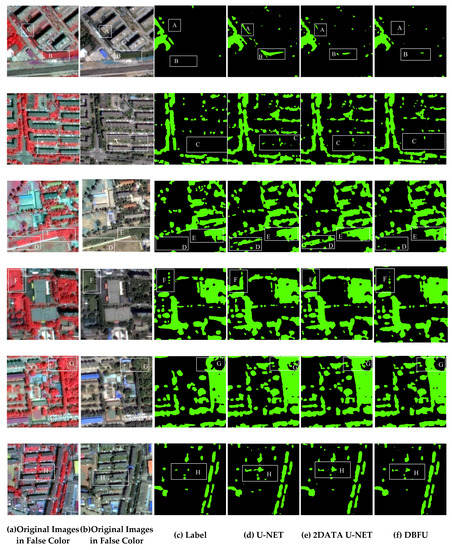
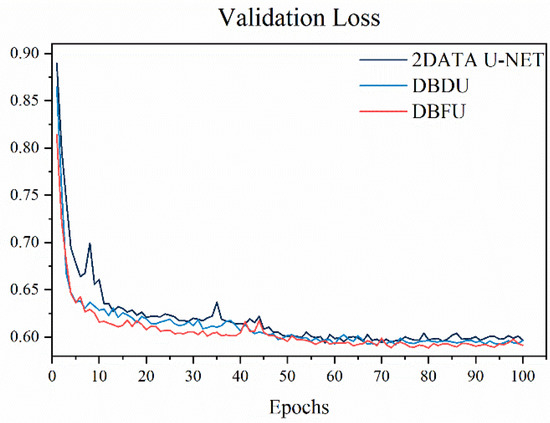
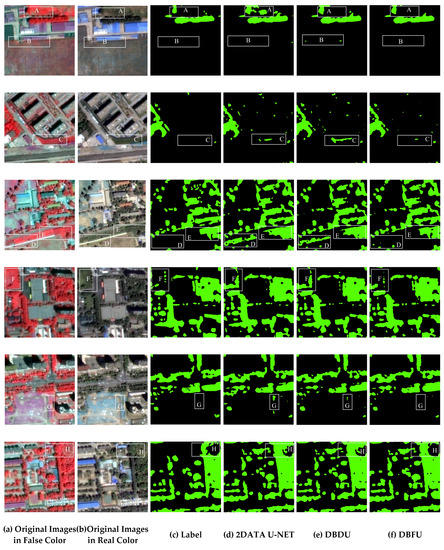
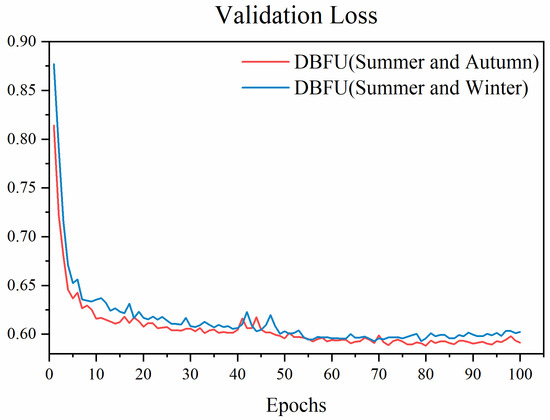
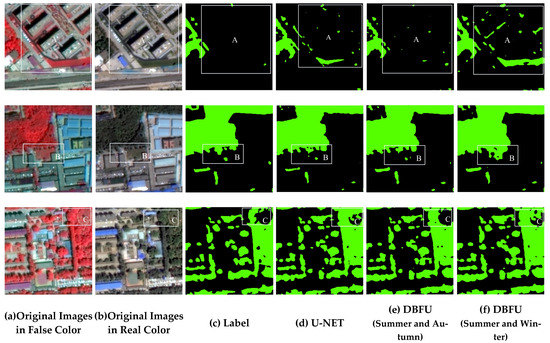
Accurate knowledge of urban forest patterns contributes to well-managed urbanization, but accurate urban tree canopy mapping is still a challenging task because of the complexity of the urban structure. In this paper, a new method that combines double-branch U-NET with multi-temporal satellite images containing phenological information is introduced to accurately map urban tree canopies. Based on the constructed GF-2 image dataset, we developed a double-branch U-NET based on the feature fusion strategy using multi-temporal images to obtain an accuracy improvement with an IOU (intersection over union) of 2.3% and an F1-Score of 1.3% at the pixel level compared to the U-NET using mono-temporal images which performs best in existing studies for urban tree canopy mapping. We also found that the double-branch U-NET based on the feature fusion strategy has better accuracy than the early fusion strategy and decision fusion strategy in processing multi-temporal images for urban tree canopy mapping. We compared the impact of image combinations of different seasons on the urban tree canopy mapping task and found that the combination of summer and autumn images had the highest accuracy in the study area. Our research not only provides a high-precision urban tree canopy mapping method but also provides a direction to improve the accuracy both from the model structure and data potential when using deep learning for urban tree canopy mapping.
Full article
(This article belongs to the Special Issue Remote Sensing of Urban Forests and Landscape Ecology)
►
Show Figures
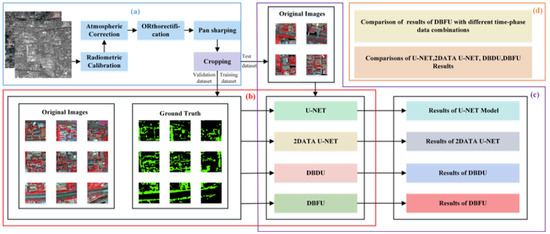
Figure 1


