Remote Sens. 2021, 13(2), 298; https://doi.org/10.3390/rs13020298 - 16 Jan 2021
Cited by 21 | Viewed by 5681
Abstract
Red tide causes significant damage to marine resources such as aquaculture and fisheries in coastal regions. Such red tide events occur globally, across latitudes and ocean ecoregions. Satellite observations can be an effective tool for tracking and investigating red tides and have great
[...] Read more.
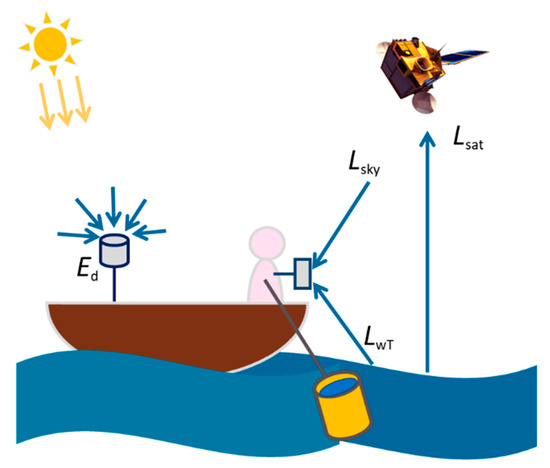
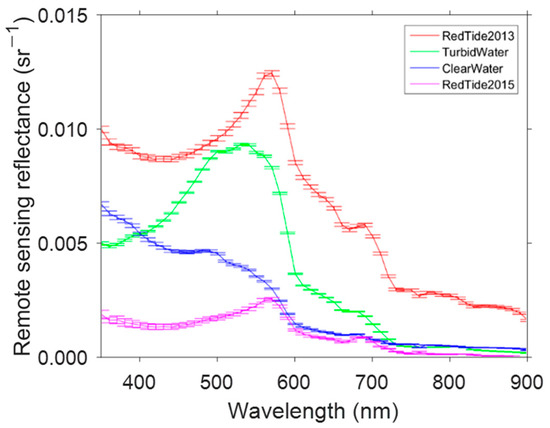
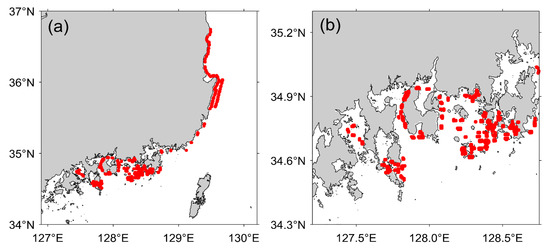
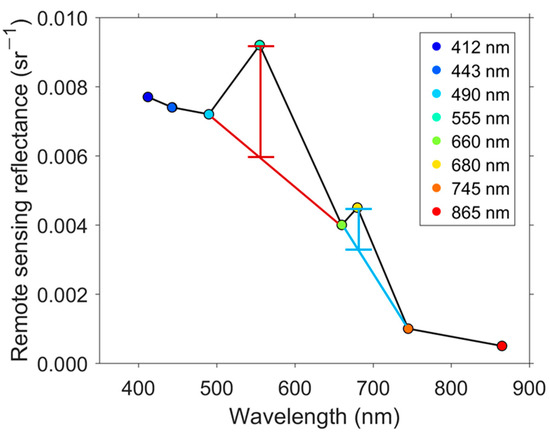
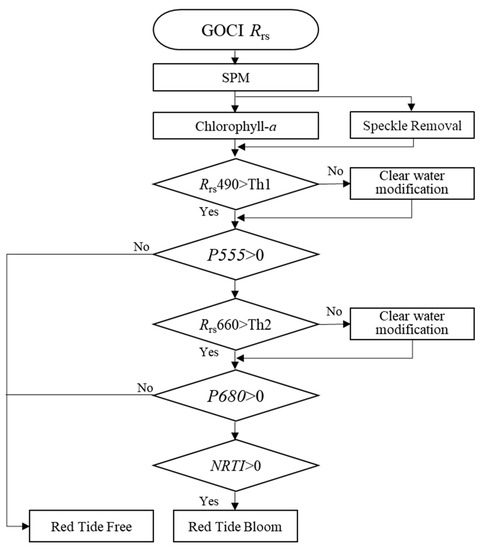
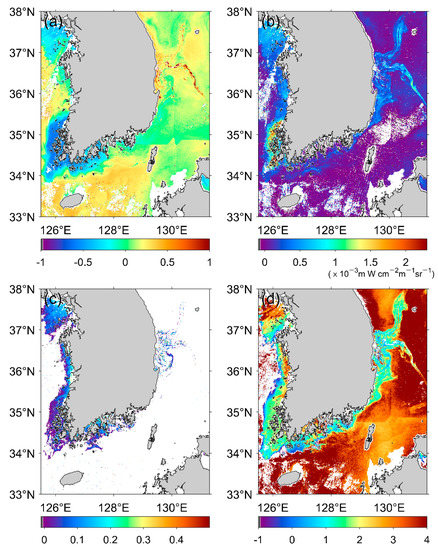
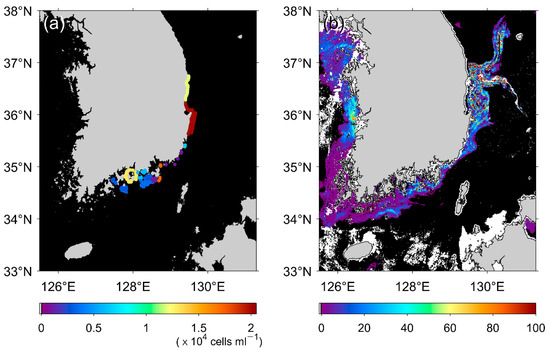
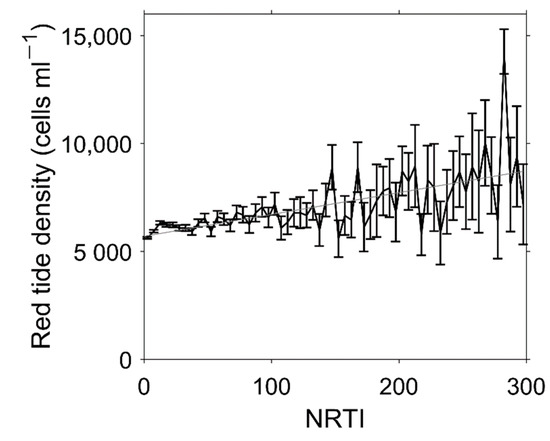
Red tide causes significant damage to marine resources such as aquaculture and fisheries in coastal regions. Such red tide events occur globally, across latitudes and ocean ecoregions. Satellite observations can be an effective tool for tracking and investigating red tides and have great potential for informing strategies to minimize their impacts on coastal fisheries. However, previous satellite-based red tide detection algorithms have been mostly conducted over short time scales and within relatively small areas, and have shown significant differences from actual field data, highlighting a need for new, more accurate algorithms to be developed. In this study, we present the newly developed normalized red tide index (NRTI). The NRTI uses Geostationary Ocean Color Imager (GOCI) data to detect red tides by observing in situ spectral characteristics of red tides and sea water using spectroradiometer in the coastal region of Korean Peninsula during severe red tide events. The bimodality of peaks in spectral reflectance with respect to wavelengths has become the basis for developing NRTI, by multiplying the heights of both spectral peaks. Based on the high correlation between the NRTI and the red tide density, we propose an estimation formulation to calculate the red tide density using GOCI data. The formulation and methodology of NRTI and density estimation in this study is anticipated to be applicable to other ocean color satellite data and other regions around the world, thereby increasing capacity to quantify and track red tides at large spatial scales and in real time.
Full article
(This article belongs to the Special Issue Optical Oceanographic Observation)
►
Show Figures
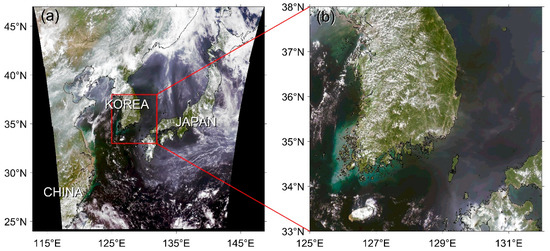
Figure 1

