Next Article in Journal
A Hyphenated Technique based on High-Performance Thin Layer Chromatography for Determining Neutral Sphingolipids: A Proof of Concept
Next Article in Special Issue
Rapid Separation of Elemental Species by Fast Multicapillary Gas Chromatography with Multichannel Optical Spectrometry Detection following Headspace Solid Phase Microextraction
Previous Article in Journal
Surface Characterization of Some Novel Bonded Phase Packing Materials for HPLC Columns Using MAS-NMR Spectroscopy
Previous Article in Special Issue
Determination of Trichloroethylene in Water by Liquid–Liquid Microextraction Assisted Solid Phase Microextraction
 
 
Please note that, as of 1 January 2016, Chromatography has been renamed to Separations and is now published here.
Article

The Evaluation of Magnetic Polymethacrylate-based Microspheres Used for Solid Phase DNA Micro-Extraction

by
Štěpánka Trachtová
1,
Hana Zapletalová
2,3,
Alena Španová
1,
Daniel Horák
4,
Hana Kolářová
2 and
Bohuslav Rittich
1,*
1
Faculty of Chemistry, Brno University of Technology, Purkyňova 118, CZ-612 00 Brno, Czech Republic
2
Department of Medical Biophysics, Faculty of Medicine and Dentistry, Palacký University Olomouc, Hněvotínská 3, CZ-775 15 Olomouc, Czech Republic
3
Faculty of Medicine and Dentistry, Institute of Molecular and Translational Medicine, Palacký University Olomouc, Hněvotínská 5, CZ-775 15 Olomouc, Czech Republic
4
Institute of Macromolecular Chemistry, Academy of Sciences of the Czech Republic, Heyrovský Sq. 2, CZ-162 06 Prague, Czech Republic
*
Author to whom correspondence should be addressed.
Chromatography 2015, 2(2), 156-166; https://doi.org/10.3390/chromatography2020156
Submission received: 21 January 2015 / Revised: 9 March 2015 / Accepted: 12 March 2015 / Published: 2 April 2015
(This article belongs to the Special Issue Solid Phase Micro-Extraction)

Abstract

:
Using magnetic particles as a solid-phase extraction system is the most frequently used micro-technique for DNA isolation. Particles with a complete covering of magnetic cores by a polymer are hence preferred. Quantitative polymerase chain reaction (qPCR) was used for the evaluation of the polymer coating efficiency of hydrophilic magnetic poly(2-hydroxyethyl methacrylate-co-glycidyl methacrylate) (P(HEMA-co-GMA)) and poly(glycidyl methacrylate) (PGMA) microspheres with/without carboxyl groups. The inhibition effect of magnetic microspheres was identified by the shift in Cq values (ΔCq) after the addition of different amounts of microspheres to PCR mixtures. With the increase of microsphere concentrations, the shift in Cq values to higher values was usually observed. P(HEMA-co-GMA) microspheres containing carboxyl groups extinguished the fluorescence at concentrations over 2 mg mL−1 in a PCR mixture without any influence on the synthesis of PCR products. No PCR products (inhibition of DNA amplification) were detected in the presence of more than 0.8 mg mL−1 in the PCR mixture of PGMA microspheres. Atomic force microscopy (AFM) was used for the determination of the surface morphology of the microspheres. The microspheres were spherical, and their surface was non-porous.

1. Introduction

Amplification of nucleic acids using polymerase chain reaction (PCR) has become a powerful diagnostic tool for the identification of microorganisms in foods [1,2,3,4], soil communities [5], clinical samples [6], forensic analysis [7], etc. Usually, there is no problem with the amplification of DNA isolated from pure bacterial cultures. Problems occur especially when complex biological samples containing PCR inhibitors are analyzed. Inhibition can arise from endogenous and exogenous sources [8,9,10].
The presence of PCR inhibitors (of unknown amounts and compositions) in DNA samples causes a number of problems, ranging from reduced amplification efficiency and assay sensitivity to complete reaction failure (false-negative results). Little is known about the mechanisms of inhibition. The three potential mechanisms include: (1) interaction of the inhibitor with the DNA; (2) binding to the polymerase; and (3) interaction with the polymerase during primer extensions [11]. The effects of the inhibitors can be reduced by the selection of an appropriate nucleic acid isolation method. Numerous solid phase systems involving different micro- and nano-sized magnetic carriers and appropriate buffer systems have been used for DNA isolation [12,13]. The presence of interfering compounds released from magnetic particles decreased the PCR sensitivity or led to false-negative results [14].
Hydrophilic magnetic poly(2-hydroxyethyl methacrylate-co-glycidyl methacrylate) (P(HEMA-co-GMA)) and poly(glycidyl methacrylate) (PGMA) microspheres containing different contents of carboxyl groups were found suitable for the isolation of high-molecular-weight bacterial DNA directly from crude cell lysates of different complex food samples containing PCR inhibitors. The differences among magnetic microspheres reflect the influence of not only the various contents of carboxyl groups on the microspheres, but also their specific morphology [15]. Atomic force microscopy (AFM) was used for the characterization of the magnetic nanoparticles [16] and cells [17,18].
Conventional or quantitative PCR was used for the determination of the influence of components used in particle preparation on the PCR inhibition [19,20]. The inhibition effect of some samples (e.g., ancient DNA extracts and surface water) was identified by the shift in the Cq (ΔCq) relative to an uninhibited reaction [21,22]. According to our knowledge, qPCR for the evaluation of polymer coating efficiency of magnetic particles has not yet been reported.
The aim of the present study was to evaluate the efficiency of iron oxide embedding in P(HEMA-co-GMA) and PGMA microspheres using quantitative polymerase chain reaction (qPCR). The inhibition effect of magnetic microspheres was identified by the shift in Cq (ΔCq) after the addition of different amounts of microspheres to PCR mixtures. The morphology of magnetic microspheres was determined by AFM.

2. Materials

2.1. Chemicals and Equipment

The DNA of Escherichia coli (D4889, Sigma-Aldrich, St. Louis, MI, USA) was used as a template in real-time PCR. The PCR primers were synthesized by Generi Biotech (Hradec Králové, Czech Republic); ethidium bromide was supplied by Sigma-Aldrich; and the DNA marker (100 bp ladder) for gel electrophoresis was from Malamité (Moravské Prusy, Czech Republic). Real-time PCR was performed using a SYTO-9 qPCR2xMaster Mix (Top-Bio, Prague, Czech Republic). Agarose was purchased from Serva (Heidelberg, Germany). P(HEMA-co-GMA) and PGMA microspheres were prepared using methods published earlier [23,24]. Briefly, the microspheres were prepared by single-step dispersion polymerization in the presence of sterically- or electrostatically-stabilized colloidal magnetite or maghemite. The hydroxy groups of the microspheres were oxidized with a 2% aqueous solution of potassium permanganate under acidic conditions (2 M sulfuric acid) [24]. The content of carboxyl groups in the microspheres was determined by titration using 0.1 M NaOH on a 799 GPT Titrino titrator (Metrohm, Switzerland) after ion exchange with a 10% aqueous solution of BaCl2. The properties of the microspheres are given in Table 1. The number- and weight-average diameter (Dn and Dw) was determined from scanning electron micrographs (SEM) by measuring the particle size of at least 500 microspheres using Atlas software (Tescan; Brno, Czech Republic). Uniformity was characterized by the polydispersity index (PDI = Dw/Dn, where Dw = ΣniDi4niDi3 and Dn = ΣniDini). The commercially supplied chemicals and solvents were of analytical grade.
Table 1. The characteristics of the magnetic P(HEMA-co-GMA) and PGMA microspheres.
MicrosphereFe content (%)-COOH (mM g −1)Diameter (μm)PDI *
P(HEMA-co-GMA) (A1)5.940.002.861.04
P(HEMA-co-GMA) (A2)5.940.412.861.04
PGMA (B1) 5.950.000.741.07
PGMA (B2) 5.950.420.741.07
PGMA (C) 2.12.611.161.05
PGMA (D) 10.020.762.231.81
* PDI, polydispersity index (ratio of weight-to-number average particle diameter).
Magnetic microspheres were separated using a Dynal MPC-M magnetic particle concentrator (Oslo, Norway). DNA was amplified in a Rotorgene 6000 DNA thermal cycler (Corbett Research, Sydney, Australia). Agarose gel electrophoreses were carried out using an electrophoresis unit (Bio-Rad, Hercules, CA, USA). The PCR products were visualized on an EB-20E UV transilluminator from UltraLum (Claremount, CA, USA) at 305 nm.
The microsphere surface topology was studied using an atomic force microscope (AFM) BioScope Catalyst from Bruker (Santa Barbara, CA, USA) mounted on a stage interfacing with an Olympus XI81 inverted optical field microscope (Tokyo, Japan).

2.2. Methods

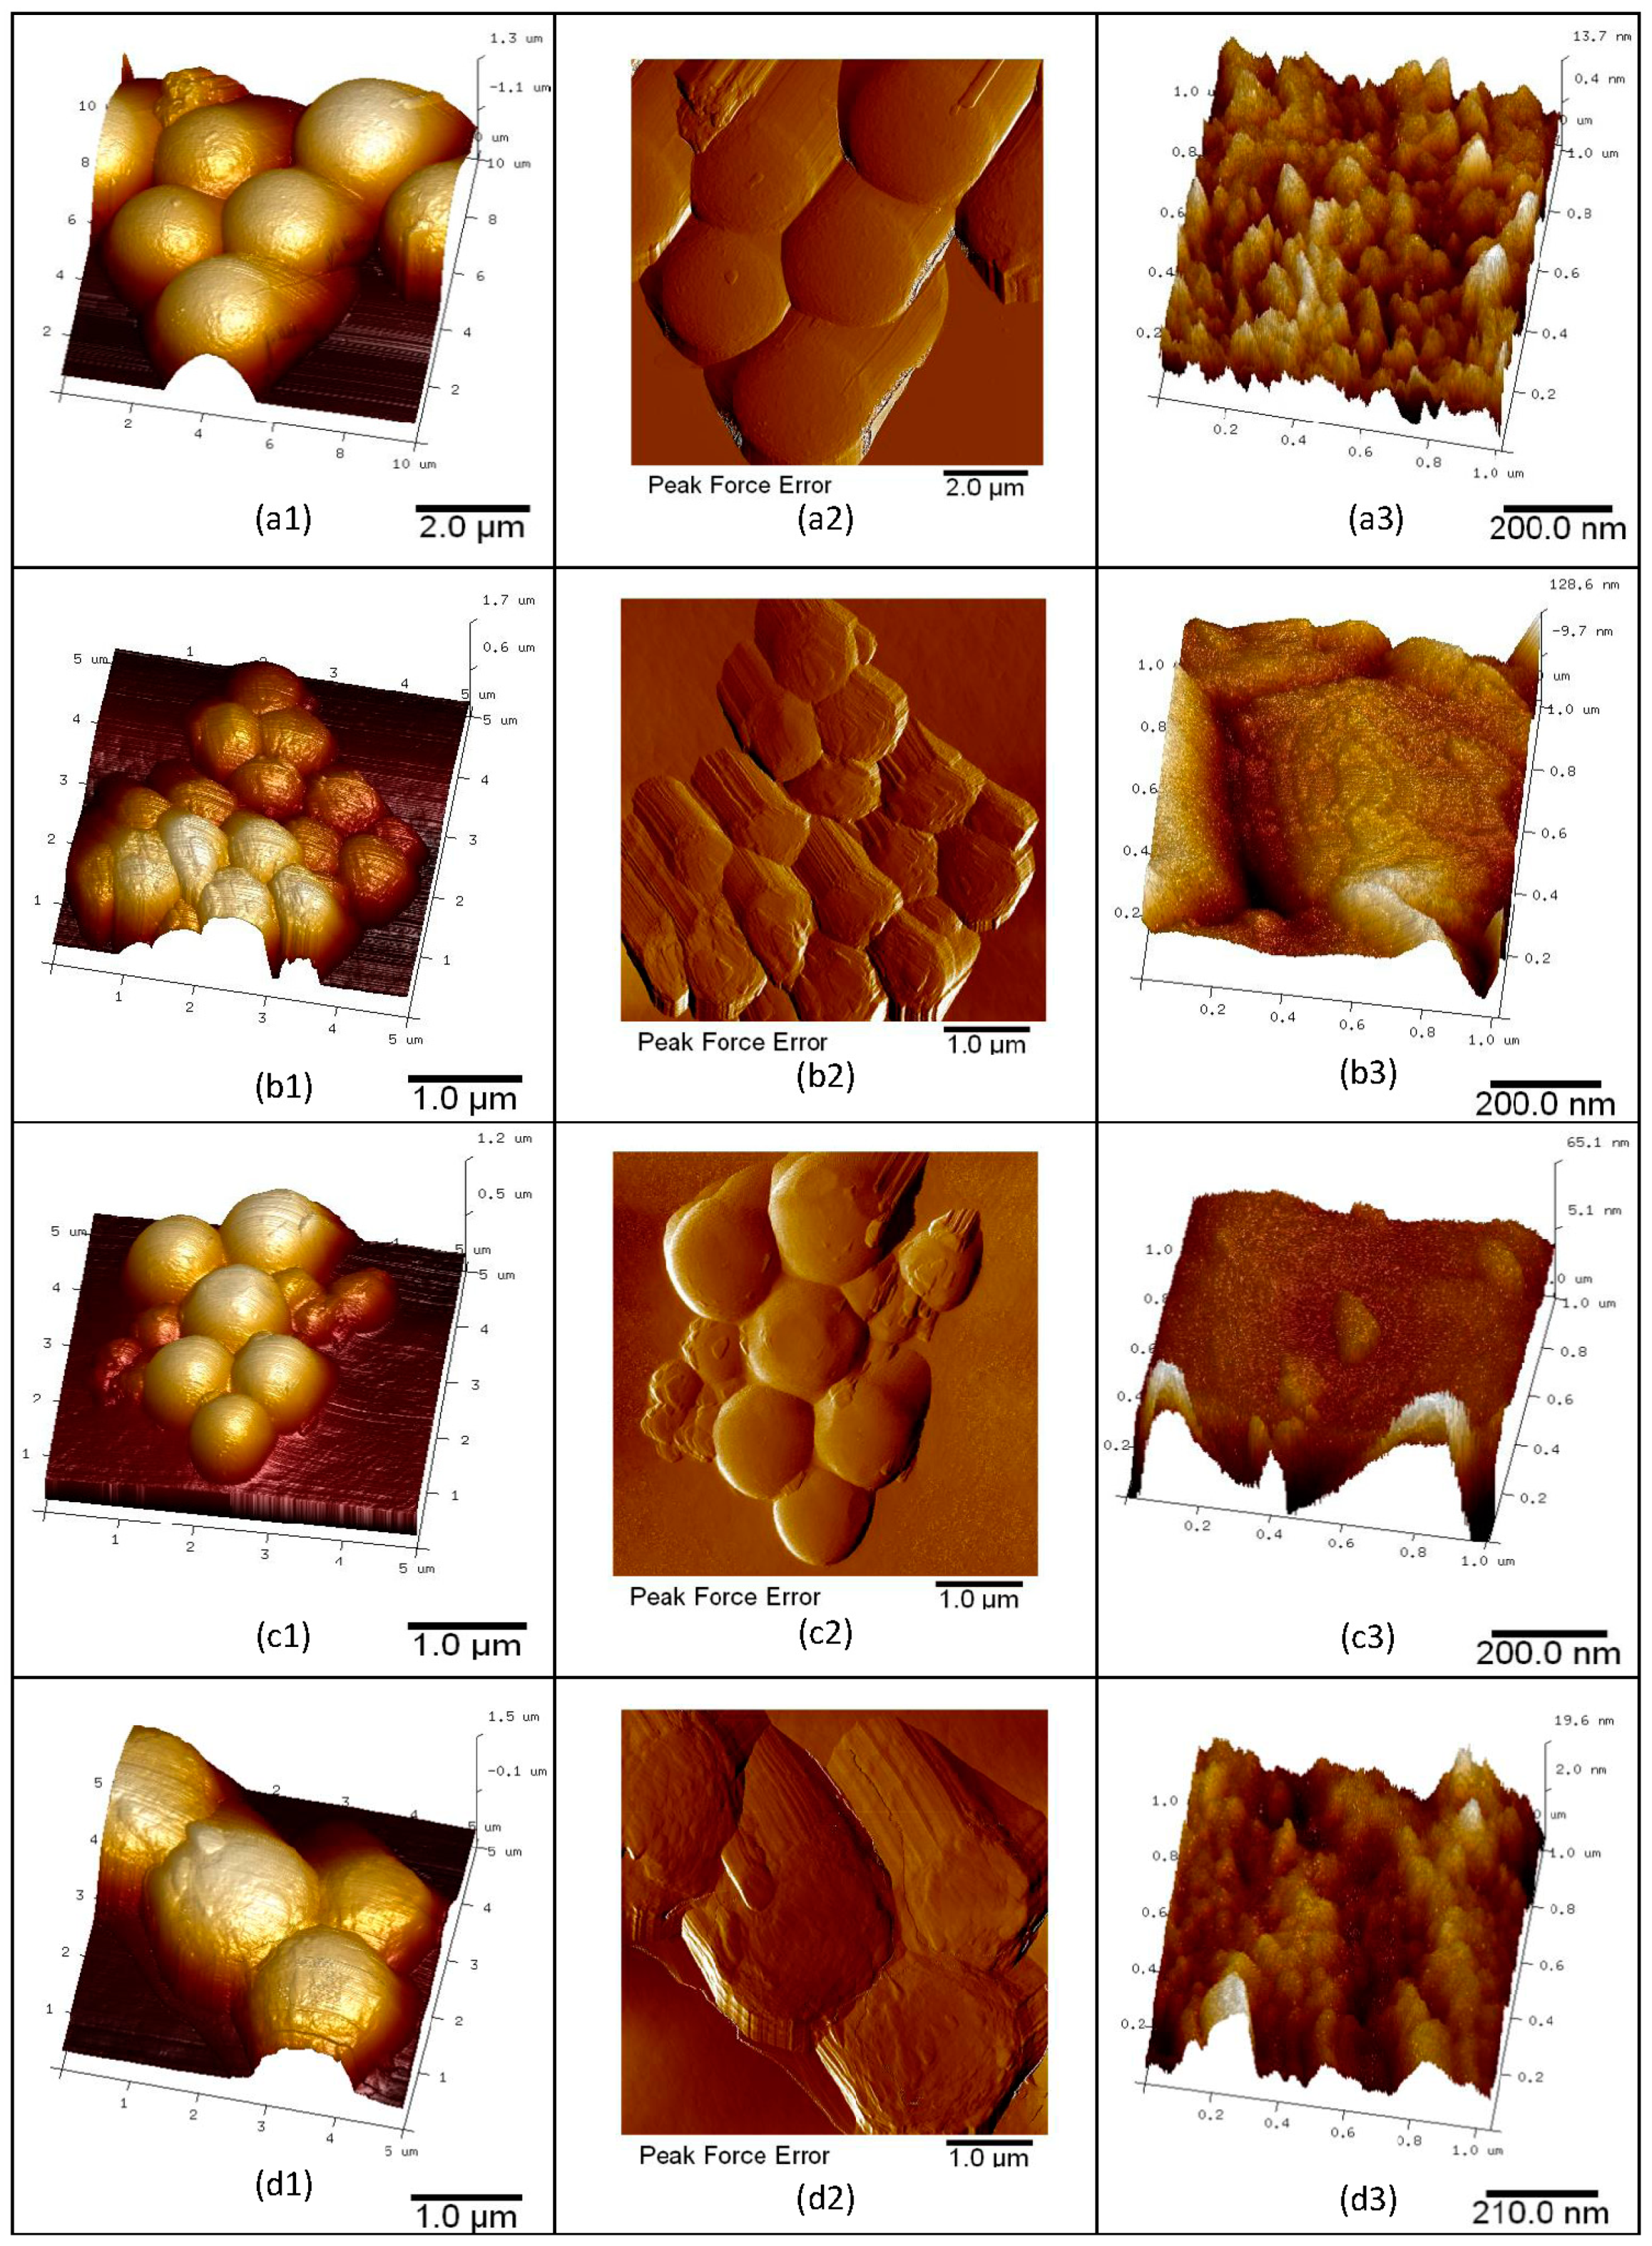
2.2.1. Imaging of Magnetic Particles

Magnetic microspheres were dispersed in deionized water to a concentration 2 mg mL−1 using a vortex. A 3-μL drop of the microsphere suspension was deposited on the 0.5% agarose-coated cover glass at room temperature and allowed to dry. The AFM data were taken by a silicon nitride cantilever with a resonant frequency of 50–90 kHz and a stiffness of 0.4 N m−1, operating in the ScanAsyst imaging mode in air at room temperature. The scan rate was set to 0.3 Hz; the images were acquired at height; and the peak-force error mode worked simultaneously at the highest possible scanning resolution allowed, i.e., 512 × 512 pixels, scan size 5 × 5 µm2 and 10 × 10 µm2, zoomed area of 1 × 1 µm2. Data of twelve magnetic microspheres were analyzed. The root mean square surface roughness (RMS) of four different surface areas of 200 × 200 µm2 were determined for each analyzed particle. All AFM data were flattened by means of the NanoScope Analysis 1.5 software with self-optimizing technology controlling the acting forces in each pixel of image.

2.2.2. Quantitative PCR

Amplification was performed with Feub and Reub primers specific to the domain Bacteria [25]. The reaction involved 12.5 µL of qPCR 2 × SYTO-9 Master mixture (Top-Bio, Czech Republic), 1 µL of each primer (10 pg μL−1), 1 µL of template DNA (10 ng μL−1), PCR grade water and the appropriate amount of the microspheres. The final volume of the PCR mixture was 25 µL. The amplification consisted of an initial denaturation period of 95 °C for 5 min (hot start), 30 s of denaturation at 95 °C, for 30 s of primer annealing at 55 °C and 30 s of extension at 72 °C. The last extension step at 72 °C was prolonged to 5 min, and the number of cycles was 30.
The software supplied with the quantitative PCR, a Rotorgene 6000 cycler (Version 1.7.87), was used for statistical evaluation of the data. The reaction efficiency (r. e.) was calculated using linear regression from the slope (M) of the calibration curve using the equation r. e. = 10−1/M − 1. The crossing point (threshold cycle, Cq) was calculated as the cycle number at which the reaction reached the threshold value (Tv) at the beginning of the exponential phase of the amplification curve [26]. Cq was obtained from six linear dilution series (100 ng–1 pg DNA in PCR mixture) as the template (control sample) at the beginning of the exponential phase of the amplification curve, e.g., the PCR cycle at which the target can be quantified in a given sample.
The inhibition effect of magnetic microspheres was evaluated by the shift in Cq (ΔCq) (quantification cycle) values [27] between Cq values determined for DNA template (uninhibited reaction) and after the addition of different amounts of the tested microspheres to the PCR mixtures. The real-time PCR results were verified by detection of specific PCR products of the domain Bacteria (466 bp) using agarose gel electrophoresis (1.8% agarose) in 0.5 × TBE buffer (45 mM boric acid, 45 mM Tris-base and 1 mM EDTA; pH 8.0).

3. Results and Discussion

3.1. Determination of Microsphere Surface Morphology

The size and particle size distribution of the magnetic microspheres were characterized by SEM (Table 1). The number-average particle diameter of the P(HEMA-co-GMA) microspheres was 2.86 µm, and the PDI was 1.04, suggesting that the particles were monodisperse; for the PGMA microspheres, they varied from 0.74 to 2.23 µm, and their particle size distribution, expressed as the polydispersity index (PDI), varied from 1.05 to 1.81. The shape and the morphology of the surfaces of P(HEMA-co-GMA) (A1) and PGMA (B2), (C) and (D) microspheres are characterized in Figure 1 using AFM. Although the peak force error data do not correspond with the topography of the surface sample, they reveal fine details of the imaged structure, such as ripples or granular irregularities. This also provides a very good contrast between surface sub-phases with various hardness and stiffness. Only sporadic irregularities occur on symmetric and smooth particle surfaces.
We can conclude that the diameters of analyzed magnetic microspheres measured with AFM (full width at half-maximum height (FWHM of line profile)) in the central part of particle are comparable to the SEM results (Table 1; Figure 1, first column), with a relatively narrow size distribution. The protracted shape of particles visible mainly in peak force error images (Figure 1, second column) is a non-detachable artefact due to convolution of the microspheres and the AFM tip. The third column in Figure 1 represents the zoomed surface area of one scanned particle, where slight differences among magnetic particles reflect different sizes and a fine surface structure. The vertical height data presented in third column were also used to evaluate the root mean square surface roughness (RMS). The roughest surface was observed on PGMA (B2) microspheres with RMS = 6.0 ± 1.5 nm, the smoothest and homogenous surface was seen on PGMA (C) microspheres with RMS = 2.4 ± 0.6 nm, PGMA (D) with RMS = 2.6 ± 0.9 nm and P(HEMA-co-GMA) (A1) with RMS = 3.0 ± 0.4 nm.
The AFM results confirmed that the magnetic microspheres were spherical with a relatively smooth surface without pores and gaps. No distinctive differences in the fine microsphere surface structure were observed.

3.2. Microsphere Interference in Quantitative PCR

Localization of iron oxide inside the particles is important from the point of view of their application in molecular diagnostics, as magnetite cores can partially inhibit the PCR course or give false-negative results [14]. First, the PCR efficiency of the target DNA was determined. The input of template DNA was plotted against the corresponding Cq. The slope of the best fit lines was within the acceptable range from −3.9 to −3.0 [26]. The inhibition effect of different concentrations of microspheres (0–5 µL of 2 and 20 mg mL−1) on the PCR course was determined. The reaction efficiencies were approximately the same for the DNA standard curve (100 ng–1 pg/25 mL PCR mixture) and DNA mixed with the microspheres. Thus, the inhibition effect of microspheres was identified by the shift in Cq (ΔCq) (which was originally used as a quantitative measure of the DNA target number [27] relative to an uninhibited reaction). The results are given in Table 2. The shift in Cq values (ΔCq) for a 2-mg mL−1 concentration of microspheres ranged from 0.9 to 3.4; the ΔCq shift for a concentration of 20 mg mL−1 of microspheres was one order higher (with the exception of P(HEMA-co-GMA) (A2) and PGMA (B1) microspheres) or the inhibition of amplification was detected. Therefore, the interference with PCR was caused by carboxyl group-containing P(HEMA-co-GMA) (A2), PGMA (C) and PGMA (D) microspheres (from 0.8 mg mL−1). The PCR inhibition may result from indirect inhibition by competition for particular reaction components [28].
Figure 1. AFM images of magnetic microspheres in ScanAsyst mode: a, P(HEMA-co-GMA) (A1); b, PGMA (B2); c, PGMA (C); d, PGMA (D); a1,b1,c1,d1, AFM view of microspheres in height channel in 3D projection; a2,b2,c2,d2, AFM view of microspheres acquired in the peak force error channel imaged in 2D projection; a3,b3,c3,d3, zoomed detail of the scanned microsphere surface in height mode in 3D projection.
Chromatography 02 00156 g001
Table 2. Cq values for different concentrations of magnetic P(HEMA-co-GMA) and PGMA microspheres.
MicrosphereMicrosphere concentration (mg mL−1)Cq values
microsphere volume (µL 25 µL−1 PCR mixture)
0.00.51.02.55.0
P(HEMA-co-GMA) (A1)2012.8 ± 0.614.1 ± 0.315.3 ± 0.417.2 ± 0.627.5 ± 5.9
211.8 ± 0.011.9 ± 0.012.4 ± 0.012.7 ± 0.013.1 ± 0.0
P(HEMA-co-GMA) (A2) *2012.9 ± 0.215.1 ± 0.415.7 ± 2.112.1 ± 1.210.4 ± 0.7
212.6 ± 0.113.2 ± 0.213.5 ± 0.314.8 ± 0.115.1 ± 0.3
PGMA (B1)2013.0 ± 0.113.6 ± 0.213.7 ± 0.214.3 ± 0.314.7 ± 0.2
212.6 ± 0.012.9 ± 0.312.7 ± 0.013.2 ± 0.013.5 ± 0.0
PGMA (B2) *2012.9 ± 0.314.9 ± 0.915.8 ± 1.122.8 ± 4.816.0 ± 1.2
212.8 ± 0.213.4 ± 0.014.4 ± 0.015.9 ± 0.415.8 ± 2.4
PGMA (C) *2012.6 ± 0.613.6 ± 1.1nnn
212.2 ± 0.212.3 ± 0.412.7 ± 0.713.1 ± 1.015.6 ± 3.4
PGMA (D) *2012.8 ± 0.414.9 ± 0.715.4 ± 0.623.1 ± 5.5n
212.3 ± 0.112.7 ± 0.313.2 ± 0.013.6 ± 0.014.0 ± 0.1
* Carboxyl group-containing microspheres. n, no amplification detected (complete inhibition of amplification). Ten nanograms of DNA 25 µL−1 PCR mixture were used.
The course of real-time PCR was checked in parallel by detection of PCR products using agarose gel electrophoresis. P(HEMA-co-GMA) (A2) microspheres extinguished fluorescence at a concentration of 4 mg mL−1 (100 µg 25 μL−1 PCR mixture), but synthesis of the PCR products was not influenced. The same process was observed for the concentration of 100 µg of PGMA (B2) microspheres. The SYTO 9 fluorescence stain belongs to the class of substituted unsymmetrical cyanine dyes, which have multiple binding functional groups inducing charge interactions with the phosphate backbone [29]. As the SYTO-9 does not interfere with the PCR course [30], the inhibition of fluorescence can be caused by the interaction of the stain with the microsphere surface possessing negative carboxyl groups. The decrease of Cq was observed for the P(co) (A2) and PGMA (B2) microspheres containing carboxyl groups (from 2 and 4 mg mL−1, resp.) (see Table 2). The intensity of fluorescence signals (PCR amplification curves) and their slopes were changed, and Cq values were thus calculated under conditions different from the Cq values obtained at a low microsphere concentrations. Changes in the fluorescence measurements associated with Cq calculation will result in changes of Cq values. Thus, comparison of Cq values is meaningful in experiments performed under the same amplification conditions only.
No fluorescence was observed and no PCR products were detected in the presence of high concentrations of PGMA (C) microspheres (0.8 mg mL−1) and PGMA (D) microspheres (4 mg mL−1). Here, other mechanisms of PCR inhibition can be assumed. It has been known from the literature that non-specific protein adsorption occurs on the surface of the polymer particles containing carboxyl groups [31,32]. The presence of COOH groups on the microsphere surface had a negative effect on the PCR course; on the contrary, a reduced concentration of COOH groups was beneficial to the DNA amplification [32]. The inhibition effect of the microspheres containing carboxyl groups can be caused by the adsorption of DNA polymerase on the microsphere surface. According to the literature, various polymerases can tolerate different inhibitory substances and have a distinctive ability to overcome the inhibition effect [33]. The effect of Mg2+ ion concentrations on the PCR course in the presence of the tested microspheres was studied with the concentrations of Mg2+ ions varying from 2.5 to 12.0 mM. The assumption that the negative effect of COOH groups on the PCR course can be eliminated by increased Mg2+ concentrations was not confirmed. It is supposed that a combination of both of the above-mentioned inhibition mechanisms has to be considered.
It should be noted that these observations do not influence the amplification of DNA isolated from complex biological samples containing PCR inhibitors using the magnetic microspheres tested, as they are magnetically separated from the DNA solution after elution. The use of a strong magnet is important for good microsphere separation [15].

4. Conclusion

The RT-PCR based on the Cq shifts after the addition of different amounts of microspheres to PCR mixtures is a suitable method for the evaluation of the inhibition effect of magnetic microspheres on the PCR course. Microspheres functionalized with carboxyl groups interfered with the quantitative PCR. The inhibition effect of microspheres containing negatively-charged carboxyl groups can be caused by the interaction of the fluorescence stain with the microsphere surface and/or by adsorption of DNA polymerase. Different mechanisms must be considered for this type of microspheres. AFM was used for the determination of the morphology of the magnetic P(HEMA-co-GMA) and PGMA microspheres, indicating that the surface of the tested microspheres was non-porous.

Acknowledgements

The financial support of the Grant Agency of the Czech Republic (GACR) Project No. 13-3284 OP and in part by grant Nos. P206/12/0381 (GACR), NPU I LO 1304 and NPU 7778/2014 from the Czech Ministry of Education, Youth and Sports and IGA MZČR NT 14060-3/2013 from the Czech Ministry of Health is gratefully acknowledged. We are obliged to Mr. Ladislav Červený for his kind language revision.

Author Contributions

Štěpánka Trachtová carried out of qPCR experiments and analysed results, Hana Zapletalová carried out of AFM experiments and analysed results, Alena Španová designed the experiments and interpreted the data on q PCR, Daniel Horák synthetised magnetic microspheres and analysed the data, Hana Kolářová analysed the data on AFM, Bohuslav Rittich designed the experiments, interpreted the data and prepared the manuskript.

Conflicts of Interest

The authors have declared no conflict of interest.

References

  1. Chua, T.; Bhagwat, A.A. A rapid and simple DNA extraction procedure to detect Salmonella spp. and Listeria monocytogenes from fresh produce using real-time PCR. Food Anal. Methods 2009, 2, 96–101. [Google Scholar] [CrossRef]
  2. Martinez, N.; Martin, M.C.; Herrero, A.; Fernandez, M.; Alvarez, M.A.; Ladeto, V. qPCR as a powerful tool for microbial food spoilage quantification: Significance for food quality. Trends Food Sci. Technol. 2011, 22, 367–376. [Google Scholar] [CrossRef] [Green Version]
  3. Skelin, A.; Mrkonjić Fuka, M.; Čanžek Majhenić, A.; Redžepović, S.; Samaržija, D.; Bogović Matijasić, B. Phenotypic and genotypic characterization of indigenous Lactobacillus community from traditional Istrian ewe's cheese. Food Technol. Biotechnol. 2012, 50, 362–370. [Google Scholar]
  4. Boyer, M.; Combrisson, J. Analytical opportunities of quantitative polymerase chain reaction in dairy microbiology. Int. Dairy J. 2013, 30, 45–52. [Google Scholar] [CrossRef]
  5. Kuramae, E.E.; Yergeau, E.; Wong, L.C.; Pijl, A.S.; van Veen, J.A.; Kowalchuk, G.A. Soil characteristics more strongly influence soil bacterial communities than land-use type. FEMS Microbiol. Ecol. 2012, 79, 12–24. [Google Scholar] [CrossRef] [PubMed]
  6. Shuga, J.; Zeng, Y.; Novak, R.; Mathies, R.A.; Hainaut, P.; Smith, M.T. Selected technologies for measuring acquired genetic damage in humans. Environ. Mol. Mutagen. 2010, 51, 851–870. [Google Scholar] [CrossRef] [PubMed]
  7. Kitpipit, T.; Chotigeat, W.; Linacre, A.; Thanakiatkrai, P. Forensic animal DNA analysis using economical two-step direct PCR. Forensic Sci. Med. Pathol. 2014, 10, 29–38. [Google Scholar] [CrossRef] [PubMed]
  8. Schrader, C.; Schielke, A.; Ellerbroek, L.; Johne, R. PCR inhibitors–occurrence, properties and removal. J. Appl. Microbiol. 2012, 113, 1014–1026. [Google Scholar] [CrossRef] [PubMed]
  9. Kenk, M.; Panter, S.; Engler-Blum, G.; Bergemann, J. Sensitive DNA-based allergen detection depends on food matrix and DNA isolation method. Eur. Food Res. Technol. 2012, 234, 351–359. [Google Scholar] [CrossRef]
  10. Alaeddini, R. Forensic implications of PCR inhibition—A review. Forensic Sci. Int. Gen. 2012, 6, 297–305. [Google Scholar] [CrossRef]
  11. Opel, K.L.; Chung, D.; McCord, B.R. A Study of PCR Inhibition Mechanisms Using Real Time PCR. J. Forensic Sci. 2010, 55, 25–33. [Google Scholar] [CrossRef] [PubMed]
  12. Sun, N.; Deng, C.; Liu, Y.; Zhao, X.; Tang, Y.; Liu, R.; Xia, Q.; Yan, W.; Ge, G. Optimization of influencing factors of nucleic acid adsorption onto silica-coated magnetic particles: Application to viral nucleic acid extraction from serum. J. Chromatogr. A 2014, 1325, 31–39. [Google Scholar] [CrossRef] [PubMed]
  13. Rödiger, S.; Liebsch, C.; Schmidt, C.; Lehmann, W.; Resch-Genger, U.; Schedler, U.; Schierack, P. Nucleic acid detection based on the use of microbeads: A review. Microchim. Acta 2014, 181, 1151–1168. [Google Scholar] [CrossRef]
  14. Španová, A.; Rittich, B.; Horák, D.; Lenfeld, J.; Prodělalová, J.; Sučiková, J.; Štrumcová, S. Immunomagnetic separation and detection of Salmonella cells using newly designed carriers. J. Chromatogr. A 2003, 1009, 215–221. [Google Scholar] [CrossRef] [PubMed]
  15. Trachtová, Š.; Španová, A.; Tóth, J.; Prettl, Z.; Horák, D.; Gyenis, J.; Rittich, B. Solid-phase DNA isolation from food matrices using hydrophilic magnetic microspheres. Food Bioprod. 2014, in press. [Google Scholar]
  16. Zieliński, B.; Skumiel, A.; Józefczak, A.; Vandeweert, E. Determination of magnetic particle size using ultrasonic, magnetic and atomic force microscopy methods. Mol. Quant. Acoust. 2005, 26, 309–316. [Google Scholar]
  17. Moskalenko, A.V.; Yarova, P.L.; Gordeev, S.N.; Smirnov, S.V. Single protein molecule mapping with magnetic atomic force microscopy. Biophys. J. 2010, 98, 478–487. [Google Scholar] [CrossRef] [PubMed]
  18. Müller, D.J.; Dufrêne, Y.F. Atomic force microscopy: A nanoscopic window on the cell surface. Trends Cell Biol. 2011, 21, 461–469. [Google Scholar] [CrossRef] [PubMed]
  19. Španová, A.; Rittich, B.; Beneš, M.J.; Horák, D. Ferrite supports for isolation of DNA from complex samples and polymerase chain reaction amplification. J. Chromatogr. A 2005, 1080, 93–98. [Google Scholar] [CrossRef] [PubMed]
  20. Trachtová, Š.; Kaman, O.; Španová, A.; Veverka, P.; Pollert, E.; Rittich, B. Silica-coated La0.75Sr0.25MnO3 nanoparticles for magnetically driven DNA isolation. J. Sep. Sci. 2011, 34, 3077–3082. [Google Scholar] [CrossRef] [PubMed]
  21. King, C.E.; Debruyne, R.; Kuch, M.; Schwarz, M.C.; Poinar, H.N. A quantitative approach to detect and overcome PCR inhibition in ancient DNA extracts. BioTechniques 2009, 47, 941–949. [Google Scholar] [CrossRef] [PubMed]
  22. Haugland, R.A.; Siefring, S.; Lavender, J.; Varma, M. Influences of sample interference and interference controls on quantification of enterococci fecal indicator bacteria in surface water samples by the qPCR method. Water Res. 2012, 46, 5989–6001. [Google Scholar] [CrossRef] [PubMed]
  23. Horák, D.; Semenyuk, N.; Lednický, F. Effect of the reaction parameters on the particle size in the dispersion polymerization of 2-hydroxyethyl and glycidyl methacrylate in the presence of a ferrofluid. J. Polym. Sci. Pol. Chem. 2003, 41, 1848–1863. [Google Scholar] [CrossRef]
  24. Horák, D.; Rittich, B.; Španová, A. Carboxyl-functionalized magnetic microparticle carrier for isolation and identification of DNA in dairy products. J. Magn. Magn. Mater. 2007, 311, 249–254. [Google Scholar] [CrossRef]
  25. Haarman, M.; Knol, J. Quantitative real-time PCR analysis of fecal Lactobacillus species in infants receiving a prebiotic infant formula. Appl. Environ. Microbiol. 2006, 72, 2359–2365. [Google Scholar] [CrossRef] [PubMed]
  26. Rasmussen, R. Quantification on the LightCycler. In Rapid Cycle Real-time PCR, Methods and Applications; Meuer, S., Wittwer, C., Nakagawara, K., Eds.; Springer Press: Heidelberg, Germany, 2001; pp. 21–34. [Google Scholar]
  27. Heid, C.A.; Stevens, J.; Livak, K.J.; Williams, P.M. Real time quantitative PCR. Genome Res. 1996, 6, 986–994. [Google Scholar] [CrossRef] [PubMed]
  28. Stahlberg, A.P.; Aman, P.; Ridell, B.; Mostad, P.; Kubista, M. Quantitative real-time PCR method for detection of B-lymphocyte monoclonality by comparison of kappa and lambda immunoglobulin light chain expression. Clin. Chem. 2003, 49, 51–59. [Google Scholar] [CrossRef] [PubMed]
  29. Tarnok, A. SYTO dyes and histoproteins—Myriad of applications. Cytom. Part A 2008, 73A, 477–479. [Google Scholar] [CrossRef]
  30. Monis, P.T.; Giglio, S.; Saint, C.P. Comparison of SYTO9 and SYBR Green I for real-time polymerase chain reaction and investigation of the effect of dye concentration on amplification and DNA melting curve analysis. Anal. Biochem. 2005, 340, 24–34. [Google Scholar] [CrossRef] [PubMed]
  31. Koubková, J.; Müller, P.; Hlídková, H.; Plichta, Z.; Proks, V.; Vojtěšek, B.; Horák, D. Magnetic poly(glycidyl methacrylate) microspheres for protein capture. New Biotechnol. 2014, 31, 482–491. [Google Scholar] [CrossRef]
  32. Horák, D.; Hlídková, H.; Trachtová, Š.; Šlouf, M.; Rittich, B.; Španová, A. Evaluation of poly(ethylene glycol)-coated monodispersed magnetic poly(2-hydroxyethyl methacrylate) and poly(glycidyl methacrylate) microspheres by PCR. Eur. Polym. J. 2015. [Google Scholar] [CrossRef]
  33. Monroe, C.; Grier, C.; Kemp, B.M. Evaluating the efficacy of various thermo-stable polymerases against co-extracted PCR inhibitors in ancient DNA samples. Forensic Sci. Int. 2013, 228, 142–153. [Google Scholar] [CrossRef] [PubMed]

