Next Article in Journal
Recent Advances and Uses of Monolithic Columns for the Analysis of Residues and Contaminants in Food
Next Article in Special Issue
The Evaluation of Magnetic Polymethacrylate-based Microspheres Used for Solid Phase DNA Micro-Extraction
Previous Article in Journal
Development of Monolithic Column Materials for the Separation and Analysis of Glycans
Previous Article in Special Issue
Quantification of Carbonyl Compounds Generated from Ozone-Based Food Colorants Decomposition Using On-Fiber Derivatization-SPME-GC-MS
 
 
Please note that, as of 1 January 2016, Chromatography has been renamed to Separations and is now published here.
Article

Determination of Trichloroethylene in Water by Liquid–Liquid Microextraction Assisted Solid Phase Microextraction

by
Mengliang Zhang
and
Peter De B. Harrington
*
Center for Intelligent Chemical Instrumentation, Clippinger Laboratories, Department of Chemistry and Biochemistry, Ohio University, Athens, OH 45701, USA
*
Author to whom correspondence should be addressed.
Chromatography 2015, 2(1), 66-78; https://doi.org/10.3390/chromatography2010066
Submission received: 12 December 2014 / Accepted: 3 February 2015 / Published: 9 February 2015
(This article belongs to the Special Issue Solid Phase Micro-Extraction)

Abstract

:
A method for the determination of trichloroethylene (TCE) in water using portable gas chromatography/mass spectrometry (GC/MS) was developed. A novel sample preparation method, liquid–liquid microextraction assisted solid phase microextraction (LLME–SPME), is introduced. In this method, 20 µL of hexane was added to 10 mL of TCE contaminated aqueous samples to assist headspace SPME. The extraction efficiency of SPME was significantly improved with the addition of minute amounts of organic solvents (i.e., 20 µL hexane). The absolute recoveries of TCE at different concentrations were increased from 11%–17% for the samples extracted by SPME to 29%–41% for the samples extracted by LLME–SPME. The method was demonstrated to be linear from 10 to 1000 ng mL−1 for TCE in water. The improvements on extraction efficiencies were also observed for toluene and 1, 2, 4-trichlorobenzene in water by using LLME–SPME method. The LLME–SPME method was optimized by using response surface modeling (RSM).

1. Introduction

Trichloroethylene (TCE) has been widely used primarily as degreasing solvent by industry, since the 1900s [1]. TCE was considered as one of the most frequently detected organic contaminants in groundwater [2,3]. Various methods have been developed for the determination of TCE including gas chromatography (GC) coupled with either electron capture detectors (ECD) [4,5,6], mass spectrometers (MS) [7,8,9,10], or flame ionization detectors (FID) [11]. Traditional sample preparation methods for TCE such as liquid–liquid extraction and solid phase extraction are labor-intensive and time-consuming [5]. Solid-phase microextraction (SPME) is suitable for the extraction of volatile organic compounds (VOCs) and has been introduced for the analysis of TCE in recent years [6,7,9,10,11]. Solid phase microextraction was devised by Pawliszyn and co-workers in 1989 [12] and has been widely used for food, environmental, and bioanalytical applications [13]. As a volatile compound, TCE is generally extracted from the sample headspace with faster extraction times and improved selectivity [14]. The condensed phase, the headspace gas phase, and the SPME polymer film are involved in a regular headspace SPME process and the diffusion of analytes happens across two interfaces, the condensed/gas interface and the gas/polymer interface [15]. The extraction efficiency is limited by mass transfer between the two interfaces, especially between the condensed/gas interface [15]. Once the extraction conditions; such as extraction temperature, extraction time, sample agitation, pH, ionic strength, volume, etc.; for an analyte are optimized, it is difficult to improve the extraction efficiency further. A widely accepted standard by researchers for SPME method development is that the amount of organic solvents in the sample matrix should be kept to a minimum [16]. However, it is not always true. In our study, we found by introducing a microliter quantity of organic solvent that the extraction efficiency of SPME could be significantly improved. TCE in water was extracted by the liquid–liquid microextraction assisted headspace SPME (LLME–SPME) and was determined with a portable GC/MS instrument. A similar success for the improvement on the extraction efficiency was also found for the extraction of toluene and 1,2,4-trichlorobenzene (TCB) from water by LLME–SPME.

2. Materials and Methods

2.1. Reagents and Materials

Analytical grade trichloroethylene (TCE, ≥99.5%), toluene, 1, 2, 4-trichlorobenzene (TCB), benzene, sodium chloride (NaCl), sodium sulfate (Na2SO4), SPME fibers coated with polydimethylsiloxane (PDMS, 100 µm film thickness), carboxen/PDMS (75 µm film thickness), or PDMS/divinylbenzene (PDMS/DVB, 65 µm film thickness), 20-mL headspace glass vials, and crimp seals with PTFE/silicone septa were obtained from Sigma-Aldrich Co. LLC. (St. Louis, MO, USA). Deuterated TCE (TCE-d) was purchased from C/D/N Isotopes INC. (Pointe-Claire, Quebec, Canada).
TCE standard solutions in acetonitrile for calibration were prepared at the following concentrations: 5, 15, 50, 150, and 500 µg mL−1. Water samples for calibration and validation were prepared by adding 20 µL of the TCE standard solutions in acetonitrile to 10 mL D.I. water or groundwater. This procedure yields the final concentrations of 10, 30, 100, 300, and 1000 ng mL−1. The concentration of TCE-d solution as the internal standard was 300 ng mL−1.

2.2. Instruments

The portable TRIDION-9 GC-TMS instrument (Torion Technologies, American Fork, UT, USA) comprises a low thermal mass (LTM) GC and a miniature toroidal ion trap mass analyzer with a disposable helium cartridge and rechargeable battery. In this study, the column was an MXT-5, 5 m × 0.1 mm i.d. capillary column chemically bonded with 5% diphenyl/95% dimethyl polysiloxane and 0.4 µm film thickness. The injection port was held at 270 °C and split mode was used with a split ratio of 1:10. The oven temperature was programmed as follows: 50 °C, hold for 10 s, ramp at 2 °C s−1 to 250 °C, hold for 10 s. A constant helium flow of 1.0 mL min−1 was used and the total GC run time was 2 min. The transfer line and ion source temperatures were both maintained at 270 °C. The mass spectrometer was operated in positive ion electron ionization (EI) mode at 70 eV and mass spectra at full scan mode with the scan range from mass-to-charge ratio (m/z) 49 to 527 were collected starting from 0.39 min after injection.
A Thermo Finnigan PolarisQ quadrupole ion trap mass spectrometer/Trace GC system with a Triplus AS2000 autosampler (San Francisco, CA, USA) was used for the extraction method optimization. The bench-top GC/MS system was controlled by the XCalibur software version 2.0.7 provided by Thermo. The GC separation was accomplished on a SHRXI-5MS capillary column (5% diphenyl/95% dimethylpolysiloxane crosslinked, 30 m × 0.25 mm id, 0.1 µm film thickness) from Shimadzu Scientific Instruments (Columbia, MD, USA). The injection port was held at 270 °C using splitless mode. The oven temperature was programmed as follows: 40 °C, hold for 2 min, ramp at 40 °C min−1 to 250 °C, hold for 10 min. A constant helium flow of 1.0 mL min−1 was used. The transfer line and ion source temperatures were both maintained at 270 °C. The mass spectrometer was operated in positive ion electron ionization (EI) mode at 70 eV and mass spectra using full-scan mode with the scan range from mass-to-charge ratio (m/z) 40 to 400 were collected. Spectral acquisition began 0.33 min after each injection.

2.3. Sample Preparation

A magnetic stir bar and 10 mL of water sample were placed into a 20-mL headspace glass vial with the addition of 20 µL of each TCE standard solution, TCE-d solution, and hexane. After the vial was sealed by an aluminum cap with a PTFE/silicone septum, a PDMS/DVB fiber was exposed to the headspace for 15 min at 31 °C. The fiber was then immediately inserted into the GC injector for desorption at 270 °C for 5 s of the portable GC/MS.

3. Results and Discussion

3.1. LLME–SPME Method Optimization

Many factors could affect the LLME–SPME process. Some of them are optimized and discussed in this study including selection of extraction solvent, volume of extraction solvent, extraction time and temperature, SPME fiber coatings, and effects of dispersive solvent, stirring, and salt. The portable GC/MS system can only perform manual SPME mode. The extraction optimization process was performed on a bench-top GC/MS instrument equipped with an autosampler because the autosampler can reduce the error compared to manual injection. The bench-top instrument is also more stable than the portable instrument, and can enable the liquid injection mode which can be used to evaluate the absolute recoveries of the SPME and LLME–SPME methods. The peak area was calculated by integration in the TCE retention time window of the extracted molecular ion m/z 132 chromatogram. The peak area was used to compare the extraction efficiencies obtained from different extraction conditions.

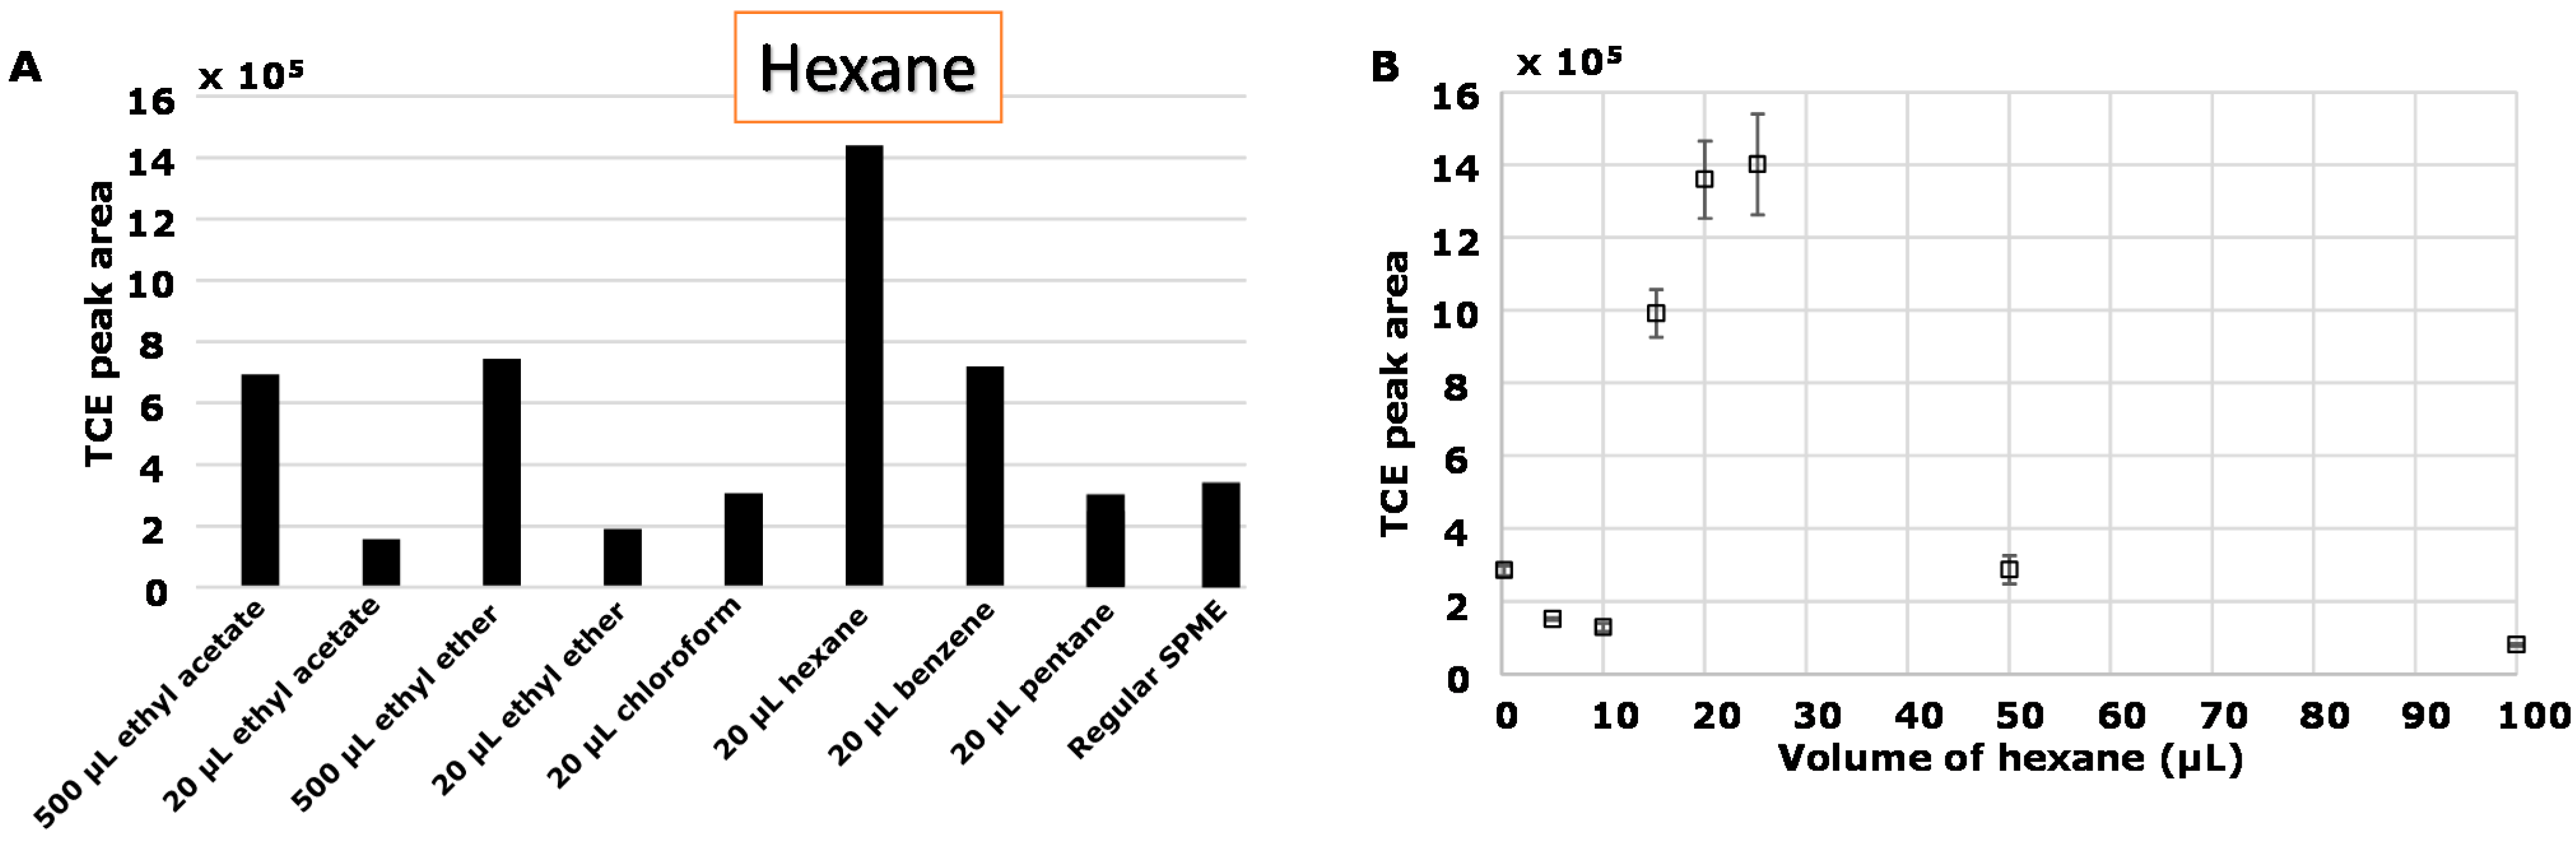
3.1.1. Selection of Organic Solvent

Additional organic solvents are usually avoided when applying SPME because the SPME fiber may become saturated with the solvent (e.g., hexane) instead of the analyte of interest. In our study, it was found that the extraction efficiency could be significantly improved with the addition of minute amounts (i.e., microliters) of organic solvent. Several commonly used organic solvents in liquid–liquid extraction were selected including pentane, hexane, benzene, chloroform, ethyl ether, and ethyl acetate. A series of 10-mL TCE water samples containing 20 µL each of organic solvent were prepared. For ethyl ether and ethyl acetate, another set of samples with 500 µL of each in 10 mL aqueous TCE standards were prepared for comparison because their solubilities in water are relatively high. The extraction temperature at 25 °C and extraction time at 15 min were used as LLME–SPME extraction conditions. The responses obtained from the different solutions are given in Figure 1A. The response was significantly higher with the addition of 20 µL of hexane.
Figure 1. Effect of different extraction solvent for liquid–liquid microextraction assisted solid phase microextraction (LLME–SPME) (A) and effect of hexane volume for LLME–SPME with 95% confidence intervals (n of 3) (B). The extraction temperature was 25 °C and extraction time was 15 min.
Chromatography 02 00066 g001
The volume effect of hexane was also investigated and results are given in Figure 1B. The optimum volume for hexane was 20 µL. Therefore, 20 µL hexane was used in this study.
The putative mechanism for the enhanced SPME efficiency by LLME is that the LLME enriches the TCE from aqueous solution into an organic film on the solution surface. When organic solvents with the densities less than 1 g cm−3 (e.g., hexane) are selected, the organic film resides at the solution/headspace interface. The TCE enriched film has a greater mass transfer efficiency to the headspace. Solvents denser than water such as chloroform did not provide an enhancement of the SPME efficiency, because the denser TCE enriched organic film was not in contact with the headspace even with stirring. Compared with hexane, pentane has better volatility but did not improve the extraction efficiency significantly. The reason could be that the fiber was saturated with pentane that displaced any TCE on the fiber.
Other than density and volatility, the selection of organic solvent should also consider the retention properties of the organic solvent. The retention index (RI) can be used as a criterion to select an organic solvent. The RI of the analytes should be larger than the RI of the organic solvent so that the solvent delay period will not include any analyte peaks. Table 1 listed the RIs for TCE and the organic solvents tested in our study. In this study, the solvent peak of hexane can be fully separated from the TCE peak with respect to retention time.
Table 1. Retention indices and densities of selected organic compounds.
Compound NameRI *Density (g cm−3)
TCE6941.46
Ethyl ether4950.71
Ethyl acetate6000.9
Hexane6000.65
Chloroform6281.49
Benzene6500.88
* RI: retention index from NIST database [17]. TCE: trichloroethylene.

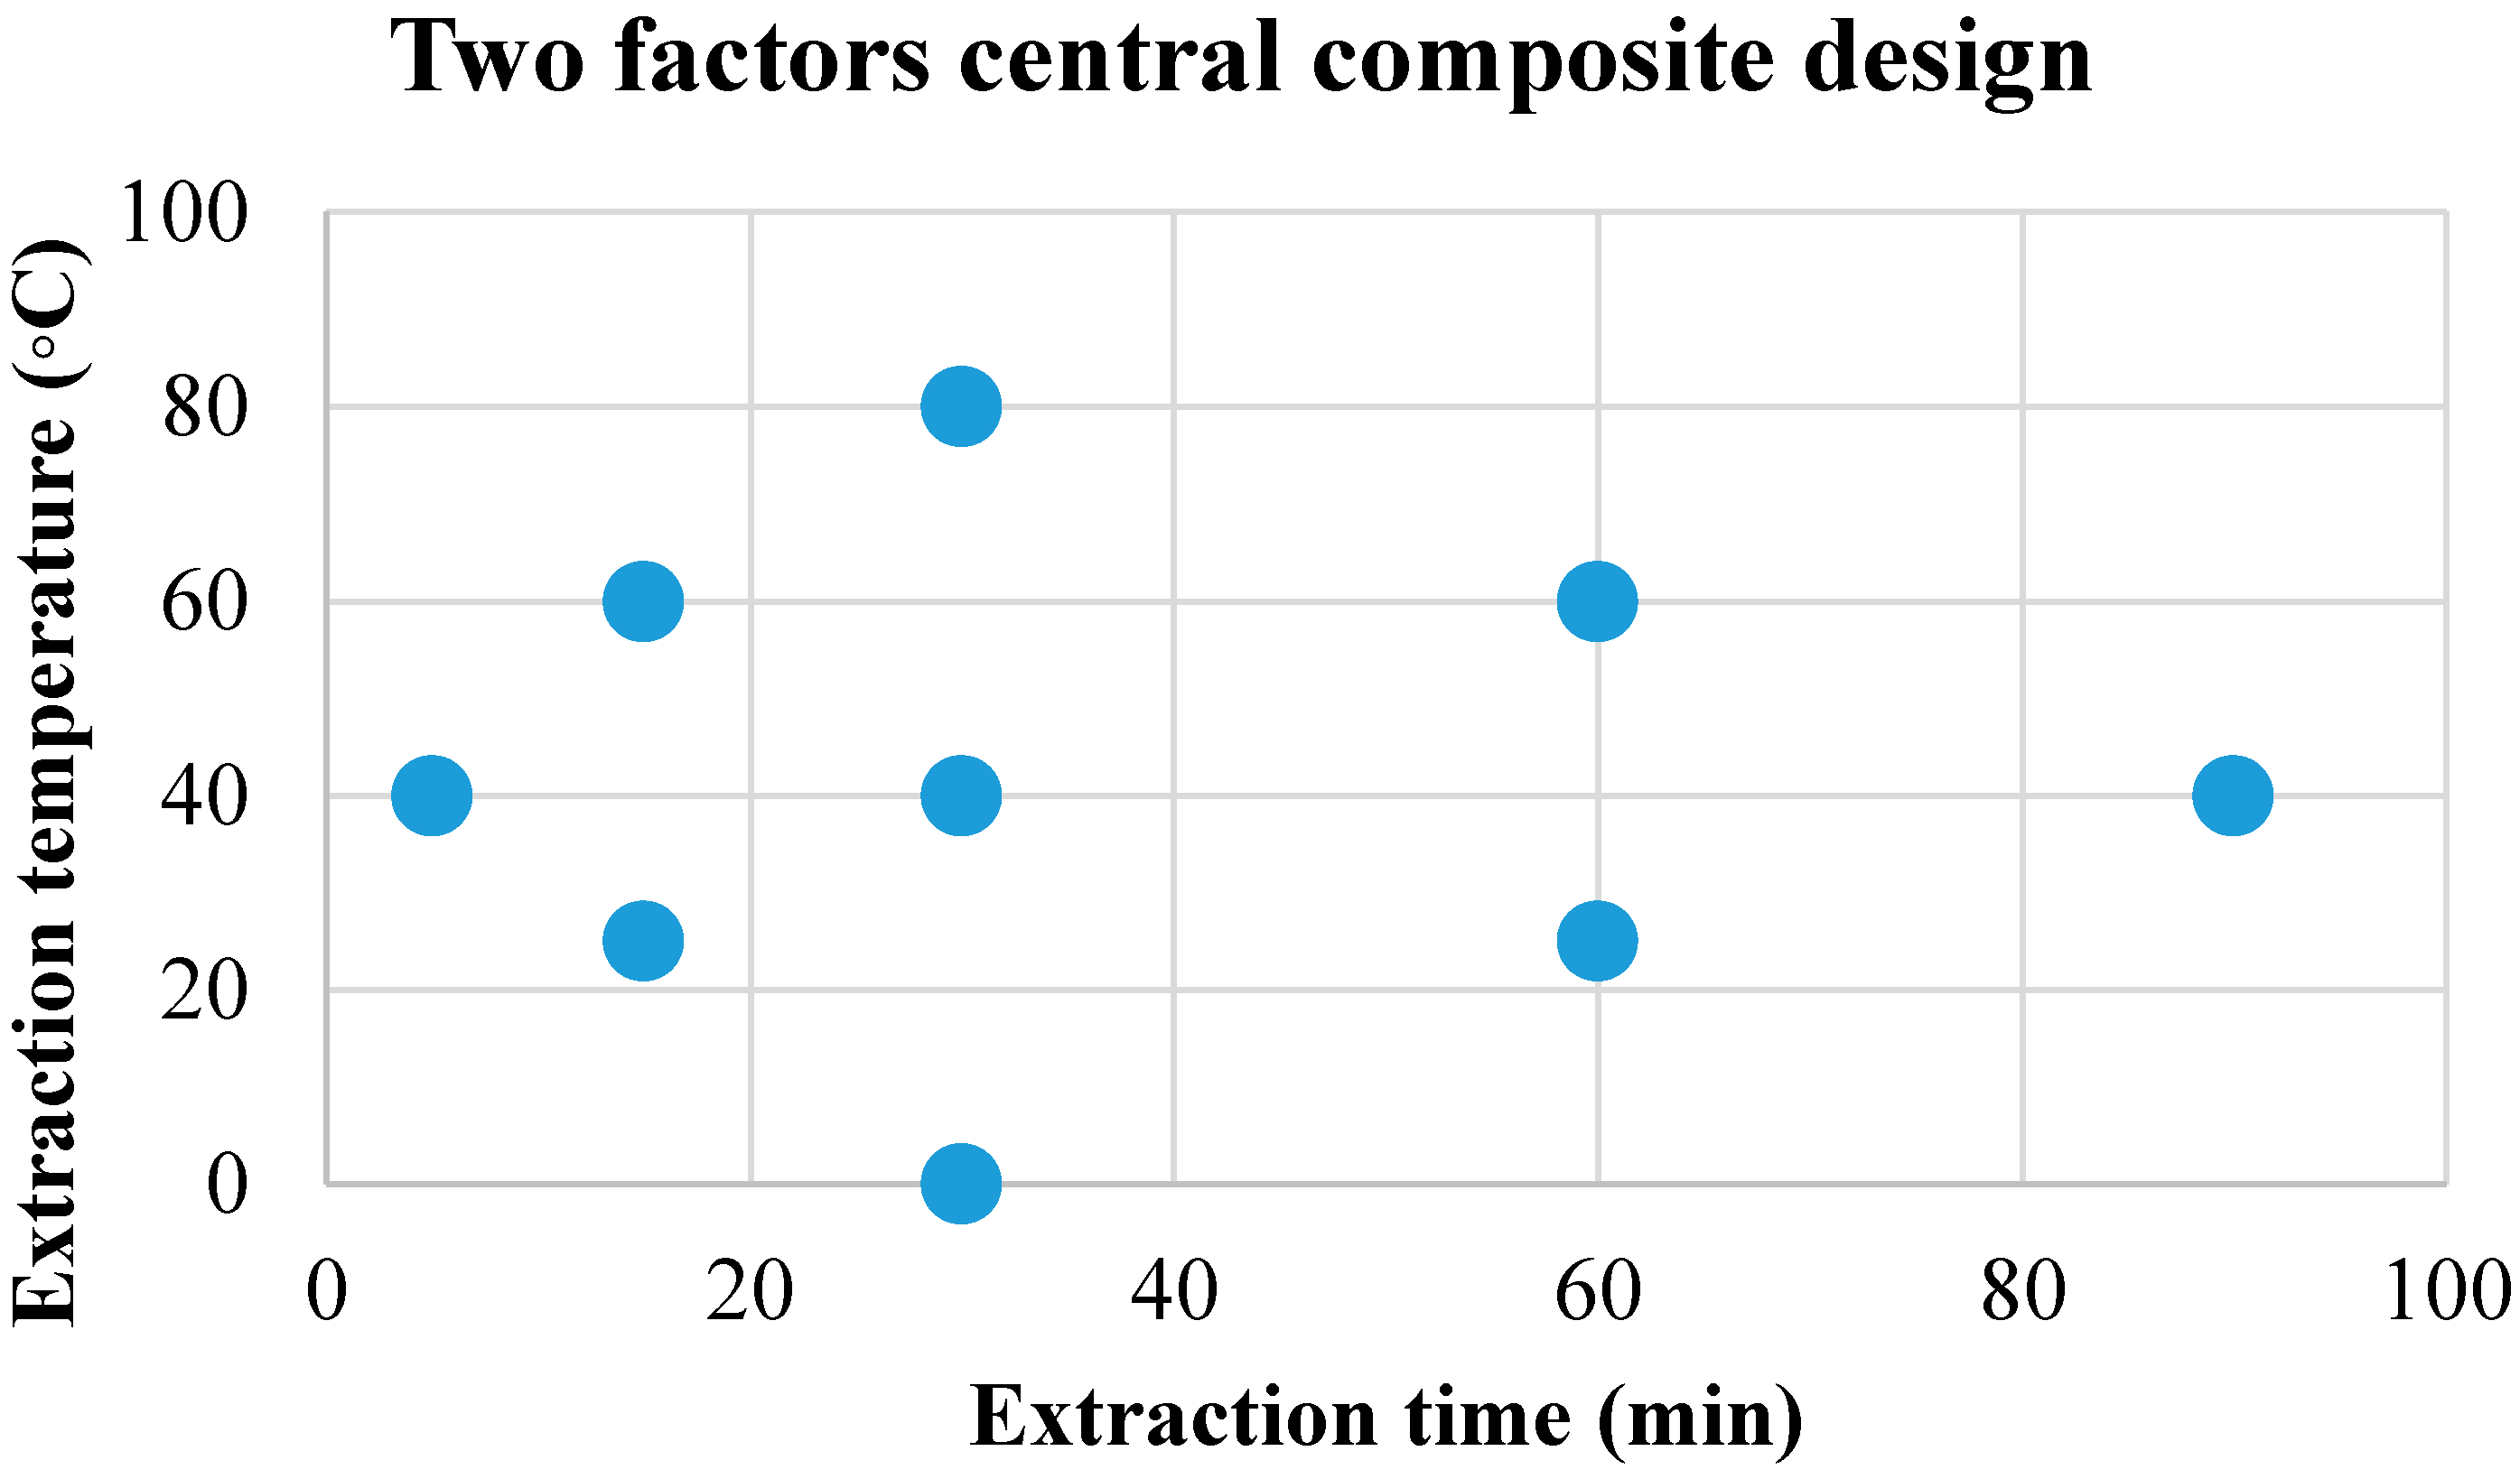
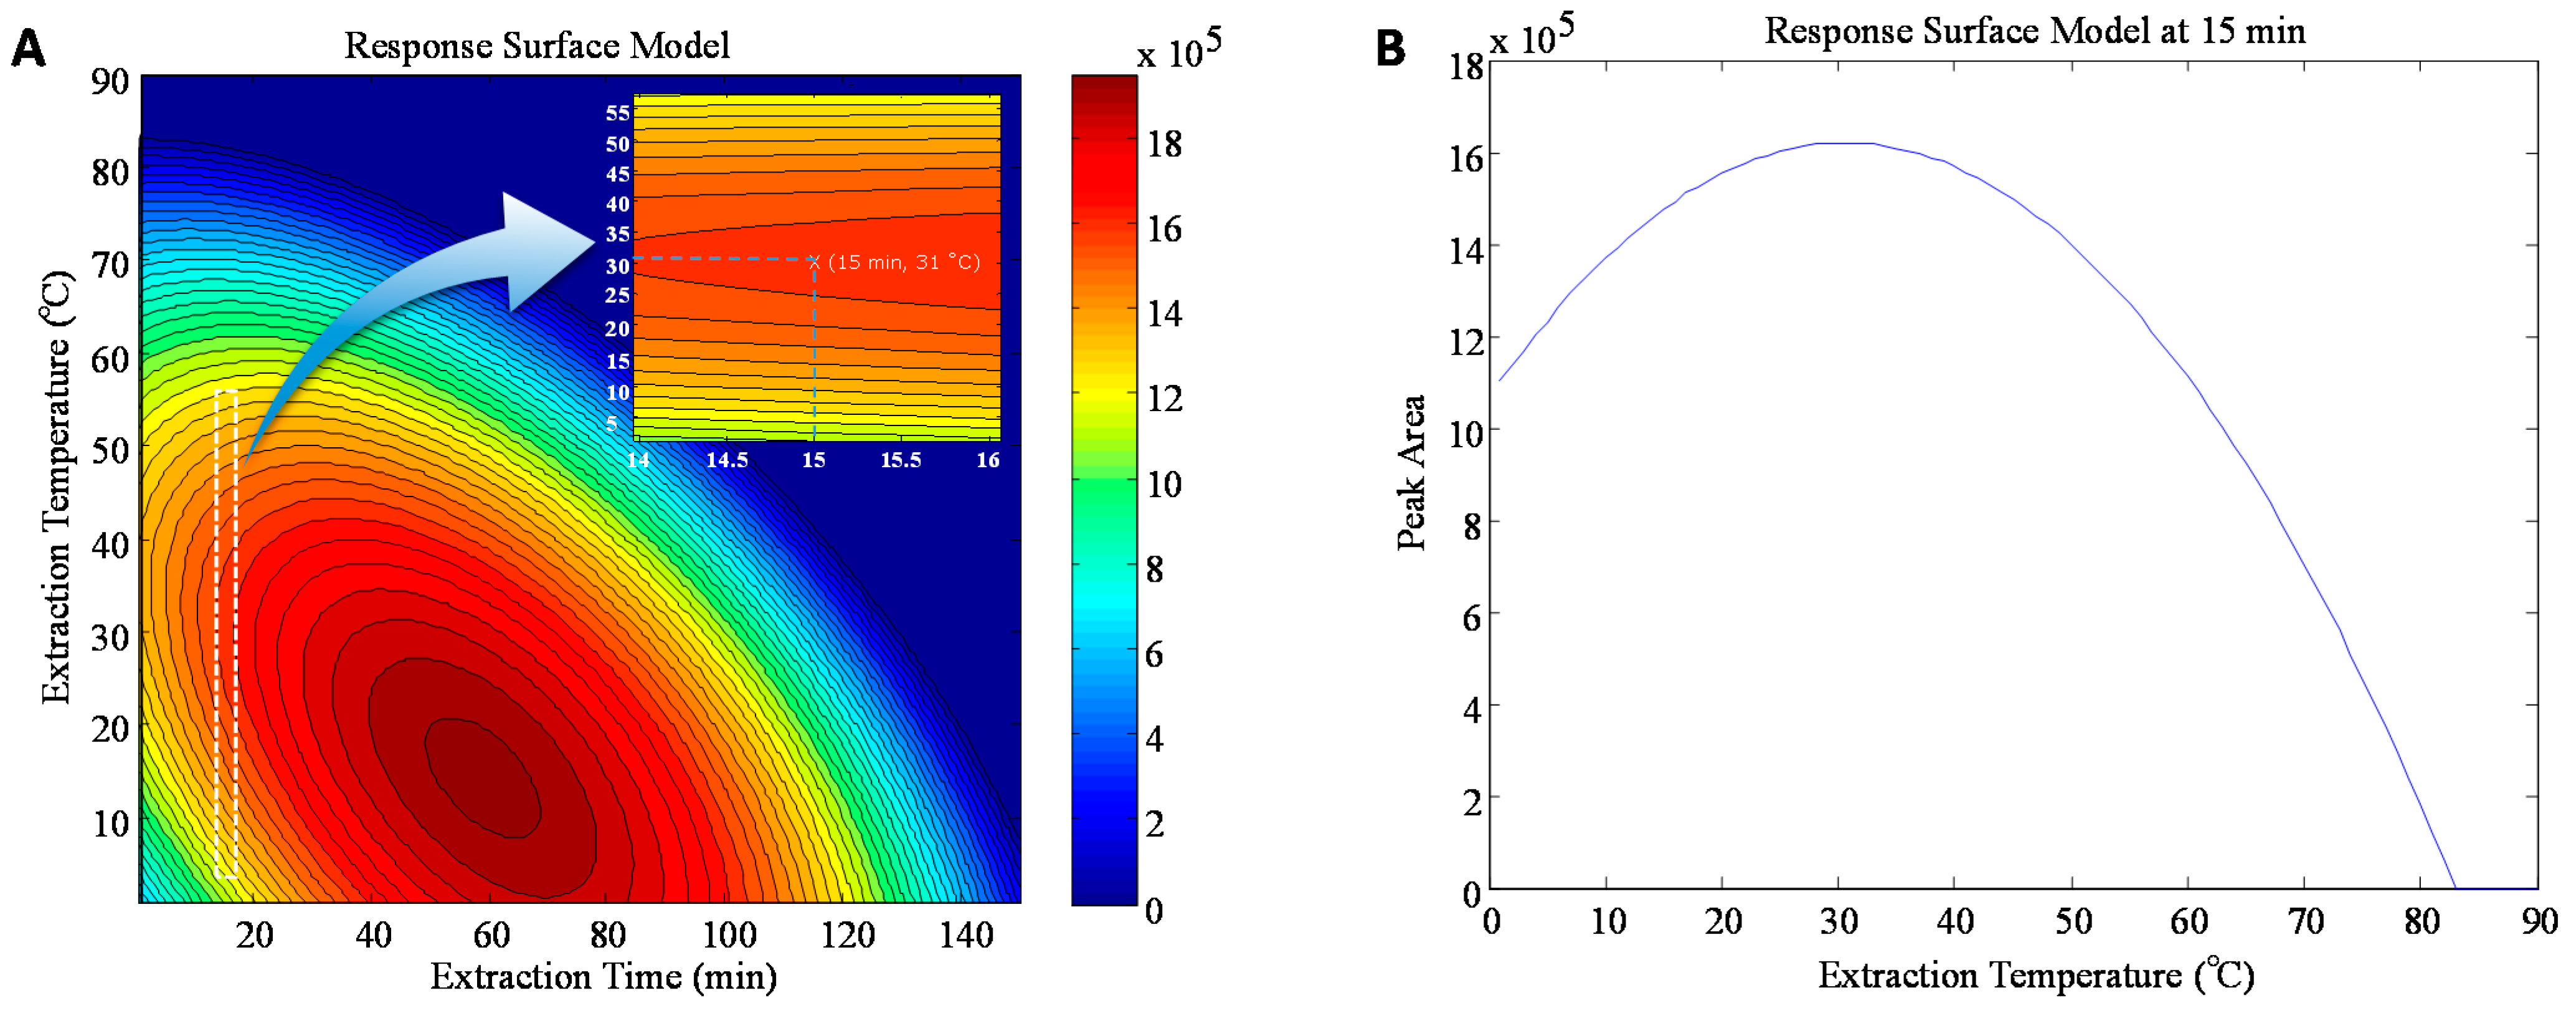
3.1.2. Effect of Extraction Temperature and Time on LLME–SPME

The extraction temperature and extraction time are usually interacted factors [18]. The full second-order polynomial models are versatile in many systems over a limited factors, and the central composite designs are very useful for obtaining data to fit the full second-order polynomial models [19]. Figure 2 is a central composite design used in our study for two experimental conditions: extraction time and extraction temperature. The model for the response surface is given as Equation (1). The polynomial model is fit to the response values obtained from the central composite design.
y   = b 0 + b 1 x 1 + b 2 x 2 + b 3 x 1 2 + b 4 x 2 2 + b 5 x 1 x 2 + e
for which y is the response that is the peak area of the TCE; b 0 5 are the coefficients for the model; x 1 is the extraction time and x 2 is the extraction temperature.
Figure 2. Data points in the two factors (extraction time and extraction temperature) central composite design.
Chromatography 02 00066 g002
Figure 3A is the contour plot of the modeled response surface. The best extraction result according to the model occurs at 15 °C and 60 min. For a high throughput method, the extraction time of 60 min is too long. If a 15 min extraction time is used, the optimum extraction temperature is 31 °C according to the fitted model (Figure 3B). The peak area at the condition of 15 min and 31 °C is about 82% of the best extraction condition at 60 min and 15 °C. Therefore 45 min (75% of the best extraction time) are saved with an 18% loss of peak area. For the extraction temperature greater than 31 °C, the extraction efficiency decreases as the temperature increases, which agreed with the result in a previous study [9]. In our study, the extraction temperature of 31 °C and extraction time of 15 min were chosen.
Figure 3. Response surface of the second-order polynomial model with the zoom-in window of interested region (A) and response surface model at 15 min (B).
Chromatography 02 00066 g003

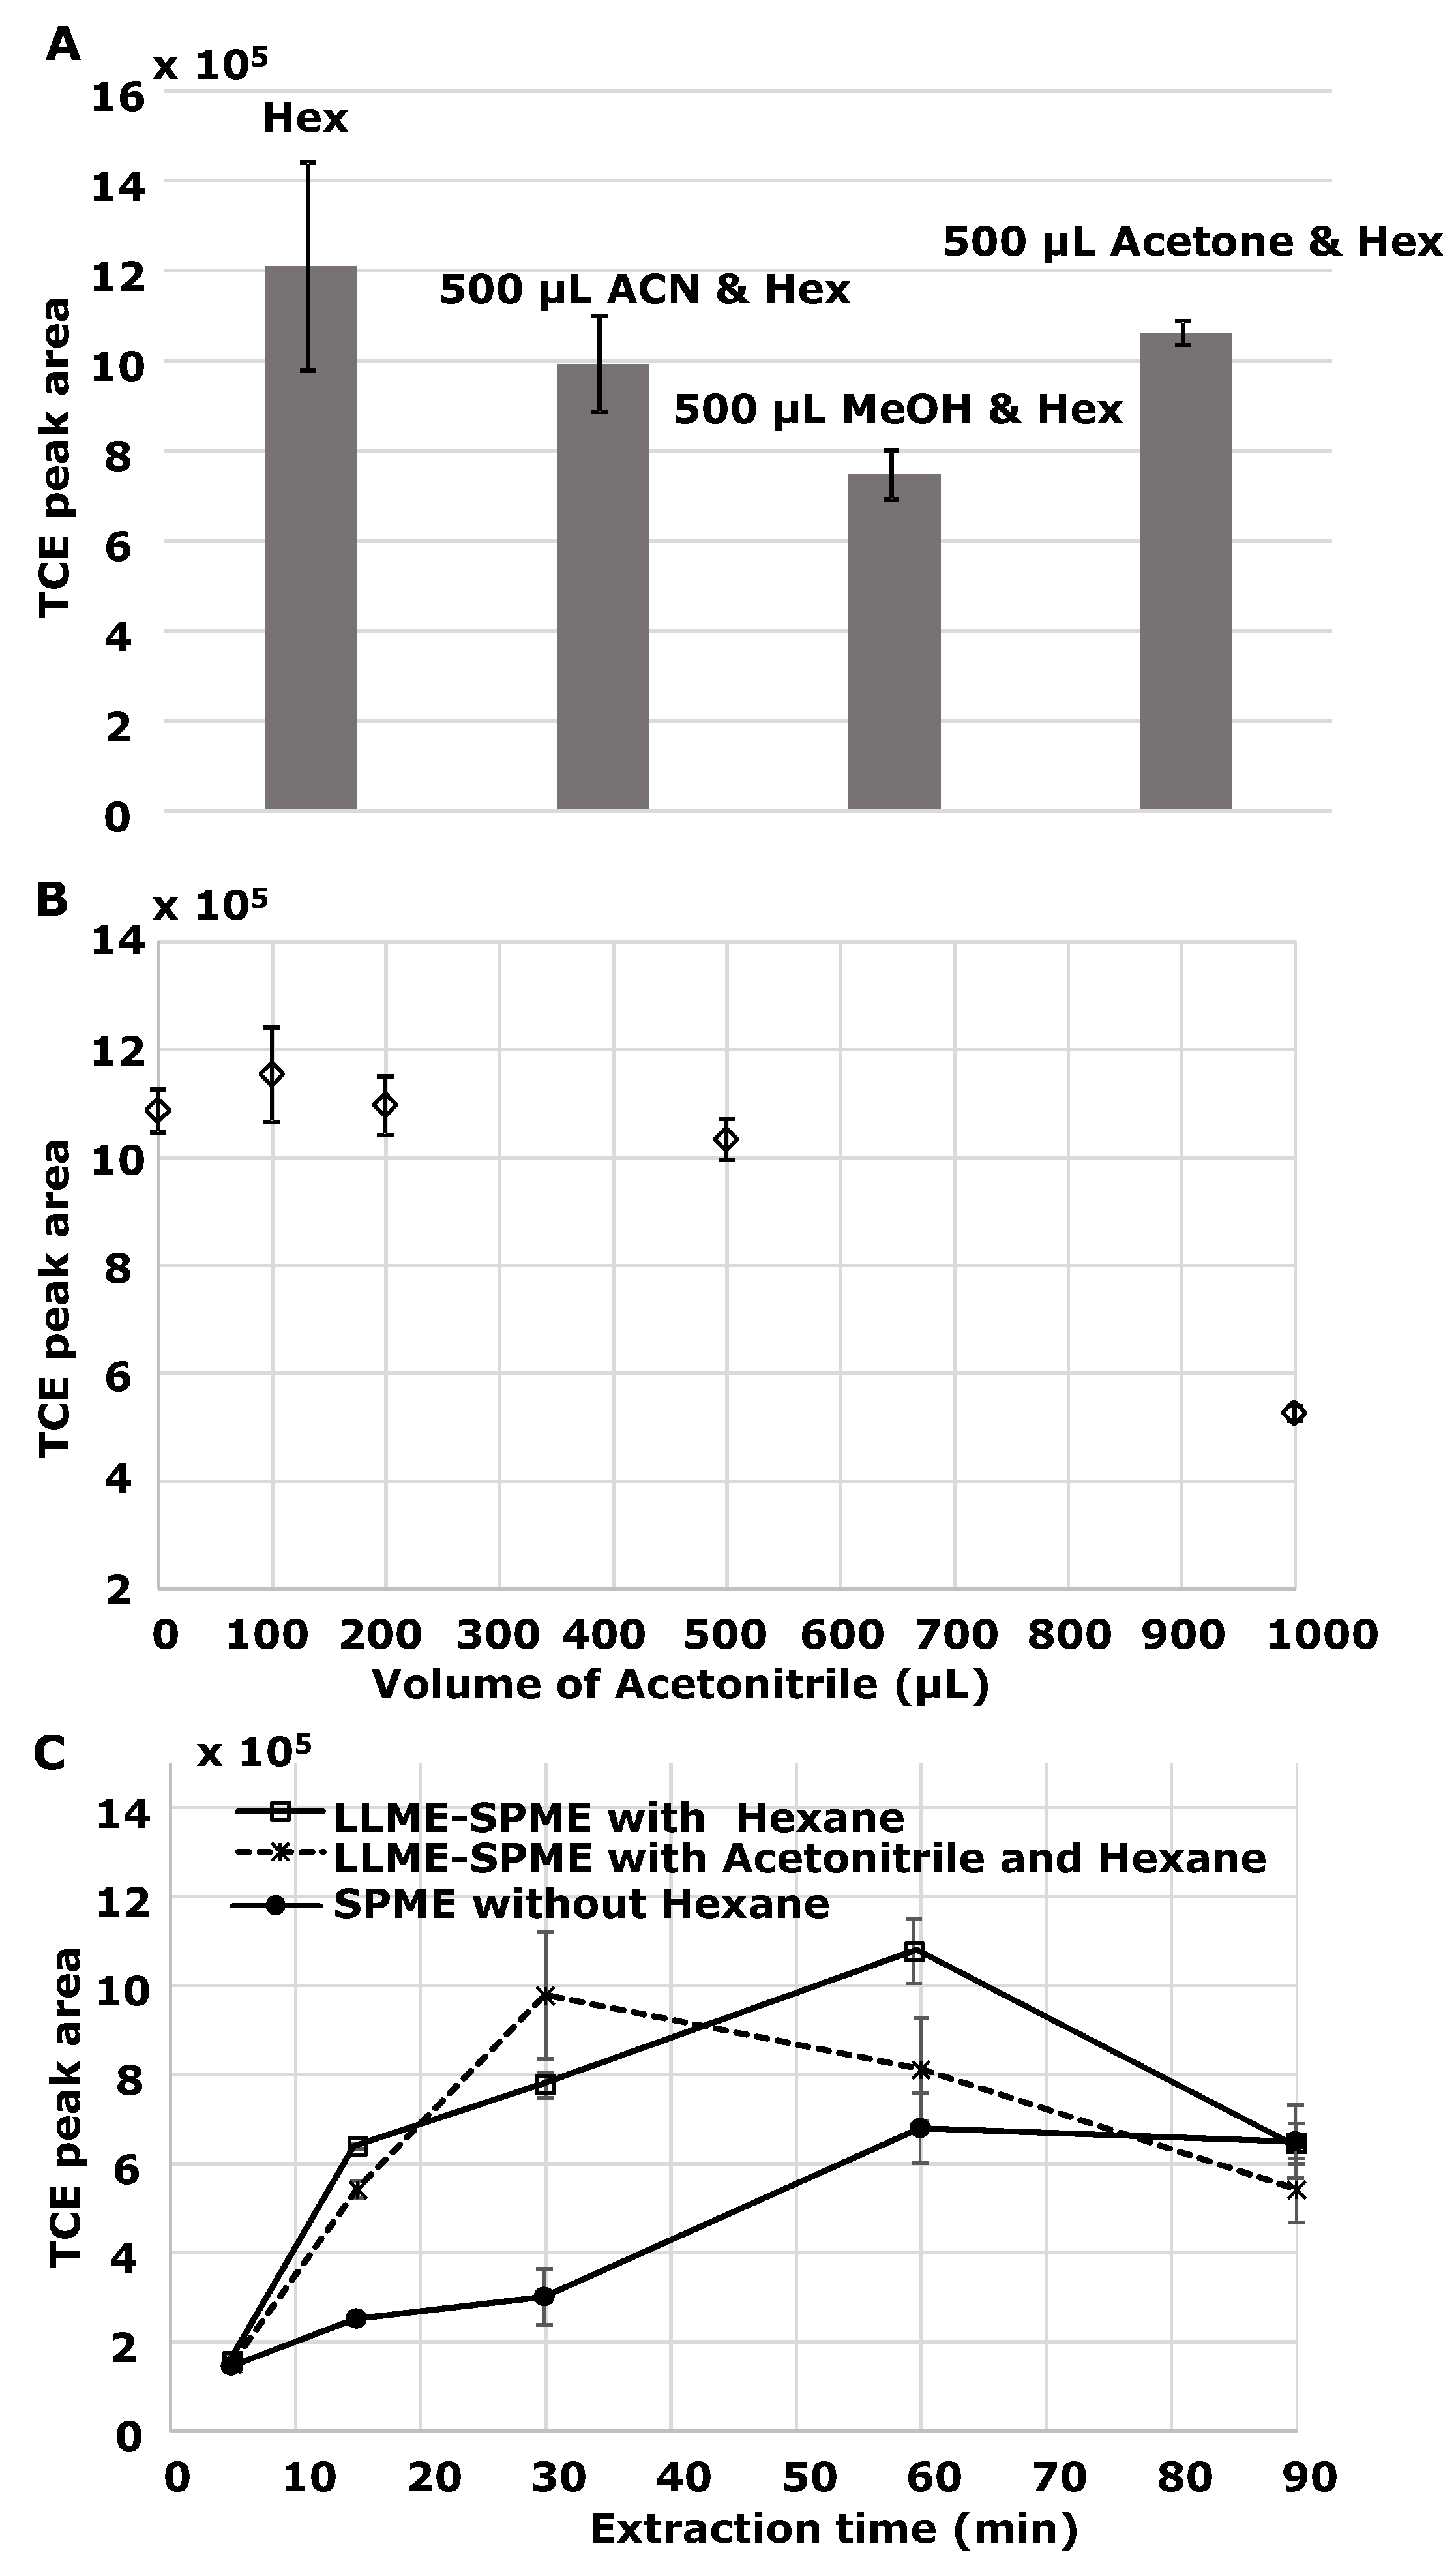
3.1.3. Effect of Dispersive Solvents

In dispersive LLME, a dispersive solvent such as methanol, acetone, or acetonitrile with high miscibility in both extractant and aqueous phases can give rise to the formation of small droplets throughout the aqueous sample. The extraction time can be shortened because of the increased surface area between the extractant and aqueous sample in the cloudy solution, so the equilibrium is achieved quickly [20]. The extraction efficiencies by LLME–SPME with 20 µL hexane and 500 µL of different dispersive solvents including methanol, acetone, and acetonitrile were compared and the results are reported in Figure 4A. None of the dispersive solvents improved the extraction efficiency. The volume effect of acetonitrile as a dispersive solvent can be seen in Figure 4B. There was no significant difference for extraction efficiency when using 0, 100, 200, or 500 µL acetonitrile (p-value of 0.2 by one-way analysis of variance).
Different extraction times in the range of 5–90 min for SPME with 20 µL hexane or with 20 µL hexane and 100 µL acetonitrile were evaluated (Figure 4C). The maximum response was achieved at 60 min for LLME–SPME with hexane, and at 30 min for LLME–SPME with hexane and acetonitrile. No advantage to using acetonitrile was achieved, especially at the pre-selected extraction time of 15 min.
Figure 4. Effect of dispersive solvents (A), volume of acetonitrile (B) and extraction time (C) on LLME–SPME extraction efficiency (n of 3). Hex: hexane; ACN: acetonitrile; MeOH: methanol. Note that in Figure 4B, volume of acetonitrile refers to additional volume of acetonitrile as dispersive solvents added to the solution, and the acetonitrile in TCE standard solution was not counted.
Chromatography 02 00066 g004

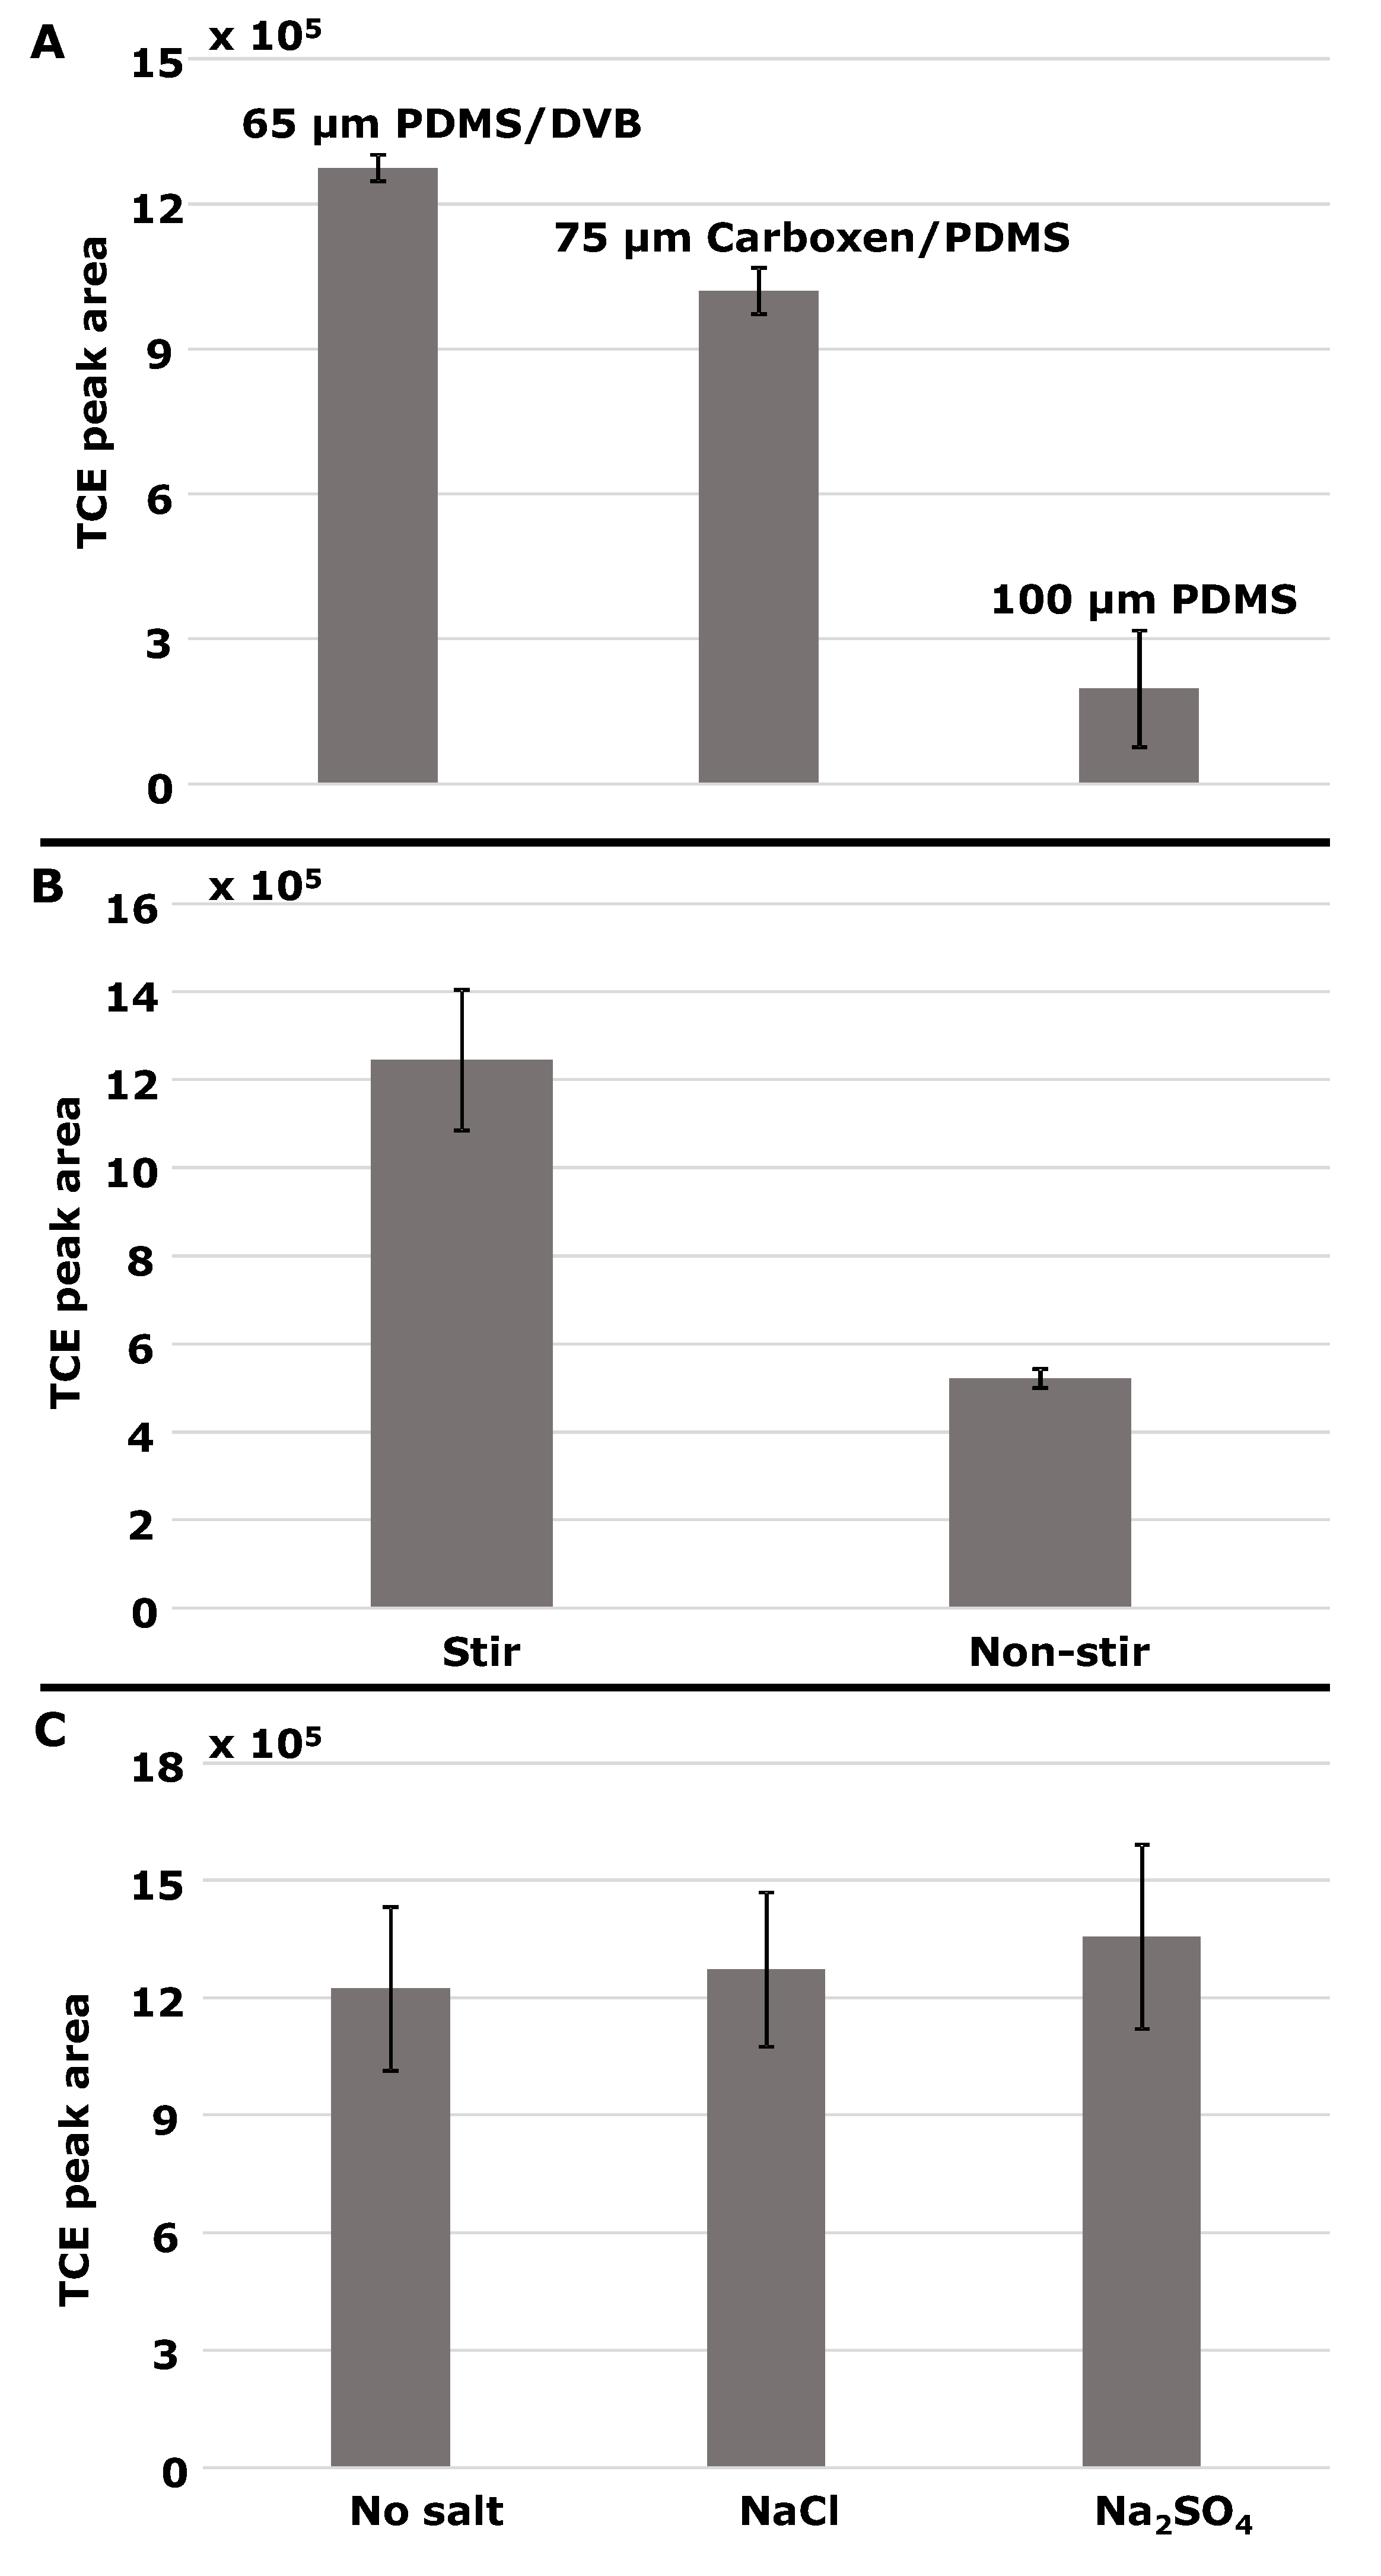
3.1.4. Other Factors: SPME Fiber, Stirring, and Salting Out

Coatings of SPME fiber were selected among PDMS (100 µm film thickness), carboxen/PDMS (75 µm film thickness) and PDMS/DVB (65 µm film thickness). The PDMS/DVB fiber was chosen because better recoveries of TCE were achieved (Figure 5A). Responses for TCE in non-stirred samples was about 50% of those obtained in stirred samples (Figure 5B), so stirring was used. Increasing the ionic strength by adding 3 g NaCl or Na2SO4 did not influence the efficiency of the extraction (Figure 5C), therefore the addition of salt was not considered in the experiments.
Figure 5. Effects of fiber coatings (A), stirring (B) and salting out (C) with 95% confidence intervals (n of 3).
Chromatography 02 00066 g005

3.2. Recoveries and Enrichment Factors

To evaluate the absolute recovery of the LLME–SPME method, another calibration data set using standard liquid injection was collected across the range of 0.5–150 ppm. The recovery was calculated using the calculated TCE mass on-column of the LLME–SPME-extracted sample relative to the absolute TCE mass contained within the vial before extraction. The enrichment factor of LLME–SPME method was defined as the ratio of the calculated TCE masses on-column from the samples extracted by LLME–SPME with 20 µL hexane and without hexane (SPME). The recovery and enrichment factor results are listed in Table 2. The absolute recoveries are in the range of 29%–41% for the samples extracted by LLME–SPME and 11%–17% for the samples extracted by SPME. The enrichment factors with the addition of hexane are 2.6 ± 0.2, 2.4 ± 0.4, and 2.2 ± 0.3 for the samples at low, medium, and high concentrations.
Table 2. Absolute recoveries and enrichment factor of TCE by LLME–SPME (n of 3).
TCE concentration (ng mL−1)TCE in the vial (ng)SPMELLME-SPMEEnrichment factor
TCE on column (ng)Recovery (%)TCE on column (ng)Recovery (%)
101001.1 ± 0.1112.9 ± 0.4292.6 ± 0.2
100100017 ± 11741 ± 2412.4 ± 0.4
300300048 ± 316107 ± 14362.2 ± 0.3

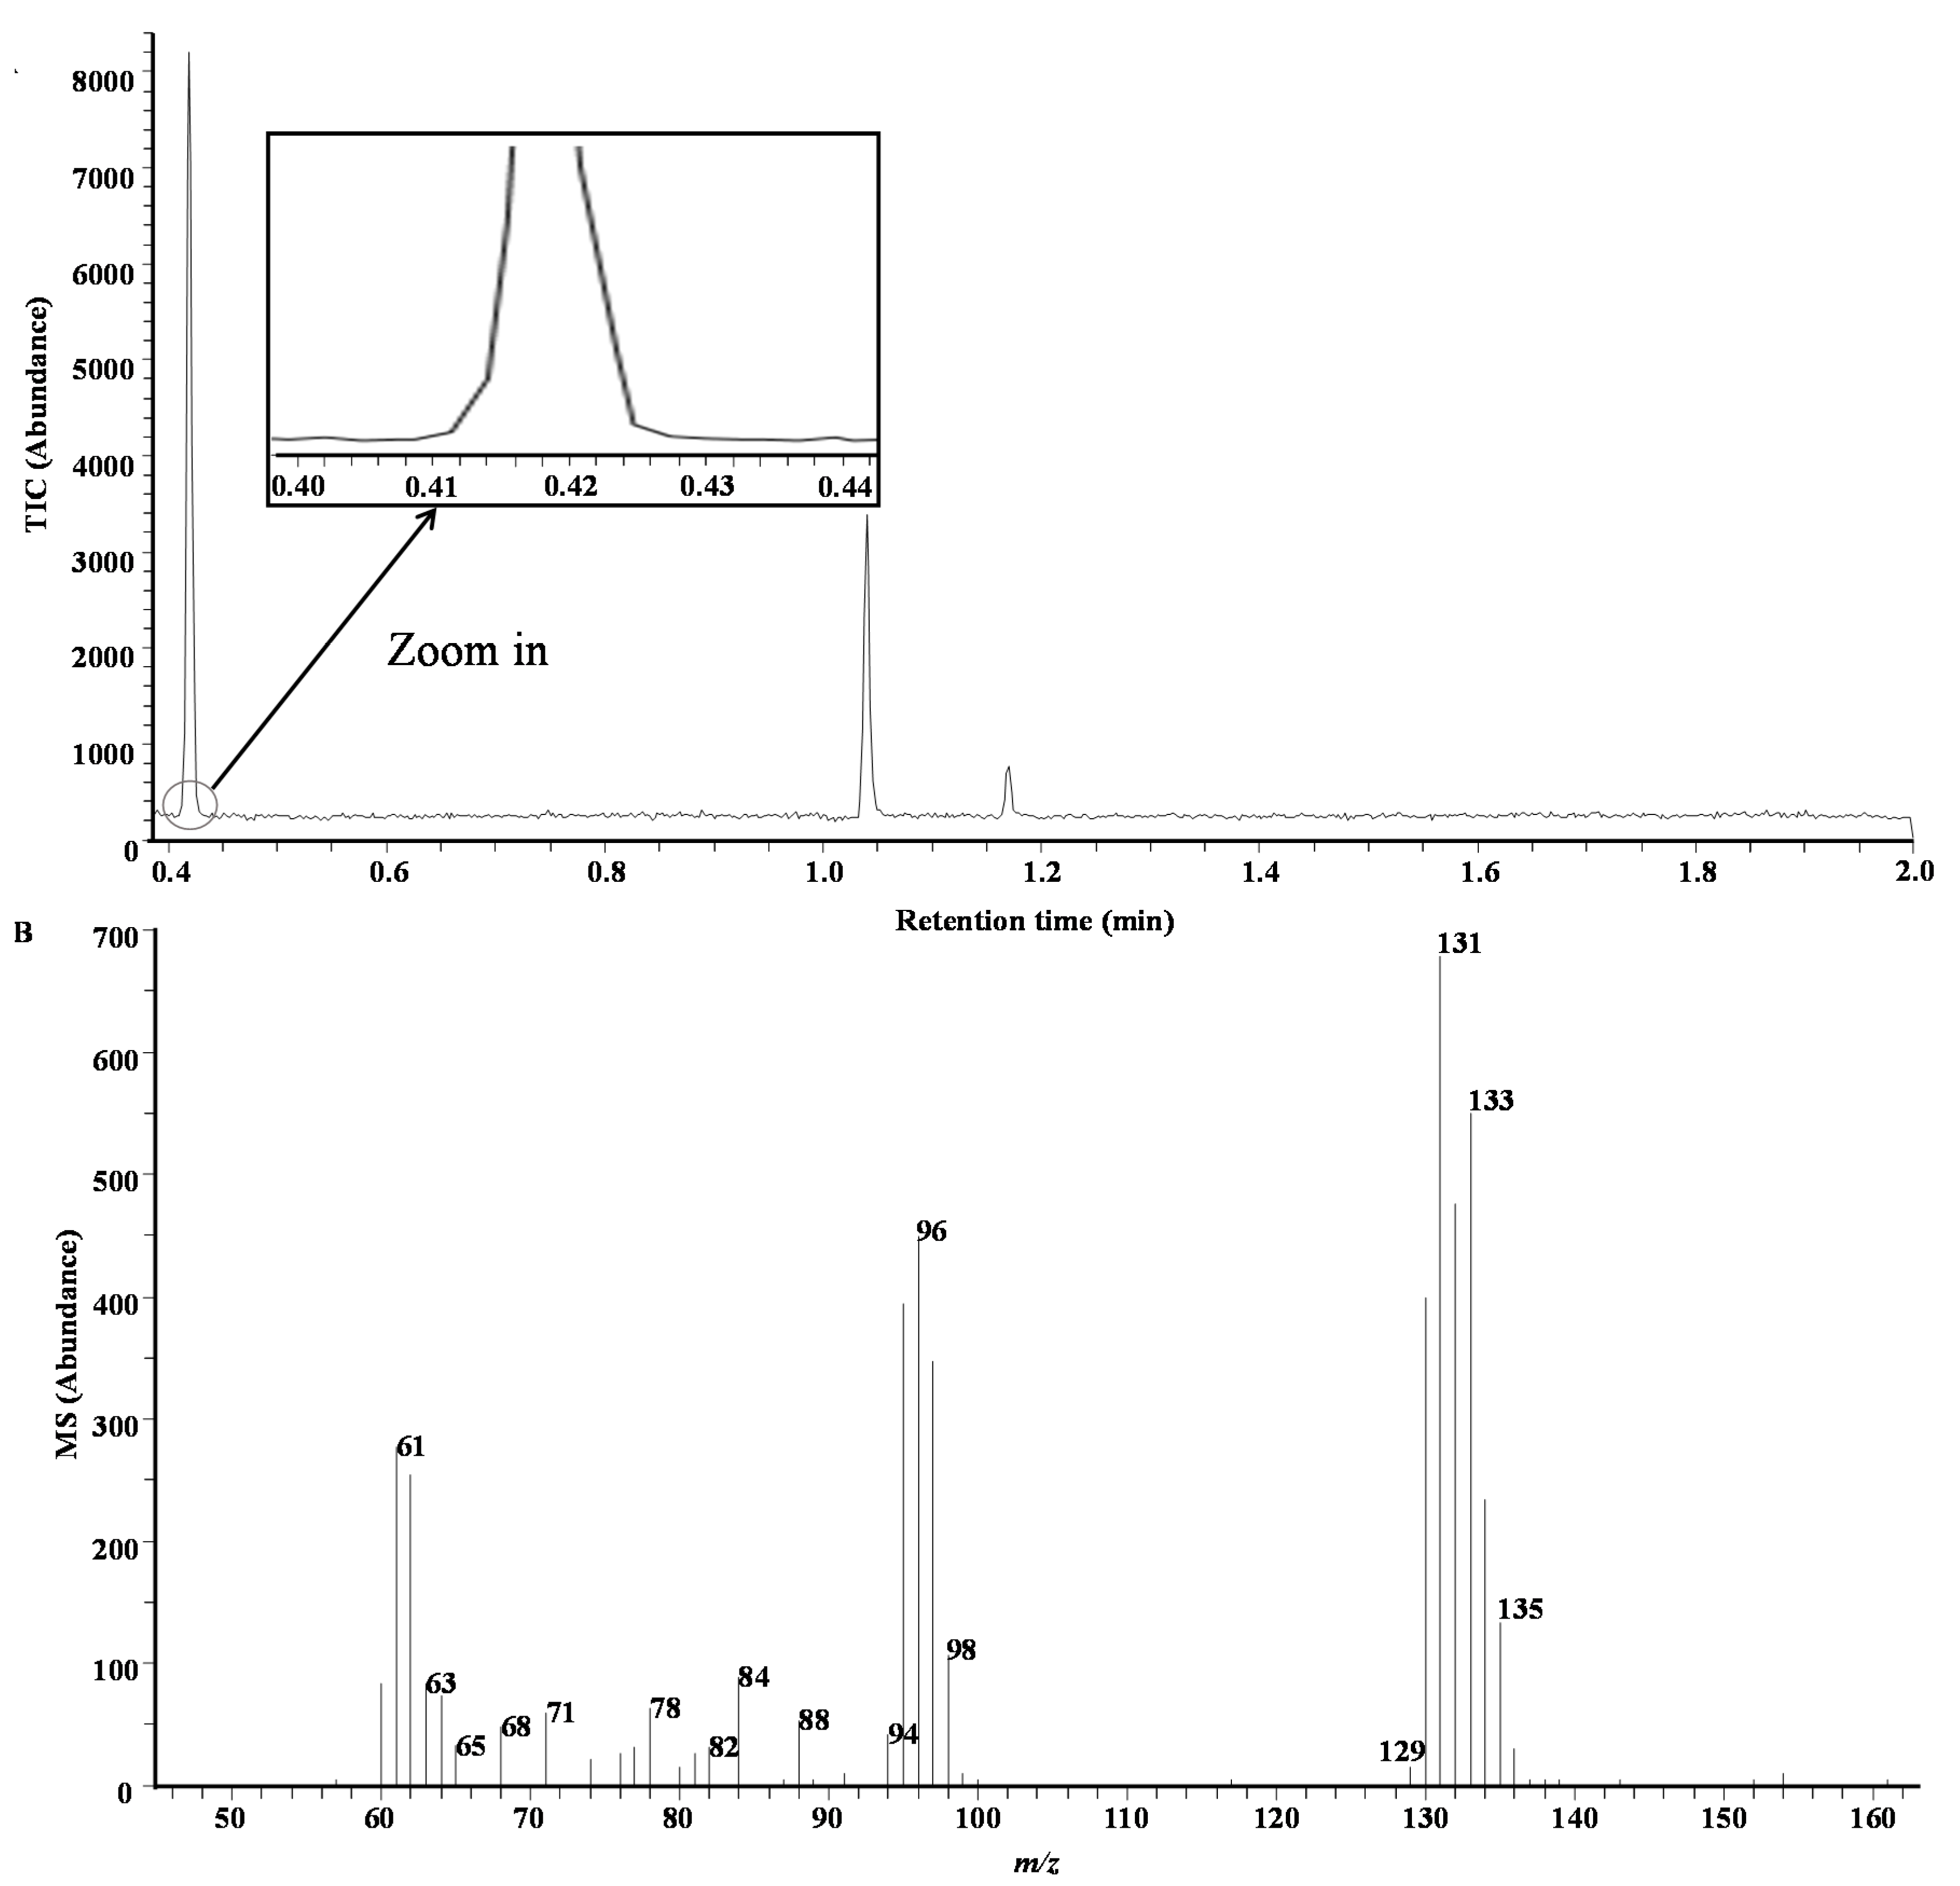
3.3. Application of Extraction Method Using Portable GC/MS Instrument and Validation

After the LLME–SPME method has been developed by using the bench-top GC/MS instrument, it was transferred on a portable instrument with no parametric changes to the extraction procedure for the determination of TCE. It is recommended to use an isotopically labeled internal standard (IS) for calibration with SPME [16], especially for field analyses because methods are more susceptible to fluctuations in sensitivity compared to measurements that are obtained in the controlled environment of the laboratory.
To use deuterated TCE (TCE-d) as an IS could cause ‘cross contribution’ problem in the mass spectra which is the contribution of intensities of TCE and TCE-d [21]. However, the application of classical least-squares (CLS) can effectively model the overlapping peaks between an analyte and its corresponding isotopic IS. The details of using TCE-d as an IS for the quantitation of TCE were reported earlier [22]. The calibration was constructed using samples prepared with the same extraction method discussed above with a linear dynamic range of 10–1000 ng mL−1 of TCE in water. The validation results are listed in Table 3. The limit of quantitation (LOQ) of this method is 10 ng mL−1. The accuracy as relative error (RE) was in a range of −12%–10% and precision as relative standard deviation (RSD) ranged from 4.4%–11.9%. The method was also applied to the spiked river samples at different concentrations, and the prediction results are all in the acceptable range with the relative errors between −1%–10%. A representative GC chromatogram and mass spectrum for the spiked rive sample containing TCE at 10 ng mL−1 is given in Figure 6. Note that the chromatographic peaks at 1.04 min and 1.17 min are the PDMS peaks from septum in crimp seal of glass vial which do not affect the analysis of TCE.
Table 3. Accuracy and precision for the determination of TCE (n of 3).
Added concentration (ng mL−1)Measured concentration (ng mL−1)RSD (%)RE (%)
10 (LLOQ)10 ± 110.82
3028 ± 311.9−7
10088 ± 55.9−12
300330 ± 154.410
Figure 6. Gas chromatography (GC) chromatogram for spiked river sample containing TCE at 20 ng mL−1 (A) and mass spectrum of TCE/TCE-d peak at 0.416 min (B).
Chromatography 02 00066 g006

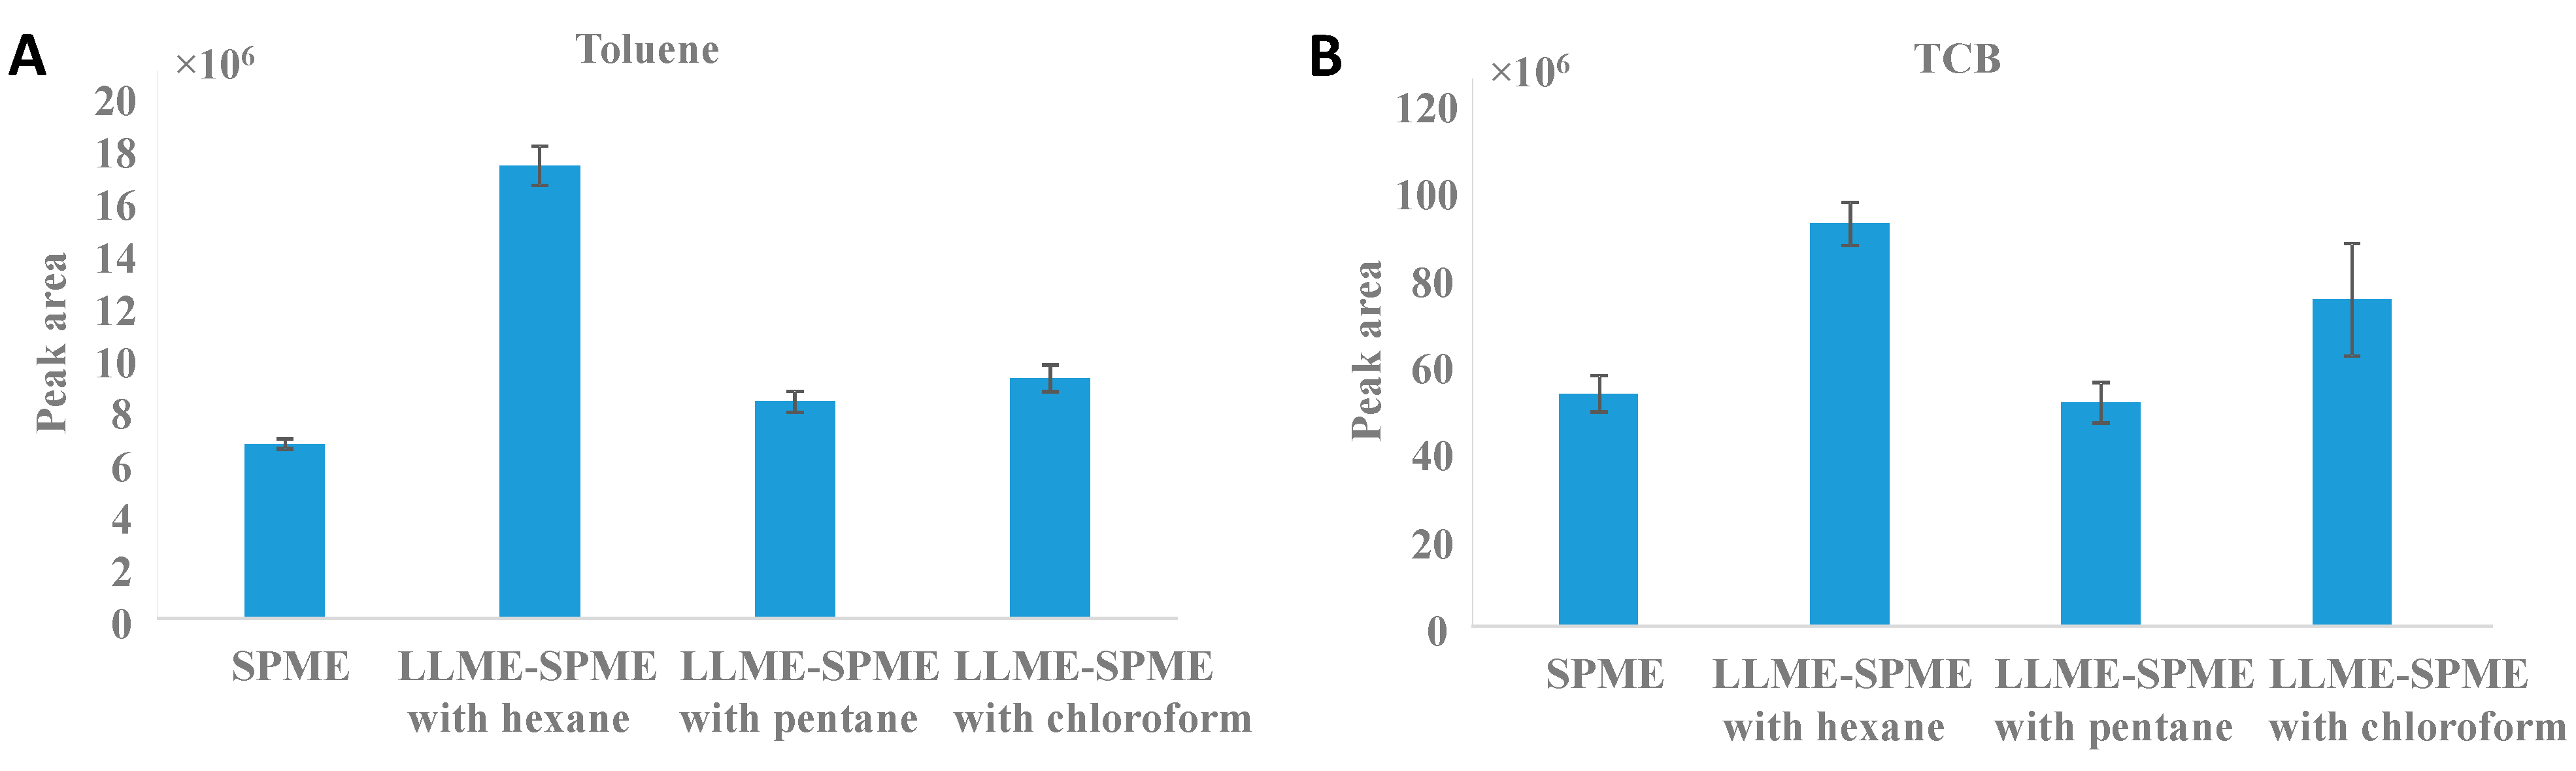
3.4. Effectiveness of LLME–SPME on Other Volatile Organic Contaminants in Water

The toluene and TCB were selected to test the effectiveness of LLME–SPME method because both are among the top 15 most frequently detected VOCs in aquifers [3]. Water samples contain 20 ng mL−1 of toluene and TCB each were used. The extraction conditions for toluene and TCB are the same as the optimum conditions for TCE. The peak areas of extracted molecular ions (e.g., m/z 92 for toluene, m/z 182 for TCB) were used to compare the extraction efficiencies between regular SPME method and LLME–SPME methods with hexane, pentane, and chloroform. The results are graphed in Figure 7. For both toluene and TCB, the LLME–SPME with hexane method gives the better extraction efficiency than the other methods (p-values of 10−4 and 0.06 for toluene and TCB by paired t-test evaluation between the largest peaks and second largest peaks with 95% confidence intervals). The extraction efficiencies for toluene and TCB by LLME–SPME method would be further improved after optimization. Therefore the LLME–SPME method could be used for the analysis of various VOCs in aqueous matrices.
Figure 7. Comparison of regular SPME and LLME–SPME for the extraction of toluene (A) and TCB (B) (n of 3).
Chromatography 02 00066 g007

4. Conclusion

In this study, a novel sample preparation method LLME–SPME was developed. Different organic solvents were compared and hexane was selected because of the best extraction efficiency offered. The response surface for extraction temperature and time was modeled by fitting the full second-order polynomial model to the peak areas obtained from a central composite design. For a fast screening method, non-equilibrium extraction with 15 min as extraction time was used and 31 °C was selected as the optimum temperature at this condition. Other parameters such as SPME fiber coatings, and effects of dispersive solvent, stirring, and salt were also optimized. The calibration of TCE analyzed by portable GC/MS instrument was in a linear range from 10 ng mL−1 to 1000 ng mL−1. This method significantly improved the extraction efficiency compared with SPME and would be suitable for field analysis because of its simplicity. The effectiveness of LLME–SPME was tested for toluene and TCB in water sample with a similar success which indicates that the LLME–SPME could be applicable to the analysis of other VOCs in water matrix.

Acknowledgments

The research was funded in part by a grant from US Department of Energy, Office of Environmental Management, Portsmouth/Paducah Project Office #. The Center for Intelligent Chemical Instrumentation and Department of Chemistry and Biochemistry at Ohio University are acknowledged for the financial support.
# The project was supported by US Department of Energy. Any opinions, findings, and conclusions or recommendations expressed in this material are those of the author(s) and do not necessarily reflect the views of the US Department of Energy Office of Environmental Management Portsmouth/Paducah Project Office, or of the Voinovich School of Leadership and Public Affairs at Ohio University.

Author Contributions

Mengliang Zhang designed and performed the experiments, analyzed the data and wrote the paper under Dr. Peter de B. Harrington’s supervision.

Conflicts of Interests

The authors declare no conflict of interest.

References

  1. Bakke, B.; Stewart, P.A.; Waters, M.A. Uses of and exposure to trichloroethylene in US industry: A systematic literature review. J. Occup. Environ. Hyg. 2007, 4, 375–390. [Google Scholar] [CrossRef] [PubMed]
  2. Beamer, P.I.; Luik, C.E.; Abrell, L.; Campos, S.; Martinez, M.E.; Saez, A.E. Concentration of trichloroethylene in breast milk and household water from Nogales, Arizona. Environ. Sci. Technol. 2012, 46, 9055–9061. [Google Scholar] [CrossRef] [PubMed]
  3. Zogorski, J.S.; Carter, J.M.; Ivahnenko, T.; Lapham, W.W.; Moran, M.J.; Rowe, B.L.; Squillace, P.J.; Toccalino, P.L. Volatile Organic Compounds in the Nation’s Ground Water and Drinking-Water Supply Wells; U.S. Geological Survey: Reston, VA, USA, 2006; p. 16. [Google Scholar]
  4. Forkert, P.G.; Lash, L.; Tardif, R.; Tanphaichitr, N.; Vandevoort, C.; Moussa, M. Identification of trichloroethylene and its metabolites in human seminal fluid of workers exposed to trichloroethylene. Drug Metab. Dispos. 2003, 31, 306–311. [Google Scholar] [CrossRef] [PubMed]
  5. Munch, D.J.; Hautman, D.P. USEPA Method 551.1: Determination of Chlorination Disinfection Byproducts, Chlorinated Solvents, and Halogenated Pesticides/Herbicides in Drinking Water by Liquid-Liquid Extraction and Gas Chromatography with Electroncapture Detection; US Environmental Protection Agency: Cincinatti, OH, USA, 1995. [Google Scholar]
  6. Dehon, B.; Humbert, L.; Devisme, L.; Stievenart, M.; Mathieu, D.; Houdret, N.; Lhermitte, M. Tetrachloroethylene and trichloroethylene fatality: Case report and simple headspace SPME-capillary gas chromatographic determination in tissues. J. Anal. Toxicol. 2000, 24, 22–26. [Google Scholar] [CrossRef] [PubMed]
  7. Cervera, M.I.; Beltran, J.; Lopez, F.J.; Hernandez, F. Determination of volatile organic compounds in water by headspace solid-phase microextraction gas chromatography coupled to tandem mass spectrometry with triple quadrupole analyzer. Anal. Chim. Acta 2011, 704, 87–97. [Google Scholar] [CrossRef] [PubMed]
  8. Jakubowska, N.; Henkelmann, B.; Schramm, K.W.; Namiesnik, J. Optimization of a novel procedure for determination of VOCs in water and human urine samples based on SBSE coupled with TD-GC-HRMS. J. Chromatogr. Sci. 2009, 47, 689–693. [Google Scholar] [CrossRef] [PubMed]
  9. Liu, Y.; Muralidhara, S.; Bruckner, J.V.; Bartlett, M.G. Trace level determination of trichloroethylene in biological samples by headspace solid-phase microextraction gas chromatography/negative chemical ionization mass spectrometry. Rapid Commun. Mass Spectrom. 2008, 22, 797–806. [Google Scholar] [CrossRef] [PubMed]
  10. Poli, D.; Manini, P.; Andreoli, R.; Franchini, I.; Mutti, A. Determination of dichloromethane, trichloroethylene and perchloroethylene in urine samples by headspace solid phase microextraction gas chromatography–mass spectrometry. J. Chromatogr. B 2005, 820, 95–102. [Google Scholar] [CrossRef]
  11. Xu, N.; Vandegrift, S.; Sewell, G.W. Determination of chloroethenes in environmental biological samples using gas chromatography coupled with solid phase micro extraction. Chromatographia 1996, 42, 313–317. [Google Scholar] [CrossRef]
  12. Arthur, C.L.; Pawliszyn, J. Solid phase microextraction with thermal desorption using fused silica optical fibers. Anal. Chem. 1990, 62, 2145–2148. [Google Scholar] [CrossRef]
  13. Risticevic, S.; Niri, V.H.; Vuckovic, D.; Pawliszyn, J. Recent developments in solid-phase microextraction. Anal. Bioanal. Chem. 2009, 393, 781–795. [Google Scholar] [CrossRef] [PubMed]
  14. Vas, G.; Vekey, K. Solid-phase microextraction: A powerful sample preparation tool prior to mass spectrometric analysis. J. Mass Spectrom. 2004, 39, 233–254. [Google Scholar] [CrossRef] [PubMed]
  15. Ai, J. Solid phase microextraction for quantitative analysis in nonequilibrium situations. Anal. Chem. 1997, 69, 1230–1236. [Google Scholar] [CrossRef]
  16. Risticevic, S.; Lord, H.; Gorecki, T.; Arthur, C.L.; Pawliszyn, J. Protocol for solid-phase microextraction method development. Nat. Protoc. 2010, 5, 122–139. [Google Scholar] [CrossRef] [PubMed]
  17. NIST. Nist standard reference database number 69. Avalable online: http://webbook.nist.gov/chemistry/ (acessed on 14 October 2014).
  18. Garrido Frenich, A.; Romero-Gonzalez, R.; Martinez Vidal, J.L.; Martinez Ocana, R.; Baquero Feria, P. Comparison of solid phase microextraction and hollow fiber liquid phase microextraction for the determination of pesticides in aqueous samples by gas chromatography triple quadrupole tandem mass spectrometry. Anal. Bioanal. Chem. 2011, 399, 2043–2059. [Google Scholar] [CrossRef] [PubMed]
  19. Massart, D.L.; Vandeginste, B.G.M.; Deming, S.N.; Michotte, Y.; Kaufman, L. Chemometrics: A Textbook; Elsevier: Amsterdam, The Netherlands, 1988. [Google Scholar]
  20. Rezaee, M.; Assadi, Y.; Hosseinia, M.R.M.; Aghaee, E.; Ahmadi, F.; Berijani, S. Determination of organic compounds in water using dispersive liquid-liquid microextraction. J. Chromatogr. A 2006, 1116, 1–9. [Google Scholar] [CrossRef] [PubMed]
  21. Chang, W.T.; Lin, D.L.; Liu, R.H. Isotopic analogs as internal standards for quantitative analyses by GC/MS—Evaluation of cross-contribution to ions designated for the analyte and the isotopic internal standard. Forensic Sci. Int. 2001, 121, 174–182. [Google Scholar] [CrossRef] [PubMed]
  22. Zhang, M.; Harrington, P.B. Application of classical least squares to resolve overlapping mass spectral peak clusters between trichloroethylene and its deuterated internal standard. Rapid Commun. Mass Spectrom. 2015, in press. [Google Scholar]

