
Ecosystem Services Valuation of Lakeside Wetland Park beside Chaohu Lake in China


1
Department of Statistics, School of Science, Anhui Agricultural University, 130 West Changjiang Road, Hefei 230036, China
2
Department of Spatial Information Science, School of Science, Anhui Agricultural University, 130 West Changjiang Road, Hefei 230036, China
*
Author to whom correspondence should be addressed.
Water 2016, 8(7), 301; https://doi.org/10.3390/w8070301
Submission received: 31 May 2016
/
Revised: 4 July 2016
/
Accepted: 13 July 2016
/
Published: 19 July 2016
(This article belongs to the Special Issue Tackling Complex Water Problems in China under Changing Environment)
Abstract
:Wetland ecosystems are one of the three great ecosystems on Earth. With a deepening of research on wetland ecosystems, researchers have paid more and more attention to wetland ecosystem services such as flood mitigation, climate control, pollution prevention, soil-erosion prevention, biodiversity maintenance, and bio-productivity protection. This study focuses on a lakeside wetland ecosystem in Hefei, a city in central China, and estimates the value of ecosystem services such as material production, air purification, water conservation, biodiversity, recreation, species conservation, education and scientific research. We adopted the market value method, carbon tax method, afforestation cost method, shadow engineering method and contingent value method (CVM) using questionnaire survey data during the study period. The results show that the total value of the ecosystem services of Lakeside Wetland Park was 144 million CNY in 2015. Among these services, the value of society service is the maximum at 91.73 million CNY, followed by ecological service and material production service (42.23 million CNY and 10.43 billion CNY in 2015 respectively). When considering wetland ecosystems for economic development, other services must be considered in addition to material production to obtain a longer-term economic value. This research reveals that there is scope for more comprehensive and integrated model development, including multiple wetland ecosystem services and appropriate handling of wetland ecosystem management impacts.
1. Introduction
The wetland ecosystem is one of the most significant ecosystems on Earth. Its unique ecological system features interaction between water and land. Wetland ecosystems offer animals, plants, and microorganisms a place to live, while also being rich in biodiversity. Wetland ecosystems are known as the “kidney of the Earth” because they purify the environment by processing pollutants. The evaluation of ecosystem services reveals the important contribution of this ecological system to human beings’ welfare and provides the basis for the establishment of ecological compensation standards, the participation of stakeholders, and the decisions of management. This is the main reason that a large number of scholars research the evaluation of ecosystem services [1].
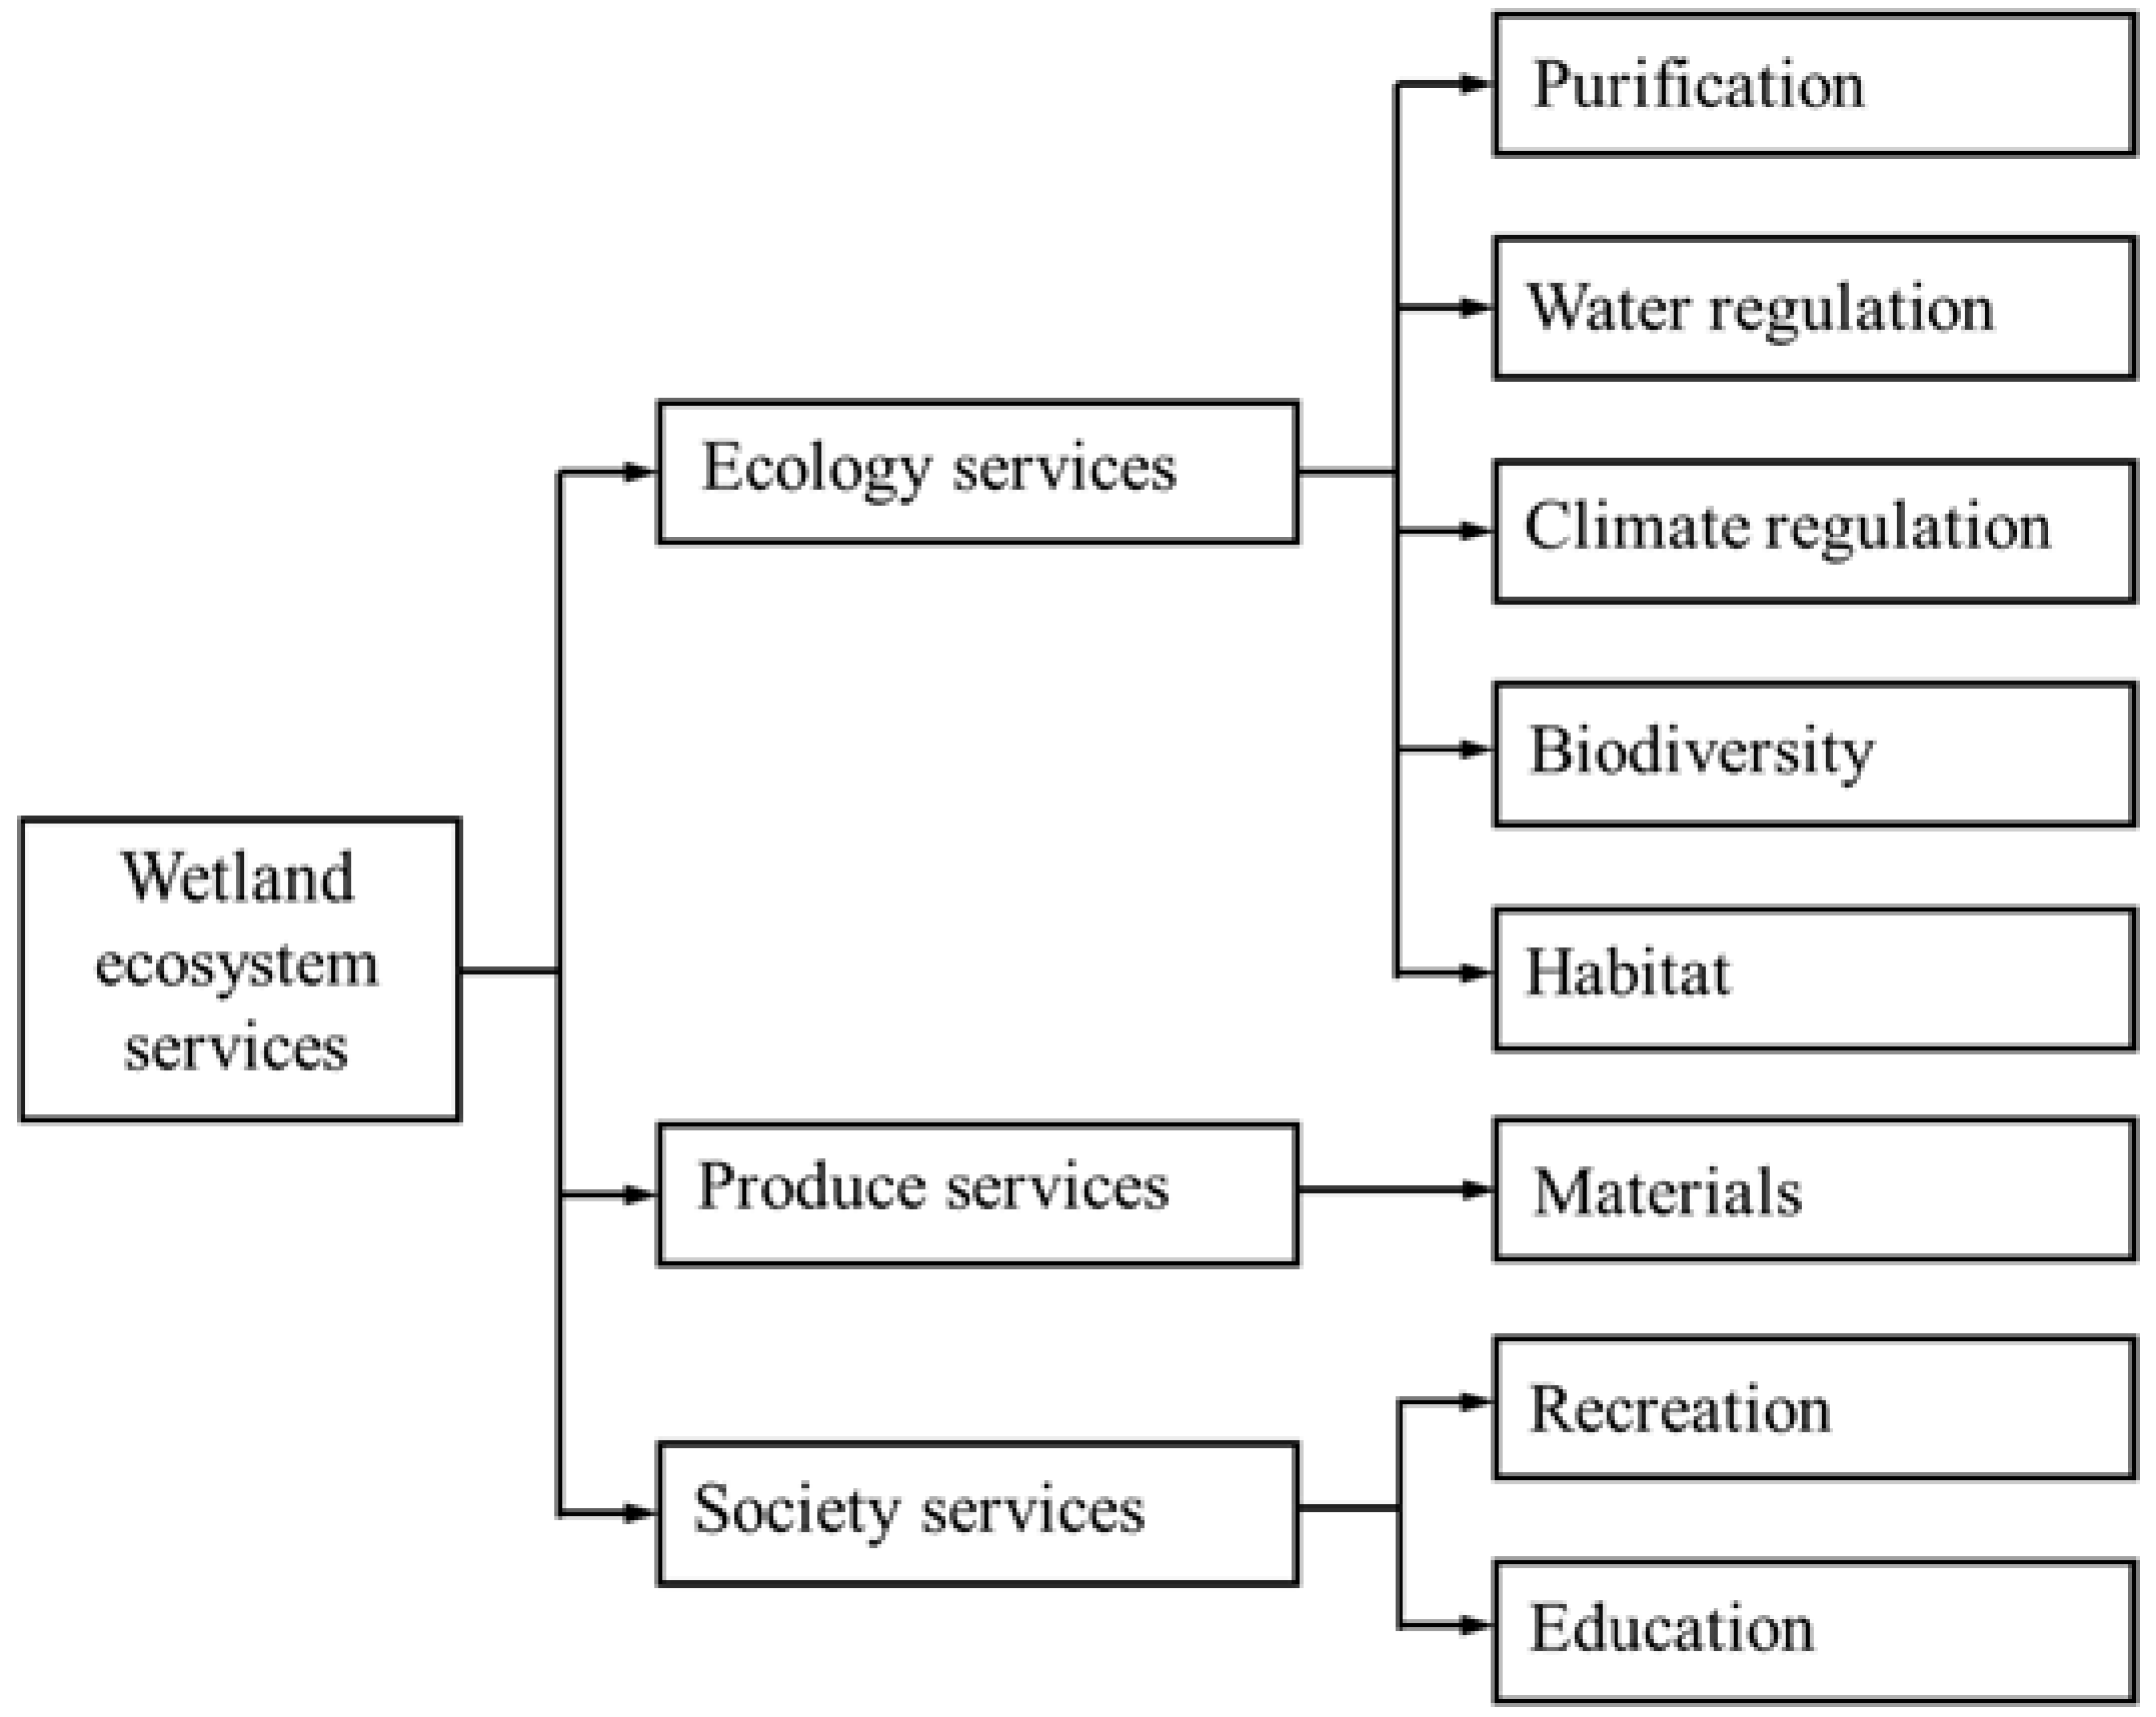
At present, the evaluation of the ecosystem service of wetland ecosystems is mainly concentrated on the classification of wetland ecosystem services and different methods [2,3,4,5,6,7,8] to calculate the value of services. The Millennium Ecosystem Assessment divides ecosystem services into provision services, regulating services, cultural services, and support services [5]. From the application aspect, value can be divided into “use value” (UV) and “non-use value” (NUV). The UV is divided into “direct use value” (DUV) and “indirect use value” (IUV) including the ecological services value, whereas the NUV mainly contains “option value” (OV), “existing value” (EV), and “heritage value” [9,10].
The option value (OV) is the same as an insurance premium for an uncertain future [11]. The existing value (EV) is considered to be the intrinsic value of the ecological system. It is the evaluation of the ecological environment of the capital and its value mainly depends on humans’ subjective consciousness, which implies that it changes continuously with human understanding of the services of the wetland ecosystem. In addition, the non-use value also includes the heritage value [5]. The relationship among these services is complex, as shown in Figure 1.
Recent researches include such projects as, “Intergovernmental Platform on Biodiversity and Ecosystem Services” [12], “Ecosystem Services Partnership” [13], the establishment of “Integrating Biodiversity Science for Human Wellbeing” [14], and “The Economics of Ecosystems and Biodiversity” [15].
Domestic researches in China have mainly focused on wetland ecosystem service evaluation using such methods as the market value method, shadow engineering method, market price method and contingent value method. In 1999, Ouyang calculated the Chinese land ecosystem service value altogether [16]. Chen [17] used the classification by Constanza as a reference and evaluated the benefit of Chinese ecological system services. Cui [18] analyzed the dominant services of the Poyang Lake wetland and evaluated the services of water conservation, flood regulation, carbon oxygen release, pollutants degradation, soil conservation, and biological habitat protection.
Recent researches show that there are significant changes in evaluating methods of ecosystem services value. Some surveys establish new models to assess the stability and sustainability of ecosystems [19,20]. Continuing research on complex interaction of wetland ecological services is significant in China, because the interaction of small scale wetland is closely related to residence factors which frequently affect human production activities. At the same time, wetland ecosystem service value assessment in China is more focused on direct value. These researches underestimate indirect value such as the recreation value of wetland ecosystem service, and they also lack data on the interaction effects between humanity and ecology in small scale wetland.
A wetland ecosystem service assessment system should fully reflect the direct contribution of wetland ecosystems to human well-being while improving the reliability of evaluation results and avoiding overly complex calculations. At the same time, the evaluation methods and evaluation parameters should provide the basis for the establishment of a wetland ecosystem service index system and improve the repeatability, scalability, and management efficiency of wetland ecosystem services. Based on these goals, this paper focuses on the lakeside wetland ecosystem surrounding Chaohu Lake in Hefei, China. This research includes the value of material production services and society services, as shown in Figure 2 (the first five services shown are the indirect use value, while the others represents direct use value).
2. Research Area
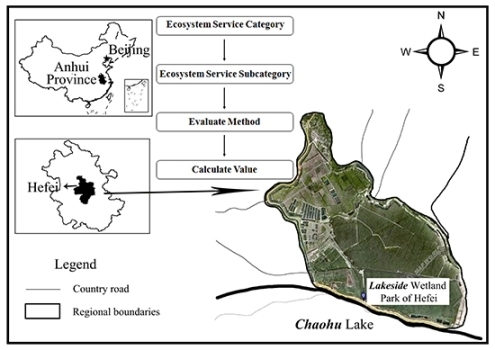
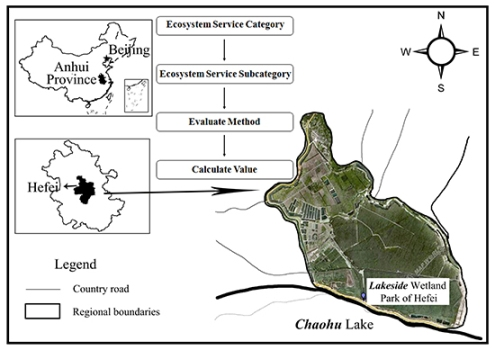
There are abundant wetland resources surrounding Chaohu Lake, where the ecosystem is protected by the building of a series of wetland parks, and the region was listed in the first group of 66 national level eco-civilized pioneering demonstration parks in China. The Lakeside Wetland Park in the basin, located in Baohe District of Hefei City, is the first ecologically restored park of grain-for-green at the national level across China and is in prime geographical position with Chaohu Lake—China’s fifth largest freshwater lake—to the south. The Lakeside Wetland Park covers an area of 1072 hm2, with a forest coverage (rate) of 74.58% and a crown density of 0.70–0.90. The water area is 262.6 hm2, accounting for 24.50% of the total protective region, which includes five rivers, 75 ditches and 204 ponds. The combination of a natural water system and the forest environment in the park forms a multi-layer, multi-function forestry eco-network structure and landscape effect. The park, with 2698 negative oxygen ions per cubic centimeter in the air, is up to the standard of class-6 national health resorts. Because of the integration of urban forest, wetland forest and cultural forest, the Lakeside Wetland has diverse services including water purification, water conservation, air purification, biodiversity, recreation, production and education (Figure 3).
2.1. Geographic Location
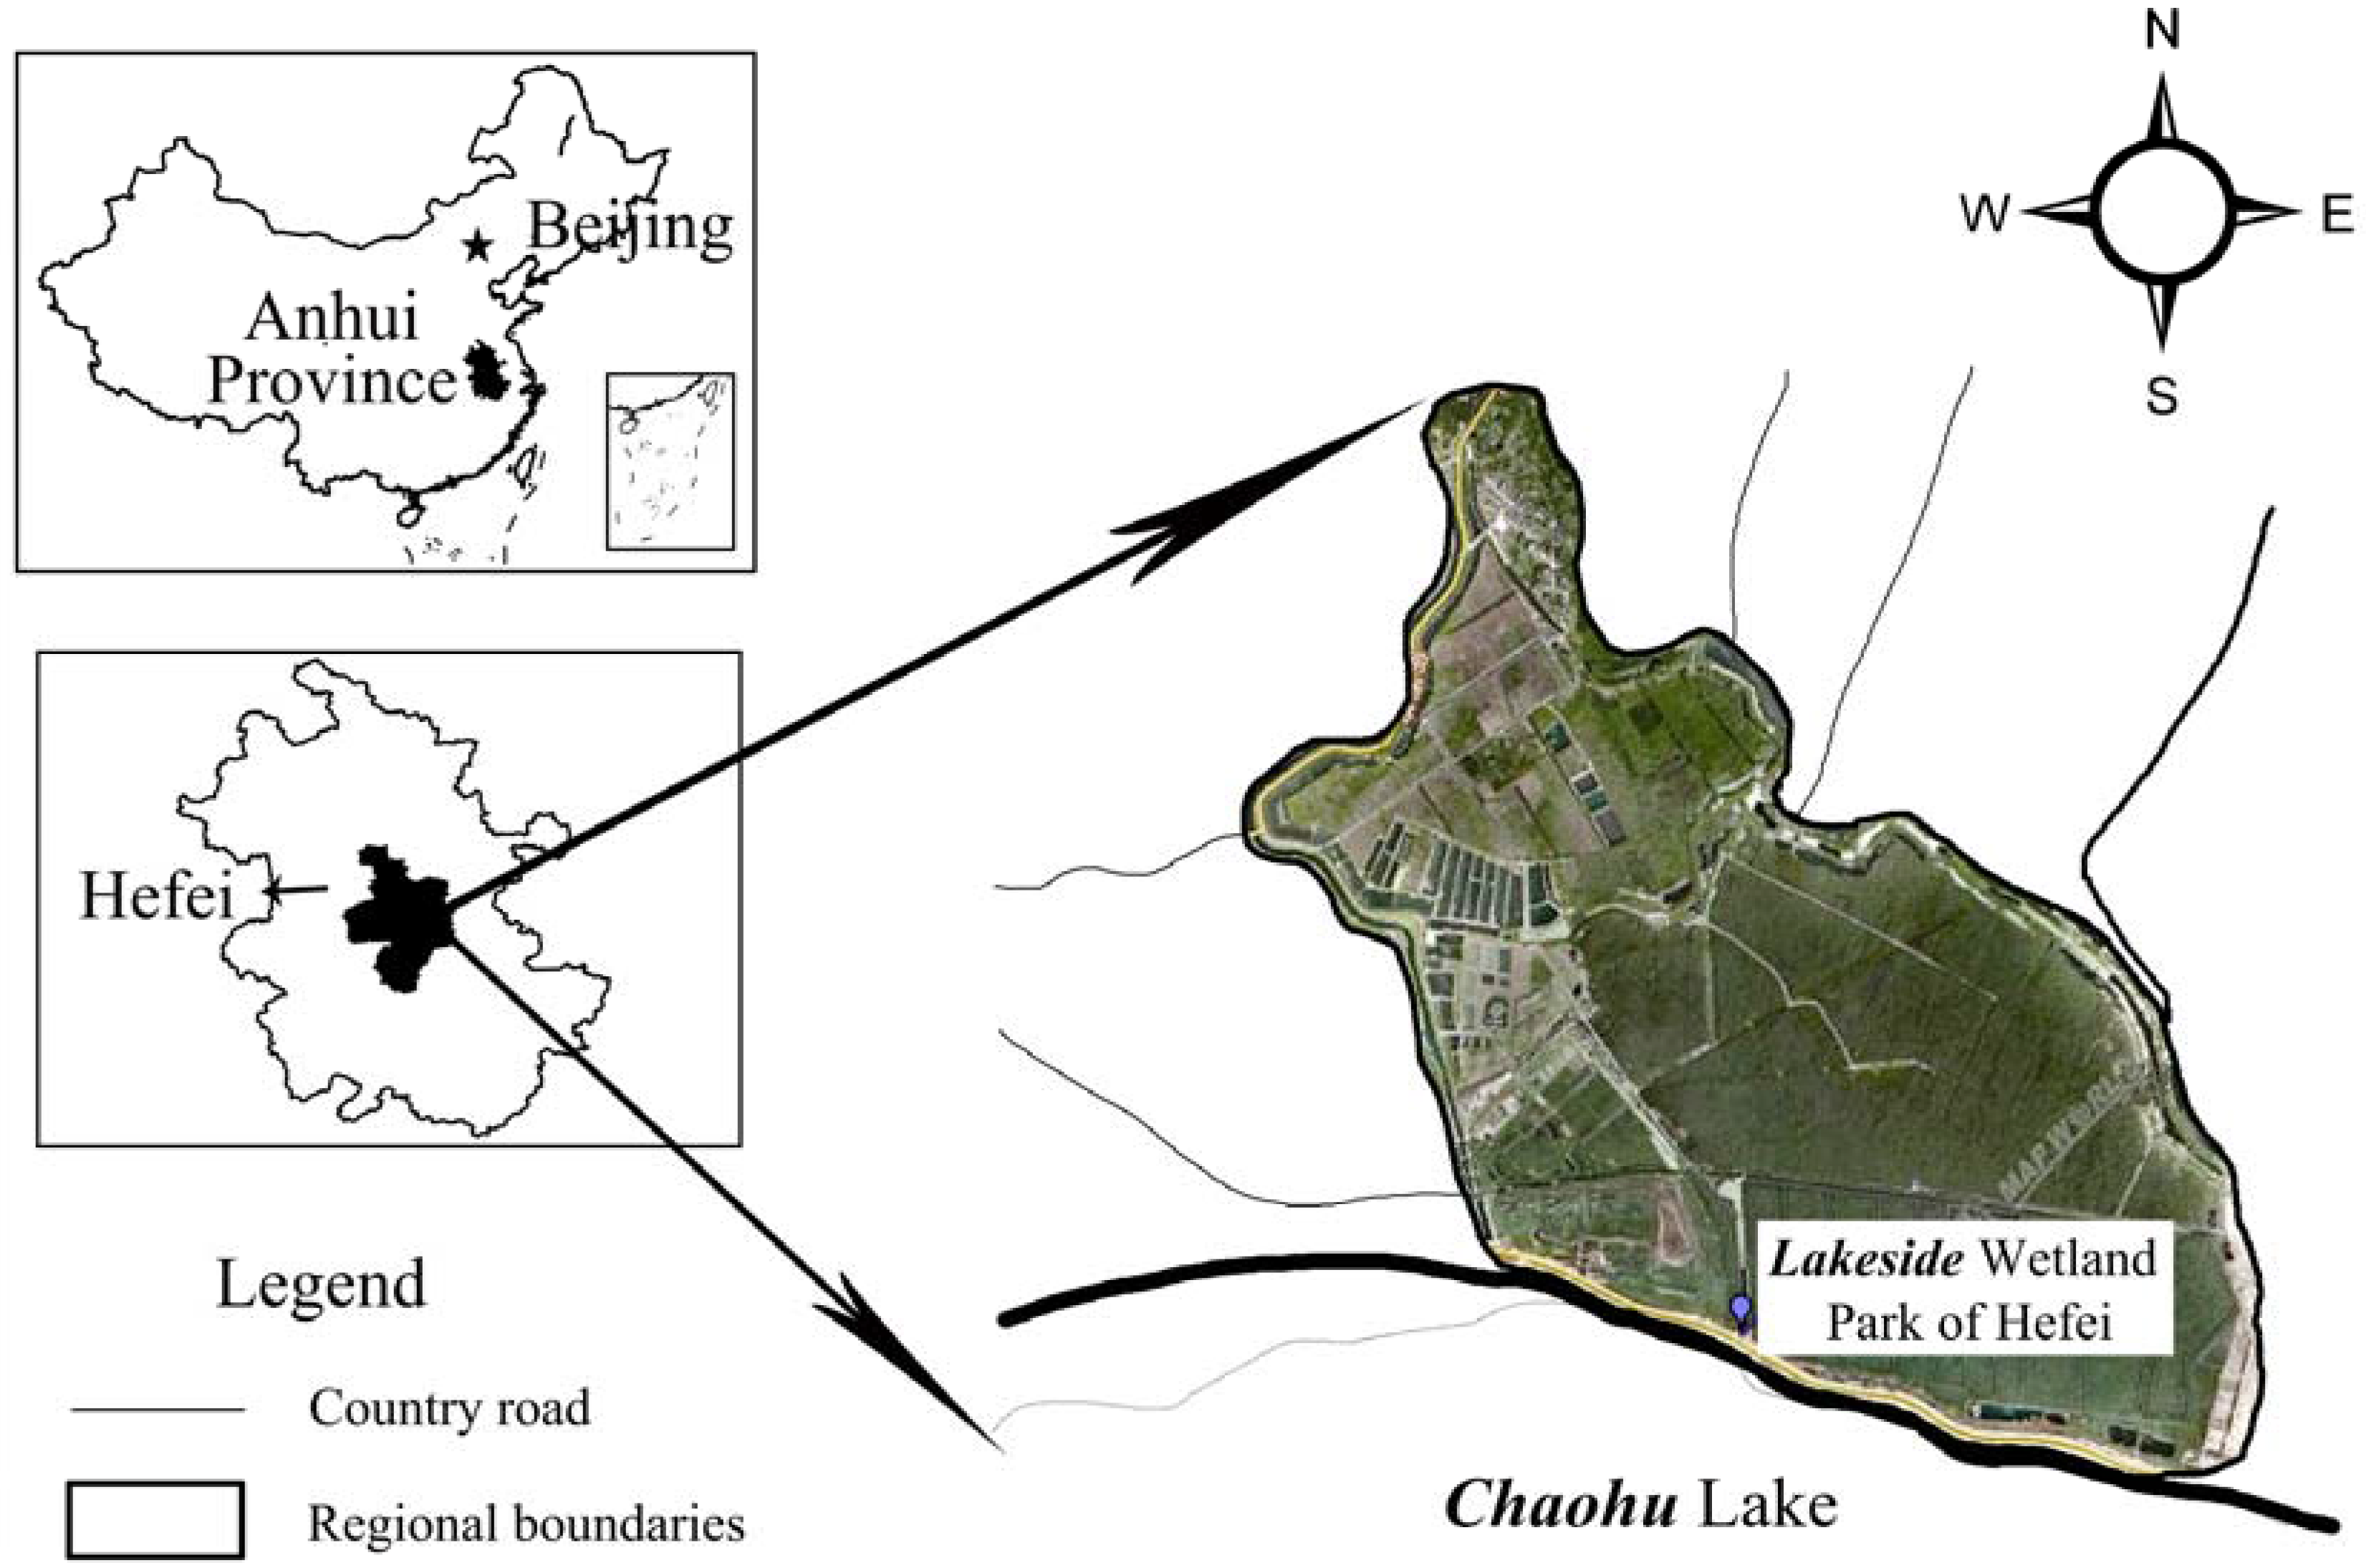
The Lakeside Wetland Park, located in the southeast of the city of Hefei city, is at the junction of North China (of the Palaearctic Realm) and Central China (of the Oriental Realm), near where the Nanfei River flows into the Chaohu Lake. It has a total planned area of 1072.00 hm2 (31°42′45″~31°45′24″ N, 117°22′32″~117°23′29″ E). Refer to Figure 4 for the exact location. The park, surrounded by flat peripheral terrain, is on the south side of the Jianghuai watershed, with the topography of a plain formed by the Nanfei River, the Paihe River and Chaohu Lake.
2.2. Climate Condition
The Park is influenced by the subtropical humid monsoon climate, which has an annual average temperature of 15–16 °C (1.5–5.0 °C in January and 27–28 °C in July) and an annual frost-free period of 245 days. The annual average relative humidity is 76% and the annual average precipitation is 1057 mm inside the park. The latter is mainly from June to September. With abundant sunshine in the park, the mean annual sunshine duration is 2287.9 h and the gross radiation intensity is 110–120 kcal/cm2. The maximum radiation is in July, while August has the maximum sunshine duration.
2.3. Hydrologic Condition
The Lakeside Wetland Park has five surface rivers: the Nanfei River, Shiwuli River, Jiazi River, Weixi River, and Jiaomu River (Table 1). They all belong to the Chaohu Lake water system of the Yangtze River basin. The total length of surface rivers inside the park is 12.8 km, with 62.18 hm2 of water surface area.
Besides those five rivers, there are 75 ditches in the park, with a total length of 119.5 km and a water surface area of 39.75 hm2. There are altogether 204 ponds in the park, with a total area of 160.67 hm2. Ditches, channels, roads, forests and water have formed many waterside plant associations and a forest landscape that has ecological, scenic, and strolling features.
2.4. Natural Resources
There are 86 families, 204 genera, and 281 species of vegetation in the Lakeside Wetland Park that need maintenance and management (Table 2). The outstanding environment provides favorable conditions for birds and animals to multiply. Inside the park, there are 18 orders of vertebrates, and 47 families, 75 species, and 50 kinds of birds. Among these, the Eurasian Spoonbill, little swan, duck, peregrine falcon, short-eared owl, and small coucal owl are six animal species that belong to class two of national protected animals. There are 26 animal species being protected by Anhui Province. There are tens of thousands of migratory birds that spend the winter in the park.
Reed is one of the most typical plants in the park, with an area of 78.6 hm2. It is an important production material in agriculture, the salt industry, fisheries, aquaculture, and the weaving industry with high economic value and ecological value. There are altogether 175.4 hm2 of grapes located in the northern part of the park. It also has abundant herbal resources: goose grass, dayflower, crabgrass, duchesnea, bidens grass, pennisetum, and ferns. In the wetland muck, there is a rich array of mollusks. There is also an artificial pond with 30 thousand farmed fish.
2.5. Society and Environment Condition
The Baohe District, which contains the wetland park, is the “first urban area” of Anhui Province, located in the southeast of Hefei City. It connects to “five rivers” (Bao, South Fei, Shiwuli, Tangxi, and Pai) and leads to “one lake” (one of the five major freshwater lakes in China—Chaohu Lake). The entire district has an area of 340 km2 (among which the Chaohu basin has a water area of 70 km2). The permanent residential population is 1.26 million. In 2012, the GDP of Baohe was 55 billion CNY, the financial revenue was 2.93 billion CNY, and the total retail sales of social consumer goods was 20.85 billion CNY. The urban disposable income per capita was 26,583 CNY, and the pure income per capita for farmers was 11,409 CNY. The total forest area of Baohe District is 5213.33 hm2, and the total area of forest and wood is 7553.33 hm2. The forest coverage rate is approximately 28.2%; the green coverage rate in urban areas is 44.5%; and the green space rate in urban areas is 41.3%. The public green area per capita is 13.6 m2.
3. Data Sources and Research Methods
3.1. Data Sources
The data in the current article are mainly from field surveys and the local statistical yearbook. In order to grasp the status of flora and fauna in the wetland, methods like route surveys and investigations based on observation points and sampling locations are used. An overall exploration was done in the park in 2015–2016. In addition, the monitoring data of water and atmospheric air quality are from the park and the park regional environmental quality monitoring report which was composed by the local environmental protection department of Hefei.
The data involved in this study are divided into two categories: background data and questionnaire data. The background data of this study are divided into two parts: current data and historical data. The current data are mainly from 2015 to 2016 sampling survey, which includes wetland water quality data, biological data (including phytoplankton, benthic animals, and fish) and plant data. We select 5 m × 5 m woody quadrant investigation in each sample, and within each woody sample select five 1 m × 1 m herb samples, including a total of 150 samples. The research content includes many kinds of woody plants (noting physical quantity), and herbaceous vegetation types (noting physical quantity, coverage, abundance, average height, etc.). To merge the field investigation results and the previous data, Global Positioning System (GPS) precise positioning is done to establish corresponding interpretation signs in ERDAS 8.6 (Intergraph Corporation, Huntsville, AL, USA) for man–machine interactive interpretation to edit and verify the wetland area data. Historical data is provided by various management departments such as the local forestry bureau and the Bureau of Wetland Nature Reserves. Vegetation identification and classification are based on “the ecological types of Anhui vegetation”, with “China’s wetland vegetation” as the standard.
Wetland resource status data included many aspects: the general situation of the wetland, situation of wetland resources, wetland management situation (including wetland area and wetland type), wetland evaporation, average temperature of wetland, wetland material output, wetland aquatic vegetation, wetland water conservation amount, wetland species number, higher floristic composition, zooplankton species quantity, species of benthic animal quantity, species quantity, birds species number, number of mammal species, wetland management agencies basic situation, protection of wetland resources input, wetland water quality index data, and wetland annual number of tourists.
The questionnaire data mainly includes a survey questionnaire to determine willingness to pay for the recreational value of the wetland. The questionnaire was conducted in the wetland park to understand the awareness degree of both the surrounding residents and tourists to the urban wetland. The main contents of the questionnaire are as follows: (1) investigate the awareness of wetlands including the degree of familiarity and protection awareness (e.g., willingness to pay, etc.); (2) investigate the basic situation of the survey respondents: education level, economic conditions, etc.
In this study, the data sources of recreation services valuation are based on the random sampling principle. Questionnaires were used in the field survey. A total of 280 questionnaires were handed out and 267 questionnaires (95.36%) were actually recovered. Among them, 254 questionnaires were valid, giving a 95.13% effective recovery rate of questionnaires.
3.2. Market Value Method
The market value method is used in the study to evaluate the value of wetland material production services [21]. The market value method measures the economic benefits or losses of changes in environmental quality by using changes in regional output or profits caused by environmental quality changes. The superiority and inferiority of an environment and the size of an ecological effect are reflected in the quality of its related products. Using this method to estimate the value of material production and services in the wetland park is usually considered looking at the direct benefits but not the indirect benefits. The exchange value of goods or tangible commodities is considered while the ecological service value generated is virtually ignored. Thus, the calculation results may be relatively one-sided. Despite this, the market value method is one of the most direct ways to estimate the value of material production and services of the wetland system. The formula is given in detail as follows:
Here, U1 is the material production value of wetland resources (CNY·a−1). Si is the area (hm2) of the material resources of type i. Wi is the per unit output (kg·hm−2) of type i material. Pi is the average market price (CNY·kg−1) of type i material for the year.
3.3. Carbon Tax Method and Afforestation Cost Method
In this study, the carbon tax and afforestation cost method were used to estimate the service value of carbon sequestration and oxygen release by the wetland ecosystem. The carbon tax and afforestation cost method are the two most-used methods for the evaluation of these service values. For the carbon tax method, we get the quantity relationship of fixed CO2 and O2 release from the photosynthesis reaction equation, and then multiply by national or international standards on CO2 emission charges, which converts material quantity to value amount thereby getting the value of fixed CO2. The afforestation cost method refers to the construction cost of the forest that can absorb equal amounts of CO2 to replace the value of other means to absorb CO2 [22]. Here we use the fixed CO2 amounts sequestered by the ecosystem, multiplied by the average unit cost of afforestation and forest stock needed to sequester the same amount, and use that to estimate the value of fixed CO2 of ecosystem. According to the photosynthesis equation
1.63 g CO2 is needed and 1.20 g O2 will be released by a plant to produce 1 g of dry matter, wherein the fixed pure amount of C is 0.44 g; that is, the content of C element accounts for about 45% of dry matter. Combining this result with the biomass of wetland plants, the fixed CO2 and O2 releases of wetland plants can be calculated separately.
Generally, the Swedish tax rate will be used in the carbon tax calculation and then converted to a tax rate for fixed CO2. For the afforestation cost, the average reforestation cost of fir, pine, and paulownia will be used, and then converted into the cost of fixed CO2 [23]. In practice, when estimating the value of carbon sequestration and oxygen release, the estimation of carbon sequestration normally uses the average value of carbon taxes and afforestation costs. In this way, it is even closer to the real value and this method has been widely used [24]. For the evaluation of oxygen release value, the average value of afforestation costs and industrial oxygen production costs are applied. The formula is as follows:
where U2 represents the value of climate regulation functions, namely, fixed CO2 and O2 release value; C represents carbon sequestration; Pc is the average value of the international universal carbon tax rate and the cost of reforestation in China; O is the amount of oxygen released; and Po is the average price of afforestation and industrial oxygen production costs. We have
where NPPi is the first productivity of i type plant, and Si is the area of i species plant.
NPPi is calculated as follows:
NPP (net primary productivity) is an estimated result. The photosynthetic products fixed in plant photosynthesis are reduced by respiration-based consumption of the plants themselves, also known as primary productivity. The Chikugo model [25] is the mechanism of calculating plant growth through considering adequate soil moisture and vegetation growth conditions, and calculating the net radiation and radiation dryness to get NPP model. The formulas are as follows:
where NPP is vegetation’s net primary productivity (tDM·hm−2·a−1), RDI is radiation dryness, L is the latent heat of evaporation in J·g−1, r is annual precipitation in cm·a−l, and Rn is the net amount of radiation obtained by the land surface (kcal·cm−2·a−1). Thereby, the value of the main carbon fixation and oxygen release plants in Lakeside Wetland Park on climate regulation can be calculated. The latent heat of evaporation has the following relation with temperature t:
3.4. Shadow Engineering Method
The shadow engineering method can be used to estimate the value of flood control and water storage. The gross storage capacity of Lakeside Wetland Park, as the usable storage, can be used to estimate the service value of flood regulation and water storage. To be specific, we use the building cost of projects required to store a corresponding volume as an estimate for the service value, based on the fact that 0.67 CNY [26] is invested to build 1 m3 of reservoir capacity in China at present. The water area of Lakeside Wetland Park is 262.6 hm2. Reed fields, fishponds, canals, and rivers flowing through the park have water storage functions. The total amount of flood regulation and storage V in the wetland is the sum of the above items. When the shadow engineering method is used to estimate the value of flood regulation and water storage, the construction cost of building a reservoir with storage capacity equal to the water yield of this wetland park is the estimate. Then, the mathematical expression of the shadow engineering method that is used to estimate the value of flood regulation and water storage is as follows:
where U3 is the value of flood control and water storage, V represents the total wetland flood storage capacity, and t represents unit cost of capacity. The specific V calculation formula is:
where V is the volume of water storage, Ai is the area of wetland use of i type, and hi is the water storage balance in wetland type i use.
3.5. Results Reference Method
Not only do wetlands have the service value of material production, flood regulation, and water storage as well as carbon fixation and oxygen release, but they also have the service values of purifying gas, biodiversity, species conservation, and cultural education. Since the Lakeside Wetland Park was only opened in 2014, the results reference method will be used on the evaluation of those above-mentioned service values. The results reference method is to use one or more evaluation methods to estimate the economic value of a similar environmental service function. This estimator will be amended and adjusted and then applied to the regional environment of interest [27]. The basic steps of the results reference method are as follows. First, analyze previous research results to find and evaluate similar cases. Then, obtain the currency value of the environmental service function through basic economic methodology and calculate the value of unit time. Apply the result to the region to be estimated and acquire evaluation results. The cost of the results reference method is very low since it is convenient and efficient to find the research results for reference, analyze the data rationality, and reconstruct it if necessary. The accuracy of this method can be relatively increased if two similar evaluation objects can be found. Otherwise, the possible error can be relatively large. Shao [28] employed this method to evaluate the value of biological habitats provided by the Yinchuan Lakeside Wetland ecosystems. Gi [29] used this method to evaluate the cultural value and values for scientific research, as well as the value of pollutant degradation and biodiversity conservation, of the east Chongming marsh ecosystem.
Because Lakeside Wetland Park is located by the shore of Chaohu Lake with rich wetland resources providing the service of pollutant degradation, it helps to maintain a good ecological environment. However, Lakeside Wetland Park’s phase I and phase II opened only in 2012 and 2013, respectively, and its phase III has not been fully completed yet, so its processing capability for pollutants such as heavy metals, chemical oxygen demand (COD), and biochemical oxygen demand (BOD) is still unknown. Therefore, results using the reference method are used to evaluate the value of pollutant degradation and purification services of this wetland park.
where U4 is the value function for pollutant degradation, A is the area of wetland, and W1 is the value of the purification service per unit area, using as reference the public value from Constanza [30] (refer to Table 3).
The results reference method is also used to calculate biodiversity value. According to results of an investigative report by Xie [31], the unit value of wetland ecosystem biodiversity conservation is 2212.2 (hm2·a). Substituting this into Formula (12), the biodiversity conservation value of Lakeside Wetland Park is
where U5 is the value function for biodiversity, A is the area of wetland, and W2 is the value of the purification service of a unit area, with the reference value being the public value from Constanza [30] (refer to Table 3).
The results reference method is used to calculate species conservation value. Take Constanza’s research results into consideration (see Table 3). The unit area value of species’ habitats function of wetland ecosystems is U$304/hm2, equivalent to 1939.52 CNY/hm2 (exchange rate of US$1 = 6.38 CNY), and Xie [31] average 2344 CNY/hm2 to China’s terrestrial wetland ecosystem assessment, which is 2089 CNY/hm2, as per-unit area was used as the basis of species’ habitats functional value. Formula (13) calculates the total value of species’ habitats of Lakeside Wetland Park as:
where U6 is the value function for species habitat, A is the area of wetland, and W3 is the value of the purification service of a unit area (reference value from Constanza [30] in Table 3).
The unique land and water interaction topography and abundant natural resources have given this lakeside wetland a considerably high scientific research and cultural value, which we calculate with Formula (14):
where U7 is the value function for scientific research and cultural value, A is the area of wetland, and W4 is the value of the purification service of a unit area (reference value from Constanza [30] in Table 3).
3.6. Contingent Value Method (CVM)
In this study, we use the conditional value method to estimate the value of recreational services of this park. The CVM method uses questionnaires to put the non-market environmental resources or services on a virtual market. Estimated market information was provided by the questionnaires, through asking people about their maximum willingness to pay (WTP) through the improvement of environmental quality or minimum willingness to accept (WTA) through toleration of environmental losses. These data are used to work out the value of the environmental goods [32]. To address the core issue of CVM valuation and according to previous research questionnaire results [33], this study used a payment card questionnaire and asked respondents to select their WTP/WTA from a given set of values.
WTA or WTP applicability depends on whether the respondent has clear rights to the environmental goods. If the consumer has clear legal rights to the environmental goods, and you are asking him or her to give up these rights, WTA should be used; otherwise, WTP should be used. This paper follows the above viewpoints and WTP was used in this CVM research evaluation.
where N is the annual number of tourists, E (WTP) is their willingness to pay per capita, and TNUV is the recreational value.
In order to determine the effectiveness of the CVM method [34], we need to check whether the relevance obtained from WTP and individual socio-economic variables is consistent with the principles of economics. Logistic Regression is a widely used qualitative variables regression. This study is based on field research data, and we used the introduction of dummy variables to describe whether there is willingness to pay when these are used as dependent variables. By an independence test, this study can discover the dependency relationship with the dependent variable that is related to social characteristics and treat it as an argument to examine the validity of WTP by carrying out logistic regression:
In the above formula, is the probability of willingness to pay, is observed dependence relationship between individual i and variable , is coefficient, and is an error term in .
4. Results
4.1. Material Production Value
The main products of Lakeside Wetland Park are reeds, grapes, and freshwater fish. Since material goods have exact market prices, the market value method will be used to value material production. There is an area of 71.5 hm2 reeds in Lakeside Wetland Park. In 2015, the reeds buying price was about 0.27 CNY/kg. The grape section has an area of 175.4 hm2, and in 2015 the market price of grapes was about 5 CNY/kg. There are aquatic, wetland plants and other fruit of economic value in the park, but due to the small growing area and their scattered planting, their production value will be omitted. In addition, there is a fish pond of 120.6 hm2 in the park. The production value of these various types of substances can be calculated according to Formula (1) (for details see Table 4).
After calculation, the total material production value of Lakeside Wetland Park is 21.18 million CNY. However, since the grapes and fish ponds are semi-artificial ecosystems, massive material costs and labor costs are needed in the material production process. Therefore, input costs should be deducted from the total value in the actual calculation. Net output calculated in this way gives the real value of material production functions.
From Table 5, we know the material production service value of U1 of Lakeside Wetland in 2015 was 10.4325 million CNY. Since Lakeside Wetland Park opened in 2014, only major products are considered in its production service value assessment, but this still has some significant meaning in the park’s total value assessment.
4.2. Carbon Fixation and Oxygen Releasing Value
According to meteorological statistics for Hefei City, the average annual rainfall within the park is 1057.2 mm, and the total solar radiation amount is 120 kcal·cm−2·a−1 (1 kcal = 4.184 kJ). In terms of the global average, 31% of solar radiation is reflected or scattered back into space, 24% is absorbed by the atmosphere directly, 45% reaches the ground, and for wetland about 10% is reflected by land. Calculating based on all of these, the net radiation in the region was 42 kcal·cm−2·a−1. The annual average temperature of the park is 16 °C. The latent heat of vaporization in Lakeside Wetland Park L is equal to 2469.16 J·g−1 by substitution into Formula (3). Therefore, RDI is equal to 0.67.
According to [25], when RDI < 4, the Chikugo model is applicable and can be used to estimate the net productivity. According to research by Jing Li et al. [35], the primary productivity of subtropical deciduous forest, coniferous forest, mixed deciduous trees, and fruit trees is 11.1 t·hm−2·a−l, 12.8 t·hm−2·a−l, 10.88 t·hm−2·a−l, and 9.41 t·hm−2·a−l, respectively. Combined with data for the trees in the park’s wetlands, we can calculate that the annual organic production masses for these four categories were 5936.28 tons, 32 tons, and 1650.51 tons, respectively. The net reeds primary productivity was estimated according to Equation (4), giving us NPP = 11.05 t·hm−2·a−l.
As of 2015, the current universal international carbon tax rate is U$150/t, equivalent to 957 CNY/t (according to the average exchange rate of the CNY against the US dollar in 2015 of 1:6.38, the same as below). In China, the sequestration afforestation cost is 260.90 CNY/t, so the average Pc sequestration afforestation cost is 608.95 CNY/t, which is calculated as a carbon tax standard. Our Po oxygen production cost is 352.93 CNY/t, and the value is calculated as oxygen fixation. Inputting these into Formulas (3) and (4), the value of carbon sequestration and oxygen release by various kinds of vegetation can be calculated (for details refer to Table 6).
The carbon sequestration and oxygen release value of Lakeside Wetland Park is shown in Table 7. According to photosynthesis equation and value evaluation formula, we can calculate the carbon fixation value of park vegetation is 8.54 million CNY per year, the value of oxygen released is 3.6419 million CNY, and the total value of U2 is 12.18 million CNY.
4.3. Water Conservation Value
Lakeside Wetland Park has a water area of 262.6 hm2, including reed fields, ponds, rivers, ditches and rivers flowing through the wetland, all with water storage functions. V is the sum of the total amount of flood control and water storage of the wetland. According to the survey, the peak of maximum flood control and water storage capacity of five rivers in the Lakeside Wetland Park is 150.93 × 10⁴ m3, as shown in Table 1.
Reed fields, ditches, and ponds which provide flood regulation and water storage in Lakeside Wetland Park cover areas of 78.6 hm2, 39.75 hm2, and 120.6 hm2, respectively. According to Formula (10), the maximum amount of water capacity V at flood peak time can be estimated, which is 219.08 × 10⁴ m3.
Therefore, the total water storage capacity in the peak period is 370.01 × 10⁴ m3. Using the shadow engineering method, an input cost of 0.67 CNY is needed to build 1 m3 of reservoir capacity per year in China; thus, according to Formula (10), the flood control and water storage value of Lakeside Wetland Park as follows: U3 = 370.01 × 10⁴ m3 × 0.67 CNY/m3 = 2.48 million CNY.
4.4. Purification Value
Consider the wetland’s service value per unit area using Constanza’s global wetland ecosystems figures [30] and the pollutant degradation value per unit area using the waste processing function in Xie [31] for Chinese terrestrial wetland ecosystems. We use the average of these two values as the pollutant degradation value per unit area. The unit value of pollutant degradation of global wetland ecosystems is U$4,177/(hm2·a), which is 26,649.26 CNY/(hm2·a), and the unit value of pollutants degradation of wetland ecosystem in China is 16.09 billion/(hm2·a), so the average of these two values is 21,367.93 CNY/(hm2·a). The regional area of Lakeside Wetland Park is 1072 hm2, so using Formula (11) we can calculate the purification function value of Lakeside Wetland Park as 22.91 million CNY.
4.5. Biodiversity Value
According to the field survey, there are 86 families, 204 genera, and 281 species of vegetation that belong to the maintaining or controlling category in Lakeside Wetland Park. Among these, three kinds are national class 1 protected plants and seven kinds are national class 2 protected plants. An incomplete survey recorded vertebrates of 18 orders, 47 families, and 75 species in total. There are more than 50 species of birds, including six kinds of national class 2 protected birds. Water resources are abundant in the park, and amphibians can be seen everywhere; they are an important scenic resource. The results reference method is used to estimate this environment service function, by using investigation of Xie [31]: the unit value of biodiversity protection of the wetland ecosystem is 2212.2 CNY/(hm2·a), which, according to Formula (12), gives the biodiversity value of Lakeside Wetland Park wetland as 2212.2/(hm2·a) × 1072 hm2 = 2.37 million CNY.
4.6. Species Conservation Value
In this study, for the calculation of species conservation value, the results reference method was used. Considering research results by Constanza [30] (see Table 3), the species’ habitat functional value of wetland ecosystem per unit area is U$304/hm2, equivalent to 1939.52 CNY/hm2 (exchange rate of US$1 = 6.38 CNY), was combined with the Xie [31] 2344 CNY/hm2 for China’s terrestrial wetland ecosystem assessment, yielding the average 2141.76 CNY/hm2 as the basis of species’ habitat functional value. The wetland area of Lakeside Wetland Park is about 1072 hm2; thus, according to Formula (13), the total species habitat value of Lakeside Wetland Park is 2.30 million CNY.
4.7. Education Value
There is a wetland biodiversity science demonstration area inside Lakeside Wetland Park, which provides access to the general public to understand wetlands, precious wetlands, and wetland conservation. Indirect estimation is used to do education value estimation. Usually, investment in scientific research and actual investment by researchers is adopted for estimations; however, due to the fact that construction of Lakeside Wetland Park has not been completed, research work has just started. The investment that has occurred so far is far below its real scientific value, so based on the scientific research rating standard, both domestic and international, we make an ad hoc valuation. In this article, we use the mean of three figures: the average scientific and cultural value per unit area estimation of ecosystems in China [17], which is 382 CNY/hm2; the global estimate of this, which is 881$/hm2; and Constanza’s estimate, which is 861$/hm2. (For the latter two, we used the exchange rate US$1 = 6.38 CNY). The mean of these three is 3831.99 CNY/hm2. The total area of Lakeside Wetland Park is 1072 hm2, with a forest area of 799.5 hm2 and wetland water area of 262.6 hm2; thus, according to Formula (14), the scientific research and education value of Lakeside Wetland Park is 4.11 million CNY.
4.8. Recreational Value
At present, the methods of calculating tourism and leisure value are the expenditure method, the travel cost method and the willingness surveying method [36]. In this research we use the conditional valuation method to estimate the landscape recreation service value of Lakeside Wetland Park. For travelling cost calculations, refer to Formula (15).
From Table 8, we can calculate the average willing-to-pay amount per capita equals 194.29 CNY. By retrieval of local statistics, we know there are an average of 451,000 visitors to Lakeside Wetland Park every year. Based on this, the average spending amount in the entire region equals the recreational value of Lakeside Wetland Park, which is 87.62 million CNY.
The CVM model uses willingness to pay as the dependent variable, and personal characteristics of respondents as an independent variable, and then uses a logistic model to test the validity of willingness to pay. Logistic regression explores influence factors and then predicts the probability of even occurrence; it is a generalized linear regression. Here, we first investigate whether there is a relationship between willingness to pay and social characteristics. A virtual variable was introduced: existence of willingness to pay is 1, nonexistence of willingness to pay is 0. An independence test shows that dependency relationships exist among the education background, age, income, and willingness to pay. Whether willingness to pay exists or not is the dependent variable. Education background, age, and income are independent variables. The following model can be obtained after F test and t-test:
where is the occurrence ratio and is the probability of willingness to pay. The results show that the occurrence of the education variable ratio is 0.402 (Table 9), indicating that with the increase of educational experience, the possibility of willingness to pay will increase 0.402 times; if income increases, the possibility of willingness to pay will increase 1.141 times.
5. Conclusions
5.1. The Whole Value and Its Structural Analysis
The above results are summarized in Table 10 below. The total value of the ecosystem services of Lakeside Wetland Park in 2015 is 144 million CNY. Within this, the ecological service value is 42.23 million CNY, accounting for 29.25% of the total value; the production service value is 10.43 million CNY, accounting for 7.22% of the total value; and the social service value is 91.73 million CNY, accounting for 63.52% of the total value. Within the social service category, the value of landscape recreation service is highest, accounting for 60.68% of the value.
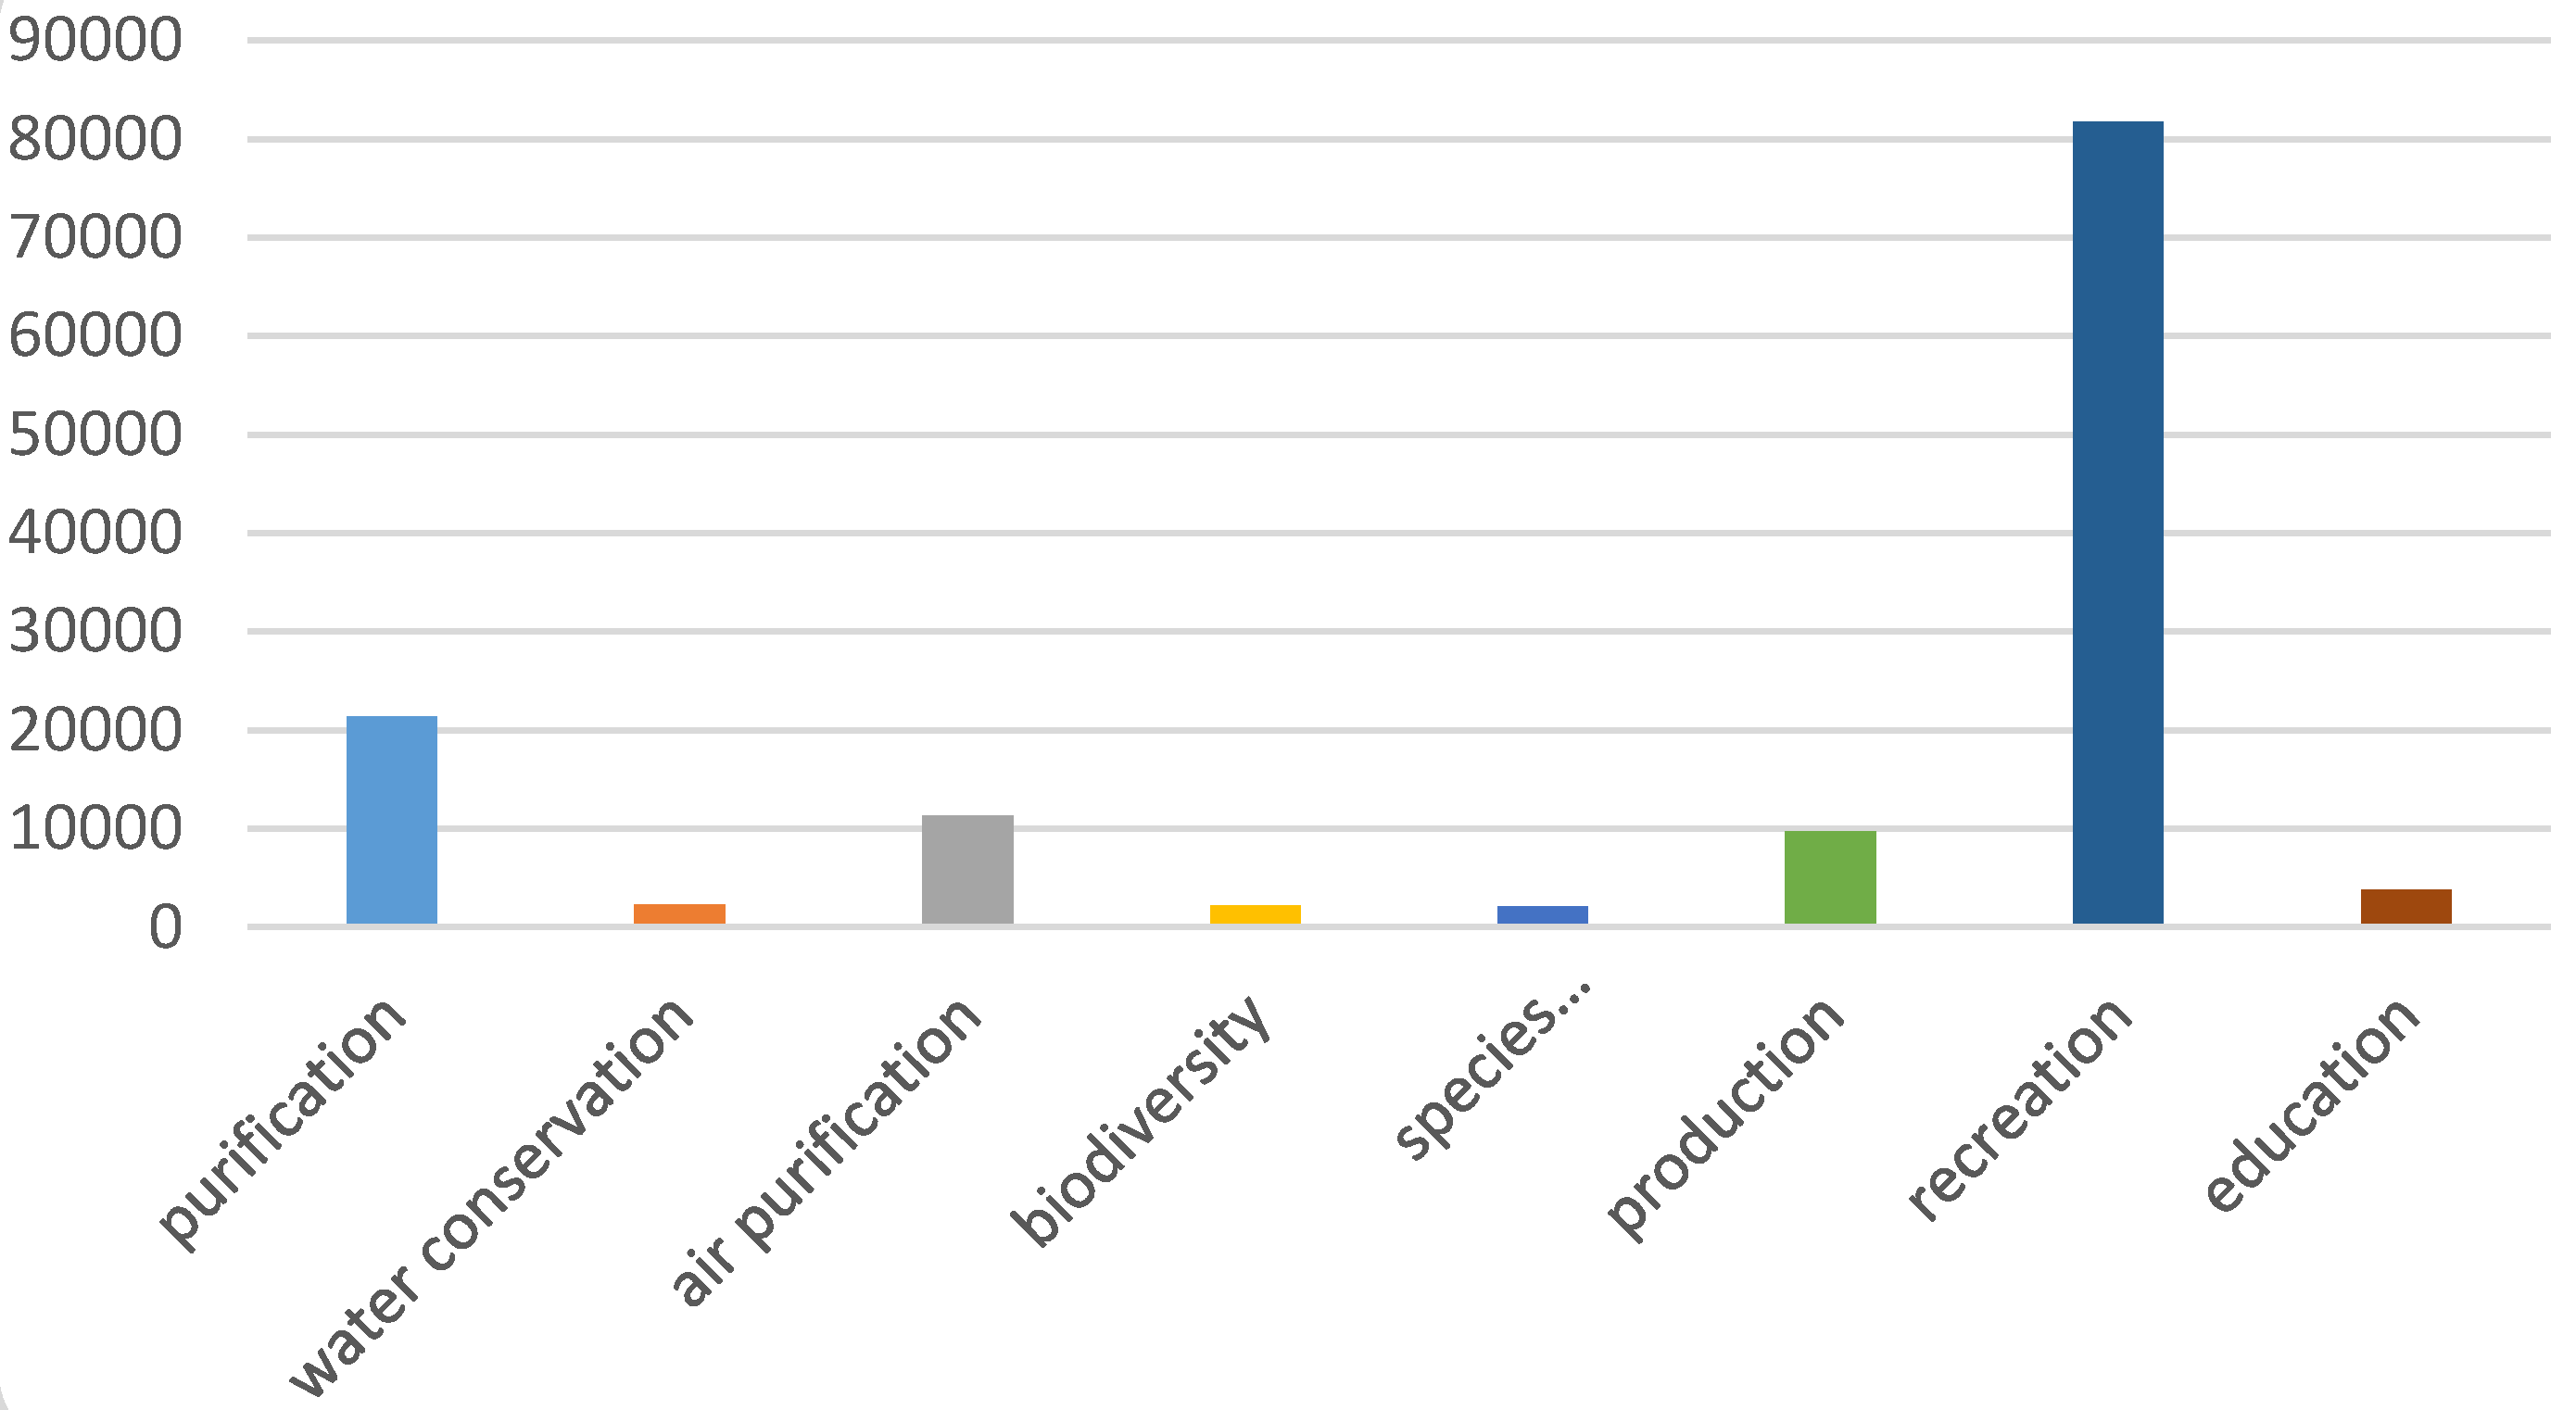
The order of the ecosystem service aspect values for Lakeside Wetland Park is: landscape recreation service (87.62 million CNY) > purification services (22.90 million CNY) > air purification service (12.17 million CNY) > material production service (10.43 million CNY) > scientific research and public education service (4.11 million CNY) > flood storage service (2.48 million CNY) > biodiversity services (0.23 million CNY) > species conservation service (0.229 million CNY) (Figure 5).
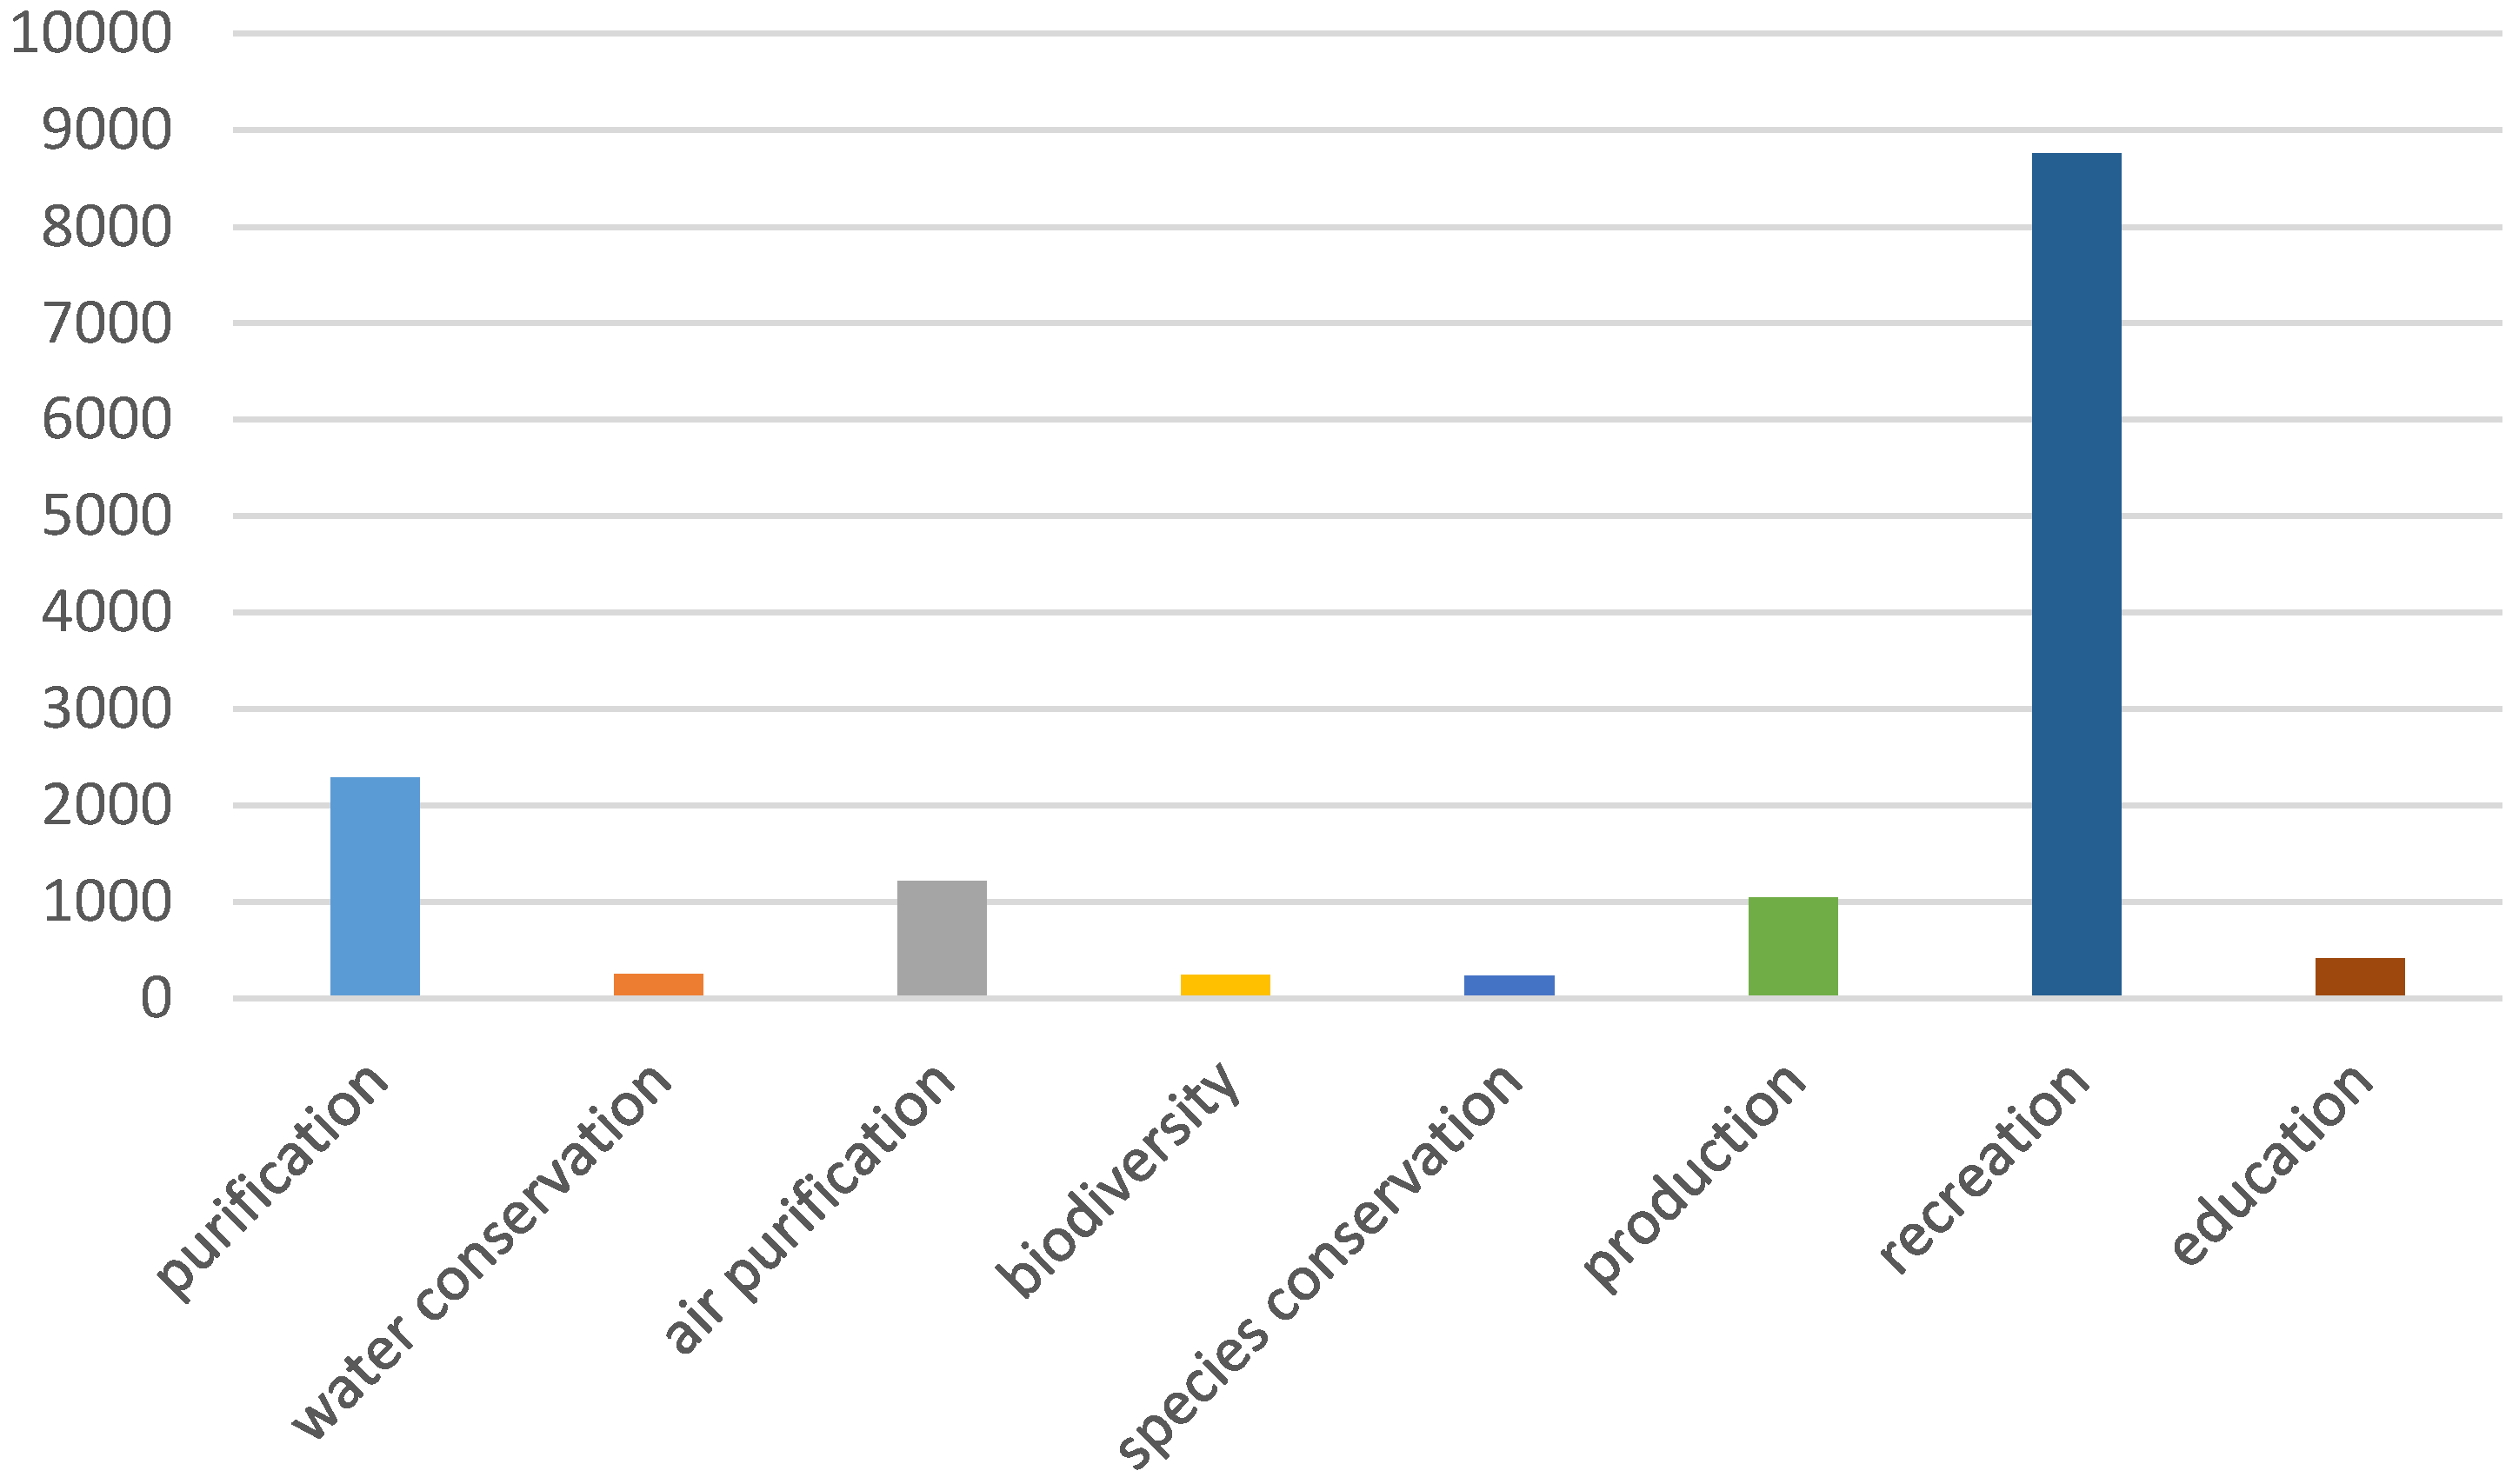
The order of the unit value of the wetland ecosystem aspects is: recreational service (81,739.65 CNY) > purification services (21,367.91 CNY) > atmospheric regulation service (11,359.42 CNY) > material production services (9731.81 CNY) > scientific research education service (3831.99 CNY) > storage service floods (2312.59 CNY) > biodiversity services (2212.22 CNY) > species conservation service (2141.79 CNY) (Figure 6).
From these results, we can see that the proportion of ecological service and social service in the whole value is not reasonable. Due to the limitations of research data, we cannot calculate the complete value of ecological services, such as nutrient cycling and storage or reducing soil erosion, which result in underestimation of the total value. The recreation value we calculate is quite high, which reflects the fact that Lakeside Wetland Park creates some problems for environmental service zoning and construction. In the park, the ecological conservation district is quite a bit smaller than the environmental display district, a situation that offers more recreation service but ignores the conservation of ecological environment. We need to gradually improve construction in this aspect in the future to balance these services.
According to relevant research, the total value of the leading service of Poyang Lake wetland is 36.27 billion CNY, with an area of 36,285 hm2 [18,37]. Another wetland park, the Xixi Wetland Park in Hangzhou, has the similar rank of values to Lakeside Wetland Park in Hefei: landscape recreation service (294 million CNY) > purification services (33.98 million CNY) > material production service (13.75 million CNY) > scientific research and public education service (10.17 million CNY) > air conditioning service (5.53 million CNY) > flood control (4.8 million CNY) > biodiversity services (4.27 million CNY) > species conservation service (3.35 million CNY) [26]. Compared with these wetland ecosystem valuation publications, we find that the value of services is different between natural wetland and urban wetland.
Comparison of Lakeside Wetland Park with Xixi Wetland Park in Hangzhou, the two urban wetland parks have similar total area, but Xixi has more watershed while Lakeside has more forest. Because forest is richer in gas purification services, the results are different in gas purification and air purification services, with Lakeside higher than Xixi. The rank of the value of wetland ecosystem services is also different between these two wetland parks. The valuation of urban wetland parks can be regarded as a useful tool for achieving sustainable wetland ecosystems in cities. Thus, by comparing the relative significance of these indicators, we can effectively determine the significance of each service in different wetland parks for planning and monitoring sustainable wetland ecosystems, potentially contributing to the management of different types of wetland ecosystems.
5.2. The Sustainable Development of the Wetland Surrounding Chaohu Lake
Because of its unique ecological structure and geographical features, Lakeside Wetland Park has its own biological diversity. Therefore, the Lakeside Wetland Park has a very important role to enrich the lives of the residents of Hefei, improve the ecological environment in Hefei, and enhance the regional ecological environment quality and ecosystem health. This evaluation of the environmental services can provide suggestions for further study of the establishment of the ecological compensation from the development and utilization of the wetland ecosystems. Rational utilization of Lakeside Wetland Park is an important foundation for a sustainable development of economy and society in Hefei. With the further improvement and maturity of the wetland ecosystem, the value of the service will be further improved.
5.3. The Influence of Different Evaluation Methods
In the evaluation of material production services, we have only considered the main products in Lakeside Wetland Park, which underestimate the results if all factors were included. We use the carbon tax method and cost method to calculate the value of air purification; this result is comprehensive estimated and has credibility. We evaluate the water conservation service using an accurate measure of water, so this facet of the result is accurate. Leisure entertainment, culture education, and biodiversity are basically estimates, but using the whole region estimation values gives reasonable accuracy. Wetlands can provide many environmental services, so the provision and efficiency of the services have obvious externalities [38,39,40,41]. A limitation is that this research only calculated the use-value in Lakeside Wetland Park, omitting the non-use value. In addition, although we use a variety of methods to estimate the services, we have not established a complete evaluation system, so the evaluation methods need further investigation in order to guide economic construction better.
This study used different methods to effectively obtain the relative values of different services in the urban wetland park. Different research methods affect the results, so it is very important to establish unified evaluation criteria. The calculation of the cost and benefits from different angles will affect the calculated value of wetland ecosystem services. The literature shows that urban wetland parks have a huge recreational value in urban wetland ecosystems. For instance, the value of this part in Beijing Olympic Forest Park Wetland, the West Lake in Hangzhou, and Wuhan Yuehu is, respectively, 39.87%, 99.43%, and 26.83% [42]. Parks such as the Lakeside Wetland Park, as an urban wetland with a complex natural–economic–social ecosystem, are known to provide many valuable ecological benefits to urban ecosystems. Hefei is the capital city of the Anhui Province, and Anhui is undergoing a rapid urbanization process similar to that in many parts of the world. There is an urgent need for urban wetland restoration and management as a key element of urban master planning, and this implies that it is of great significance to evaluate urban wetland ecosystems correctly. Different regions of different types of urban wetland ecosystem structures, resources and functions should get more attention to enhance the scientific management level and rational utilization of resources.
Acknowledgments
This research is supported by the National Natural Science Foundation of China (Grant No. 71503004). We also wish to acknowledge the support of Anhui Provincial Department of Environmental Protection (2015-5).
Author Contributions
The research presented here was carried out in collaboration between all authors. Tan Li contributed to the original idea for the study and designed/conducted the research methods. Xiang Gao contributed to the writing of the map. All authors discussed the structure and commented on the manuscript at all stages.
Conflicts of Interest
The authors declare no conflict of interest.
References
- Engel, S.; Pagiola, S.; Wunder, S. Designing Payments for Environmental Services in Theory and Practice—An Overview of the Issues. Ecol. Econ. 2008, 65, 663–674. [Google Scholar] [CrossRef]
- De Groot, R.S.; Alkemade, R.; Braat, L.; Hein, L.; Willemen, L. Challenges in integrating the concept of ecosystem services and values in landscape planning, management and decision making. Ecol. Complex. 2010, 7, 260–272. [Google Scholar] [CrossRef]
- Fisher, B.; Turner, R.K.; Morling, P. Defining and classifying ecosystem services for decision making. Ecol. Econ. 2009, 68, 643–653. [Google Scholar] [CrossRef]
- Daily, G.C. Nature’s Services: Societal Dependence on Natural Ecosystems; Island Press: Washington, DC, USA, 1997. [Google Scholar]
- Millennium Ecosystem Assessment. Ecosystems and Human Well-Being: Biodiversity Synthesis. 2005. Available online: http://www.unep.org/maweb/documents/document.354.aspx.Pdf (accessed on 15 July 2016).
- Lu, D.M. Analysis and Research on the Environmental Function of Hefei Lakeside Forest Park. Master’s Thesis, Hefei University of Technology, Hefei, China, 2014. [Google Scholar]
- Ten Brink, P.; Berghofer, A.; Schroter-Schlaack, C.; Sukhdev, P.; Vakrou, A. The Economics of Ecosystems and Biodiversity for National and International Policy mMakers-Summary: Responding to the Value of Nature. 2011. Available online: http://www.teebweb.org/publication/teeb-for-policy makers summary responding-to-the value-of-nature/ (accessed on 15 July 2016).
- Goldstein, J.H.; Caldarone, G.; Duarte, T.K.; Ennaanay, D.; Hannahs, N.; Mendoza, G.; Polasky, S.; Wolny, S.; Daily, G.C. Integrating ecosystem-service tradeoffs into land-use decisions. Proc. Natl. Acad. Sci. USA 2012, 109, 7565–7570. [Google Scholar] [CrossRef] [PubMed]
- Barbier, E.B. Valuing environmental functions: Tropical wetlands. Land Econ. 1994, 70, 155–173. [Google Scholar] [CrossRef]
- Kamshat, T.; Ronny, B.; Torleif, B.; Raikhan, B. Investigating Willingness to Pay to Improve Water Supply Services: Application of Contingent Valuation Method. Water 2015, 7, 3024–3039. [Google Scholar]
- Pearce, D.W. Blueprint: Capturing Global Environmental Value; Earthscan: London, UK, 1995; Volume 48. [Google Scholar]
- IPBES. Intergovernmental Platform on Biodiversity and Ecosystem Services. 2015. Available online: http://www.ipbes.net/ (accessed on 15 July 2016).
- ESP. Ecosystem Services Partnership. 2015. Available online: http://www.es-partnership.org/esp (accessed on 15 July 2016).
- DIVERSITAS. Integrating Biodiversity Science for Human Well-Being. 2015. Available online: http://www.diversitasinternational.org/ (accessed on 15 July 2016).
- TEEB. The Economics of Ecosystems and Biodiversity. 2015. Available online: http://www.teebweb.org/ (accessed on 15 July 2016).
- Ouyang, Z.Y.; Wang, X.K.; Miao, H. A primary study on Chinese terrestrial ecosystem services and their ecological-economic values. Acta Ecol. Sin. 1999, 19, 607–613. (In Chinese) [Google Scholar]
- Chen, Z.X.; Zhang, X.S. The value of ecosystem benefit in China. Chin. Sci. Bull. 2000, 45, 17–22. (In Chinese) [Google Scholar] [CrossRef]
- Cui, L.J. Evaluation on functions of Poyang Lake ecosystem. Chin. J. Ecol. 2004, 23, 47–51. (In Chinese) [Google Scholar]
- Huang, L.; Zhang, Z. The Stability of Vegetated Ecosystems in Sandy Areas: An Assessment and Prediction Index an Assessment and Prediction Index. Water 2015, 7, 1969–1990. [Google Scholar] [CrossRef]
- Li, Y.L.; Zhang, Q.; Yao, J. Investigation of Residence and Travel Times in a Large Floodplain Lake with Complex Lake-River Interactions: Poyang Lake (China). Water 2015, 7, 1991–2012. [Google Scholar] [CrossRef]
- Li, H.L.; Zhao, S.L. Evaluation on function of Baiyun Lake ecosystem. J. Shandong Norm. Univ. (Natl. Sci.) 2005, 20, 51–53. (In Chinese) [Google Scholar]
- Zhao, T.Q.; Ouyang, Z.Y.; Zheng, H. Forest ecosystem services and their valuation in China. J. Natl. Resour. 2004, 19, 480–491. (In Chinese) [Google Scholar]
- Editorial Committee of State Report on Biodiversity of China Committee State Report on Biodiversity of China Beijing; China Environmental Science Press: Beijing, China, 1998; pp. 45–47. (In Chinese)
- Xiao, H.; Ouyang, Z.Y.; Zhao, J.Z.; Wang, X.K. Forest ecosystem services and their ecological valuation: A case study of tropical forest in Jianfengling of Hainan Island. Chin. J. Appl. Ecol. 2000, 11, 481–484. (In Chinese) [Google Scholar]
- Zhou, G.S.; Zhang, X.S. A natural vegetation NPP model. Acta Phytoecol. Sin. 1995, 19, 1932–2001. (In Chinese) [Google Scholar]
- Li, J.N. Studies on the Ecosystem Services of Xixi, Hangzhou. Master’s Thesis, Southwest University, Chongqing, China, 2006. [Google Scholar]
- Wang, Y. Research on Method Development and Application about Regional Accounting of Environmental Value; Ocean University of China: Qingdao, China, 2006; Volume 28. (In Chinese) [Google Scholar]
- Shao, N.P.; Liu, X.P.; Qu, X.Y. Valuation of Lake Wetland ecosystem services of Yinchuan. Chin. J. Ecol. 2008, 27, 1625–1630. (In Chinese) [Google Scholar]
- Gi, L.N.; Wen, Y.P. Wetland Ecosystem Services Valuation of Chongming Dongtan. Chin. Agric. Sci. Bull. 2013, 29, 160–166. (In Chinese) [Google Scholar]
- Constanza, R.; d’Arge, R.; de Groot, R. The value of the world’s ecosystem services and natural capital. Nature 1998, 25, 3–15. [Google Scholar]
- Xie, G.D.; Lu, C.X.; Cheng, S.K. Progress in evaluating the global ecosystem services. Resour. Sci. 2001, 23, 8–11. (In Chinese) [Google Scholar]
- Wang, X.; Zhang, Y.Y. Assessing willingness to accept compensation for polluted farmland: A contingent valuation method case study in northwest China. Environ. Earth Sci. 2016, 75, 179. [Google Scholar] [CrossRef]
- Dionysis, L.; Zisis, M.; Pericles, L. Valuing the benefits of an urban park project: A contingent valuation study in Thessaloniki, Greece. Land Use Policy 2016, 55, 130–141. [Google Scholar]
- Gnanadesikan, R. Methods for Statistical Data Analysis of Multivariate Observations, 2nd ed.; Wiley-Interscience: New York, NY, USA, 1977. [Google Scholar]
- Li, J.; Sun, G.N.; Ren, Z.Y. Study on Mass Survey and Value Evaluation of Land-vegetation’s Primary Productivity in Qinba Mountains in Shaanxi Province. Acta Ecol. Sin. 2002, 22, 2254–2259. (In Chinese) [Google Scholar]
- Nielsen, A.B.; Olsen, S.B.; Lundhede, T. An economic valuation of the recreational Benefits associated with nature-based forest management practices. Landsc. Urban Plan. 2007, 80, 63–71. [Google Scholar] [CrossRef]
- Zhu, J.X. Study on the Environmental Impact Assessment in Tourism of Poyang Lake National Wetland Park; Jiangxi University of Finance and Economics: Nanchang, China, 2010; Volume 54. (In Chinese) [Google Scholar]
- Laurans, Y.; Mermet, L. Ecosystem services economic valuation, decision-support system or advocacy? Ecosyst. Serv. 2014, 7, 98–105. [Google Scholar] [CrossRef]
- Jia, H.F.; Ma, H.T.; Wei, M.J. Urban wetland planning: A case study in the Beijing central region. Ecol. Complex. 2011, 8, 213–221. [Google Scholar] [CrossRef]
- Lee, T.H.; Hsieh, H.-P. Indicators of sustainable tourism: A case study from a Taiwan’s wetland. Ecol. Indic. 2016, 67, 779–787. [Google Scholar] [CrossRef]
- Campbella, L.K.; Svendsen, E.S.; Sonti, N.F.; Johnson, M.L. A social assessment of urban parkland: Analyzing park use and meaning to inform management and resilience planning. Environ. Sci. Policy. 2016, 62, 34–44. [Google Scholar] [CrossRef]
- Xu, H. Study on Resources Assessment and Ecosystem Services Value of Urban Wetlands; China University of Geosciences: Beijing, China, 2013. (In Chinese) [Google Scholar]
Figure 1.
The classification of wetland ecosystem services.

Figure 2.
The classification of ecosystem services of Hefei lakeside wetland.

Figure 3.
(a) Lakeside Wetland Park; and (b) aerial view of Lakeside Wetland Park.

Figure 4.
The geographic location of Lakeside Wetland Park.

Figure 5.
The composition of value in different service of Lakeside Wetland Park (unit: 104 CNY).

Figure 6.
The composition of value in per unit in different service of Lakeside Wetland Park (unit: CNY).
Figure 6.
The composition of value in per unit in different service of Lakeside Wetland Park (unit: CNY).


| Stream | Start–Stop | Length (km) | Width (m) | Area (hm2) | Runoff (m3/s) | Reservoirs (104 m3) |
|---|---|---|---|---|---|---|
| Nanfei | To Chaohu Lake | 4.1 | 48 | 19.7 | 98 | 54.6 |
| Shiwuli | From Shu mountain to Chaohu Lake | 1.1 | 20 | 2.2 | 45 | 4.64 |
| Jiazi | To Nanfei River | 3.7 | 70 | 25.9 | 5.5 | 67.86 |
| Weixi | To Shiwuli River | 2.1 | 60 | 12.6 | 42 | 19.91 |
| Jiaomu | To Nanfei River | 1.65 | 12 | 1.98 | 4 | 3.92 |
| Total | 62.38 | 150.9 |
| Vegetation | Area (hm2) |
|---|---|
| Deciduous Forests | 521.5 |
| Coniferous Forests | 15.8 |
| Deciduous Broadleaved Mixed Forest | 8.2 |
| Grape | 175.4 |
| Reed | 78.6 |
| Total | 799.5 |
| Service | Per Unit Value ($/hm2) |
|---|---|
| Waste Treatment | 4,177 |
| Water Adjustment | 15 |
| Water Supply | 3,800 |
| Air Purification | 133 |
| Regulating Disturbance | 4,539 |
| Species Conservation | 304 |
| Material Production | 256 |
| Raw Material | 106 |
| Entertainment | 574 |
| Cultural | 881 |
| Total | 14,785 |
| Type | Area/hm2 | Per Unit Volume (103 kg/hm2) | Total Volume (103 kg) | Price (CNY/kg) | Value (104 CNY/a) |
|---|---|---|---|---|---|
| Reed | 71.5 | 3.92 | 280.06 | 0.27 | 7.56 |
| Grape | 175.4 | 18.25 | 3200.67 | 5 | 1600.34 |
| Freshwater Fish | 120.6 | 4.23 | 510.52 | 10 | 510.52 |
| Total | 367.5 | 10.86 | 3991.25 | 15.27 | 2118.42 |
| Type | Value (104 CNY/a) | Invest (104 CNY/a) | Net Production (104 CNY/a) |
|---|---|---|---|
| Reed | 7.56 | 4.22 | 3.34 |
| Grape | 1600.34 | 884.94 | 715.4 |
| Freshwater Fish | 510.52 | 185.97 | 324.55 |
| Total | 2118.42 | 3075.13 | 1043.25 |
| Vegetation | Area (hm2) | NPP (t/hm2·a) | Organic (t) | Carbon (t) | Oxygen (t) |
|---|---|---|---|---|---|
| Deciduous Forests | 521.5 | 11.1 | 5,788.65 | 9,435.5 | 6,946.38 |
| Coniferous Forests | 15.8 | 12.8 | 202.24 | 329.65 | 242.69 |
| Deciduous Broadleaved Mixed Forest | 8.2 | 10.88 | 89.22 | 145.42 | 107.06 |
| Grape | 175.4 | 9.41 | 1,650.51 | 2,690.33 | 1,980.61 |
| Reed | 78.6 | 11.05 | 868.53 | 1,415.70 | 1,042.24 |
| Total | 799.5 | 55.24 | 8,599.15 | 14,016.6 | 10,318.98 |
| Vegetation | Carbon Fixation (104 CNY) | Oxygen Release (104 CNY) | Total (104 CNY) |
|---|---|---|---|
| Deciduous Forests | 574.57 | 245.16 | 819.73 |
| Coniferous Forests | 20.07 | 8.57 | 28.64 |
| Deciduous Broadleaved Mixed Forest | 8.86 | 3.78 | 12.64 |
| Grape | 163.83 | 69.90 | 233.73 |
| Reed | 86.21 | 36.78 | 122.99 |
| Total | 853.54 | 364.19 | 1217.73 |
| Payment (CNY) | Population | Percentage (%) | Cumulative Percentage (%) |
|---|---|---|---|
| 5 | 3 | 1.55 | 1.5 |
| 10 | 13 | 6.74 | 8.29 |
| 15 | 3 | 1.55 | 9.84 |
| 20 | 9 | 4.66 | 14.5 |
| 30 | 6 | 3.11 | 17.61 |
| 40 | 3 | 1.55 | 19.16 |
| 50 | 16 | 8.29 | 27.45 |
| 60 | 9 | 4.66 | 32.11 |
| 70 | 3 | 1.55 | 33.66 |
| 90 | 3 | 1.55 | 35.21 |
| 100 | 51 | 26.42 | 61.63 |
| 200 | 25 | 12.96 | 74.59 |
| 300 | 11 | 5.71 | 80.3 |
| 400 | 4 | 2.07 | 82.37 |
| 500 | 28 | 14.52 | 96.89 |
| 1000 | 6 | 3.11 | 100 |
| Effect | Point Estimation | 95% Lower | 95% Upper |
|---|---|---|---|
| Education | 0.402 | 0.225 | 0.719 |
| Income | 1.141 | 1.038 | 1.255 |
| Service | Category | Value (104 CNY) | Percent (%) | Unit Value (CNY/hm) |
|---|---|---|---|---|
| Ecology | Purification | 2290.64 | 15.86 | 21,367.91 |
| Water Conservation | 247.91 | 1.72 | 2312.59 | |
| Air Purification | 1217.73 | 8.43 | 11,359.42 | |
| Biodiversity | 237.15 | 1.64 | 2212.22 | |
| Species Conservation | 229.6 | 1.59 | 2141.79 | |
| Production | 1043.25 | 7.22 | 9731.81 | |
| Society | Recreation | 8762.49 | 60.68 | 81,739.65 |
| Education | 410.79 | 2.84 | 3831.99 | |
| Total | 14,439.56 | 100 | 134,697.4 |
© 2016 by the authors; licensee MDPI, Basel, Switzerland. This article is an open access article distributed under the terms and conditions of the Creative Commons Attribution (CC-BY) license (http://creativecommons.org/licenses/by/4.0/).
Share and Cite
MDPI and ACS Style
Li, T.; Gao, X. Ecosystem Services Valuation of Lakeside Wetland Park beside Chaohu Lake in China. Water 2016, 8, 301. https://doi.org/10.3390/w8070301
AMA Style
Li T, Gao X. Ecosystem Services Valuation of Lakeside Wetland Park beside Chaohu Lake in China. Water. 2016; 8(7):301. https://doi.org/10.3390/w8070301
Chicago/Turabian StyleLi, Tan, and Xiang Gao. 2016. "Ecosystem Services Valuation of Lakeside Wetland Park beside Chaohu Lake in China" Water 8, no. 7: 301. https://doi.org/10.3390/w8070301
Note that from the first issue of 2016, this journal uses article numbers instead of page numbers. See further details here.