Article

Attribution of Runoff Change for the Xinshui River Catchment on the Loess Plateau of China in a Changing Environment

1
State Key Laboratory of Hydrology-Water Resources and Hydraulic Engineering, Nanjing Hydraulic Research Institute, Nanjing 210029, China
2
Research Center for Climate Change, Ministry of Water Resources, Nanjing 210029, China
3
School of Resources and Environment, University of Electronic Science and Technology of China, No. 2006, Xiyuan Avenue, Chengdu 611731, China
4
Big Data Research Center, University of Electronic Science and Technology of China, No. 2006, Xiyuan Avenue, Chengdu 611731, China
*
Author to whom correspondence should be addressed.
Water 2016, 8(6), 267; https://doi.org/10.3390/w8060267
Submission received: 6 May 2016 / Revised: 14 June 2016 / Accepted: 15 June 2016 / Published: 22 June 2016
(This article belongs to the Special Issue Tackling Complex Water Problems in China under Changing Environment)

Abstract

:
Stream flow plays a crucial role in the environment, society, and the economy, and identifying the causes of changes in runoff is important to understanding the impact of climate change and human activity. This study examines the variation trends in recorded runoff for the Xinshui River, a tributary of the Yellow River on the Loess Plateau, and uses hydrological simulations to investigate how climate change and human activity have contributed to those trends. Results show that the recorded runoff at the Daning station on the Xinshui River declined significantly from 1955–2008 with an abrupt change occurring in 1973. The Simplified Water Balance Model (SWBM) simulates monthly discharge well with a Nash–Sutcliffe efficiency (NSE) coefficient of 78% and a relative error of volumetric fit (RE) of 0.32%. Runoff depth over the catchment in 1973–2008 fell by 25.5 mm relative to the previous period, with human activity and climate change contributing 60.6% and 39.4% of the total runoff reduction, respectively. However, the impacts induced by climate change and human activities are both tending to increase. Therefore, efforts to improve the ecology of the Loess Plateau should give sufficient attention to the impacts of climate change and human activity.

1. Introduction

Water is a fundamental element for human life as well as ecological systems. It is crucial to the environment, society as a whole and the economy, particularly in arid areas [1]. Variability of stream flow presents a challenge to water supply security and is therefore of great interest to local communities [2].
Due to climate change and intensive human activity, the discharge of many rivers around the world has been changing. Growing water consumption and diversion schemes have reduced annual runoff in about 22% of the world’s rivers [3]. Recorded runoff in six major rivers in China generally decreased from 1950–2010, with significant falls occurring in major northern rivers [4]. For example, the Yellow River ran dry for 226 days in 1997. Runoff in the Middle Yellow River basin has declined continuously during past decades. Recorded runoff at Huayuankou station on the downstream of the Yellow River decreased by 34.2% during 1981–2010 relative to previous period. Runoff reduction has resulted in huge economic losses and has been challenging management of water resources in many practices [5].
Climate largely impacts the regional hydrological regime and changes in precipitation and temperature therefore directly influence stream flow [6]. McFarlane et al. [7] used multiple Global Circulation Models’ (GCMs’) projections to simulate water yield in south-western Australia over the coming decades and found that surface water yields might decrease by 24% due to climate change. Based on the simulation results of Geomorphology Based Hydrological Model (GBHM), Ma et al. [8] found that climate impact contributed about 55% to the decrease in Miyun Reservoir inflow. Ma et al. [9] studied runoff variations of eight catchments in Shiyang River basin in the arid region of northwest China, finding that the climate variability accounted for over 64% of the reduction in mean annual stream flow. Recently, Wang et al. [10] investigated the runoff sensitivity to climate change for 21 hydro-climatically different catchments in China and found that runoff in arid or semi-arid catchments is more sensitive to changes in temperature and precipitation than that in humid south China.
Human activity, such as land cover change, urbanization, and water conservation projects have significant impacts on runoff, altering the regional hydrologic cycle by changing runoff-generation conditions [11]. The existing extent of human-generated change to land cover has increased global runoff by 7.6% and reduced global annual average terrestrial evapotranspiration by 5%, which is approximately equivalent in volume to annual global surface water withdrawals (3200 km3·year−1) [12]. However, different human activities may have different roles in runoff change. Experimental studies indicate that the runoff modulus of grassland is 61.1%–75.8% of that of bare land; forest land has a lower runoff modulus as compared to that of bare land; while the runoff modulus in urban areas is much higher [13,14]. At the same time, agricultural and industrial water consumptions have a direct impact on stream flow, with agriculture accounting for over 70% of total water use in China [15]. Recorded runoff for a large-scale catchment is highly influenced by both climate change and anthropic activities but it has been a challenge to quantify how much each contribute to changes in runoff [16].
In recent years, hydrologists have put great efforts into attribution analysis of changes in runoff [16,17,18,19,20,21,22,23,24,25,26]. Broadly, the attribution analysis methods can be mainly divided into five categories: (1) Paired catchment studies. Chappell et al. [22] investigated the runoff response in the managed rainforest catchments, and found that most of the stream behavior, in a period seven-years after selective logging, is insensitive to the skid trail densities associated with reduced impact logging or clear-fell systems in Malaysia. However, this kind of approach is often difficult to identify the reference catchment which has the same or similar underlying and climatic conditions with the studied catchment but without intensive human disturbance. Furthermore, it is costly and only suits for small-scaled catchment study; (2) Individual investigation of water used by humans. Ismaiylov and Fedorov [23] analyzed the long-term variations in the Volga annual runoff, and made the conclusion that statistically significant variations in the annual runoff of the Volga were caused by both natural–climatic and anthropogenic variations. However, the field investigation-based approach usually requires a huge financial and human investment [13,18]. Moreover, it is difficult to consider all aspects of human impacts on hydrology; (3) Climate elasticity method based on water balance and Budyko hypothesis. Using this method, Li et al. [24] separated the impacts of climate variation and human activities on runoff in the Songhua River basin, and found that their contributions to the runoff change varied temporally and spatially. Zhang et al. [25] applied this method on 11 catchments in the Loess Plateau and estimated that the land use/cover changes accounted for over 50% of the reduction in mean annual streamflow in 8 out of the 11 catchments; (4) Statistical approach. The main idea is firstly to explore the relationships between runoff and environmental factors via statistical analysis such as regression analysis and artificial neural network, and then further to analyze their contributions. Tian et al. [26] used runoff slope-break to identify the driving factors of runoff decline in Hutuo River Basin (North China), and concluded that agricultural water use was the dominant factor. The shortcoming of this kind of method is lack of physical interpretation; (5) Hydrological simulation approach. With the rapid development of computer science, hydrological models have been applied widely in assessing the impacts of environmental change (e.g., climate change, human activities, or both) [27,28,29]. Wang et al. [16] proposed identifying the individual impact of human activity and climate change on changes in runoff of the Sanchuan River by applying a well-developed hydrological model to naturalize runoff over the period of human disruption, with the difference between naturalized runoff and recorded runoff being induced by human activity. The method was called the simulation-based approach and was applied to other catchments by hydrologists [17,30,31,32]. For example, Ma et al. [31] found climate change has led to a stream flow increase of 40.8 m3/s per year for the Huai River basin, while human activity has resulted in a stream flow decrease of 33.51 m3/s per year. Under the influence of environmental changes, annual recorded runoff in the Luan River presented a significant decreasing trend for 1958–2008. Zeng et al. [33] identified drivers of changes in runoff and investigated contributions of different drivers, finding that climate-induced runoff reduction accounted for 28.3%–46.8% of total runoff reduction while human activities contributed with 53.2%–71.7%.
Attribution analysis of runoff change is highly associated with baseline selection which is often treated as a natural period of a runoff series. Statistical methods (e.g., cluster analysis, Mann-Kendall test) were usually employed to identify a natural period through diagnosing abrupt changes in a long-term runoff series [16,17,34,35]. However, the statistical methods often analyzed variation in runoff series itself but neglected the influences of climatic variations on abrupt changes in a runoff series, thus the detected natural epoch is not strictly proper for most cases [36]. It is therefore essential to demonstrate the reasonability of a baseline by a new approach based on hydrological models with physical interpretations, which is regarded as a physically-based approach. However, there are few studies employing a physically-based approach in the literature.
The Loess Plateau is located in a semi-arid climate zone where water shortages are the main water issue and streams run dry for most rivers, particularly in the dry season [18]. It is important for water resources management on the plateau to investigate quantitatively reasons for decreases in runoff. Taking the plateau's Xinshui River as a case, the objectives of this study are: (1) to detect variation trends in runoff series of the Xinshui River and identify the natural period of runoff series with a physically-based approach; (2) to investigate the principal drivers of runoff variation, and then quantitatively evaluate the contributions of each driver to changes in runoff.

2. Materials and Methods

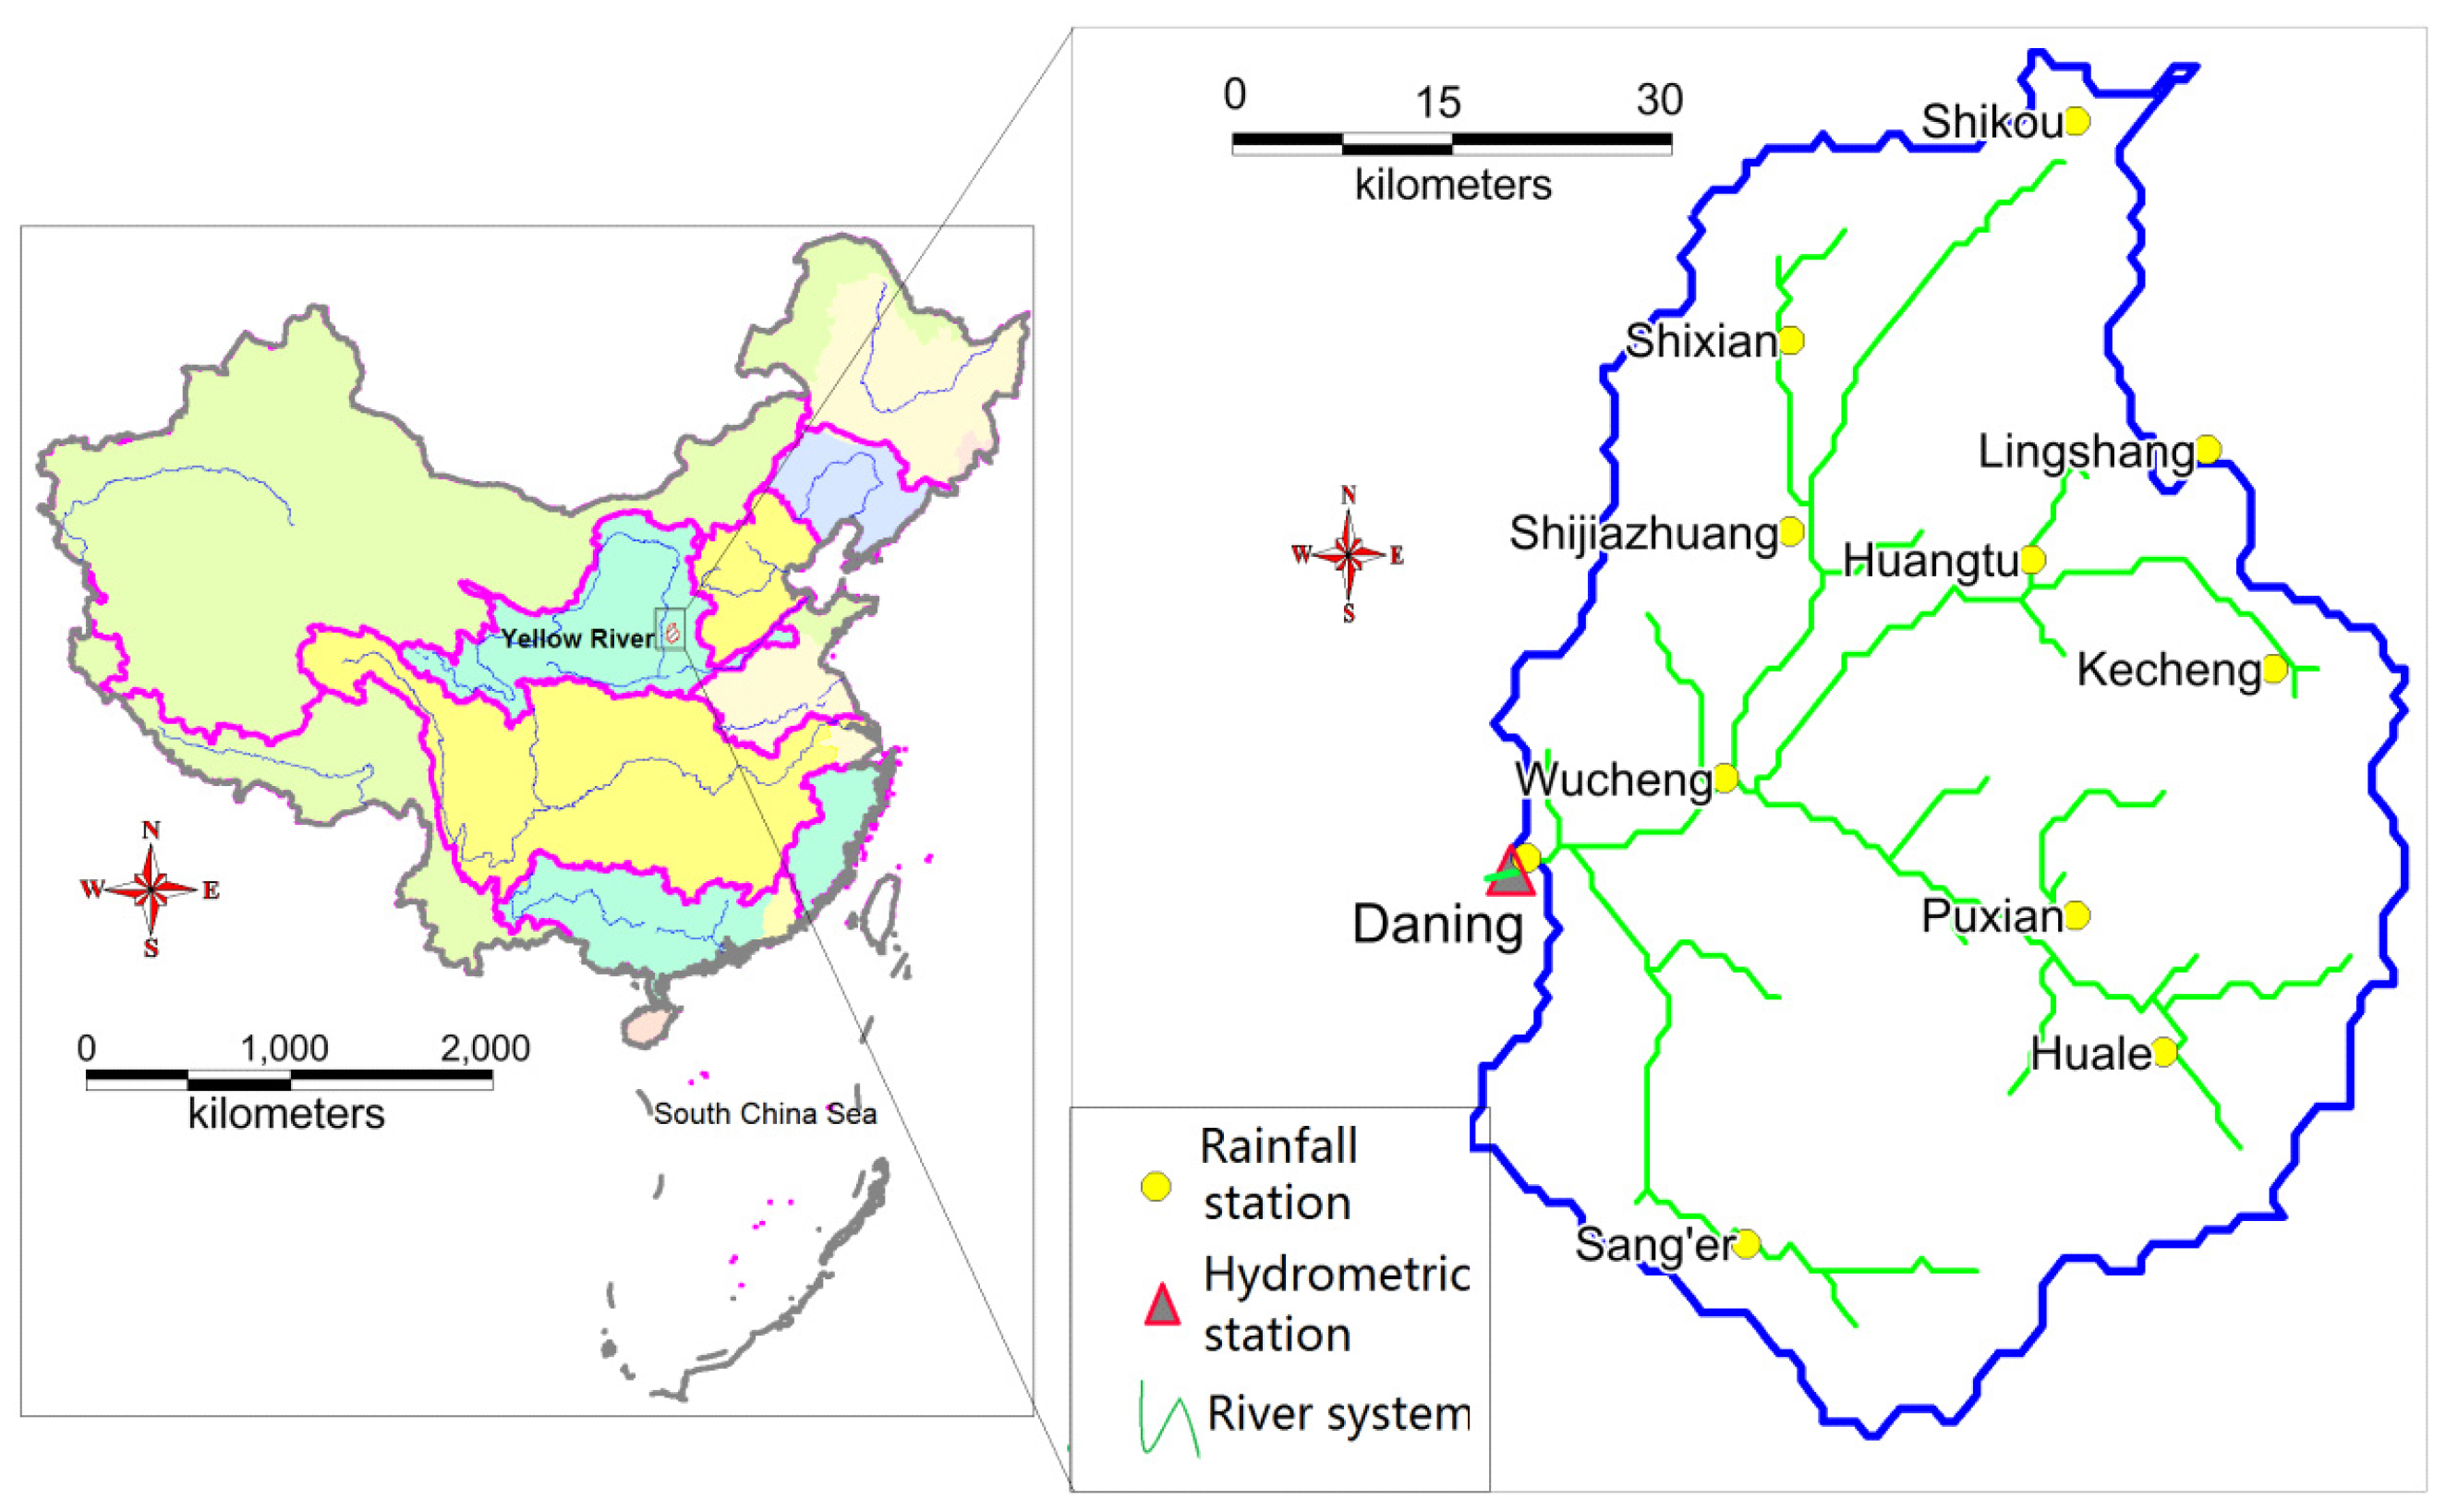
2.1. Description of the Xinshui River Catchment

The Xinshui River is a first-order tributary of the middle Yellow River and originates from two sources: Shikou township to the north and Mount Motian in the south. The tributary from the northern source flows southwestward to join the tributary from the southern source at Wucheng township, then runs westward to join the Yellow River at Xujiaduo township after passing through Daning county and Quer township. The drainage area of the catchment is 4326 km2, with a main stream length of 135 km. Daning station is the farthest downstream hydrometric station on the Xinshui River and was established in 1955. Eleven rainfall stations within the catchment with extensive records were selected. The locations of the rainfall stations and the Daning hydrometric station are shown in Figure 1.
The Xinshui River catchment is in the East Asia Monsoon climate zone and is characterized by low average annual precipitation (515.83 mm) and high average annual potential evaporation (1073.74 mm). The distribution of precipitation is highly uneven in time and space, and the dry climate means the catchment is short of water [6]. The multiple-year average annual runoff at the Daning station is 0.148 billion m3, of which over 60% is in the June-to-September flood season.
Soil and water loss is significant in the catchment due to the thick and fragile soil layer and the frequent intense rainstorms in the flood season. There have been major efforts trying to combat these losses, with the most intensive activities emerging since the late 1960s. As of 2006, residents had built two substantial dams on the main stream with total storage capacity of 7.1 million m3, 12 key small size reservoirs, and 885 check dams on tributaries with the total controlled area of over 61 km2. Soil and water conservation measures in the catchment include 329.67 km2 of terraced land, 23.32 km2 of newly formed dam-land, 1198.79 km2 of reforested land, and 60.53 km2 of grassland [18].

2.2. Physically-Based Method for Detection of a Natural Period in a Runoff Series

Given that statistically-based change detection approaches do not properly distinguish human activity from climate non-stationaries (e.g., runoff variability induced by changes in precipitation and/or temperature) Wang et al. [36] proposed a physically-based method for the detection of a natural epoch in a runoff series. The method is based on a hydrological model with a physical interpretation and analyzes simulation errors of a runoff series. The method assumes that human activities will lead to systematic simulation errors of hydrological processes, thus the accumulated standard simulation errors will continuously increase or decrease after an abrupt change point in a runoff series induced by human activities. The accumulated standard simulation errors were mathematically expressed as follows:
Sum K m = i = 1 m K i , ( m = 1 , 2 , ...... , N )
K i = { + 1 , Q S I M i > Q R E i 0 , Q S I M i = Q R E i 1 , Q S I M i < Q R E i
where QSIMi is the simulated runoff, QREi is the observed runoff, Ki is standard simulation error, the indicator of differences between the observed and simulated runoff in time step i. SumKm is accumulated standard simulation errors in time step m.
The abrupt change induced by human activities will occur at a point, after which SumKm will be continuously greater or less than zero. The time series before the point could then be treated as a natural series.

2.3. Quantitative Method for Attribution Analysis of Runoff Change

Intensive human activity will lead to an abrupt change in a runoff series. Taking runoff before the abrupt change point as the baseline, the difference between runoff after the change point and the baseline comprises two parts: human-induced runoff change and climate-induced runoff change. Hydrological models are usually calibrated with a data series in the natural period and then employed to naturalize runoff in a human-disturbed period. The difference between recorded runoff and naturalized runoff in a human-disturbed period is induced by human activities. More details of the above described method can be found in Wang et al. [16] and Wang et al. [20]. Attribution analysis of runoff change can be mathematically expressed as:
Δ W T = W H R W B
Δ W H = W H R W H N
Δ W C = W H N W B
η H = Δ W H Δ W T × 100 %
η C = Δ W C Δ W T × 100 %
where ∆WT is the total change in runoff; ∆WH and ∆WC are runoff changes caused by human activity and climate change, respectively; WB is the baseline runoff; WHR and WHN are the recorded and natural runoff in the human-disturbed period; and ηH and ηC are the relative contributions of human and climatic factors on the total runoff change, respectively.

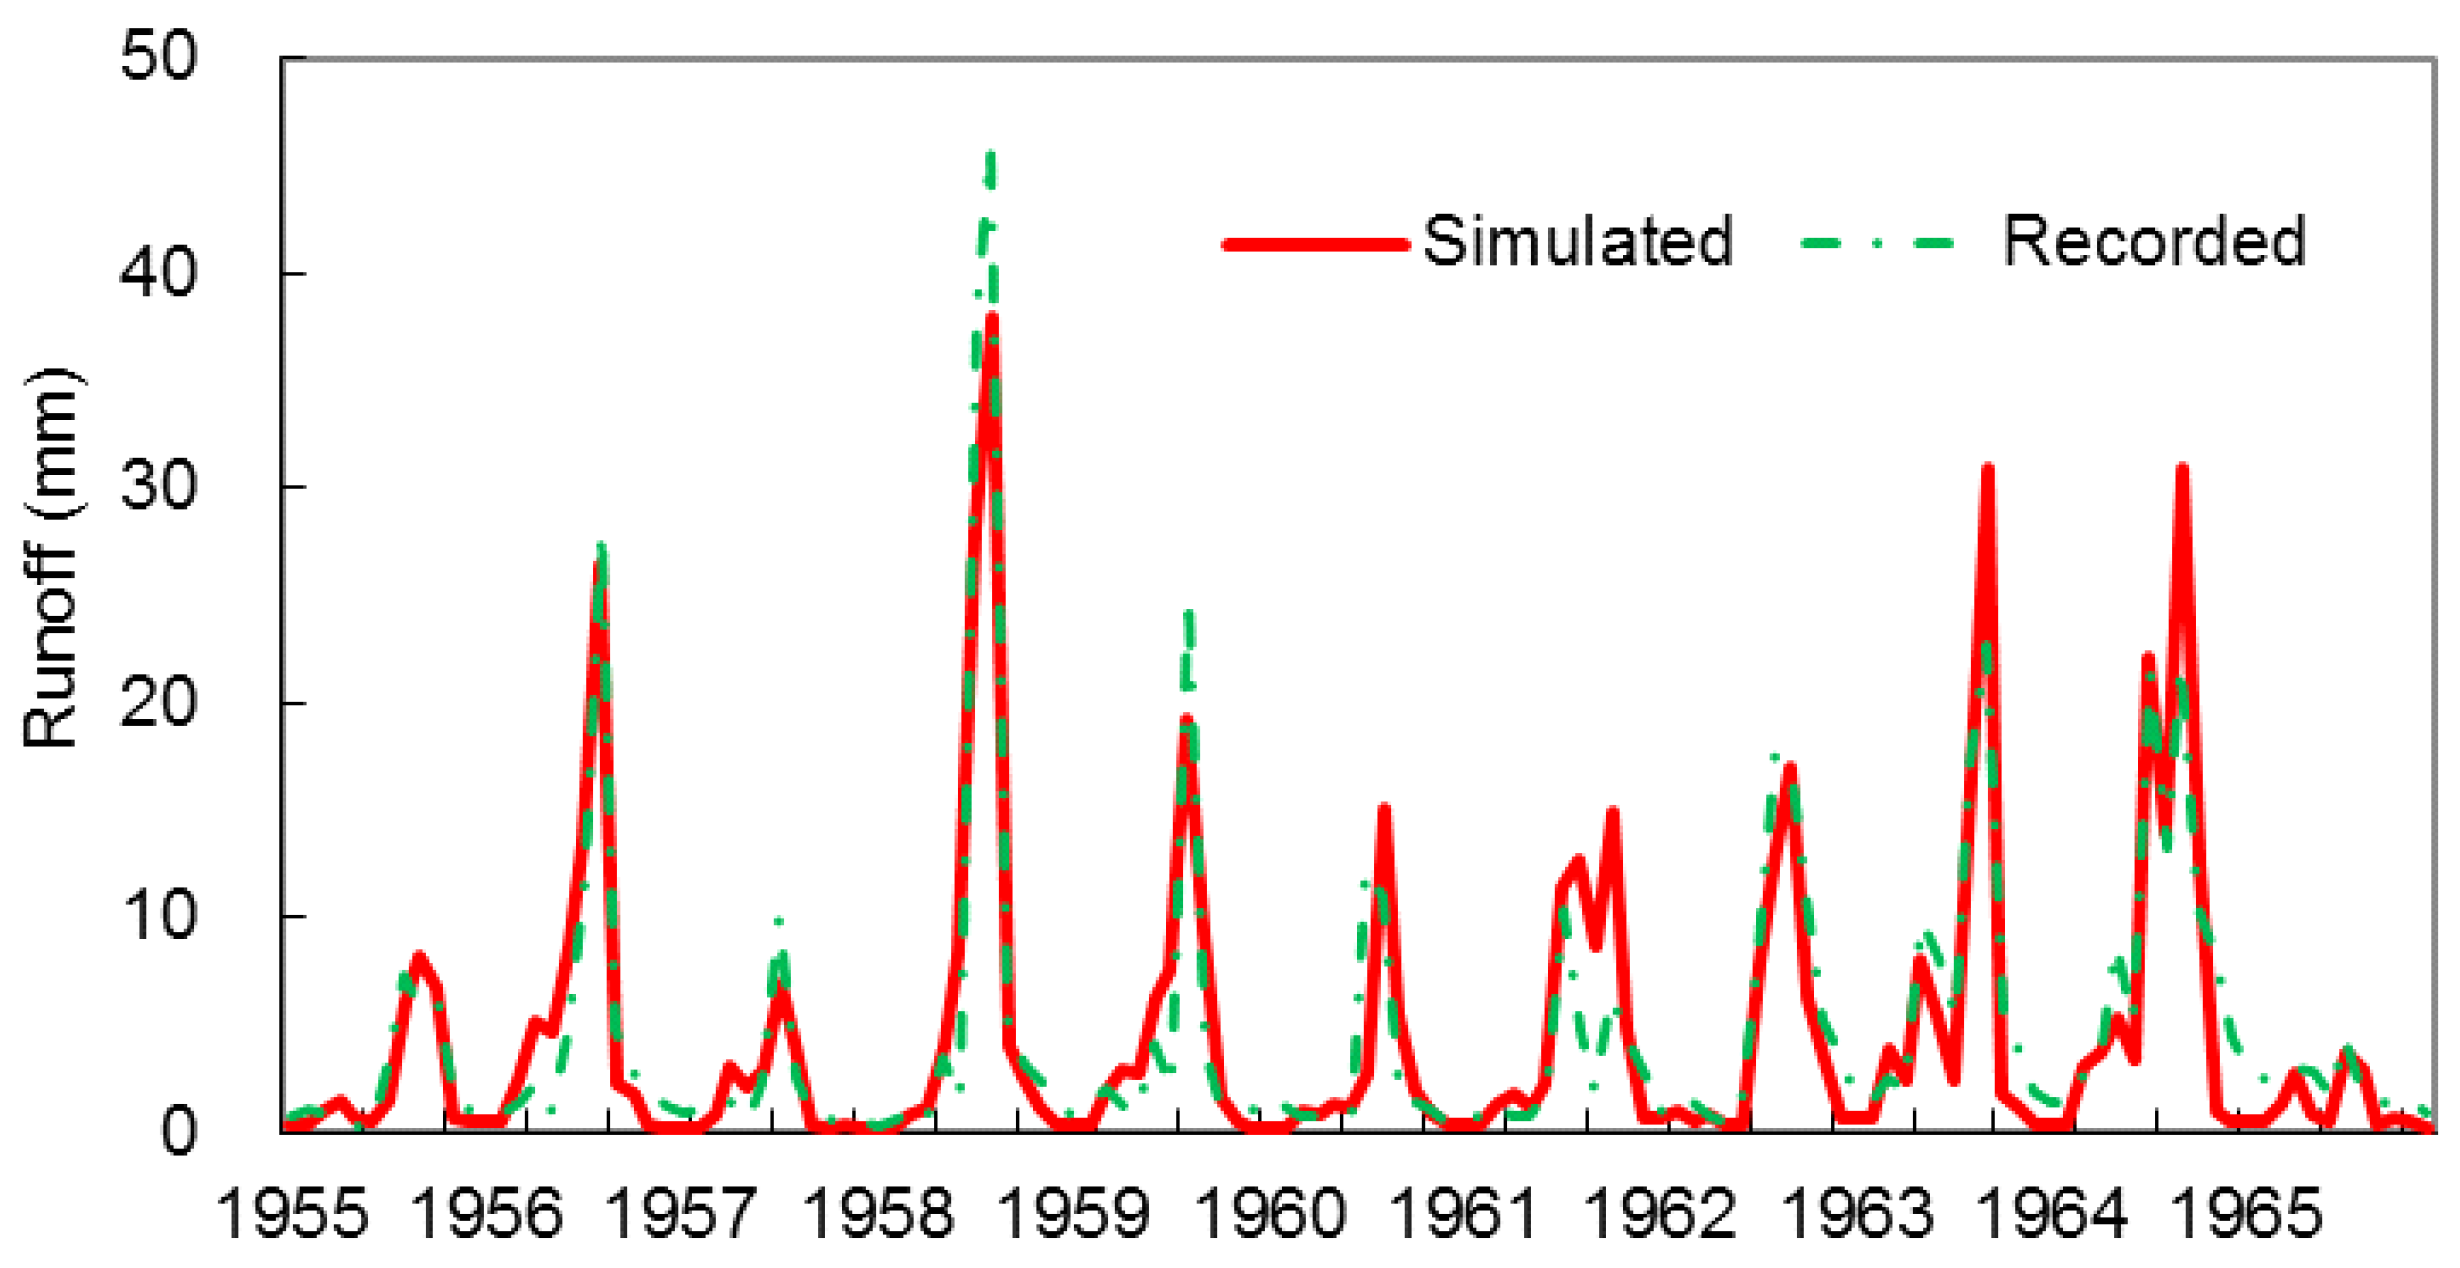
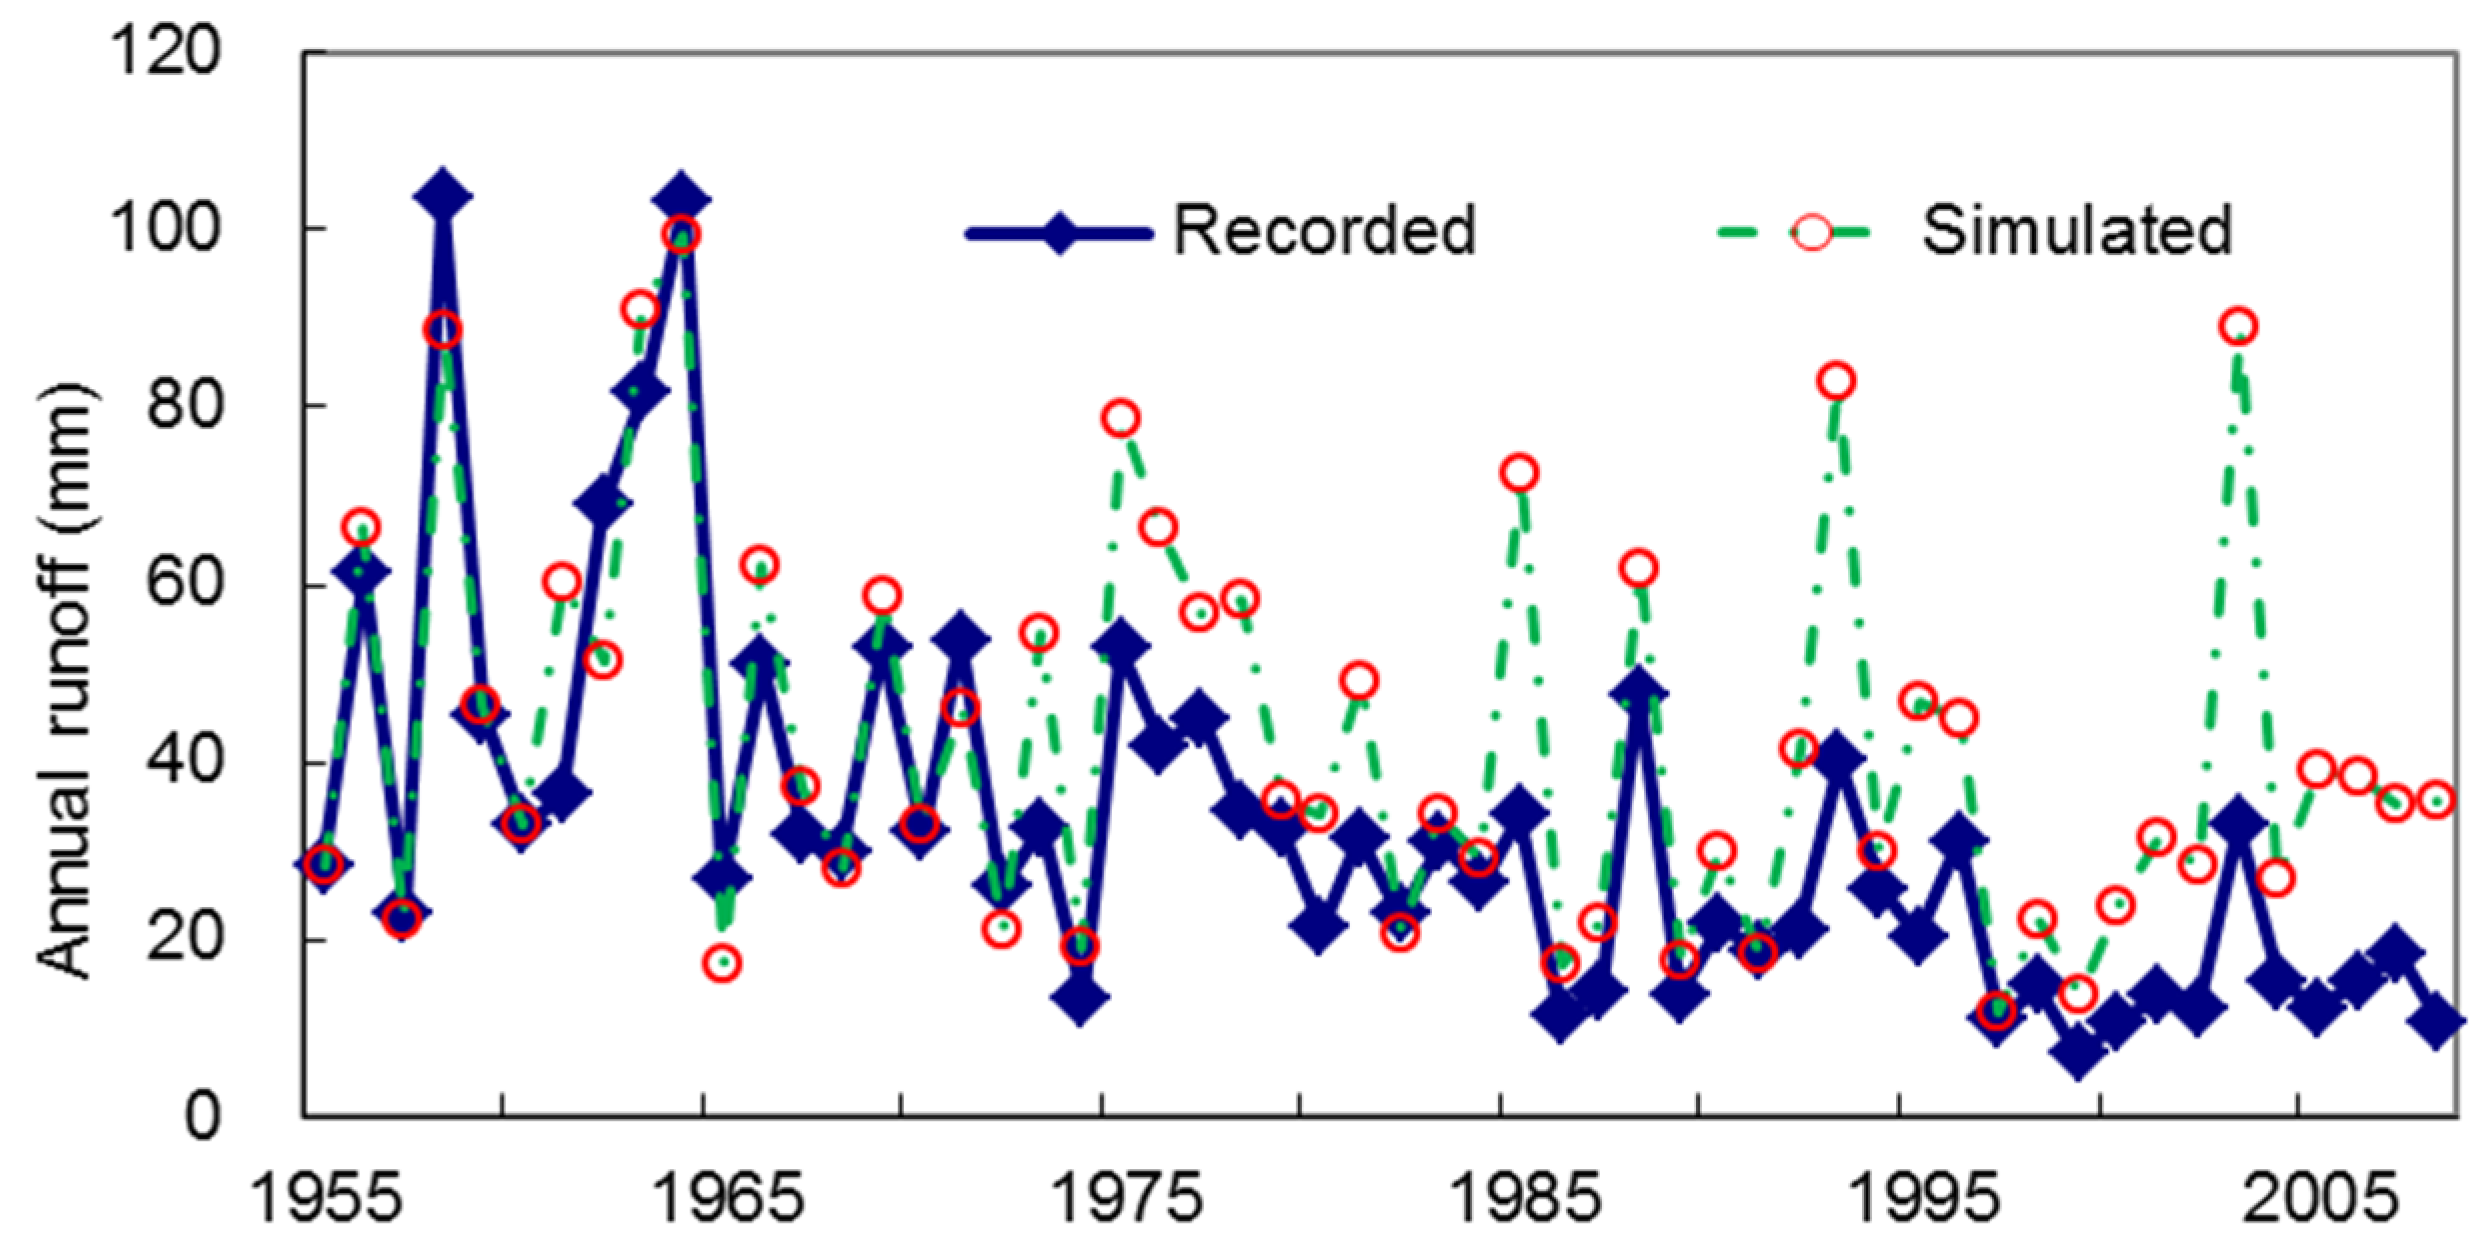
2.4. Description of a Simplified Water Balance Model

Conceptual hydrological models are useful in assessing the impacts of environmental changes on regional hydrology [16]. In this paper, we employed a monthly water balance model proposed by Wang et al. [37] to naturalize stream flow. The model is a simplified lumped hydrological model with a strong physical interpretation of the runoff yield mechanism. In comparison with other hydrological models, e.g., SIMHYD, TANK, SMAR, the model has the advantage of a simpler structure, including fewer parameters and more flexibility [11]. The model can estimate monthly stream flow from input variables such as monthly rainfall, temperature, and potential evaporation data series. The output runoff consists of two components: surface flow and groundwater flow. The simulated discharge can be expressed mathematically as:
Q s i m i = k s × S i 1 S m a x × P i + k g × S i 1
where P i is precipitation (mm) in month i; Si−1 is soil moisture in month i−1, which is a basin average of the moisture-holding capacity of the soil layer; Smax is the maximum soil moisture storage (mm) and the upper limit for Si−1; ks and kg are coefficients of surface flow and groundwater flow respectively, which are non-dimensional parameters.
Catchment evaporation is estimated with a one-layer soil evaporation formula which is expressed as:
E i = k e × S i 1 S max × E p i
where Ei is the actual evaporation of month i; ke is the coefficient of evaporation estimation; Epi is the potential evaporation measured by an evaporation pan E601 or estimated by Penman Monteith Equation.
Finally, the soil moisture content at the end of month i is calculated according to the water conservation.
S i = S i 1 + P i Q s i m i E i
There are three hydrological parameters (i.e., the maximum soil moisture storage Smax (mm), the surface flow coefficient ks and the base flow coefficient kg) in the model that need to be calibrated with recorded monthly stream flow. There are many measures available to evaluate model performance, among which the NSE and the RE are the most effective and widely applied for model calibration [6]. Therefore, the NSE and RE were employed as objective functions to calibrate the model in this study [38]. A good simulation result will have a NSE close to 1 and a RE close to 0. The two measures are expressed mathematically as follows [38]:
N S E = 1 i = 1 N ( Q o i Q a i ) 2 i = 1 N ( Q o i Q a i ¯ ) 2
R E = i = 1 N ( Q a i Q o i ) i = 1 N Q o i × 100 %
where Qoi and Qai are observed and simulated discharges at the month i; and N is the number of all samples.

3. Results

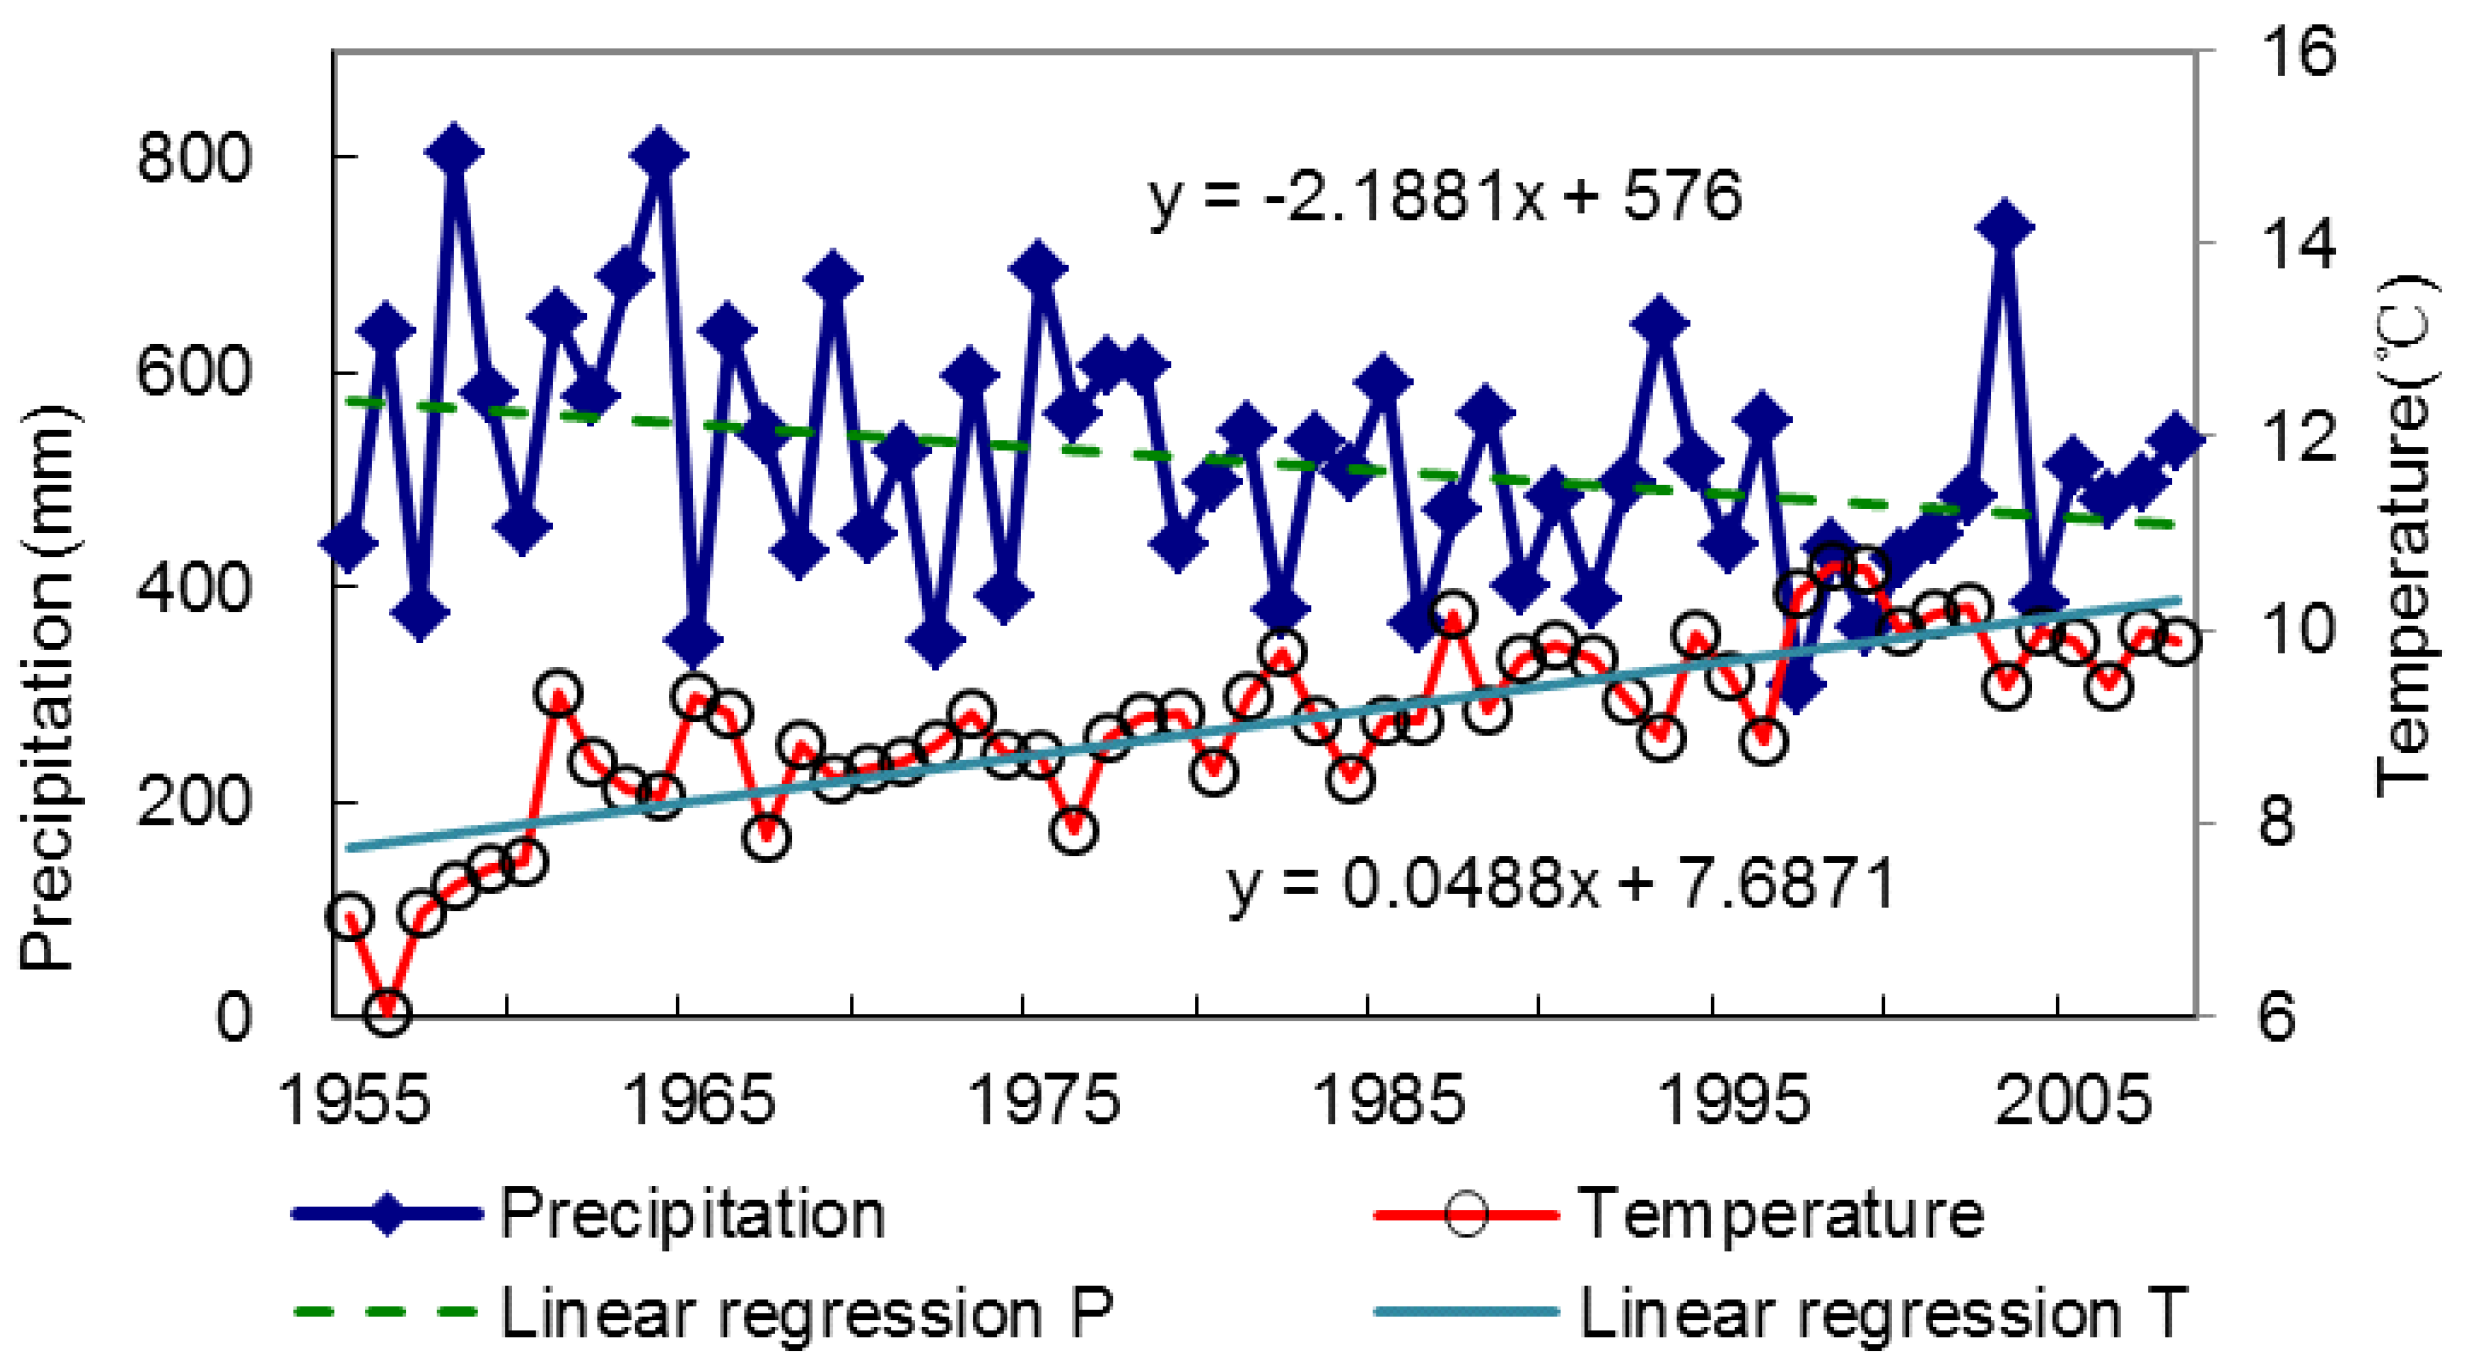
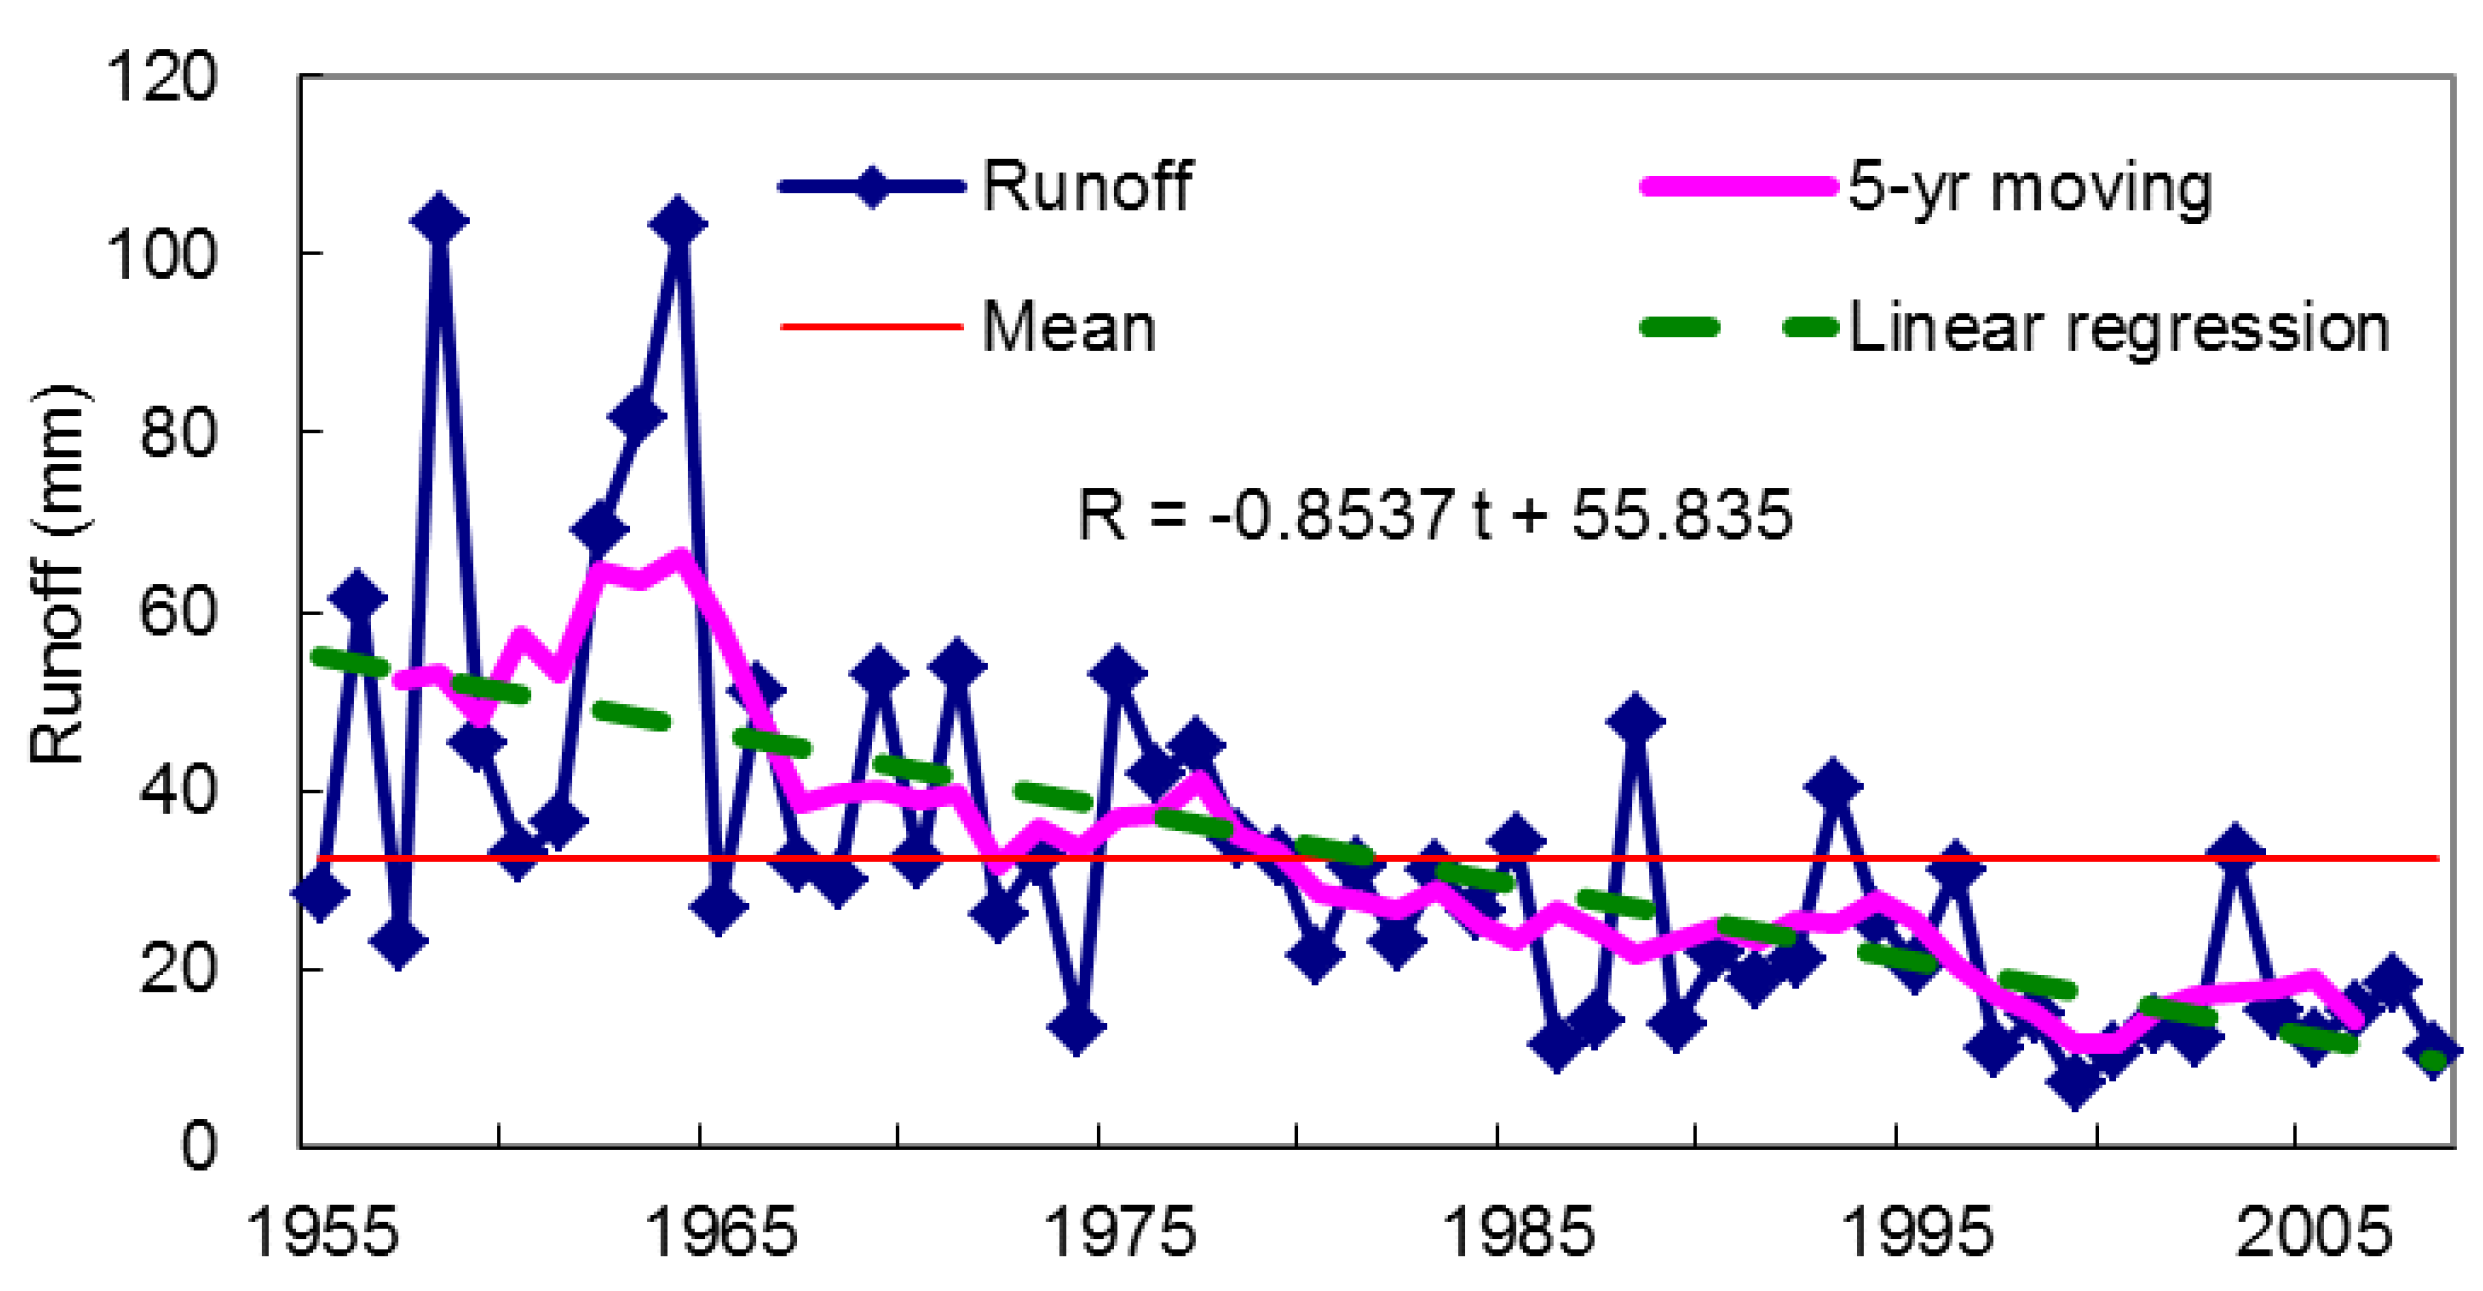
3.1. Inter-Annual Variability of Precipitation, Temperature, and Recorded Runoff During 1955–2008

The Intergovernmental Panel on Climate Change series of reports concluded that global mean air temperature showed a significant increase during the past 50 years while only slight changes occurred in global mean precipitation [39]. The Xinshui River catchment is located in the East Asia Monsoon climate zone, which is generally arid to semi-arid. The average areal annual precipitation over 1955–2008 is approximately 510 mm with a higher decadal variability. Based on the 11 rainfall stations, their averaged data were used to represent the meteorological condition of the studied catchment. Long-term variations of annual precipitation and temperature over the Xinshui River catchment from 1955 to 2008 are shown in Figure 2.
Figure 2 indicates that the annual precipitation varied from 309 mm to 803 mm with an insignificant (Spearman rank correlation with p-value of 0.051) declining trend of −2.188 mm/year over the 1955–2008 period. Annual mean temperature showed a significant rising trend of 0.0488 °C/year for the whole period with an average of 9.03 °C and a variation range of 6.04 °C–10.65 °C. A decrease in precipitation and rise in temperature no doubt will lead to a reduction in runoff.
The average annual runoff at the Daning hydrometric station over the 1955–2008 period is 32.4 mm. Long-term variations in recorded runoff and the five-year moving average process are shown in Figure 3.
Figure 3 shows that, first, recorded runoff presented high variability, ranging from 7.1 mm in 1999 to 107.1 mm in 1958. Most of the high runoff years occurred in the 1950s and 1960s. Observed runoff has been continuously and unprecedentedly low since 2000. Second, the runoff series exhibited a significant decreasing trend, with a linear decline rate of 0.854 mm/year. Third, the runoff series for 1955–2008 could be visibly divided into three phases: a higher flow period in 1955–1965, a medium flow period in 1966–1980, and low flow period in 1981–2008. An abrupt change point in the runoff series induced by human activity likely occurred in 1965, going by a rough visual calculation.

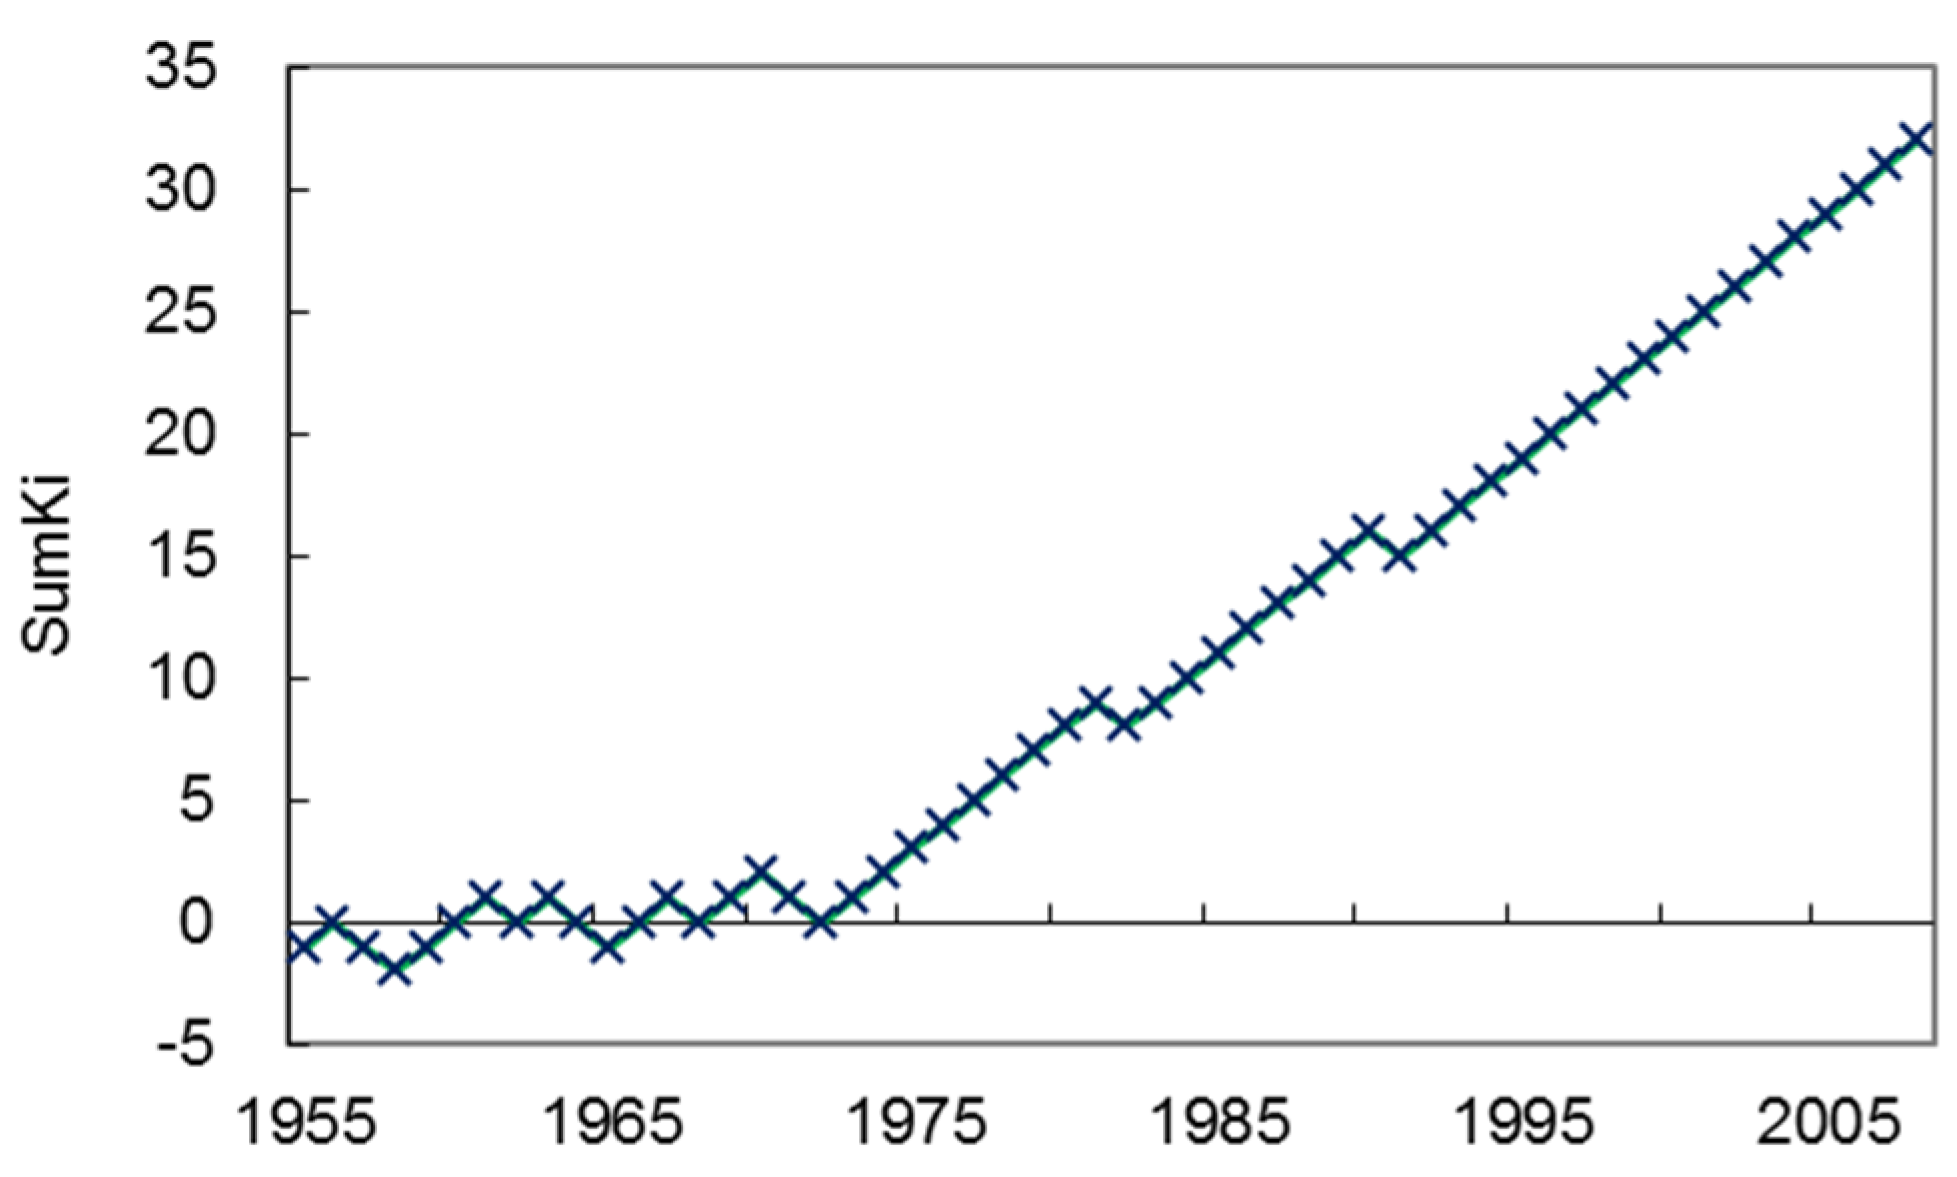
3.2. Detection of Abrupt Change Year in Runoff Series and Selection of Natural Period

According to initial determination of the natural runoff series, the data series of 1955–1965 was used to calibrate the SWBM. The calibrated model was then driven by meteorological data (i.e., monthly precipitation, pan evaporation, and temperature) for the entire period of record (1955–2008), using a constant set of calibrated parameters to generate runoff estimates. The monthly simulated and recorded discharges at the Daning station for 1955–1965 were compared in Figure 4 and time series SumKm was then constructed, representing the differences between simulated and recorded runoff (Figure 5).
Figure 4 shows that the recorded and simulated discharges matched well in general. Statistical results indicate that the SWBM performs well for monthly discharge simulation at the Daning station. The NSE is 78.6% while the RE is about −0.32%, which shows that SWBM is qualified to naturalize a runoff series with a higher simulation accuracy (Table 1).
Figure 5 shows that the time series SumKm at first varies around zero, it then departs from zero after 1973 with a consistent trend. 1973 is then detected precisely as a year of abrupt change in the runoff series at the Daxing station.
Annual recorded and simulated runoff for 1955–2008 are compared in Figure 6. The figure shows that annual recorded and simulated runoff before 1973 matched well in general. However, most of the simulated runoff for 1973–2008 is much higher than the recorded results, with the difference explained by human activities to some extent. According to the local statistical yearbook series, water engineering projects (such as reservoir and dam construction, soil and water conservation measures, etc.) have been implemented since the mid-1970s [40] for ecological and economic reasons. The timing of these projects coincides with the timing of the changes we detected. Therefore, 1955–1972 could be treated as a natural period, which was then taken as a baseline for attribution analysis of change in runoff in this study.
Annual runoff and precipitation for 1973–2008 decreased by 10.5% and 56.1% relative to 1955–1972 respectively while temperature rose by 1.3 °C. However, seasonal changes in runoff, precipitation, and temperature were uneven (Figure 7). Figure 7 shows that: (1) Precipitation in most months (eight months) during 1973–2008 decreased by 5.9% to 35.2% relative to 1955–1972, with the highest decrease (−35.2%) occurring in November. Precipitation in June, August, and October during this period remained on par with previous falls. Precipitation in December increased by 54%; (2) Temperatures for all months rose by 0.7 °C–2.0 °C, with the highest rise occurring in February and April; (3) As a result of changes in precipitation, temperature, and other drivers, runoff for all months fell as well. Seasonal changes in runoff during 1973–2008 ranged from −23.0% to −57.6%, with the highest decrease occurring in the flood season from July to September. In similar wet years by precipitation (1956 with annual precipitation of 637 mm, and 1993 with annual precipitation of 644 mm), runoff in the later period (40 mm in 1993) is much less than that in the first period (61 mm in 1956) indicating strong influence of human activities on runoff.

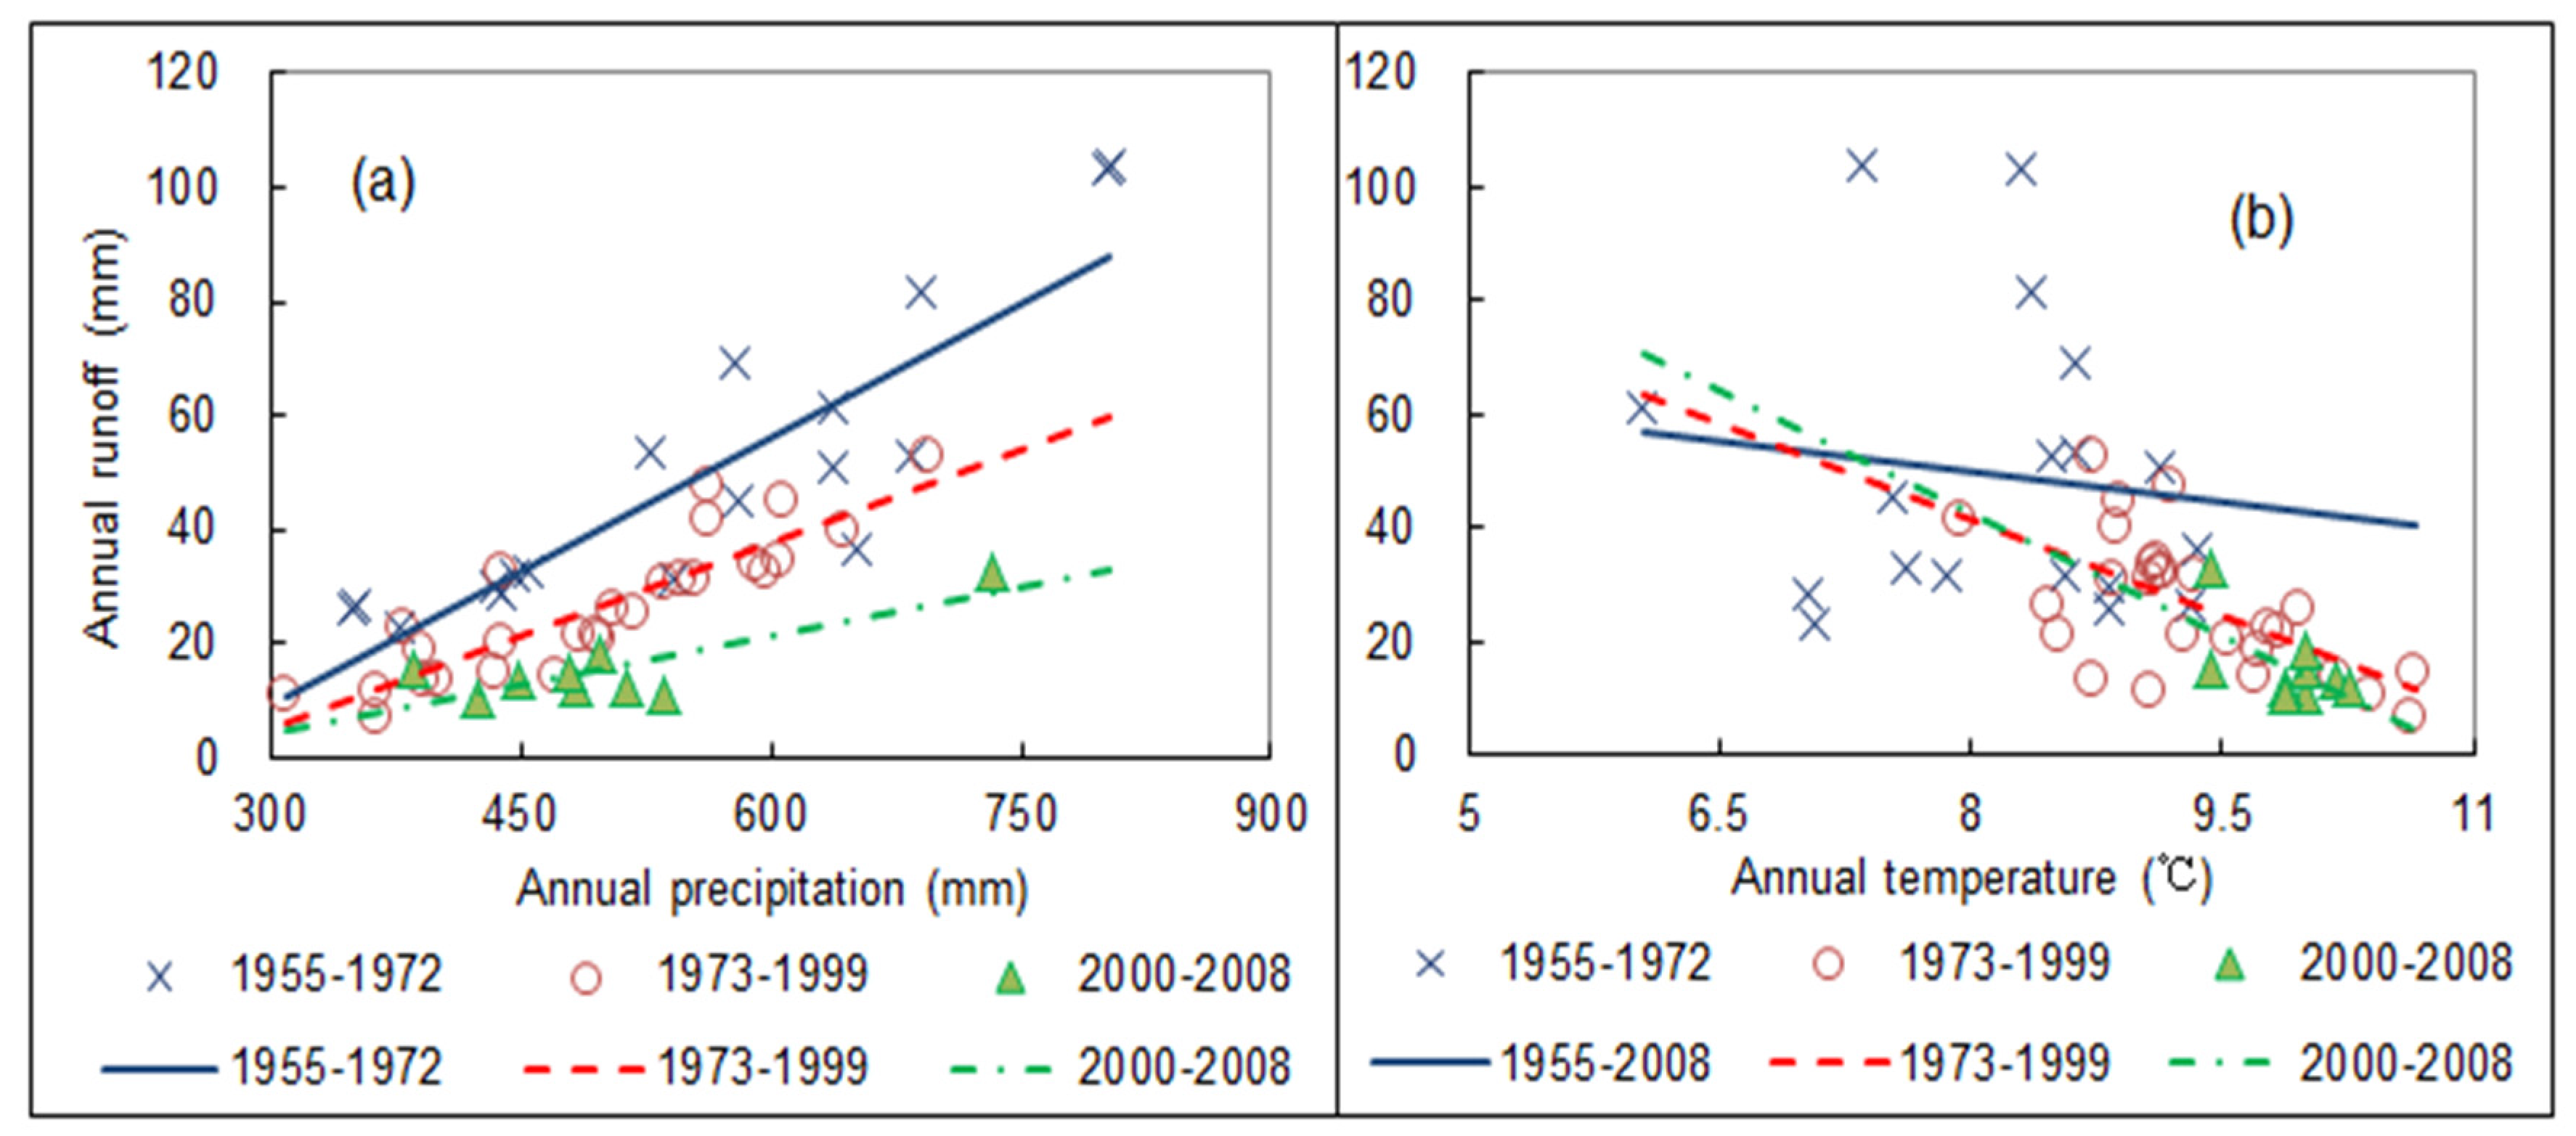
3.3. Attribution Analysis of Changes in Runoff of the Xinshui River Catchment

Rainfall is a source of stream flow for the Xinshui River catchment. Evaporation is another way in which water is removed from the hydrologic cycle in a catchment. Theoretically, a rise in temperature will result in an increase in potential evaporation, and accordingly, lead to a decrease in stream flow. Human activities such as soil and water conservation measures (e.g., terrace construction, dams, forestry and grass management practices, and crop land management), and water consumption for agriculture and industrial development, have direct influences on stream flow. To better understand the potential drivers of changes in runoff, particularly before and after 2000, the 1955–2008 time series of the Xinshui River catchment was divided into three phases: 1955–1972, 1973–1999, and 2000–2008. The annual discharges of the three phases were plotted against areal precipitation and temperature and illustrated in Figure 8.
Figure 8 indicates that annual runoff is highly correlated to precipitation, with linear correlation coefficients ranging from 0.641 to 0.769. It illustrates that precipitation governs water resources. However, the points plotted for runoff against precipitation for the different phases fall into a different domain. Specifically, for the same precipitation, runoff in the natural period of 1955–1972 is much higher than the second and third periods of 1973–1999 and 2000–2008. The changes of relationships between runoff and precipitation imply that the hydrological condition of the Xinshui River catchment has been changed by extra environmental factors such as human activities and climatic variation. Although the points of runoff against temperature are highly scattered, there was a decreasing trend in runoff with temperature rise for all three phases, indicating that discharges are poorly correlated to temperature (linear correlation coefficients ranged from 0.016 to 0.277) and implying that temperature is not a dominant driver of change in stream flow.
With the pre-1973 recorded runoff as the baseline, the effects of climate change (i.e., changes in precipitation and temperature) and human activity on runoff in the Xinshui River catchment were analyzed by comparing baseline, naturalized, and recorded runoff. The results are presented in Table 2.
Table 2 shows that: (1) The recorded runoff in the Xinshui River catchment decreased. Runoff in 1972–1999 and 2000–2008 was only 53.8% and 31.8% of the pre-disturbance baseline, respectively. Natural runoff (naturalized or simulated runoff) in the second phase (39.56 mm in 1973–1999) is equivalent to the third phase (38.63 mm in 2000–2008) while both are much less than the baseline (49.41 mm in 1955–1972); (2) On average, annual recorded runoff over 1973–2008 decreased by 25.51 mm relative to the baseline. However, the total runoff reduction increased from 22.79 mm in 1973–1999 to 33.68 mm in 2000–2008 due to environmental changes; (3) The absolute runoff reductions induced by climate change and human activity both increased. Climate-induced runoff reduction increased from 9.81 mm in 1973–1999 to 10.84 mm in the third phase while human-induced runoff reduction increased from 12.98 mm in the second phase to 22.94 mm after 2000; (4) Human activity played a principal role in runoff reduction in the catchment. The percentage of human-induced runoff reduction to total runoff reduction in the second and the third phases were 56.96% and 68.11%, respectively.
Climate change and human activity not only change the volume of water resources but also have a great impact on its seasonal distribution [11]. To investigate the temporal characteristics of the impacts of climate change and human activities on runoff variation, monthly and seasonal attributions need to be analyzed. Firstly, with the hydrological model (SWBM), the monthly naturalized runoff can be simulated. Afterwards, based on the naturalized, baseline, and recorded runoff, the attribution analysis equations can be applied to compute the monthly attributions. Finally, the impacts of climate change and human activity on seasonal distribution of runoff change in the Xinshui River catchment were given in Figure 9. Figure 9 shows that: (1) Human activity has a great impact on runoff in the second half of the year (i.e., from July to December), particularly for runoff in July and August. That might relate to high water consumption in daily life and irrigation. The human-induced runoff reductions were 3.87 mm and 6.23 mm, respectively; (2) Climate change has a negative impact on the seasonal runoff pattern in general. Greater climate-induced runoff reductions occurred between May and October, particularly in the main flood season from July to September when climate change led to a 2.12 mm decrease in runoff on average for this period. Although precipitation in December increased by over 50% relative to the previous value, climate-induced runoff change in this month was only −0.04 mm.

4. Discussion

4.1. Change Detection Method and Its Limitations

As uncertainty in hydrological simulation may influence detection result of an abrupt change year, hydrological models with physical interpretation are recommended. Moreover, a shortcoming of the change detection approach is that it requires for a long time series of data and the availability of data during the natural period (unaffected by human activity) to calibrate the model. The method is therefore not suitable for ungauged catchments or gauged catchment with short data observations.
SWBM performed well in Xinshui River Basin, thereby it has a potential to be applied to other semi-arid regions. In practices, other suitable hydrological models may be selected according to the hydrological features and runoff yielding mechanism of the study catchments.

4.2. Needs for Improvement of Attribution Analysis Methods

Various methods of attribution analysis, with their own merits and drawbacks, have been proposed, among which hydrological simulation based approach has been widely applied as it could scientifically detect natural period of a runoff series and quantitatively identify contributions of climatic drivers and human activities to changes in runoff. However, the existing methods are generally based on the hypothesis that climate change and human activities are independent factors in terms of runoff change. Actually, the impacts of climate change and human activities on runoff variation are not isolated, but related with each other. For instance, climate change like continuous drought may cause more construction of water engineering projects; human activities e.g., land use change and urbanization may result in greenhouse effects to some extent. Therefore, it is highly important to find the link between both drivers and improve attribution analysis methods which could treat the impacts of cliamtic and anthropogenic impacts on hydrologic processes simultaneously.

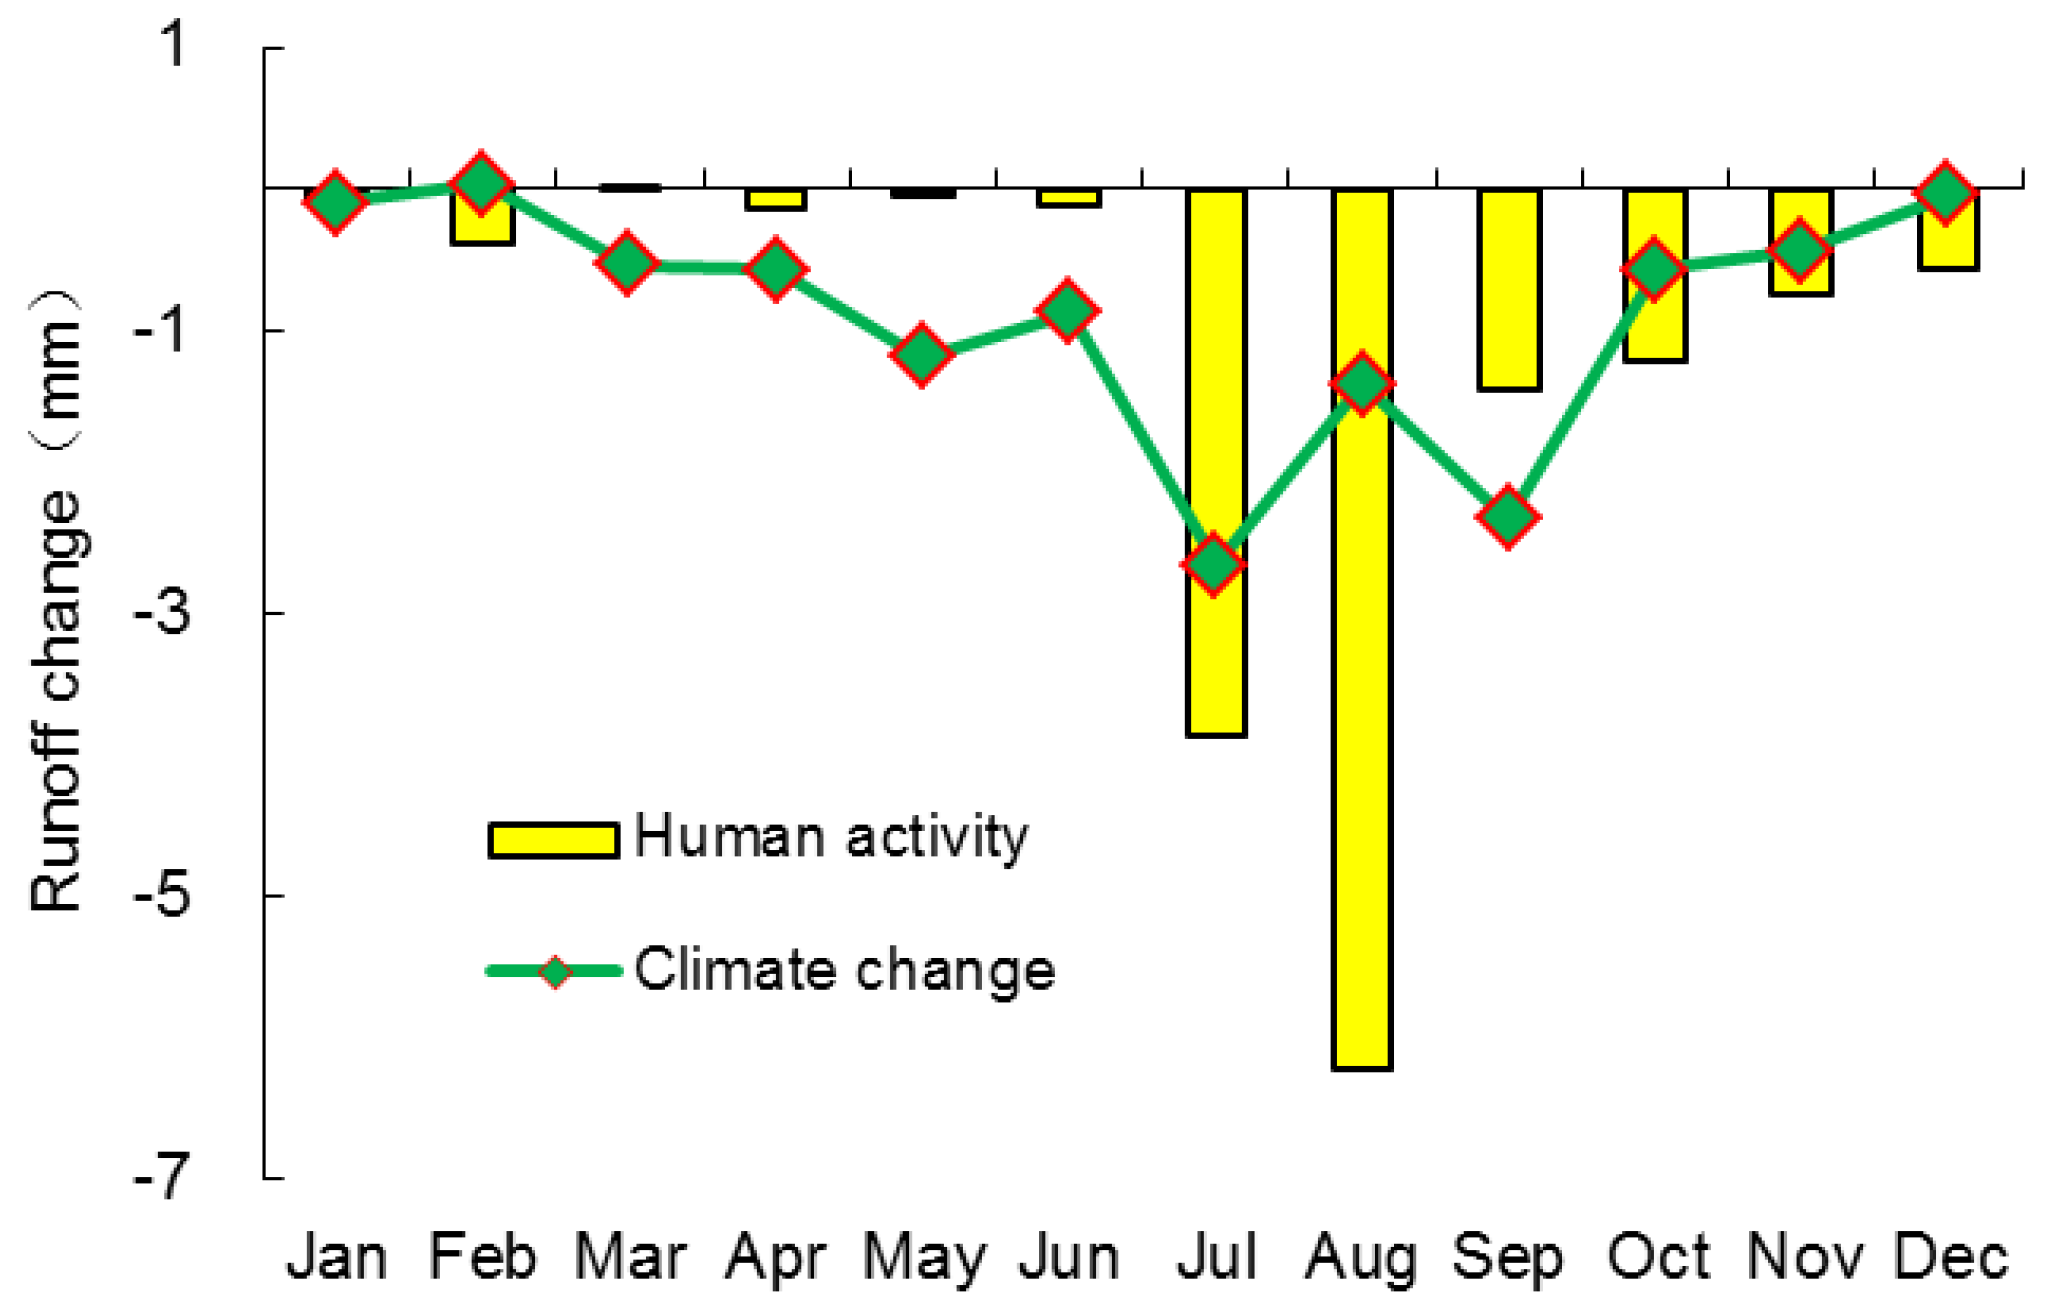
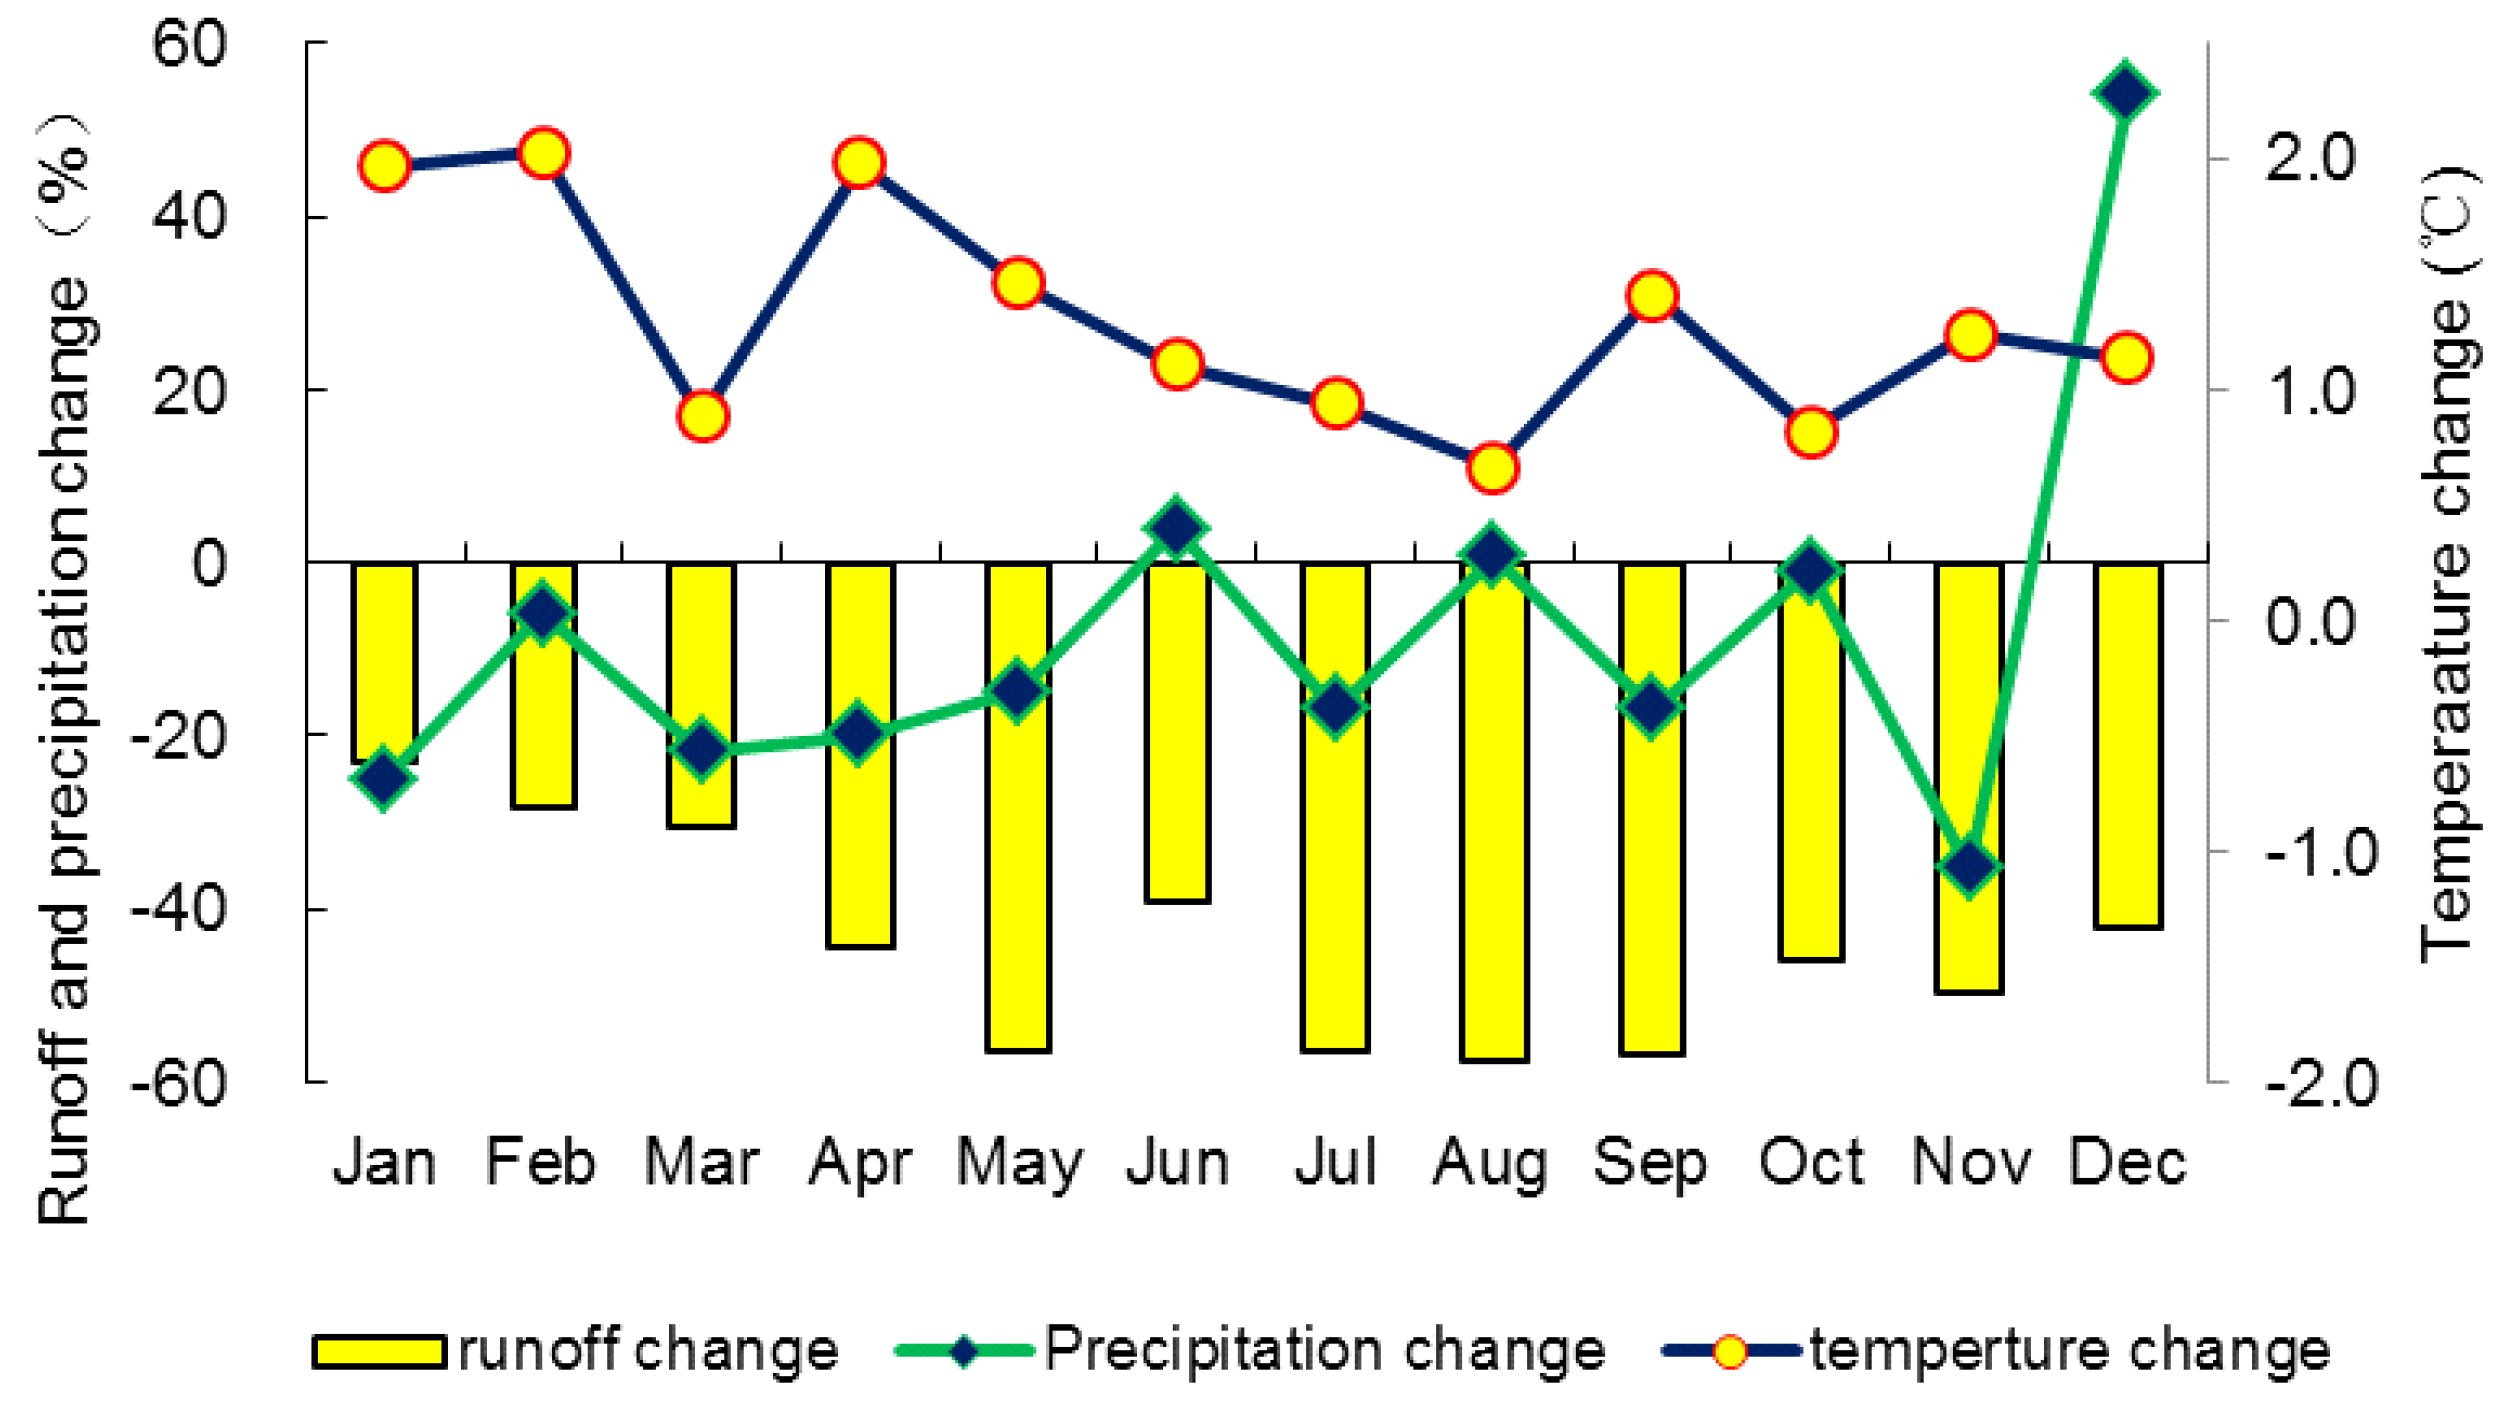
4.3. Impacts of Climate Change and Human Activities on Runoff and its Seasonal Distribution

The Loess Plateau suffers from water shortages due to its dry climate characterized by low precipitation and high evaporation. Indicated by Figure 9, climate change results in negative impacts on the seasonal runoff pattern in general. An increase in evaporation induced by temperature rise might offset the influence of a precipitation increase on runoff. Temperature rise might play a principal role in runoff change during winter. Further climate change might exert even more severe impacts on ecology in Xinshui River catchment.
Due to severe losses of soil and water, the ecology of the plateau is particularly fragile. Over the decades, local residents put soil and water conservation measures in place to fend off natural disasters. The management and assessment of these engineering and biological measures (such as terrace filed construction, dam and reservoir creation, forestry and grassland management practices as well as vegetation valleys) should be conducted by treating a small catchment as a basic unit.
As a result of climate change and human activity, recorded runoff in most of the plateau’s rivers tended to decline over those years. Therefore, it is important to identify attribution of runoff change so that soil and water conservation measures can be evaluated scientifically.
Human activities can perform in different forms, such as water engineering projects, land use change, irrigation in agriculture, industrial development, and urbanization. Different types of human activities may generate different influences (i.e., direct or indirect influence) on regional water resources and river ecology. Meanwhile, climatic change (temperature, precipitation, evaporation, etc.) also have different impacts on river ecology. Therefore, their individual and integrated impacts should be explored in further studies.

5. Conclusions

Human activities together with climate change led to a great change in runoff. The recorded runoff at the Daning station on the Xinshui River presented significant decreasing trend with a linear decline rate of –0.0854 mm/year. A human-induced abrupt change in runoff series was detected in 1973 with a physically-based detection method. The SWBM performed well in simulating natural monthly runoff over 1955–1972, with a NSE of 78.6% and a RE of 0.32%.
Precipitation variations dominate changes in runoff. However, human activity played a principal role in runoff reduction. Recorded runoff for 1973–1999 and 2000–2008 decreased by 46.2% and 68.2% relative to the baseline (1955–1972). Human-induced runoff reductions accounted for 60.6% of total runoff reduction over 1973–2008. Absolute runoff reductions induced by climate change and human activities both increased over the whole period. It is therefore essential to consider the impacts of climate change and human activities on water resources management as well as ecological restoration on the Loess Plateau.

Acknowledgments

This study has been financially supported by the National Natural Science Foundation of China (Grants 41371063, 41330854, 41401023), China’s National Basic Research Program on Global Change (Grant 2010CB951103), and State Key Laboratory of Hydrology-Water Resources and Hydraulic Engineering (2015490811). We do appreciate Xiaojia He, Zhenxin Bao, Yanli Liu, Cuishan Liu, Ruimin He, Junliang Jin, and Tao Ma for their comments and contribution to the manuscript. Thanks also to the anonymous reviewers and editors for their valuable comments.

Author Contributions

Jianyun Zhang conceived and designed the study; Guoqing Wang performed data analysis and wrote the paper, and Qinli Yang read and edited the manuscript.

Conflicts of Interest

The authors declare no conflict of interest.

References

  1. Gleick, P.H. Water and conflict: Fresh water resources and international security. Int. Secur. 1993, 18, 79–112. [Google Scholar] [CrossRef]
  2. Whitehead, P.G.; Wilby, R.L.; Battarbee, R.W.; Kernan, M.; Wade, A.J. A review of the potential impacts of climate change on surface water quality. Hydrol. Sci. J. 2009, 54, 101–123. [Google Scholar] [CrossRef]
  3. Walling, D.E.; Fang, D. Recent trends in the suspended sediment loads of the world’s rivers. Glob. Planet. Chang. 2003, 39, 111–125. [Google Scholar] [CrossRef]
  4. Wang, G.Q.; Yan, X.L.; Zhang, J.Y.; Liu, C.S.; Jin, J.L.; Bao, Z.X. Detecting evolution trends in the recorded runoffs from the major rivers in China during 1950–2010. J. Water Clim. Chang. 2013, 4, 252–264. [Google Scholar] [CrossRef]
  5. Zhang, J.Y.; Wang, G.Q.; He, R.M.; Liu, C.S. Variation trends of runoff in the Middle Yellow River basin and its response to climate change. Adv. Water Sci. 2009, 20, 153–158. (In Chinese) [Google Scholar]
  6. Zhang, J.Y.; Wang, G.Q. Impacts of Climate Change on Hydrology and Water Resources; Science Press: Beijing, China, 2007. (In Chinese) [Google Scholar]
  7. McFarlane, D.; Stone, R.; Martens, S.; Thomas, J.; Silberstein, R.; Ali, R.; Hodgson, G. Climate change impacts on water yields and demands in south-western Australia. J. Hydrol. 2012, 475, 488–498. [Google Scholar] [CrossRef]
  8. Ma, H.; Yang, D.; Tan, S.K.; Gao, B.; Hu, Q. Impact of climate variability and human activity on streamflow decrease in the Miyun Reservoir catchment. J. Hydrol. 2010, 389, 317–324. [Google Scholar] [CrossRef]
  9. Ma, Z.; Kang, S.; Zhang, L.; Tong, L.; Su, X. Analysis of impacts of climate variability and human activity on streamflow for a river basin in arid region of northwest China. J. Hydrol. 2008, 352, 239–249. [Google Scholar] [CrossRef]
  10. Wang, G.; Zhang, J.; He, R.; Liu, C.; Ma, T.; Bao, Z.; Liu, Y. Runoff sensitivity to climate change for hydro-climatically different catchments in China. Stoch. Environ. Res. Risk Assess. 2016. [Google Scholar] [CrossRef]
  11. Zhang, J.Y.; Wang, G.Q. Variation of Stream Flow and Quantitative Identification for Attribution; Science Press: Beijing, China, 2014. (In Chinese) [Google Scholar]
  12. Shannon, M.S.; Agnès, D.; Jan, P. The impact of global land-cover change on the terrestrial water cycle. Nat. Clim. Chang. 2013, 3, 385–390. [Google Scholar]
  13. Chen, J.N.; Wang, Y.Z.; Xu, J.H. Assessment Methods of Soil and Water Conservation Measures Impacting on Water Resources and Sediment for the Middle Reaches of the Yellow River Basin; Yellow River Press: Zhengzhou, China, 2004. (In Chinese) [Google Scholar]
  14. Song, X.M.; Zhang, J.Y. Rapid urbanization and changes in spatio-temporal characteristics of precipitation in Beijing metropolitan area. J. Geophys. Res. Atmos. 2014, 119, 11250–11271. [Google Scholar] [CrossRef]
  15. Zhang, H.L. Strategy Study for Water Management in China; Southeast University Press: Nanjing, China, 2005. [Google Scholar]
  16. Wang, G.Q.; Zhang, J.Y.; He, R.M.; Jiang, N.Q.; Jing, X.A. Runoff reduction due to environmental changes in the Sanchuanhe River basin. Int. J. Sediment Res. 2008, 23, 174–180. [Google Scholar] [CrossRef]
  17. Bao, Z.X.; Zhang, J.Y.; Wang, G.Q.; Fu, G.B.; He, R.M.; Yan, X.L.; Jin, J.L.; Liu, Y.L.; Zhang, A.J. Attribution for decreasing streamflow of the Haihe River basin, northern China: Climate variability or human activities? J. Hydrol. 2012, 460, 117–129. [Google Scholar] [CrossRef]
  18. Xu, J.H.; Li, X.Y.; Chen, J.J.; Gao, Y.J.; Li, M. Impact of Water Conservancy Projects on Storm Flood and Sediment Yield in the Middle Reaches of the Yellow River; Yellow River Press: Zhengzhou, China, 2009. [Google Scholar]
  19. Wang, D.B.; Mohanmad, H. Quantifying the relative contribution of the climate and direct human impacts on mean annual streamflow in the contiguous United States. Water Resour. Res. 2011, 47. [Google Scholar] [CrossRef]
  20. Wang, G.S.; Xia, J.; Chen, J. Quantification of effects of climate variations and human activities on runoff by a monthly water balance model: A case study of the Chaobai River basin in Northern China. Water Resour. Res. 2009, 45. [Google Scholar] [CrossRef]
  21. Zhan, C.S.; Jiang, S.S.; Sun, F.B.; Jia, Y.W.; Niu, C.W.; Yue, W.F. Quantitative contribution of climate change and human activities to runoff changes in the Wei River basin, China. Hydrol. Earth Syst. Sci. 2014, 18, 3069–3077. [Google Scholar] [CrossRef]
  22. Chappell, N.A.; Tych, W.; Chotai, A.; Bidin, K.; Sinun, W.; Chiew, T.H. BARUMODEL: Combined data based mechanistic models of runoff response in a managed rainforest catchment. For. Ecol. Manag. 2006, 224, 58–80. [Google Scholar] [CrossRef]
  23. Ismaiylov, G.K.; Fedorov, V.M. Analysis of long-term variations in the Volga annual runoff. Water Resour. 2001, 28, 469–477. [Google Scholar] [CrossRef]
  24. Li, F.; Zhang, G.; Xu, Y.J. Separating the impacts of climate variation and human activities on runoff in the Songhua River Basin, Northeast China. Water 2014, 6, 3320–3338. [Google Scholar] [CrossRef]
  25. Zhang, X.; Zhang, L.; Zhao, J.; Rustomji, P.; Hairsine, P. Responses of streamflow to changes in climate and land use/cover in the Loess Plateau, China. Water Resour. Res. 2008, 44. [Google Scholar] [CrossRef]
  26. Tian, F.; Yang, Y.H.; Han, S.M. Using runoff slope-break to determine dominate factors of runoff decline in Hutuo River Basin, North China. Water Sci. Technol. 2009, 60, 2135. [Google Scholar] [CrossRef] [PubMed]
  27. Hans, T. The influence of climate change on stream flow in Danish rivers. J. Hydrol. 2007, 333, 226–238. [Google Scholar]
  28. Xie, Z.H.; Yuan, F.; Duan, Q.Y.; Zheng, J.; Liang, M.L.; Chen, F. Regional Parameter Estimation of the VIC Land Surface Model: Methodology and Application to River Basins in China. J. Hydrometeorol. 2007, 8, 447–468. [Google Scholar] [CrossRef]
  29. Zhang, J.Y.; Wang, G.Q.; Pagano, T.C.; Jin, J.L.; Liu, C.S.; He, R.M.; Liu, Y.L. Using hydrologic simulation to explore the impacts of climate change on runoff in the Huaihe River basin of China. J. Hydrol. Eng. 2013, 18, 1393–1399. [Google Scholar] [CrossRef]
  30. Zhan, C.; Niu, C.; Song, X.; Xu, C. The impacts of climate variability and human activities on streamflow in Bai River basin, northern China. Hydrol. Res. 2013, 44, 875–885. [Google Scholar] [CrossRef]
  31. Ma, F.; Ye, A.Z.; Gong, W.; Mao, Y.N.; Miao, C.Y.; Di, Z.H. An estimate of human and natural contributions to flood changes of the Huai River. Global Planet. Chang. 2014, 119, 39–50. [Google Scholar] [CrossRef]
  32. Guo, Y.; Li, Z.; Amo-Boateng, M.; Deng, P.; Huang, P. Quantitative assessment of the impact of climate variability and human activities on runoff changes for the upper reaches of Weihe River. Stoch. Environ. Res. Risk A 2014, 28, 333–346. [Google Scholar] [CrossRef]
  33. Zeng, S.D.; Zhan, C.S.; Sun, F.B.; Du, H.; Wang, F.Y. Effects of climate change and human activities on surface runoff in the Luan River Basin. Adv. Meteorol. 2015. [Google Scholar] [CrossRef]
  34. Wang, G.Q.; Zhang, J.Y.; Jin, J.L.; Thomas, C.; Roger, C.; Bao, Z.X.; Liu, C.S.; Liu, Y.L.; Yan, X.L. Assessing water resources in China using PRECIS and VIC model. Hydrol. Earth Syst. Sci. 2012, 16, 231–240. [Google Scholar] [CrossRef]
  35. Zeng, S.D.; Xia, J.; Du, H. Separating the effects of climate change and human activities on runoff over different time scales in the Zhang River basin. Stoch. Environ. Res. Risk Assess. 2014, 28, 401–413. [Google Scholar] [CrossRef]
  36. Wang, G.Q.; Zhang, J.Y.; Pagano, T.C.; Liu, Y.L.; Liu, C.S.; Bao, Z.X.; Jin, J.L.; He, R.M. Using hydrologic simulation to detect human-disturbed epoch in runoff series. Water Sci. Technol. 2015, 71, 691–700. [Google Scholar] [CrossRef] [PubMed]
  37. Wang, G.Q.; Zhang, J.Y.; Jin, J.L.; Liu, Y.L.; He, R.M.; Bao, Z.X.; Liu, C.S.; Li, Y. Regional calibration of a water balance model for estimating stream flow in ungauged areas of the Yellow River Basin. Quat. Int. 2014, 336, 65–72. [Google Scholar] [CrossRef]
  38. Nash, J.E.; Sutcliffe, J. River flow forecasting through conceptual models: Part 1—A discussion of principles. J. Hydrol. 1970, 10, 282–290. [Google Scholar] [CrossRef]
  39. Intergovernmental Panel on Climate Change. Climate Change 2013: The Physical Science Basis; Cambridge University Press: Cambridge, UK, 2013. [Google Scholar]
  40. National Bureau of Statistics of China (NBSC). China Statistical Yearbook; China Statistics Press: Beijing, China, 2013. (In Chinese) [Google Scholar]
Figure 1. River system and locations of rainfall stations and the Daning hydrometric station in the Xinshui River catchment.
Water 08 00267 g001
Figure 2. Variations in annual precipitation and temperature of the Xinshui River catchment for 1955–2008.
Water 08 00267 g002
Figure 3. Variations in annual runoff and its five-year moving average process at the Daning station for 1955–2008.
Water 08 00267 g003
Figure 4. Monthly recorded and simulated runoff at the Daning station for 1955–1965.
Water 08 00267 g004
Figure 5. Time series of SumKi at the Daning hydrometric station for 1955–2008.
Water 08 00267 g005
Figure 6. Annual recorded and simulated runoff at the Daning station for 1955–2008.
Water 08 00267 g006
Figure 7. Seasonal changes in runoff (%), precipitation (%), and temperature (°C) for 1973–2008 relative to 1955–1972.
Water 08 00267 g007
Figure 8. (a) Relationships of annual runoff against annual precipitation; (b) temperature.
Water 08 00267 g008
Figure 9. Impacts of climate change and human activity on seasonal distribution of runoff change.
Water 08 00267 g009
Table 1. Model parameters and model performance for discharge simulation of the Xinshui River catchment.
Model ParametersModel Performance
Smax (mm)kskgNSE (%)RE (%)
1800.120.00578.6−0.32
Table 2. Impacts of climate change and human activities on runoff of the Xinshui River catchment.
PeriodRecorded Runoff (WHR, mm)Simulated Runoff (WHN, mm)Total Runoff Reduction (∆WT, mm)Human-Induced Change (∆WH)Climate-Induced Change (∆WC)
mm%mm%
1955–197249.3749.41
1973–199926.5839.5622.7912.9856.969.8143.04
2000–200815.6838.6333.6822.9468.1110.7431.89
1973–200823.8639.3325.5115.4760.6410.0439.36

