
Precipitation Intensity Effects on Groundwater Recharge in the Southwestern United States


Abstract
:1. Introduction
2. Data
2.1. TRMM
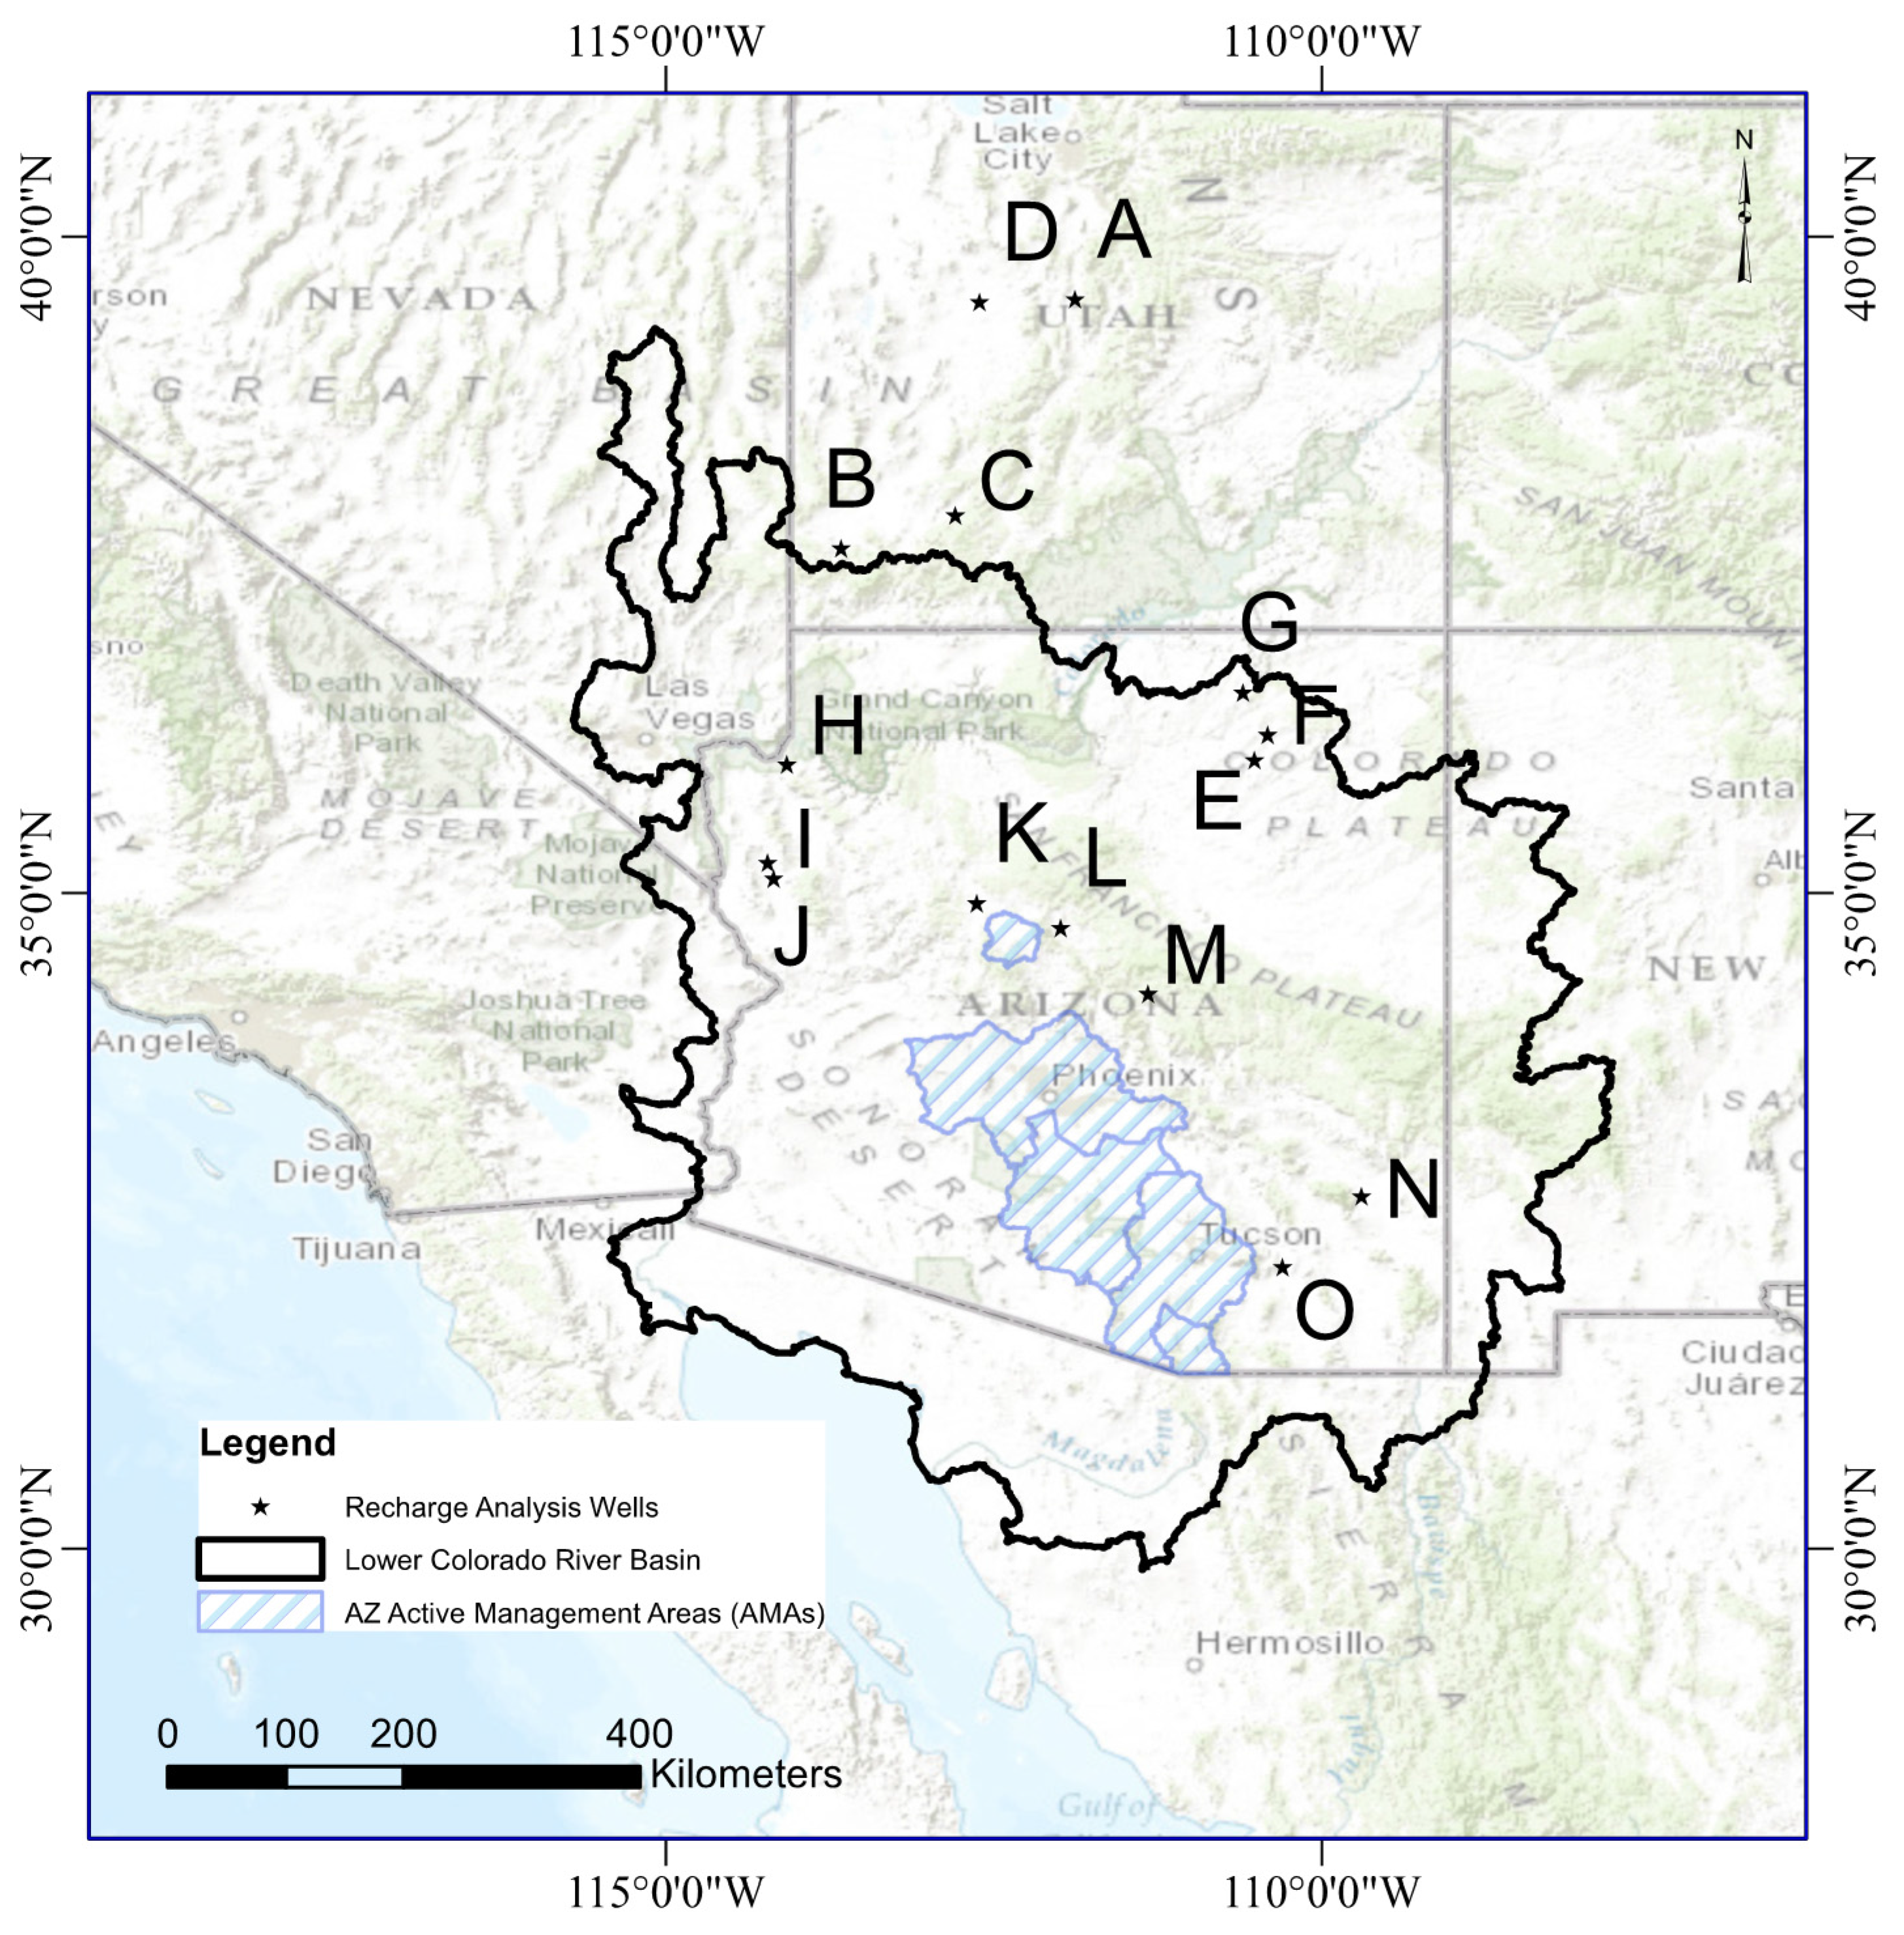
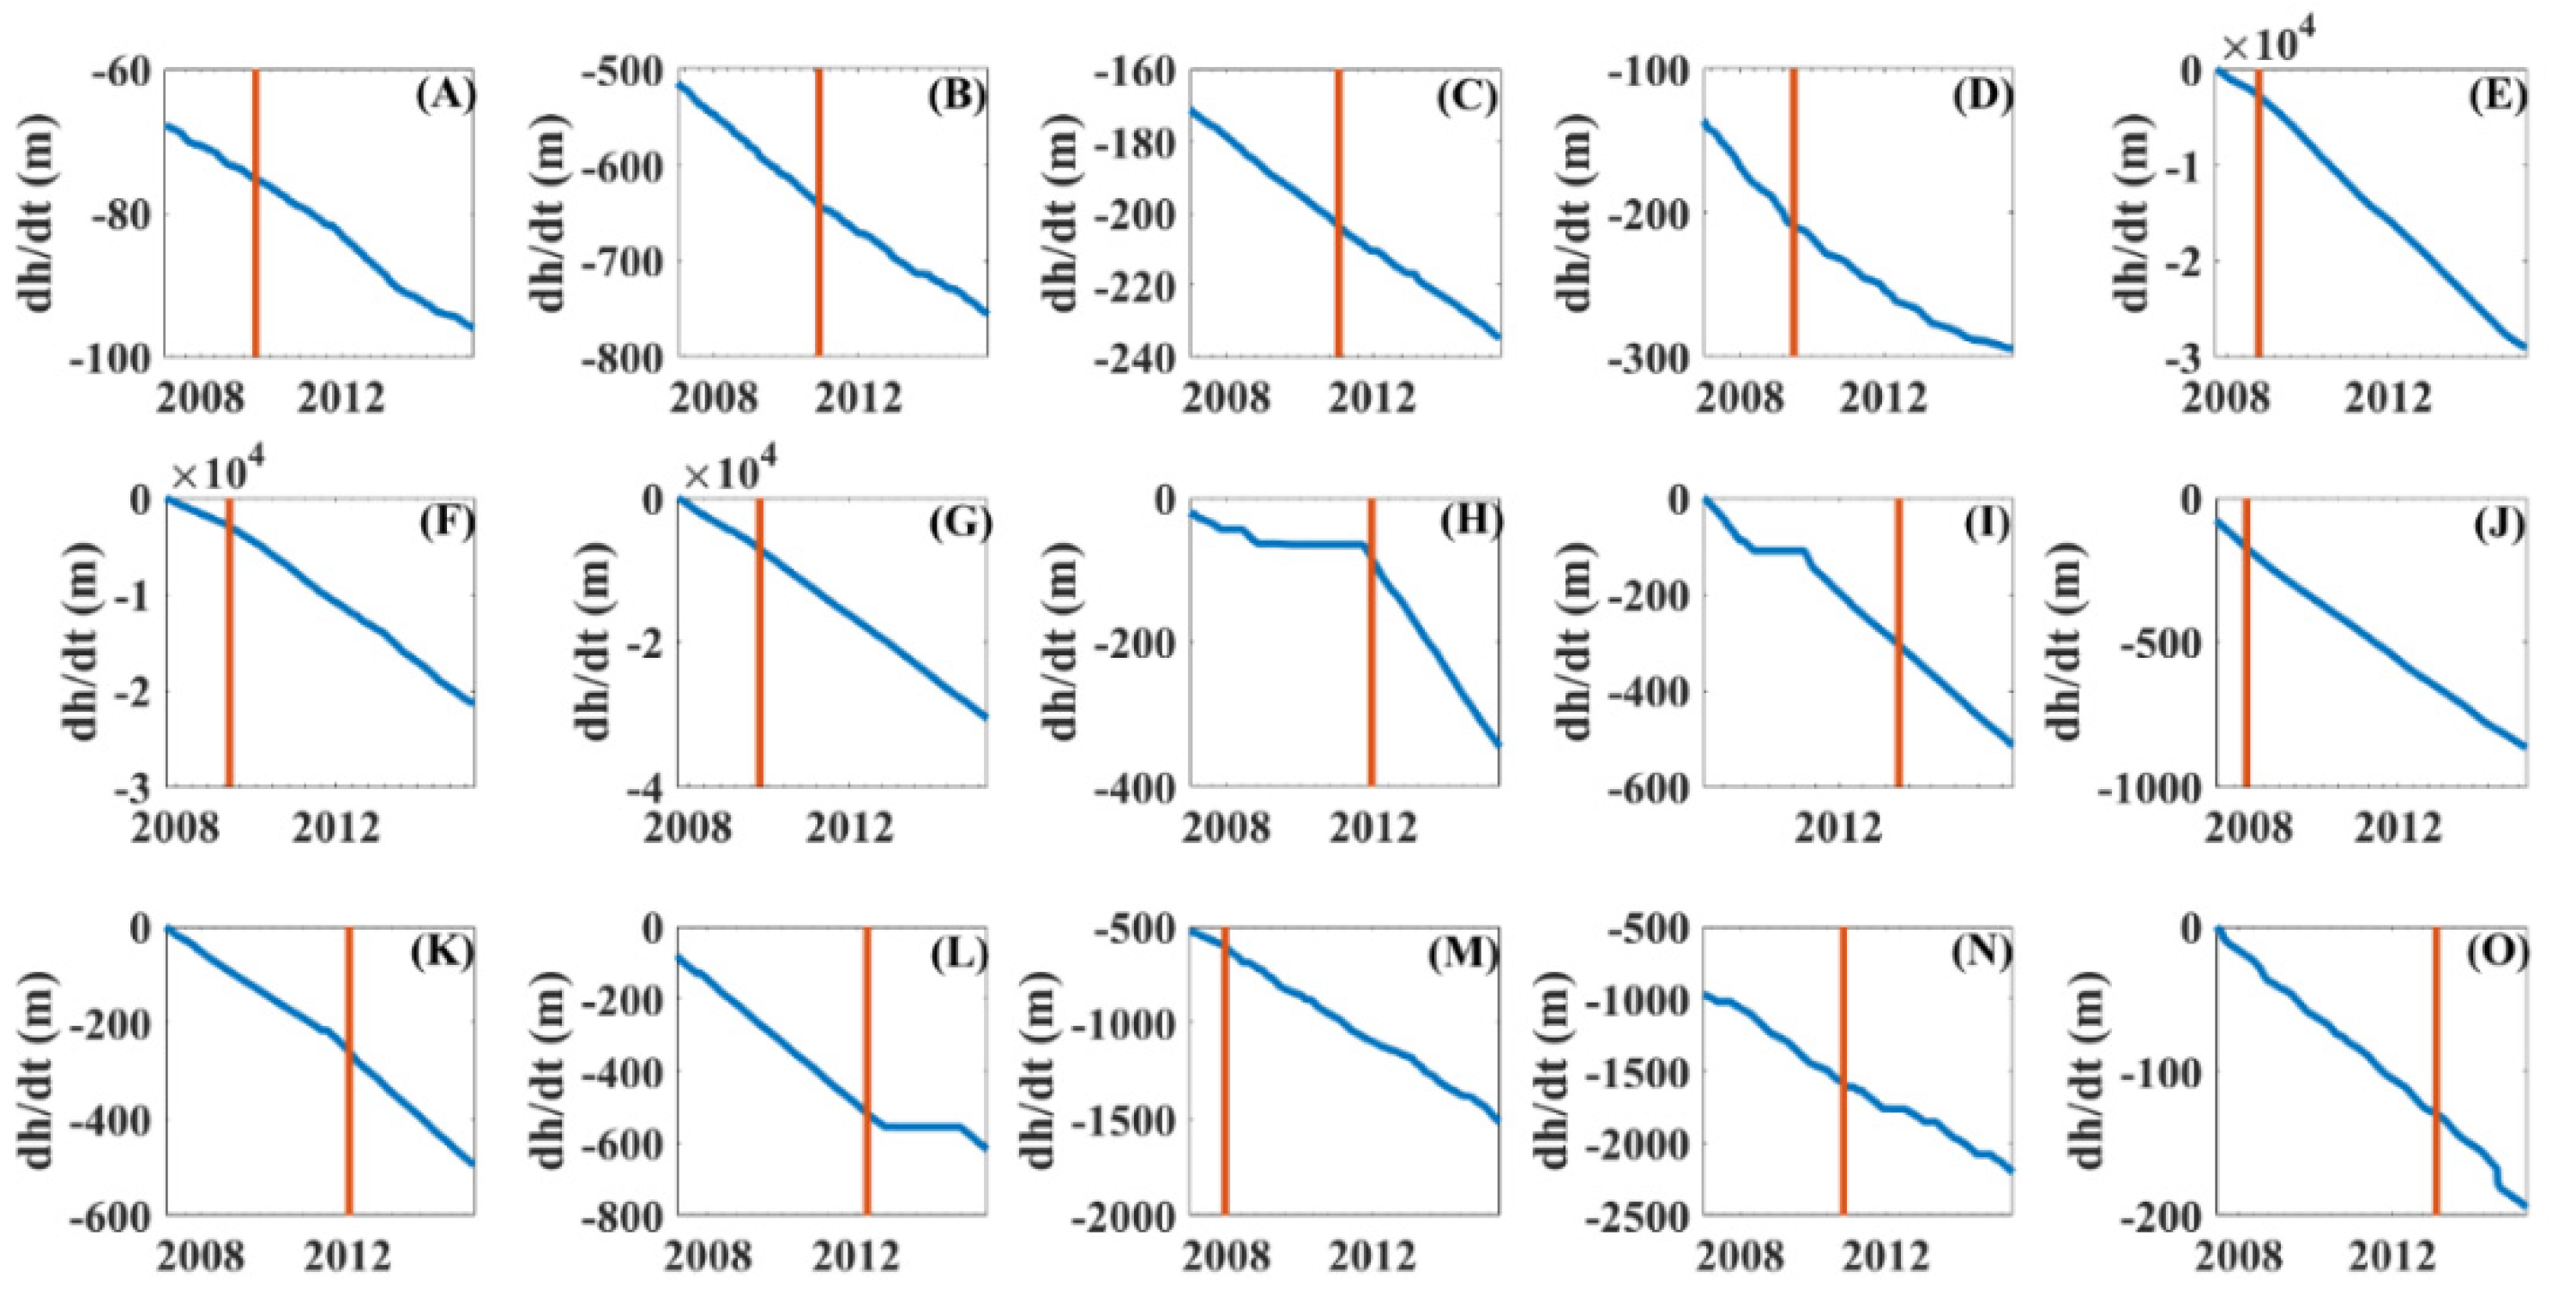
2.2. Groundwater Hydrographs
2.3. USGS Streamflow Data
3. Methods
3.1. Estimation of Recharge
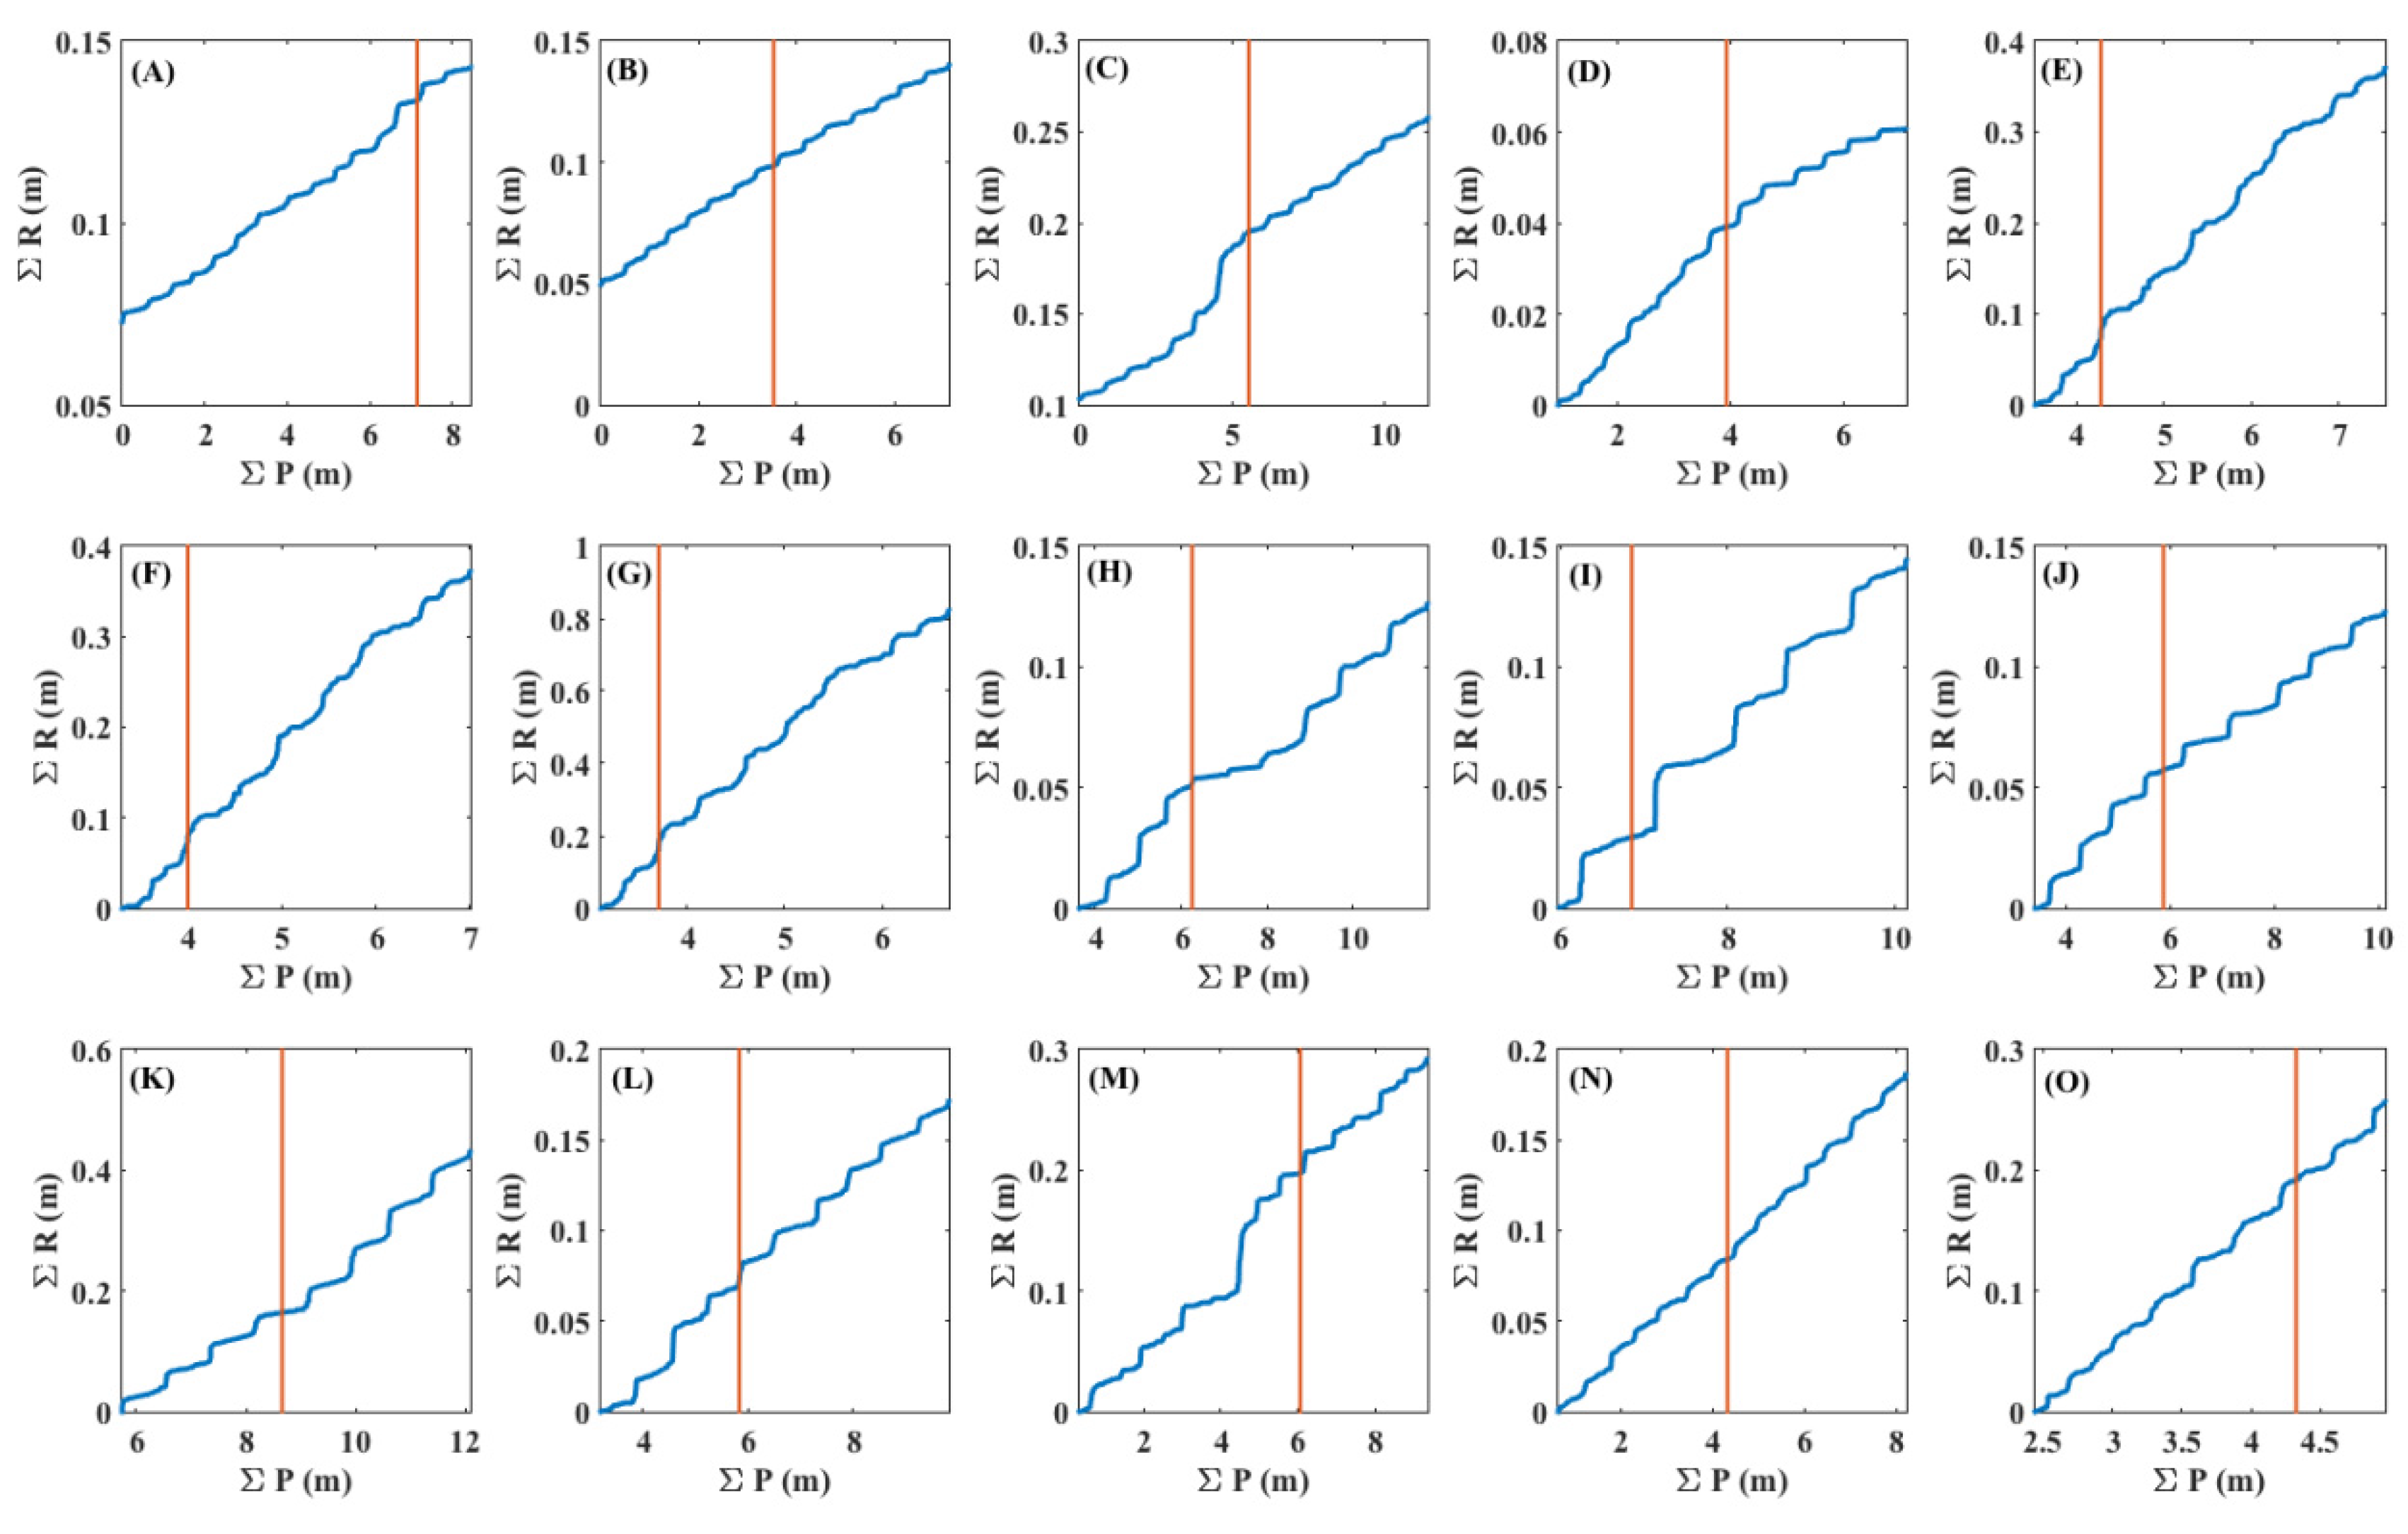
3.2. Double Mass Curve
3.3. Intensity-Duration-Frequency
4. Results
4.1. Temporal Changes in Groundwater Elevations
4.2. Recharge
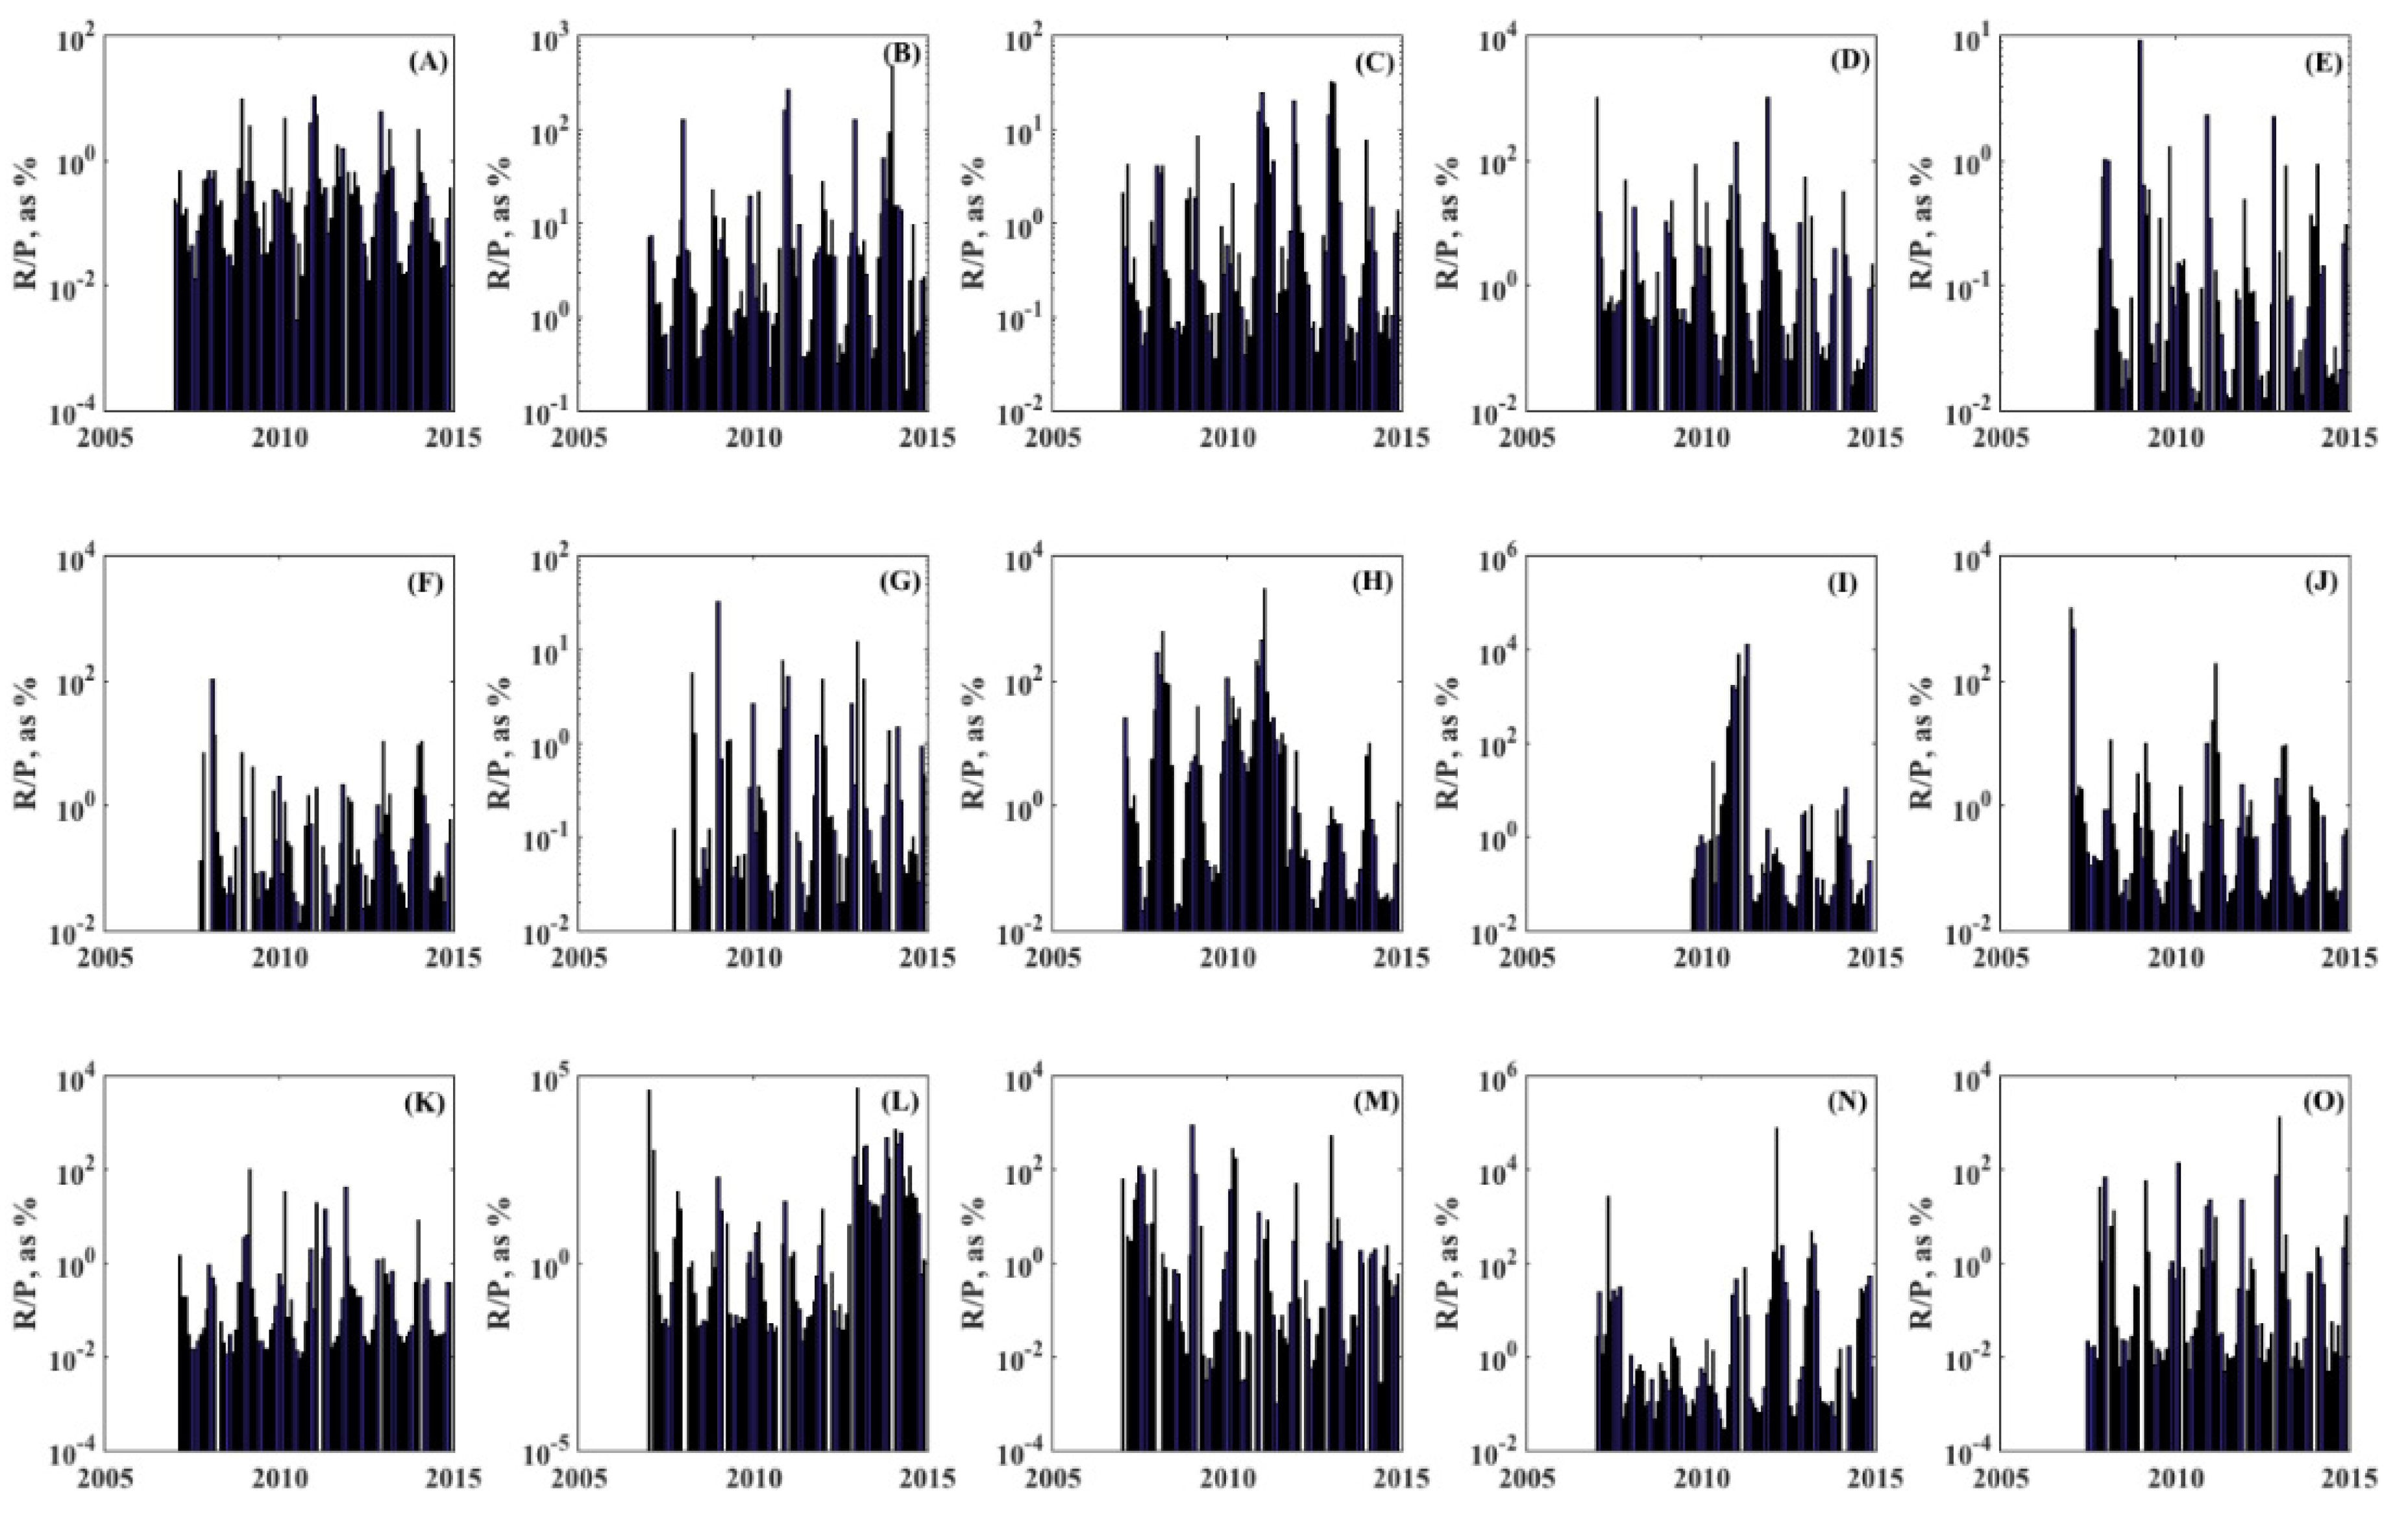
4.3. R:P Ratio
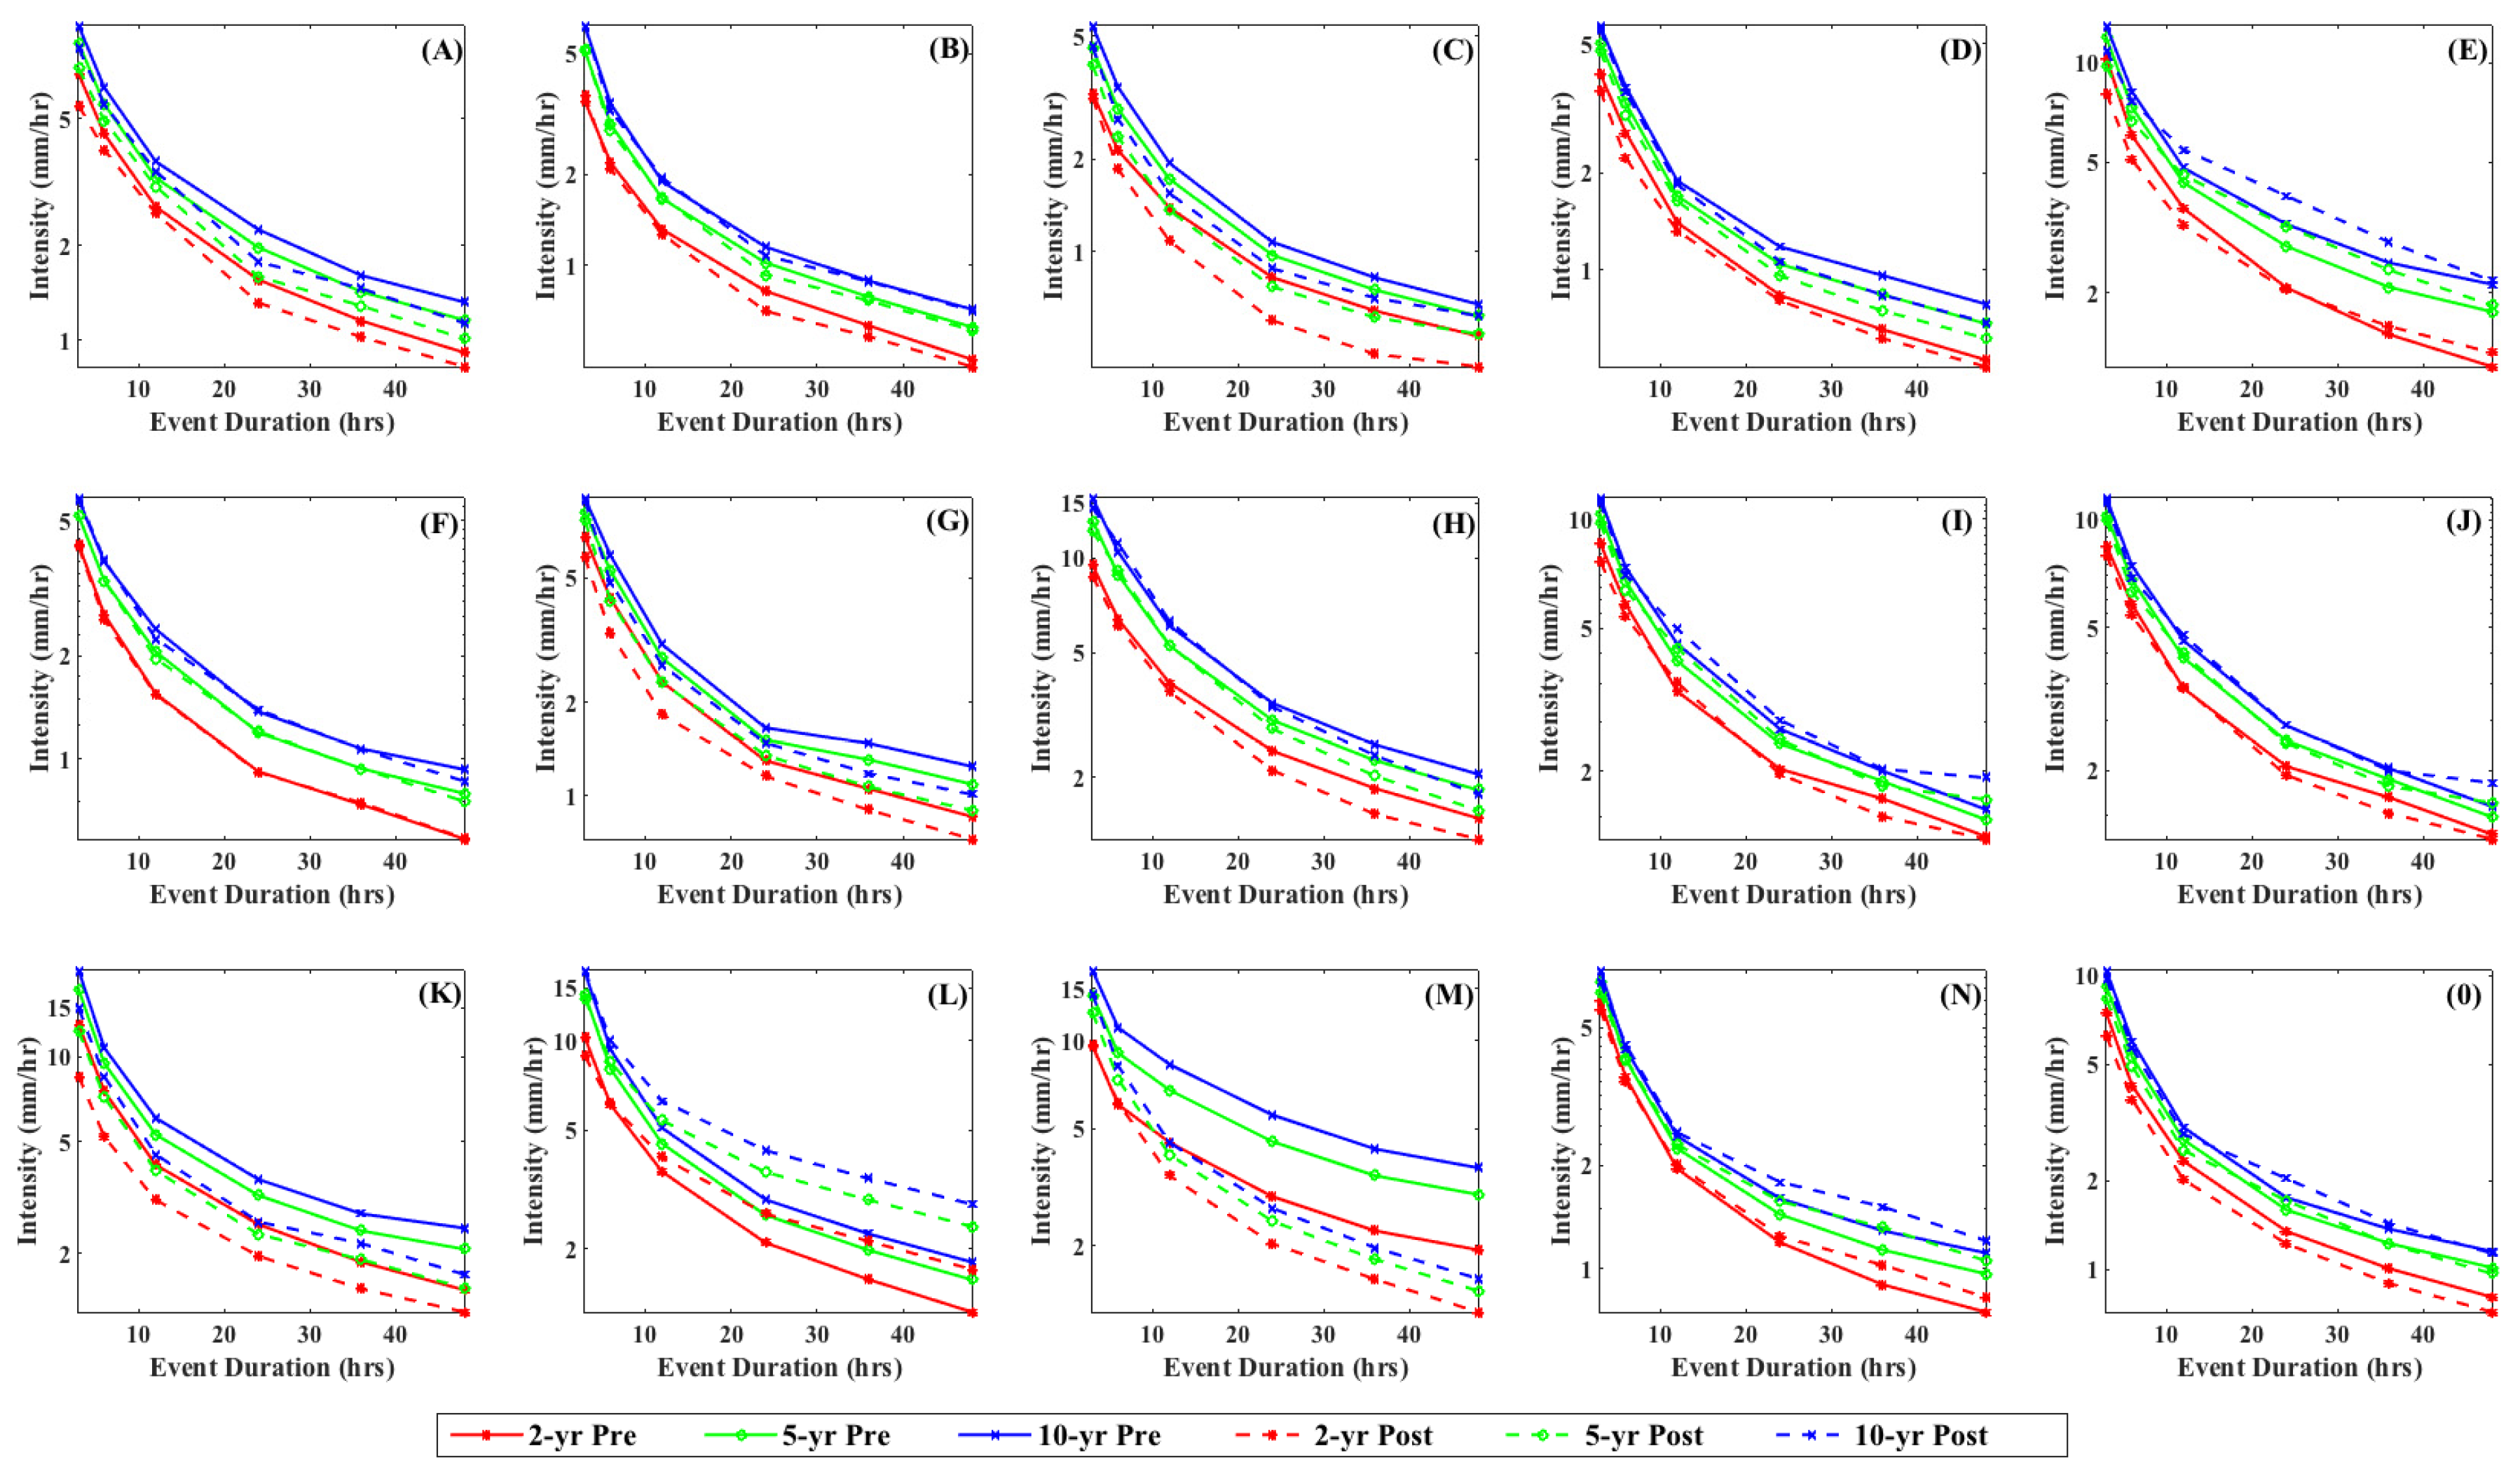
4.4. IDF Curves
5. Discussion
Acknowledgments
Author Contributions
Conflicts of Interest
References
- Pandey, V.P.; Shrestha, S.; Chapagain, S.K.; Kazama, F. A framework for measuring groundwater sustainability. Environ. Sci. Policy 2011, 14, 396–407. [Google Scholar] [CrossRef]
- Sophocleous, M. Groundwater recharge and sustainability in the High Plains aquifer in Kansas, USA. Hydrogeol. J. 2005, 13, 351–365. [Google Scholar] [CrossRef]
- Theis, C.V. The source of water derived from wells. Civil Eng. 1940, 10, 277–280. [Google Scholar]
- Thomas, B.F.; Famiglietti, J.S. Sustainable groundwater management in the arid Southwestern US: Coachella Valley, California. Water Resour. Manag. 2015, 29, 4411–4426. [Google Scholar] [CrossRef]
- Sharda, V.N. Watershed Management and Water Harvesting as Strategic Tools for Groundwater Augmentation. Available online: http://publications.iwmi.org/pdf/H039314.pdf (accessed on 3 March 2016).
- Bredehoeft, J.D. The water budget myth revisited: Why hydrogeologists model. Groundwater 2002, 40, 340–345. [Google Scholar] [CrossRef]
- Alley, W.M.; Leake, S.A. The journey from safe yield to sustainability. Groundwater 2004, 42, 12–16. [Google Scholar] [CrossRef]
- Zhou, Y. A critical review of groundwater budget myth, safe yield and sustainability. J. Hydrol. 2009, 370, 207–213. [Google Scholar] [CrossRef]
- Döll, P.; Flörke, M. Global-Scale Estimation of Diffuse Groundwater Recharge: Model Tuning to Local Data for Semi-Arid and Arid Regions and Assessment of Climate Change Impact; Institute of Physical Geography, Frankfurt University: Frankfurt am Main, Germany, 2005. [Google Scholar]
- Wada, Y.; van Beek, L.P.; van Kempen, C.M.; Reckman, J.W.; Vasak, S.; Bierkens, M.F. Global depletion of groundwater resources. Geophys. Res. Lett. 2010, 37. [Google Scholar] [CrossRef]
- Richey, A.S.; Thomas, B.F.; Lo, M.H.; Reager, J.T.; Famiglietti, J.S.; Voss, K.; Swenson, S.; Rodell, M. Quantifying renewable groundwater stress with GRACE. Water Resour. Res. 2015, 51, 5217–5238. [Google Scholar] [CrossRef] [PubMed]
- Loáiciga, H.A.; Maidment, D.R.; Valdes, J.B. Climate-change impacts in a regional karst aquifer, Texas, USA. J. Hydrol. 2000, 227, 173–194. [Google Scholar] [CrossRef]
- York, J.P.; Person, M.; Gutowski, W.J.; Winter, T.C. Putting aquifers into atmospheric simulation models: An example from the Mill Creek Watershed, northeastern Kansas. Adv. Water Resour. 2002, 25, 221–238. [Google Scholar] [CrossRef]
- Allen, D.M.; Mackie, D.C.; Wei, M. Groundwater and climate change: A sensitivity analysis for the Grand Forks aquifer, southern British Columbia, Canada. Hydrogeol. J. 2004, 12, 270–290. [Google Scholar] [CrossRef]
- Hughes, D.A. Incorporating groundwater recharge and discharge functions into an existing monthly rainfall–runoff model/Incorporation de fonctions de recharge et de vidange superficielle de nappes au sein d’un modèle pluie-débit mensuel existant. Hydrol. Sci. J. 2004, 49. [Google Scholar] [CrossRef]
- Green, T.R.; Bates, B.C.; Charles, S.P.; Fleming, P.M. Physically based simulation of potential effects of carbon dioxide–altered climates on groundwater recharge. Vadose Zone J. 2007, 6, 597–609. [Google Scholar] [CrossRef]
- Crosbie, R.S.; McCallum, J.L.; Walker, G.R.; Chiew, F.H. Modelling climate-change impacts on groundwater recharge in the Murray-Darling Basin, Australia. Hydrogeol. J. 2010, 18, 1639–1656. [Google Scholar] [CrossRef]
- Margat, J.; Van der Gun, J. Groundwater around the World: A Geographic Synopsis; CRC Press: Boca Raton, FL, USA, 2013. [Google Scholar]
- Kløve, B.; Ala-Aho, P.; Bertrand, G.; Gurdak, J.J.; Kupfersberger, H.; Kværner, J.; Muotka, T.; Mykrä, H.; Preda, E.; Rossi, P.; et al. Climate change impacts on groundwater and dependent ecosystems. J. Hydrol. 2014, 518, 250–266. [Google Scholar] [CrossRef]
- Famiglietti, J.S. The global groundwater crisis. Nat. Clim. Chang. 2014, 4, 945–948. [Google Scholar] [CrossRef]
- Konikow, L.F. Contribution of global groundwater depletion since 1900 to sea-level rise. Geophys. Res. Lett. 2011, 38. [Google Scholar] [CrossRef]
- Voss, C.I.; Soliman, S.M. The transboundary non-renewable Nubian Aquifer System of Chad, Egypt, Libya and Sudan: Classical groundwater questions and parsimonious hydrogeologic analysis and modeling. Hydrogeol. J. 2014, 22, 441–468. [Google Scholar] [CrossRef]
- Hashemi, H.; Uvo, C.B.; Berndtsson, R. Coupled modeling approach to assess climate change impacts on groundwater recharge and adaptation in arid areas. Hydrol. Earth Syst. Sci. 2015, 19, 4165–4181. [Google Scholar] [CrossRef]
- Gee, G.W.; Hillel, D. Groundwater recharge in arid regions: Review and critique of estimation methods. Hydrol. Process. 1988, 2, 255–266. [Google Scholar] [CrossRef]
- Lewis, F.M.; Walker, G.R. Assessing the potential for significant and episodic recharge in southwestern Australia using rainfall data. Hydrogeol. J. 2002, 10, 229–237. [Google Scholar] [CrossRef]
- Crosbie, R.S.; McCallum, J.L.; Walker, G.R.; Chiew, F.H. Episodic recharge and climate change in the Murray-Darling Basin, Australia. Hydrogeol. J. 2012, 20, 245–261. [Google Scholar] [CrossRef]
- Barron, O.V.; Crosbie, R.S.; Dawes, W.R.; Charles, S.P.; Pickett, T.; Donn, M.J. Climatic controls on diffuse groundwater recharge across Australia. Hydrol. Earth Syst. Sci. 2012, 16, 4557–4570. [Google Scholar] [CrossRef]
- Nimmo, J.R.; Horowitz, C.; Mitchell, L. Discrete-Storm Water-Table Fluctuation Method to Estimate Episodic Recharge. Groundwater 2015, 53, 282–292. [Google Scholar] [CrossRef] [PubMed]
- Piechota, T.; Timilsena, J.; Tootle, G.; Hidalgo, H. The western US drought: How bad is it? Eos Trans. Am. Geophys. Union 2004, 85, 301–304. [Google Scholar] [CrossRef]
- Cayan, D.R.; Das, T.; Pierce, D.W.; Barnett, T.P.; Tyree, M.; Gershunov, A. Future dryness in the southwest US and the hydrology of the early 21st century drought. Proc. Natl. Acad. Sci. USA 2010, 107, 21271–21276. [Google Scholar] [CrossRef] [PubMed]
- Castle, S.L.; Thomas, B.F.; Reager, J.T.; Rodell, M.; Swenson, S.C.; Famiglietti, J.S. Groundwater depletion during drought threatens future water security of the Colorado River Basin. Geophys. Res. Lett. 2014, 41, 5904–5911. [Google Scholar] [CrossRef] [PubMed]
- Alley, W.M.; Konikow, L.F. Bringing GRACE down to earth. Groundwater 2015, 53, 826–829. [Google Scholar] [CrossRef] [PubMed]
- Alley, W.M.; La Baugh, J.W.; Reilly, T.E. Groundwater as an element in the hydrological cycle. Encycl. Hydrol. Sci. 2005. [Google Scholar] [CrossRef]
- Siebert, S.; Burke, J.; Faures, J.M.; Frenken, K.; Hoogeveen, J.; Döll, P.; Portmann, F.T. Groundwater use for irrigation—A global inventory. Hydrol. Earth Syst. Sci. 2010, 14, 1863–1880. [Google Scholar] [CrossRef] [Green Version]
- Trenberth, K.E.; Dai, A.; Rasmussen, R.M.; Parsons, D.B. The changing character of precipitation. Bull. Am. Meteorol. Soc. 2003, 84, 1205–1217. [Google Scholar] [CrossRef]
- Searcy, J.K.; Hardison, C.H. Double-Mass Curves; U.S. Government Printing Office: Washington, DC, USA, 1960. [Google Scholar]
- Huffman, G.J.; Bolvin, D.T.; Nelkin, E.J.; Wolff, D.B.; Adler, R.F.; Gu, G.; Stocker, E.F. The TRMM multisatellite precipitation analysis (TMPA): Quasi-global, multiyear, combined-sensor precipitation estimates at fine scales. J. Hydrometeorol. 2007, 8, 38–55. [Google Scholar] [CrossRef]
- Schneider, U.; Becker, A.; Finger, P.; Meyer-Christoffer, A.; Rudolf, B.; Ziese, M. GPCC Full Data Reanalysis Version 7.0 At 2.5deg: Monthly Land-Surface Precipitation from Rain-Gages Built on GTS-based and Historic Data; Global Precipitation Climatology Centre: Boulder, CO, USA, 2015. [Google Scholar]
- Behrangi, A.; Khakbaz, B.; Jaw, T.C.; AghaKouchak, A.; Hsu, K.; Sorooshian, S. Hydrologic evaluation of satellite precipitation products over a mid-size basin. J. Hydrol. 2011, 397, 225–237. [Google Scholar] [CrossRef]
- Wall, C.L.; Zipser, E.J.; Liu, C. A regional climatology of monsoonal precipitation in the southwestern United States using TRMM. J. Hydrometeorol. 2012, 13, 310–323. [Google Scholar] [CrossRef]
- Xu, W.; Zipser, E.J. Properties of deep convection in tropical continental, monsoon, and oceanic rainfall regimes. Geophys. Res. Lett. 2012, 39. [Google Scholar] [CrossRef]
- U.S. Geological Survey. USGS Water Data for the Nation. Available online: http://waterdata.usgs.gov/nwis (accessed on 7 March 2016).
- Arizona Department of Water Resources. Groundwater Site Inventory. Available online: http://gisweb.azwater.gov/waterresourcesdata/gwsi.aspx (accessed on 7 March 2016).
- Vogel, R.M.; Kroll, C.N. Regional geohydrologic-geomorphic relationships for the estimation of low-flow statistics. Water Resour. Res. 1992, 28, 2451–2458. [Google Scholar] [CrossRef]
- Thomas, B.F.; Vogel, R.M.; Kroll, C.N.; Famiglietti, J.S. Estimation of the base flow recession constant under human interference. Water Resour. Res. 2013, 49, 7366–7379. [Google Scholar] [CrossRef]
- Healy, R.W.; Cook, P.G. Using groundwater levels to estimate recharge. Hydrogeol. J. 2002, 10, 91–109. [Google Scholar] [CrossRef]
- Heppner, C.S.; Nimmo, J.R. A computer program for predicting recharge with a master recession curve. US Geological Survey: Menlo Park, CA, USA, 2005. [Google Scholar]
- Olmsted, F.H.; Hely, A.G. Relation between Ground Water and Surface Water in Brandywine Creek Basin, Pennsylvania (No. 417-A); U.S. Government Printing Office: Washington, DC, USA, 1962. [Google Scholar]
- Risser, D.W.; Gburek, W.J.; Folmar, G.J. Comparison of recharge estimates at a small watershed in east-central Pennsylvania, USA. Hydrogeol. J. 2009, 17, 287–298. [Google Scholar] [CrossRef]
- Merriam, C.F. A comprehensive study of the rainfall on the Susquehanna Valley. Eos Trans. Am. Geophys. Union 1937, 18, 471–476. [Google Scholar] [CrossRef]
- Lee, C.H.; Chen, W.P.; Lee, R.H. Estimation of groundwater recharge using water balance coupled with base-flow-record estimation and stable-base-flow analysis. Environ. Geol. 2006, 51, 73–82. [Google Scholar] [CrossRef]
- Stedinger, J.R.; Vogel, R.M.; Foufoula-Georgiou, E. Frequency Analysis of Extreme Events; U.S. Government Printing Office: Washington, DC, USA, 1993. [Google Scholar]
- Smith, J.A. Precipitation, Handbook of Hydrology; McGraw-Hill, Inc.: New York, NY, USA, 1993; Volume 3. [Google Scholar]
- McCuen, R.H. Hydrologic Design and Analysis; Prince Hall: New Jersey, NJ, USA, 1998; Volume 814. [Google Scholar]
- Chow, V.T.; Maidment, D.R.; Mays, L.W. Applied Hydrology; McGraw-Hill: New York, NY, USA, 1988. [Google Scholar]
- Dingman, S.L. Physical Hydrology; Waveland Press: Long Grove, IL, USA, 2015. [Google Scholar]
- Koutsoyiannis, D. Statistics of extremes and estimation of extreme rainfall: I. Theoretical investigation/Statistiques de valeurs extrêmes et estimation de précipitations extrêmes: I. Recherche théorique. Hydrol. Sci. J. 2004, 49. [Google Scholar] [CrossRef]
- Gumbel, E.J. Statistics of Extremes; Courier Corporation: New York, NY, USA, 2012. [Google Scholar]
- Cuanne, C. Unbiased plotting positions—A review. J. Hydrol. 1987, 37, 205–222. [Google Scholar] [CrossRef]
- Hosking, J.R.M. Algorithm AS 215: Maximum-likelihood estimation of the parameters of the generalized extreme-value distribution. Appl. Stat. 1985, 34, 301–310. [Google Scholar] [CrossRef]
- Dourte, D.; Shukla, S.; Singh, P.; Haman, D. Rainfall intensity-duration-frequency relationships for Andhra Pradesh, India: Changing rainfall patterns and implications for runoff and groundwater recharge. J. Hydrol. Eng. 2012, 18, 324–330. [Google Scholar] [CrossRef]
- Wang, H.; Gao, J.E.; Zhang, M.J.; Li, X.H.; Zhang, S.L.; Jia, L.Z. Effects of rainfall intensity on groundwater recharge based on simulated rainfall experiments and a groundwater flow model. Catena 2015, 127, 80–91. [Google Scholar] [CrossRef]
- Camera, C.; Masetti, M.; Apuani, T. Rainfall, infiltration, and groundwater flow in a terraced slope of Valtellina (Northern Italy): Field data and modelling. Environ. Earth Sci. 2012, 65, 1191–1202. [Google Scholar] [CrossRef]
- Machusick, M.; Welker, A.; Traver, R. Groundwater mounding at a storm-water infiltration BMP. J. Irrig. Drain. Eng. 2011, 137, 154–160. [Google Scholar] [CrossRef]
- Rutledge, A.T. Computer Programs for Describing the Recession of Ground-Water Discharge and for Estimating Mean Ground-Water Recharge and Discharge from Streamflow Records: Update; US Department of the Interior: Washington, DC, USA; US Geological Survey: Reston, VA, USA, 1998. [Google Scholar]
- Posavec, K.; Bačani, A.; Nakić, Z. A visual basic spreadsheet macro for recession curve analysis. Groundwater 2006, 44, 764–767. [Google Scholar] [CrossRef] [PubMed]
- Konikow, L.F. Groundwater Depletion in the United States (1900–2008); US Department of the Interior: Washington, DC, USA; US Geological Survey: Reston, VA, USA, 2013; p. 63. [Google Scholar]
- Dobrowski, S.Z.; Abatzoglou, J.; Swanson, A.K.; Greenberg, J.A.; Mynsberge, A.R.; Holden, Z.A.; Schwartz, M.K. The climate velocity of the contiguous United States during the 20th century. Glob. Chang. Biol. 2013, 19, 241–251. [Google Scholar] [CrossRef] [PubMed]
- Mitchell, K.E.; Lohmann, D.; Houser, P.R.; Wood, E.F.; Schaake, J.C.; Robock, A.; Cosgrove, B.A.; Sheffield, J.; Duan, Q.; Luo, L.; et al. The multi-institution North American Land Data Assimilation System (NLDAS): Utilizing multiple GCIP products and partners in a continental distributed hydrological modeling system. J. Geophys. Res. Atmos. 2004, 109. [Google Scholar] [CrossRef]
- Xia, Y.; Mitchell, K.; Ek, M.; Cosgrove, B.; Sheffield, J.; Luo, L.; Alonge, C.; Wei, H.; Meng, J.; Livneh, B.; et al. Continental-scale water and energy flux analysis and validation for North American Land Data Assimilation System project phase 2 (NLDAS-2): 2. Validation of model-simulated streamflow. J. Geophys. Res. Atmos. 2012, 117. [Google Scholar] [CrossRef]
- Koren, V.; Schaake, J.; Mitchell, K.; Duan, Q.Y.; Chen, F.; Baker, J.M. A parameterization of snowpack and frozen ground intended for NCEP weather and climate models. J. Geophys. Res. Atmos. 1999, 104, 19569–19585. [Google Scholar] [CrossRef]
- Liang, X.; Lettenmaier, D.P.; Wood, E.F.; Burges, S.J. A simple hydrologically based model of land surface water and energy fluxes for general circulation models. J. Geophys. Res. All Ser. 1994, 99, 14415–14428. [Google Scholar] [CrossRef]
- Koster, R.D.; Suarez, M.J. Modeling the land surface boundary in climate models as a composite of independent vegetation stands. J. Geophys. Res. 1992, 97. [Google Scholar] [CrossRef]
- French, R.H.; Jacobson, R.L.; Lyles, B.F. Threshold precipitation events and potential ground-water recharge. J. Hydr. Eng. 1996, 122, 573–578. [Google Scholar] [CrossRef]
- Mock, C.J. Climatic controls and spatial variations of precipitation in the western United States. J. Clim. 1996, 9, 1111–1125. [Google Scholar] [CrossRef]
- Crosbie, R.S.; Dawes, W.R.; Charles, S.P.; Mpelasoka, F.S.; Aryal, S.; Barron, O.; Summerell, G.K. Differences in future recharge estimates due to GCMs, downscaling methods and hydrological models. Geophys. Res. Lett. 2011, 38. [Google Scholar] [CrossRef]
- McCallum, J.L.; Crosbie, R.S.; Walker, G.R.; Dawes, W.R. Impacts of climate change on groundwater in Australia: A sensitivity analysis of recharge. Hydrogeol. J. 2010, 18, 1625–1638. [Google Scholar] [CrossRef]
- Kendy, E.; Zhang, Y.; Liu, C.; Wang, J.; Steenhuis, T. Groundwater recharge from irrigated cropland in the North China Plain: Case study of Luancheng County, Hebei Province, 1949–2000. Hydrol. Process. 2004, 18, 2289–2302. [Google Scholar] [CrossRef]
- Griffin, D.; Woodhouse, C.A.; Meko, D.M.; Stahle, D.W.; Faulstich, H.L.; Carrillo, C.; Leavitt, S.W. North American monsoon precipitation reconstructed from tree-ring latewood. Geophys. Res. Lett. 2013, 40, 954–958. [Google Scholar] [CrossRef]
- Cook, B.I.; Seager, R. The response of the North American Monsoon to increased greenhouse gas forcing. J. Geophys. Res. Atmos. 2013, 118, 1690–1699. [Google Scholar] [CrossRef]
- Gleick, P.H. Water in crisis: Paths to sustainable water use. Ecol. Appl. 1998, 8, 571–579. [Google Scholar] [CrossRef]
- Scanlon, B.R.; Keese, K.E.; Flint, A.L.; Flint, L.E.; Gaye, C.B.; Edmunds, W.M.; Simmers, I. Global synthesis of groundwater recharge in semiarid and arid regions. Hydrol. Process. 2006, 20, 3335–3370. [Google Scholar] [CrossRef]
- Pietersen, K. Multiple criteria decision analysis (MCDA): A tool to support sustainable management of groundwater resources in South Africa. Water SA 2007, 32, 119–128. [Google Scholar] [CrossRef]
- McCabe, G.J.; Dettinger, M.D. Decadal variations in the strength of ENSO teleconnections with precipitation in the western United States. Int. J. Climatol. 1999, 19, 1399–1410. [Google Scholar] [CrossRef]
- Cayan, D.R.; Redmond, K.T.; Riddle, L.G. ENSO and hydrologic extremes in the western United States*. J. Clim. 1999, 12, 2881–2893. [Google Scholar] [CrossRef]


| Well ID | Figure Label | GW Level Δt | R:P Date |
|---|---|---|---|
| 393143111523301 | A | 6-h | October 2007 |
| 373735113394101 | B | 6-h | September 2007 |
| 375244112463201 | C | 6-h | July 2007 |
| 393020112362201 | D | 6-h | August 2008 |
| 360055110304001 | E * | 15-min | April 2009 |
| 361225110240701 | F * | 15-min | April 2009 |
| 363143110355001 | G * | 15-min | April 2009 |
| 355855114043501 | H * | 6-h | November 2008 |
| 351401114132401 | I * | 6-h | August 2010 |
| 350633114103701 | J * | 6-h | August 2009 |
| 345524112374401 | K * | 6-h | August 2010 |
| 344359111591101 | L * | 6-h | January 2009 |
| 341402111215101 | M * | 6-h | August 2009 |
| 324113109415401 | N * | 6-h | September 2007 |
| 320901110175301 | O * | 6-h | September 2008 |
| Duration | Site A | Site B | Site C | Site D | Site E | ||||||||||
| 2-year | 5-year | 10-year | 2-year | 5-year | 10-year | 2-year | 5-year | 10-year | 2-year | 5-year | 10-year | 2-year | 5-year | 10-year | |
| 3-h | 0.80 | 0.83 | 0.85 | 1.05 | 1.01 | 1.00 | 0.97 | 0.89 | 0.86 | 0.89 | 0.94 | 0.97 | 0.78 | 0.82 | 0.84 |
| 6-h | 0.89 | 0.89 | 0.88 | 0.95 | 0.95 | 0.95 | 0.87 | 0.81 | 0.79 | 0.83 | 0.92 | 0.96 | 0.84 | 0.91 | 0.93 |
| 12-h | 0.95 | 0.94 | 0.93 | 0.96 | 1.01 | 1.03 | 0.78 | 0.79 | 0.80 | 0.94 | 0.96 | 0.97 | 0.89 | 1.05 | 1.14 |
| 24-h | 0.85 | 0.81 | 0.79 | 0.86 | 0.91 | 0.94 | 0.72 | 0.79 | 0.82 | 0.96 | 0.92 | 0.90 | 0.99 | 1.15 | 1.22 |
| 36-h | 0.89 | 0.90 | 0.91 | 0.92 | 0.97 | 0.99 | 0.72 | 0.81 | 0.86 | 0.94 | 0.89 | 0.87 | 1.06 | 1.13 | 1.16 |
| 48-h | 0.90 | 0.87 | 0.86 | 0.95 | 0.98 | 0.99 | 0.80 | 0.87 | 0.92 | 0.95 | 0.90 | 0.88 | 1.10 | 1.05 | 1.02 |
| Site F | Site G | Site H | Site I | Site J | |||||||||||
| 2-year | 5-year | 10-year | 2-year | 5-year | 10-year | 2-year | 5-year | 10-year | 2-year | 5-year | 10-year | 2-year | 5-year | 10-year | |
| 3-h | 0.99 | 1.00 | 1.01 | 0.86 | 0.94 | 0.98 | 0.92 | 0.93 | 0.93 | 0.89 | 0.95 | 0.98 | 0.94 | 0.97 | 0.98 |
| 6-h | 0.97 | 1.00 | 1.01 | 0.77 | 0.80 | 0.82 | 0.96 | 1.03 | 1.06 | 0.92 | 0.94 | 0.95 | 0.93 | 0.93 | 0.92 |
| 12-h | 0.99 | 0.96 | 0.94 | 0.79 | 0.83 | 0.86 | 0.94 | 1.00 | 1.03 | 1.06 | 1.09 | 1.10 | 1.01 | 1.03 | 1.04 |
| 24-h | 0.99 | 1.01 | 1.01 | 0.89 | 0.89 | 0.89 | 0.87 | 0.94 | 0.97 | 0.97 | 1.03 | 1.06 | 0.94 | 0.98 | 1.00 |
| 36-h | 1.01 | 1.00 | 0.99 | 0.86 | 0.82 | 0.80 | 0.83 | 0.89 | 0.92 | 0.89 | 0.97 | 1.01 | 0.90 | 0.96 | 0.99 |
| 48-h | 1.01 | 0.95 | 0.92 | 0.85 | 0.82 | 0.81 | 0.86 | 0.86 | 0.86 | 0.98 | 1.14 | 1.22 | 0.97 | 1.09 | 1.16 |
| Site K | Site L | Site M | Site N | Site O | |||||||||||
| 2-year | 5-year | 10-year | 2-year | 5-year | 10-year | 2-year | 5-year | 10-year | 2-year | 5-year | 10-year | 2-year | 5-year | 10-year | |
| 3-h | 0.66 | 0.71 | 0.74 | 0.87 | 0.97 | 1.01 | 0.99 | 0.88 | 0.83 | 0.94 | 0.93 | 0.93 | 0.84 | 0.91 | 0.94 |
| 6-h | 0.69 | 0.76 | 0.79 | 1.01 | 1.05 | 1.07 | 1.01 | 0.81 | 0.74 | 0.97 | 1.01 | 1.03 | 0.90 | 0.93 | 0.95 |
| 12-h | 0.75 | 0.74 | 0.74 | 1.12 | 1.20 | 1.23 | 0.77 | 0.60 | 0.54 | 1.03 | 1.03 | 1.03 | 0.86 | 0.92 | 0.95 |
| 24-h | 0.77 | 0.73 | 0.71 | 1.25 | 1.39 | 1.46 | 0.69 | 0.54 | 0.48 | 1.04 | 1.09 | 1.12 | 0.91 | 1.08 | 1.16 |
| 36-h | 0.80 | 0.79 | 0.78 | 1.34 | 1.47 | 1.53 | 0.68 | 0.52 | 0.46 | 1.14 | 1.16 | 1.17 | 0.89 | 0.99 | 1.04 |
| 48-h | 0.83 | 0.73 | 0.68 | 1.39 | 1.51 | 1.56 | 0.61 | 0.47 | 0.42 | 1.10 | 1.09 | 1.09 | 0.89 | 0.95 | 0.98 |
© 2016 by the authors; licensee MDPI, Basel, Switzerland. This article is an open access article distributed under the terms and conditions of the Creative Commons by Attribution (CC-BY) license (http://creativecommons.org/licenses/by/4.0/).
Share and Cite
Thomas, B.F.; Behrangi, A.; Famiglietti, J.S. Precipitation Intensity Effects on Groundwater Recharge in the Southwestern United States. Water 2016, 8, 90. https://doi.org/10.3390/w8030090
Thomas BF, Behrangi A, Famiglietti JS. Precipitation Intensity Effects on Groundwater Recharge in the Southwestern United States. Water. 2016; 8(3):90. https://doi.org/10.3390/w8030090
Chicago/Turabian StyleThomas, Brian F., Ali Behrangi, and James S. Famiglietti. 2016. "Precipitation Intensity Effects on Groundwater Recharge in the Southwestern United States" Water 8, no. 3: 90. https://doi.org/10.3390/w8030090