3.3. Observed and Monitored Pollution Patterns of Surface Waters in the KRB
The KRB is characterized by a relatively low population density (8 to 10 people km²). However, spatial concentrations of population in urban settlements, an often poor state of municipal wastewater infrastructures, and high livestock densities in the riverine floodplains as well as both small and large-scale mining activities all contribute to the potential threats facing the aquatic ecosystems of the KRB. In our study, the identified key stressors affecting water quality and the aquatic ecosystem of the KRB were: (i) rising nutrient inputs; (ii) high fine sediment loads; and (iii) mining-related influxes of toxic substances [
14]. Even though most rivers in Mongolia are in relatively pristine condition, a state inventory for surface water conducted in 2003 displayed that at least 23 rivers in eight provinces were morphologically changed and/or polluted due to mining activities [
63], including the Kharaa-Orkhon-Selenge river system.
In recent years, the uncontrolled expansion of mining activities have continuously and/or accidentally released toxic substances into the environment causing irreversible damage [
64,
65]. Studies in adjoining river basins have shown that gold, copper and molybdenum mining are major polluters [
23,
24,
65,
66], drastically affecting the ecology of diatom, macroinvertebrate and fish communities [
39,
64]. For example, in 2007, an accident at an illegal gold mine in Khongor Sum (Darkhan-Uul Aimag) contaminated groundwater and soil with mercury, zinc and cyanide, leaving far-reaching consequences for residents and their livestock due to increased exposure of contaminated water [
40,
67,
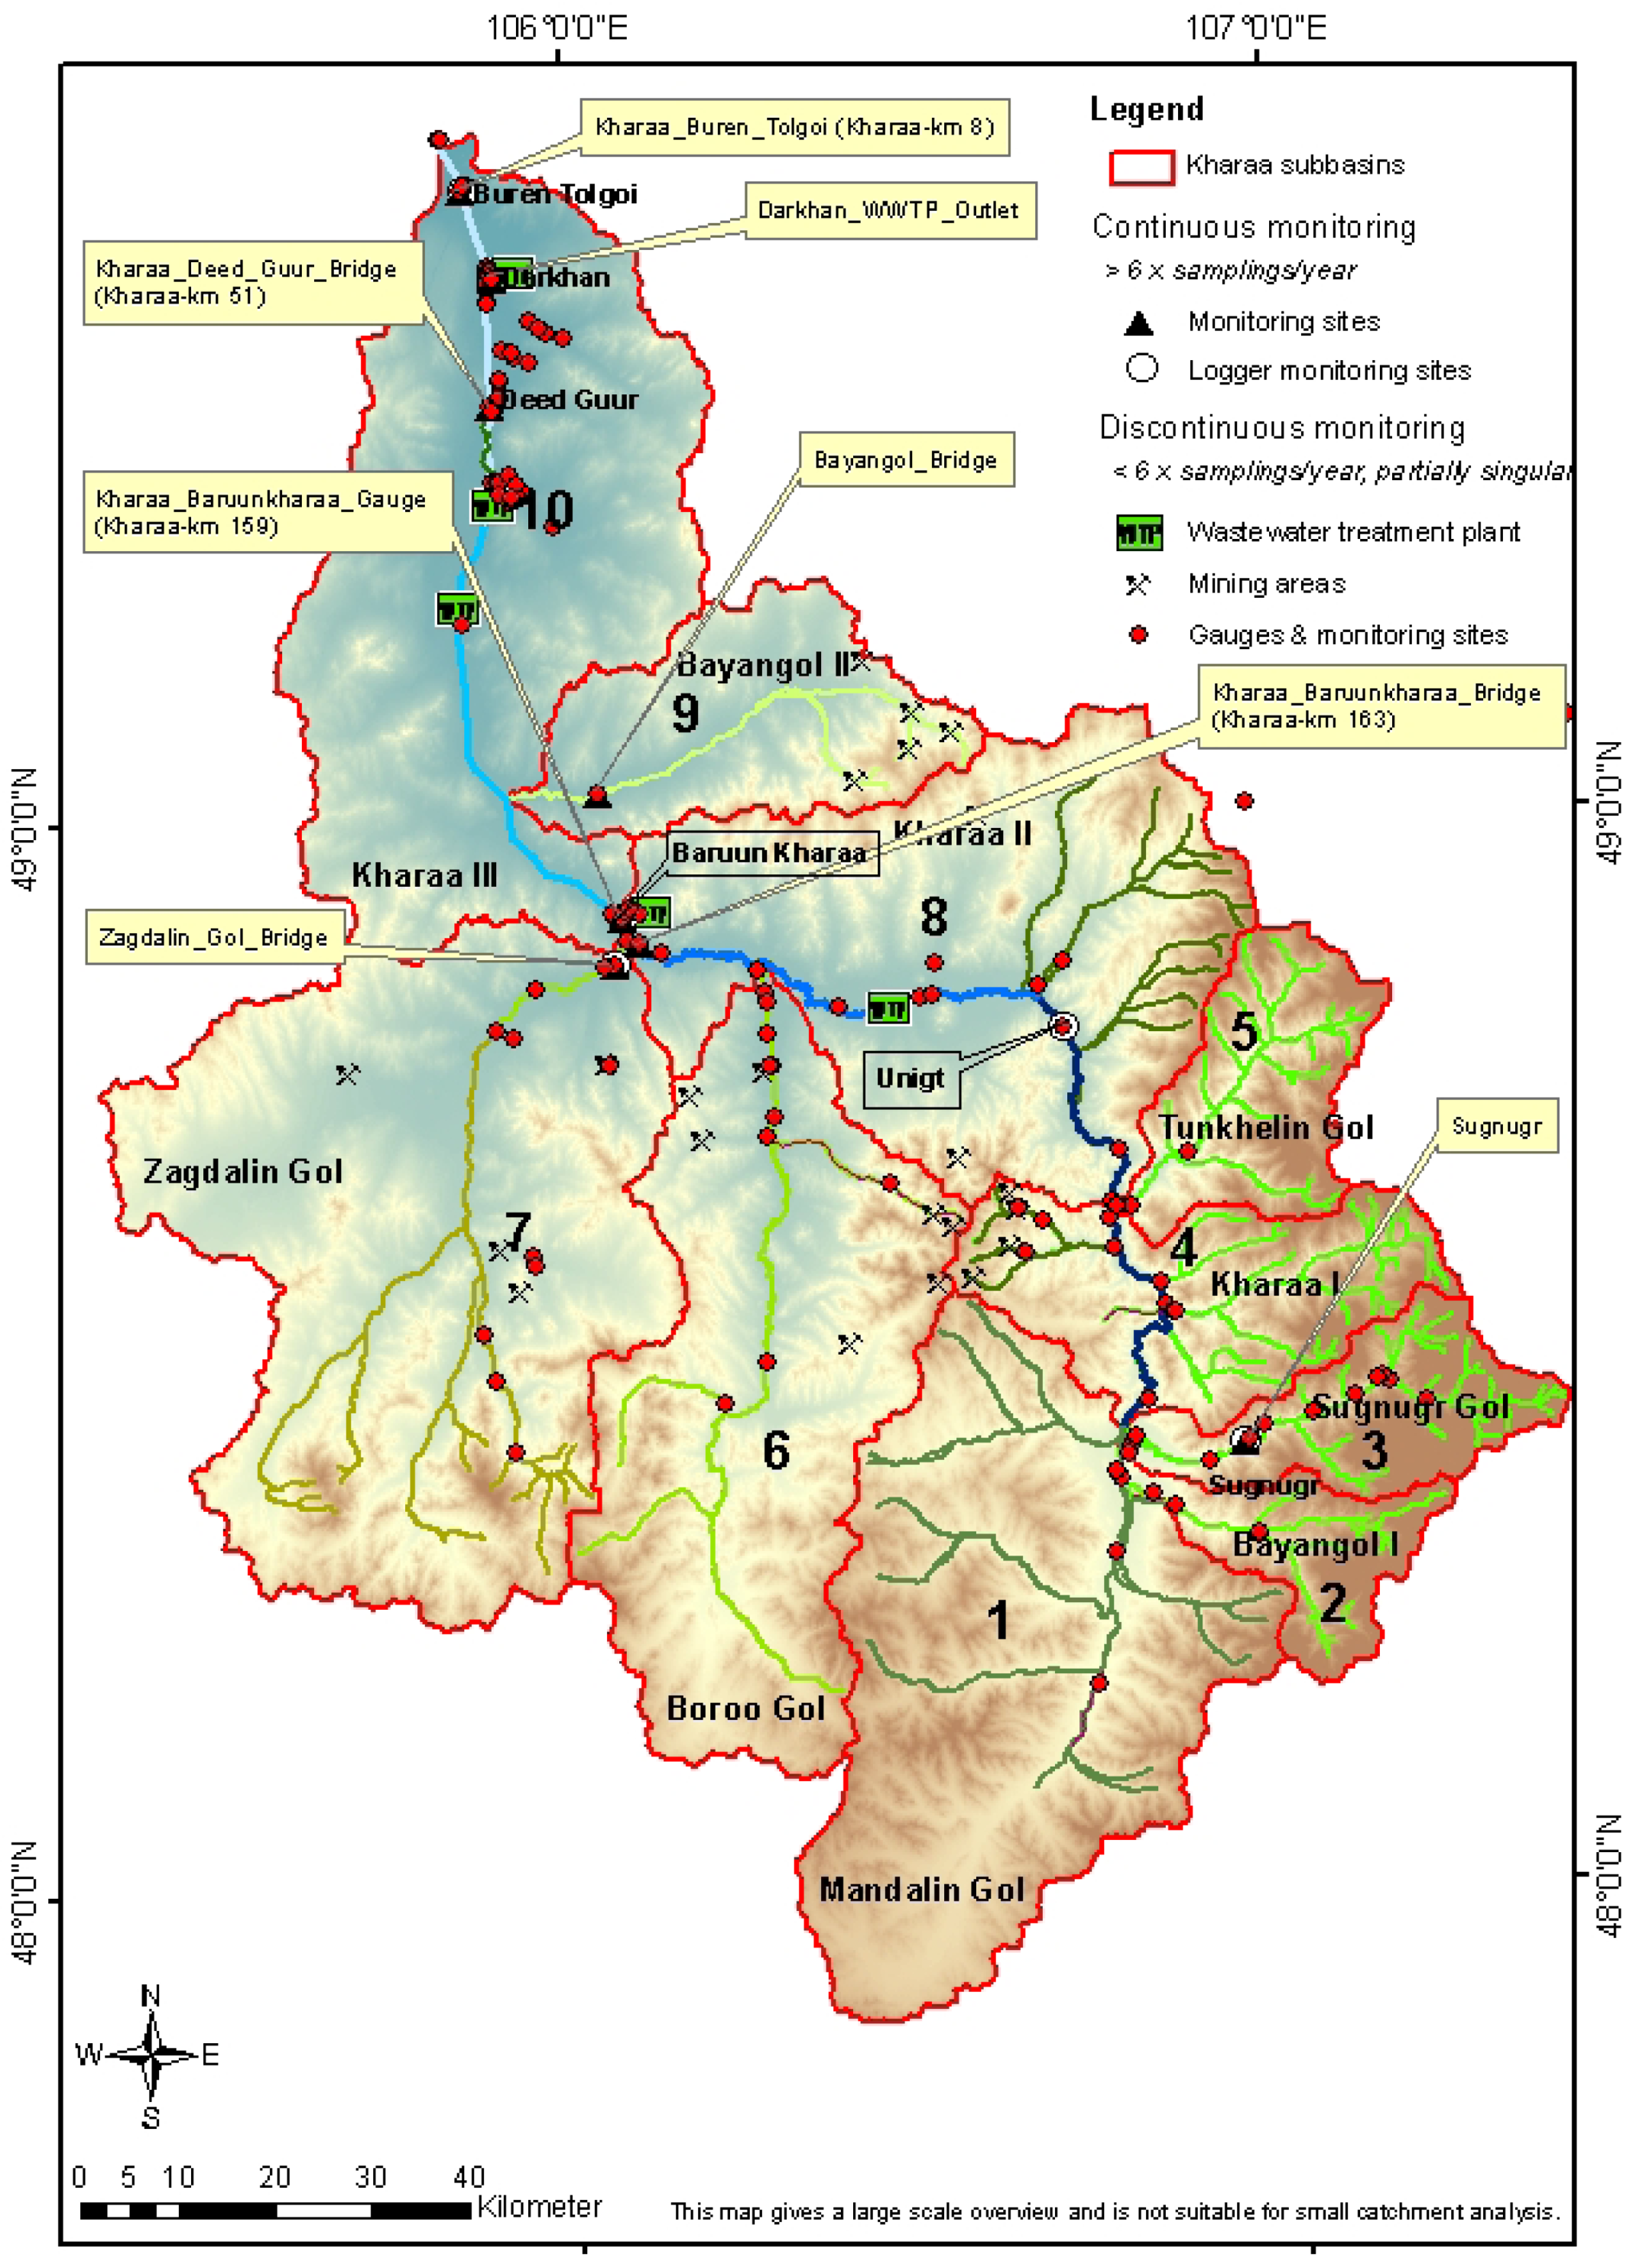
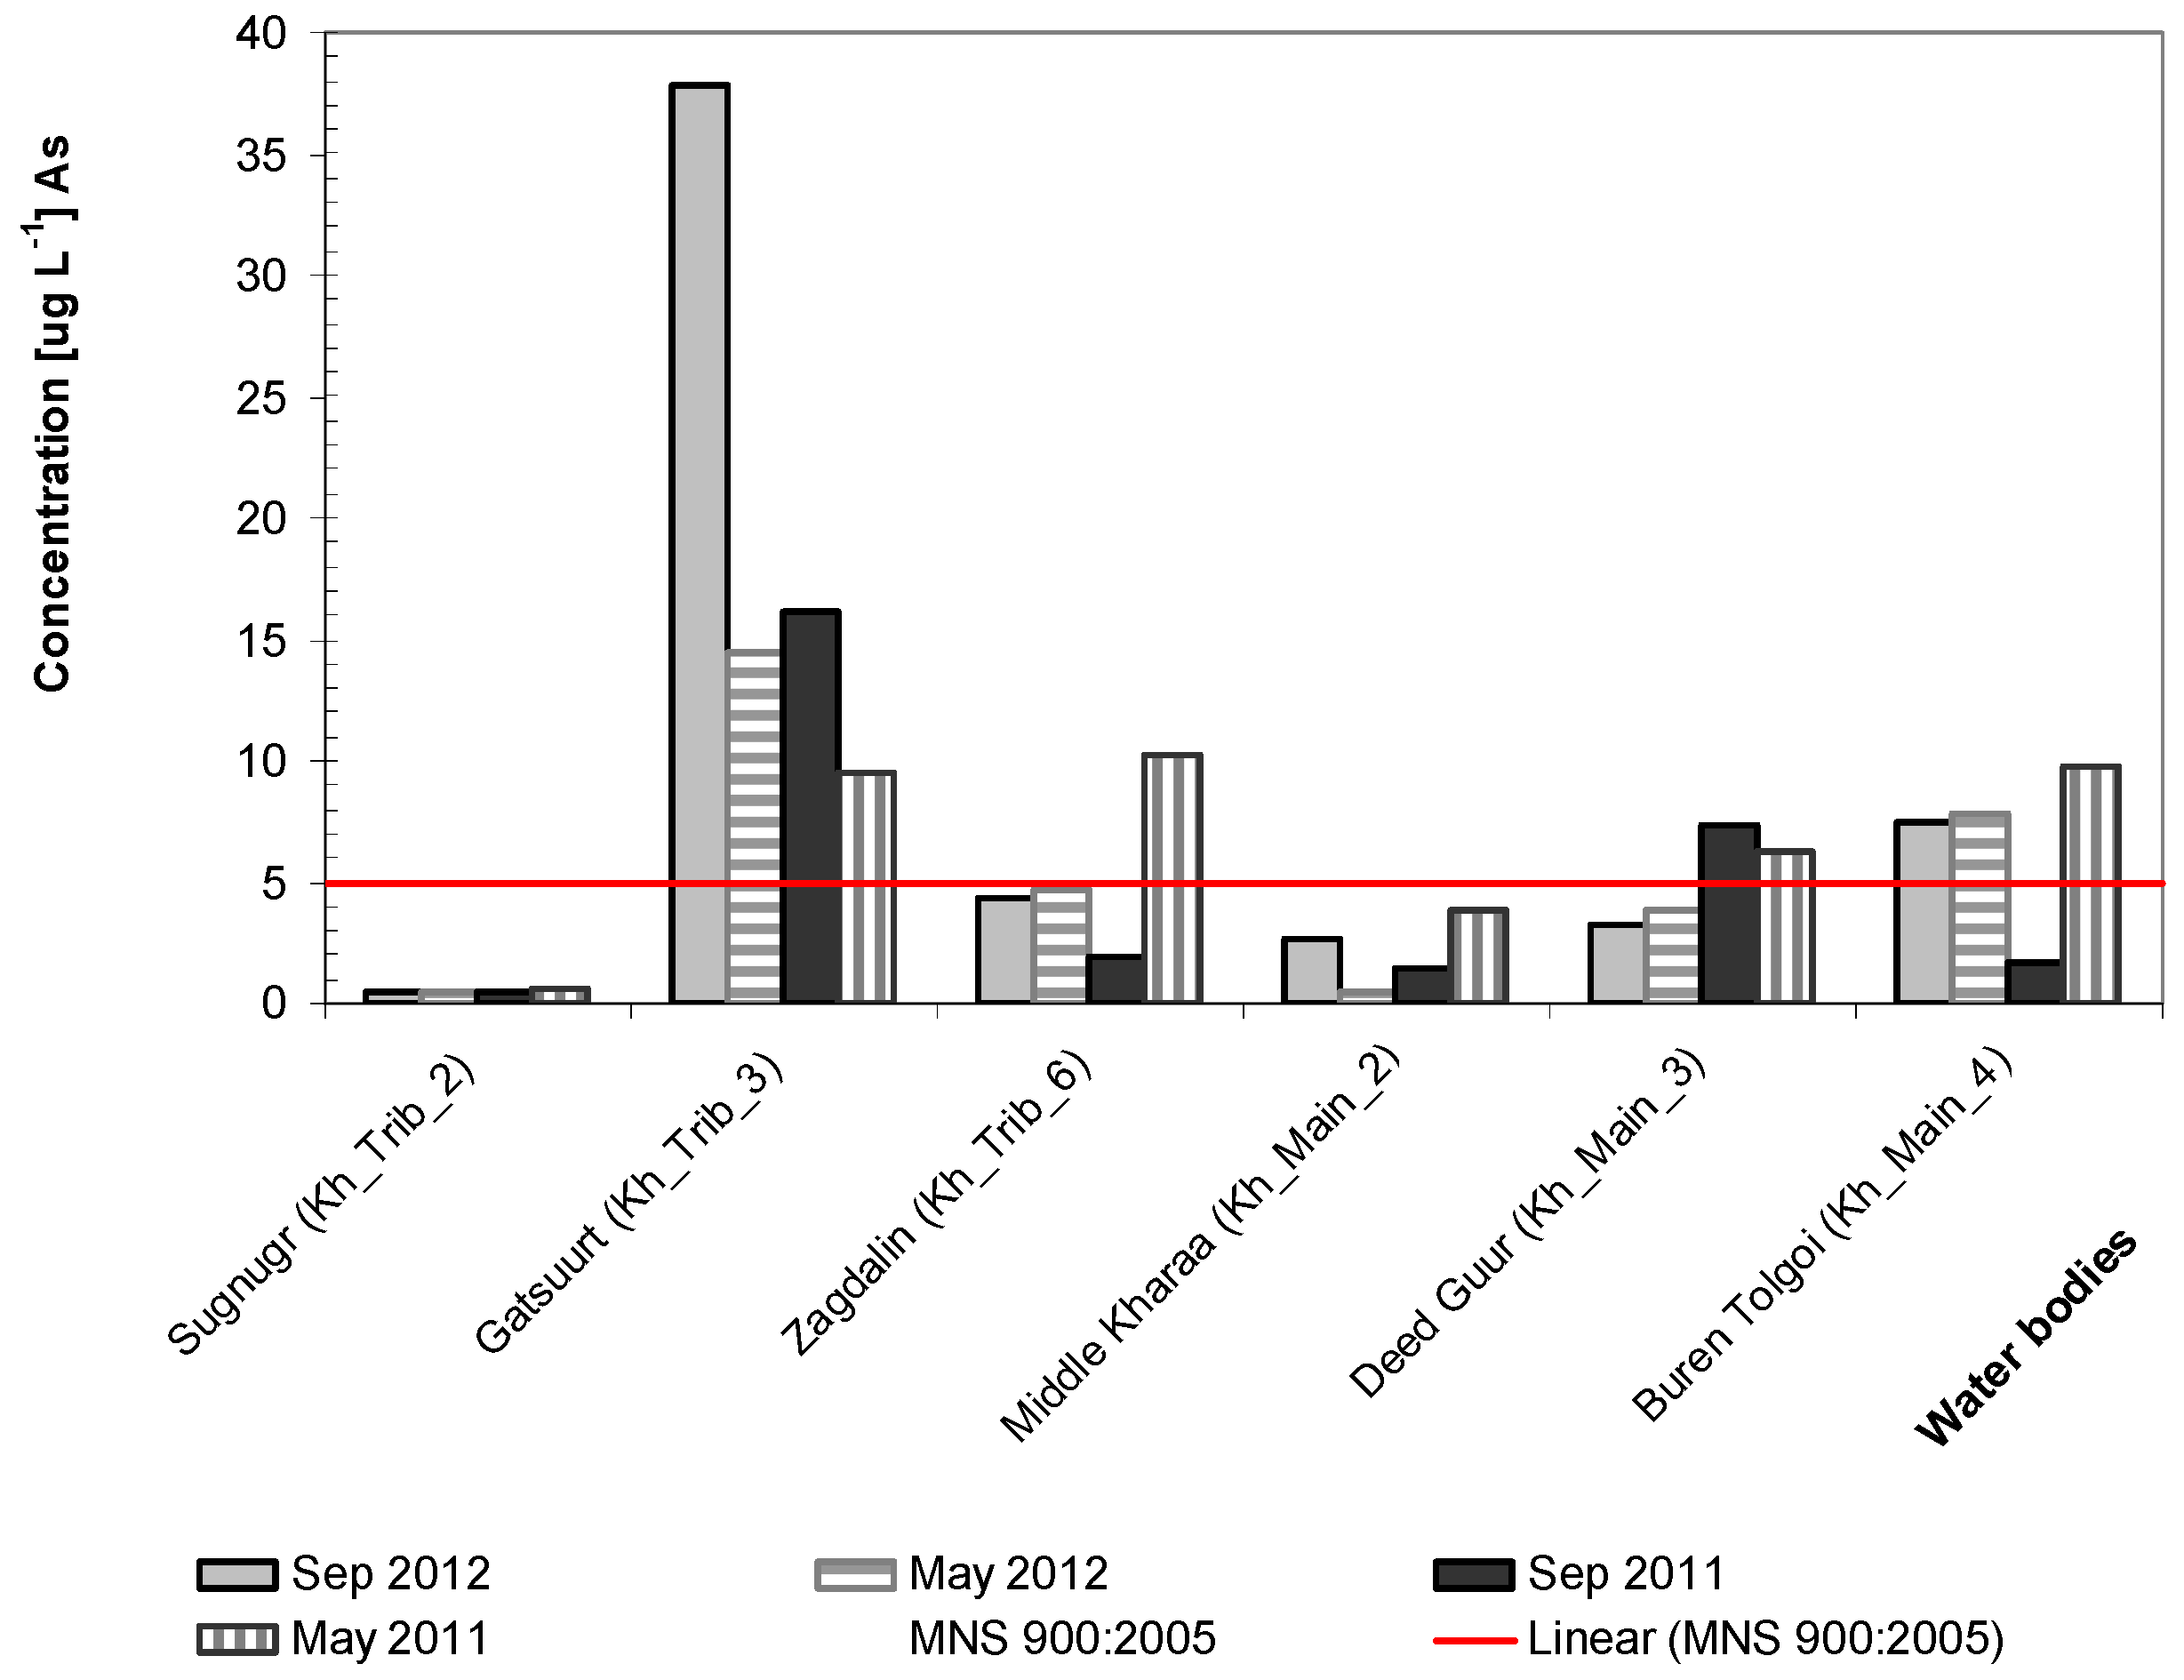
68]. Even though no impact on near-by surface waters was documented, elevated levels of heavy metals, particularly arsenic and mercury, were detected in mining ponds, the Kharaa River main channel, and its tributaries below the mining site. A longitudinal profile of arsenic concentrations in surface waters of the KRB clearly shows evidence of geogenic levels in the Khentii Mountains (including Sugnugr and Kh_Trib_2), as well as distinctly elevated concentrations downstream of gold mines, in the middle and lower reaches of the KRB (
Figure 5).
Moreover, elevated levels of arsenic were found in the ash basins of the thermal power plant adjacent to Darkhan city [
21,
26,
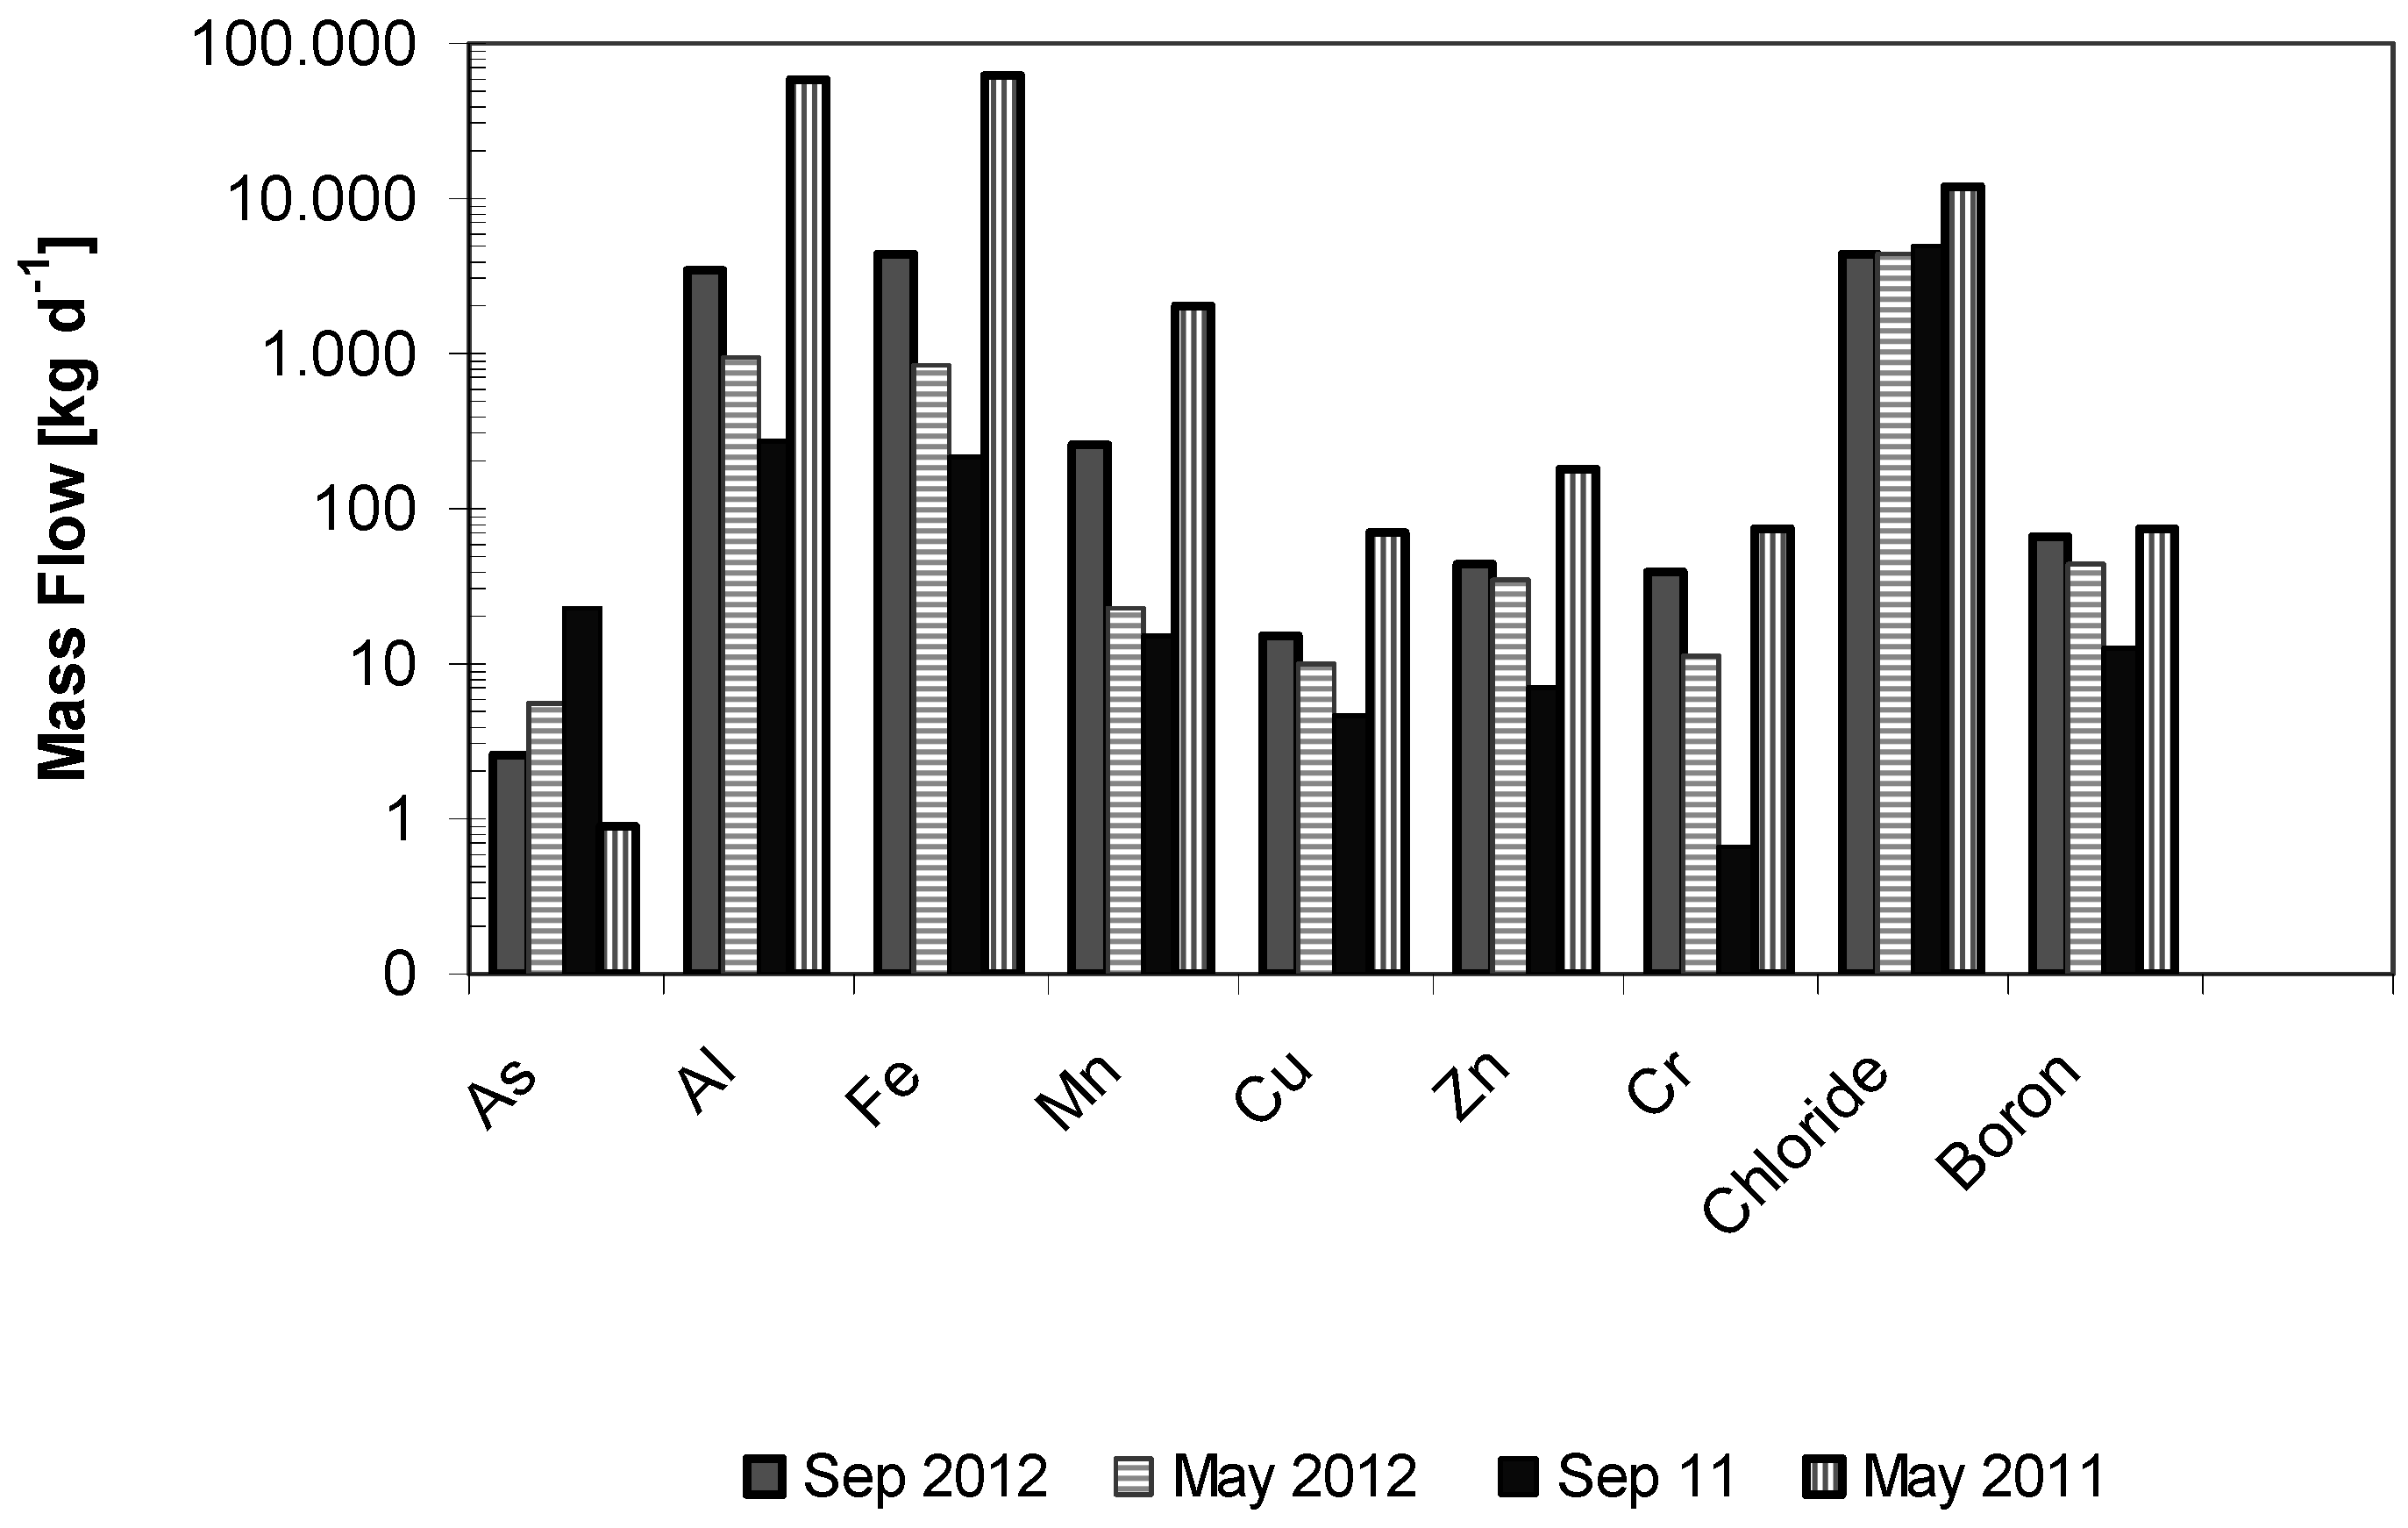
41]. Considering the relevant discharge data, the mass transport of toxic metals, metalloids, chloride and boron as pollution indicators was estimated at the outlet of the KRB (
Figure 6).
The high loads of Fe, Mn and Al associated with the geogenic background of the KRB, have likely resulted from the elevated levels of these elements occurring naturally in a large portion of the basins rocks. These elements have been released by natural weathering, and leaching processes due to the operation of chemical treatments in gold mines. As arsenic is commonly associated with gold-quartz veins, the leaching process often results in increased arsenic contamination of the surrounding environment.
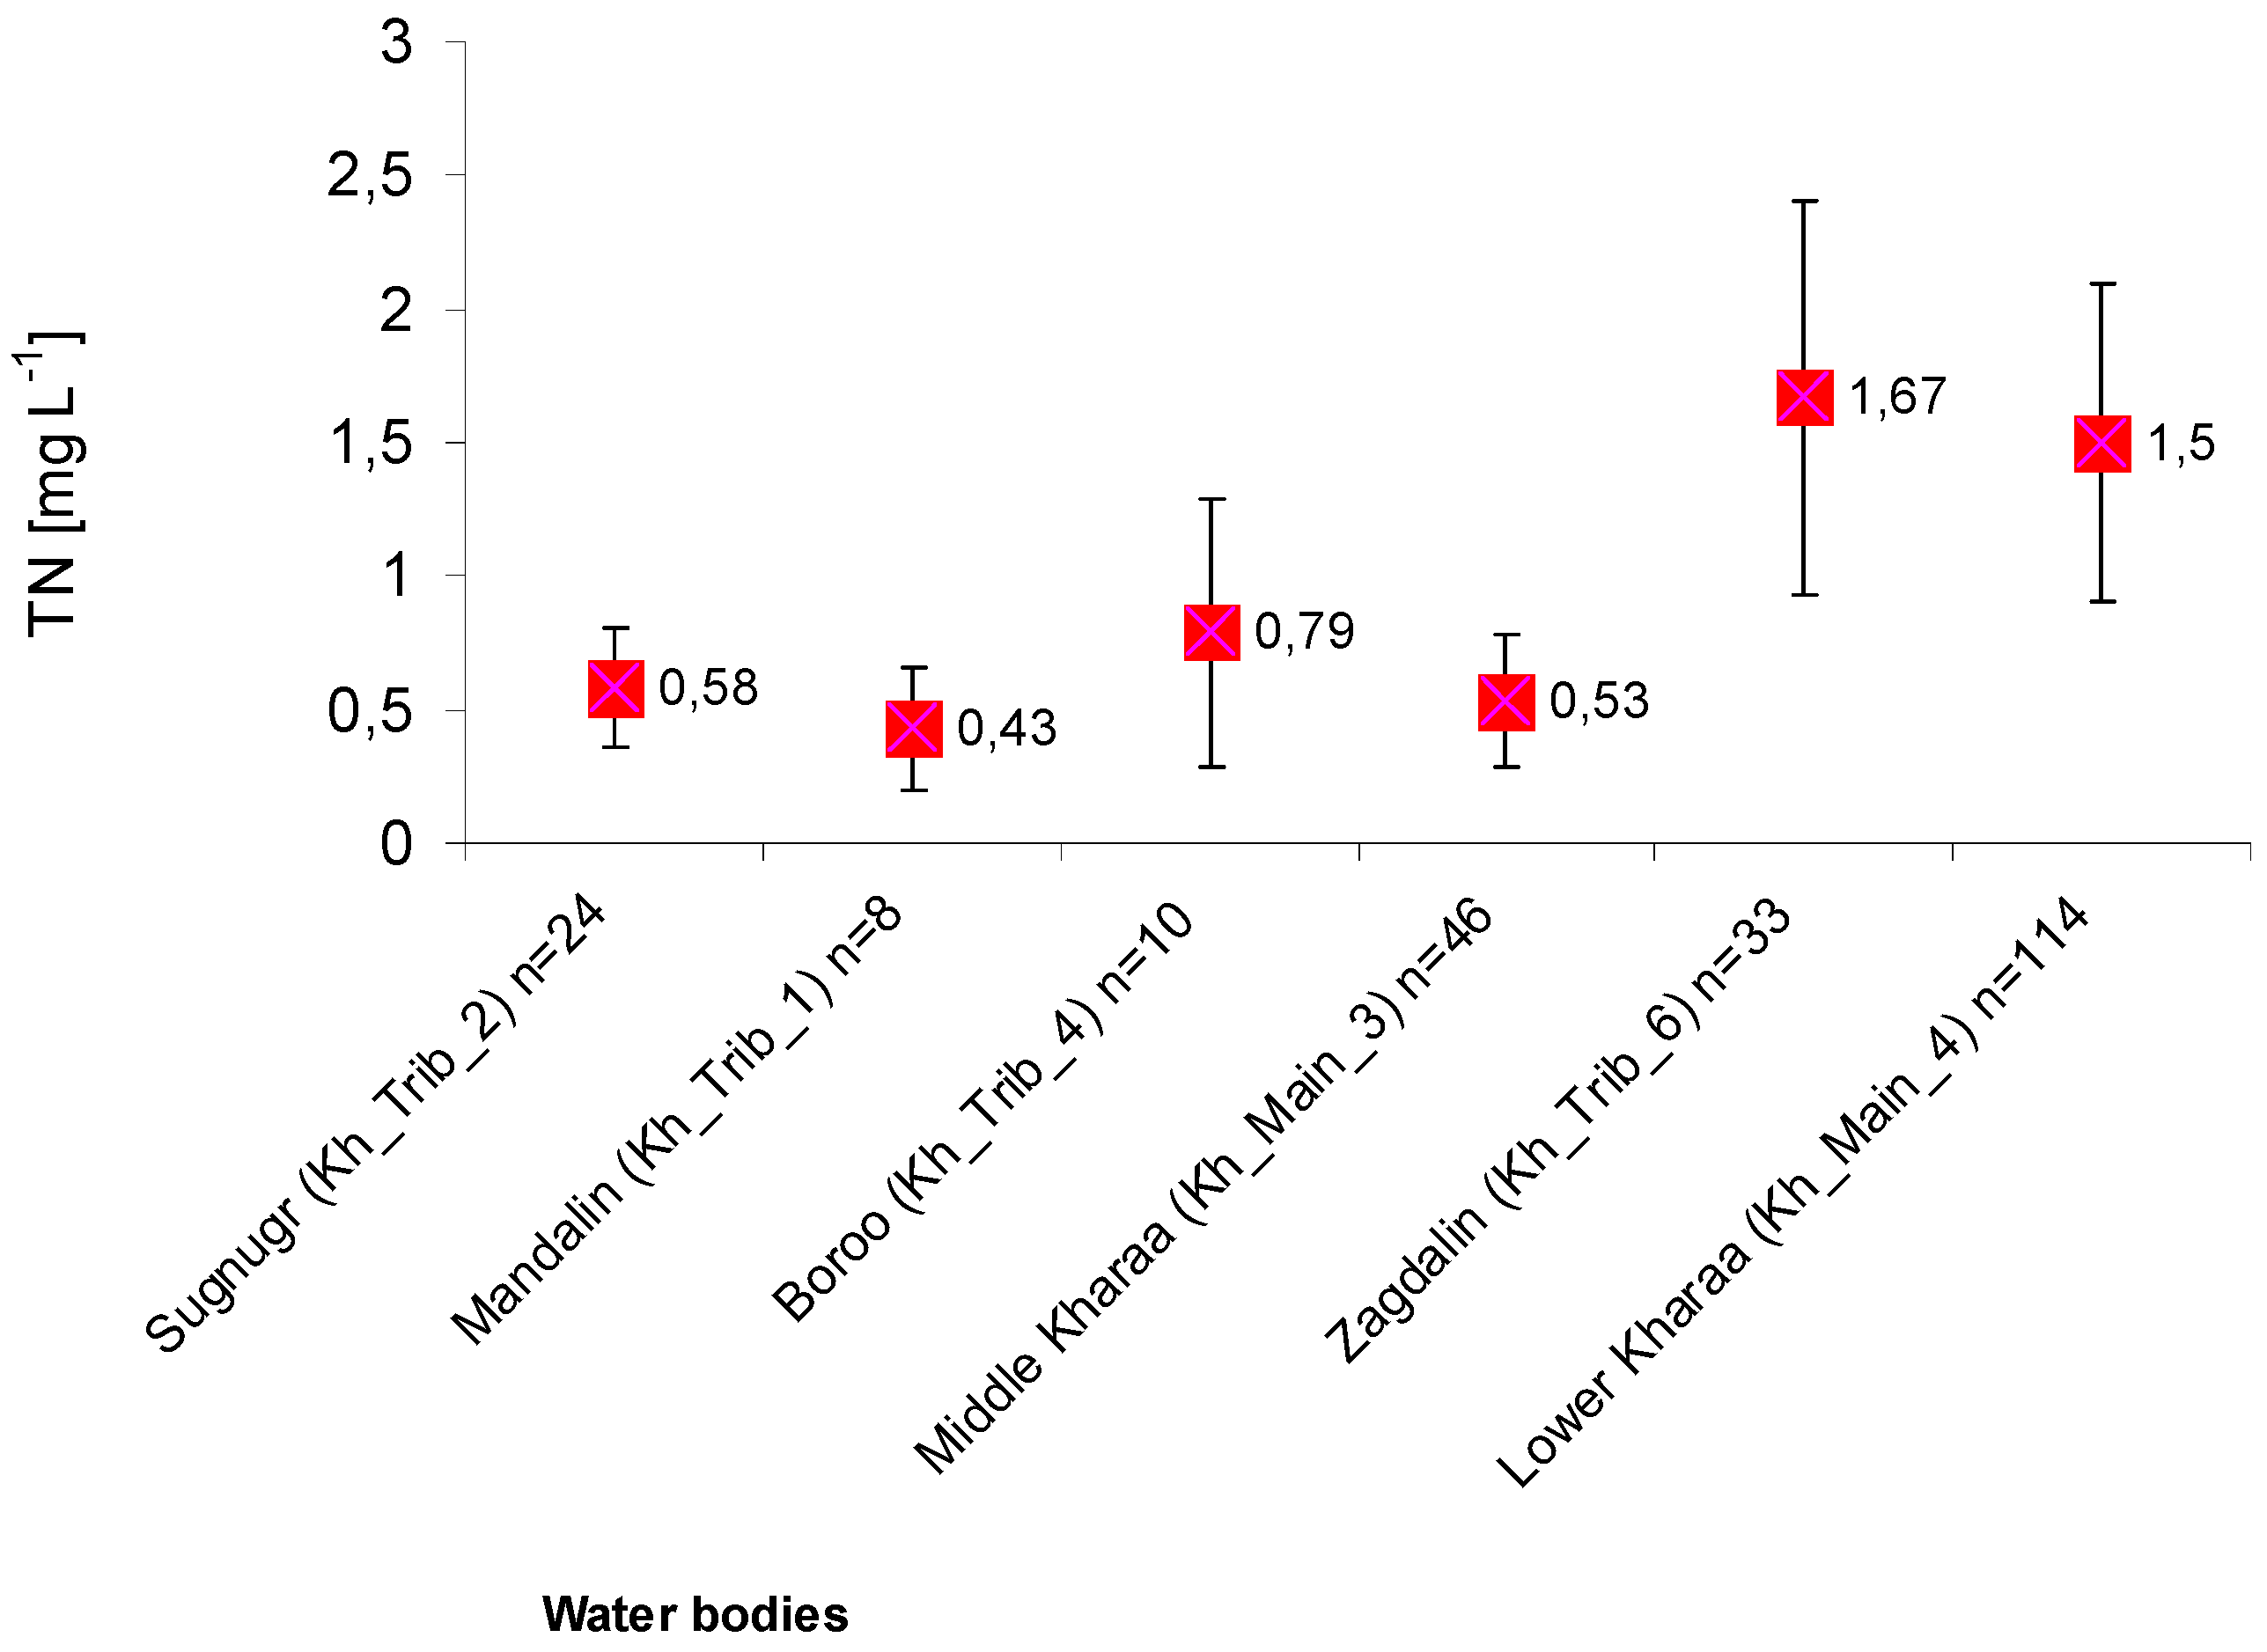
In regards to the nutrient concentrations in the surface waters, there was both a clear longitudinal gradient across the KRB and an increasing temporal trend identified. Nitrogen and phosphorus concentrations increased significantly along the course of the Kharaa River from 0.4 to 0.6 mg·L
−1 total N and 3 to 6 µg·L
−1 of total P in the headwaters to 0.7 to 0.9 mg·L
−1 total N and 54 to 154 µg·L
−1 total P, respectively at the basin outlet (for total nitrogen (TN) see
Figure 7). The highest concentrations were measured downstream of Darkhan’s central wastewater treatment plant [
15,
18,
21,
35] with 1.5 mg·L
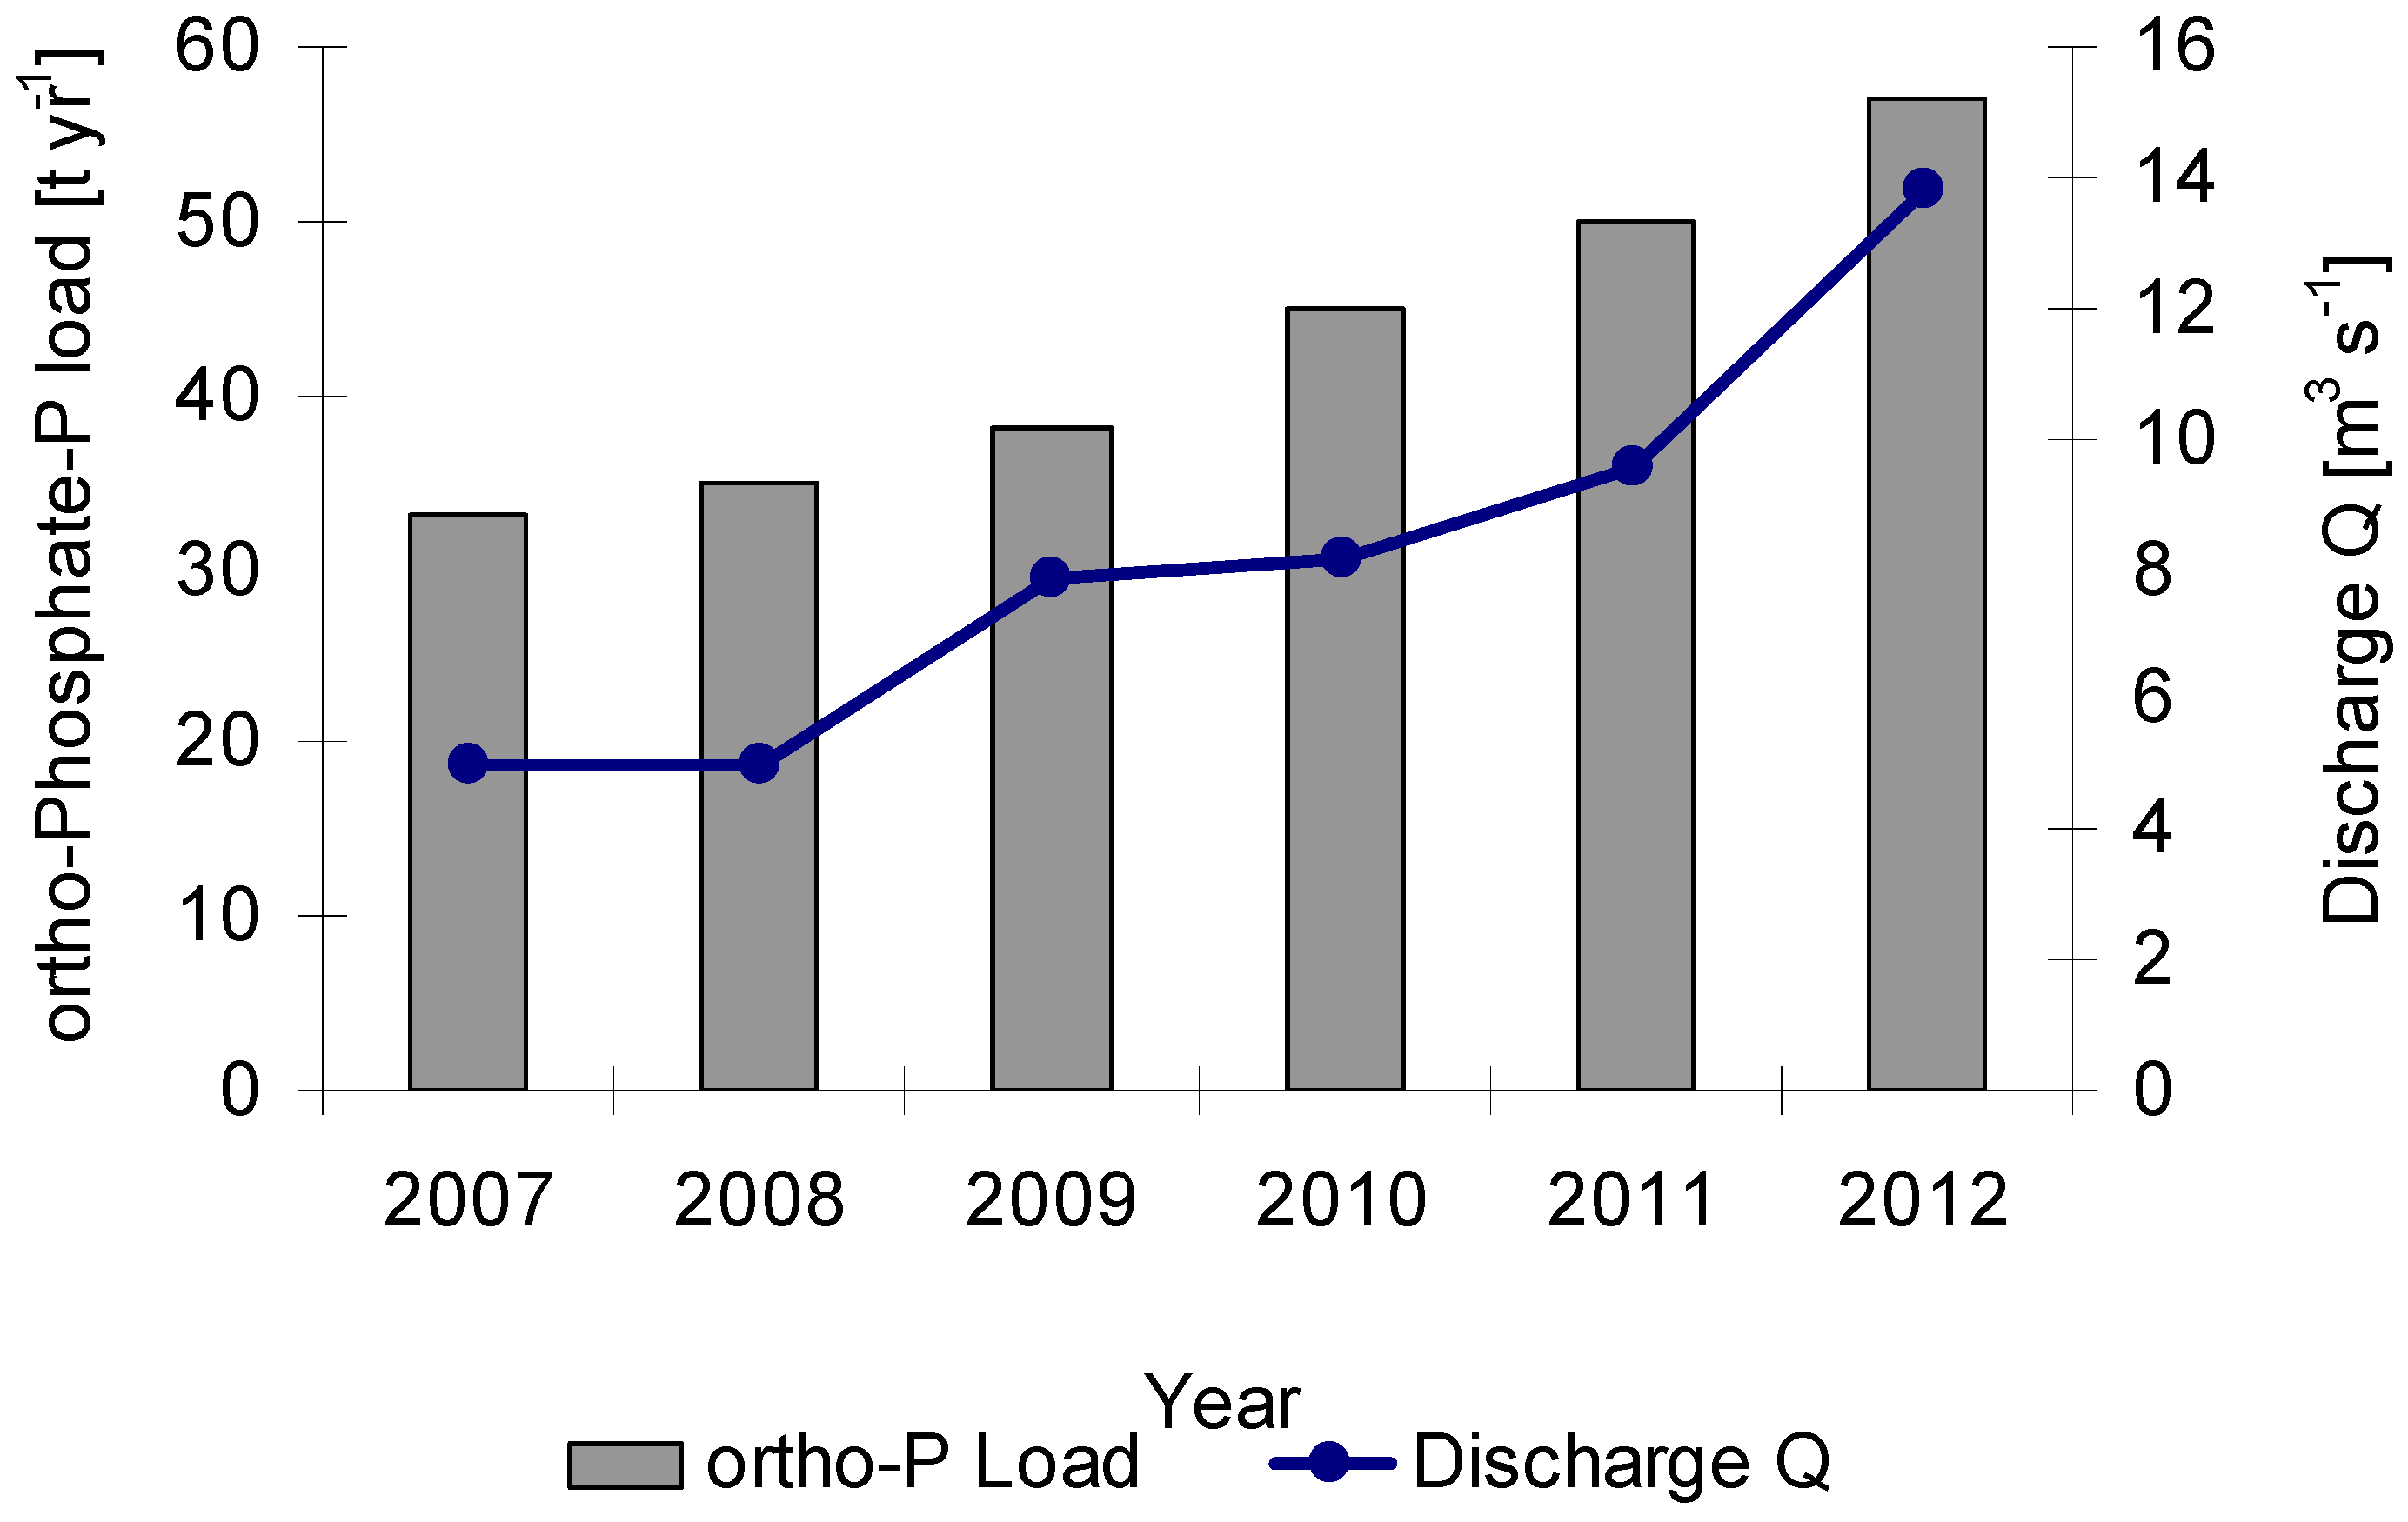
−1 total N. The loads of orthophosphate-P at the basin outlet (Buren Tolgoi gauge) were increasing between 2007 and 2012 from 33 to 57 t·yr
−1 due to increased emissions (
Figure 8).
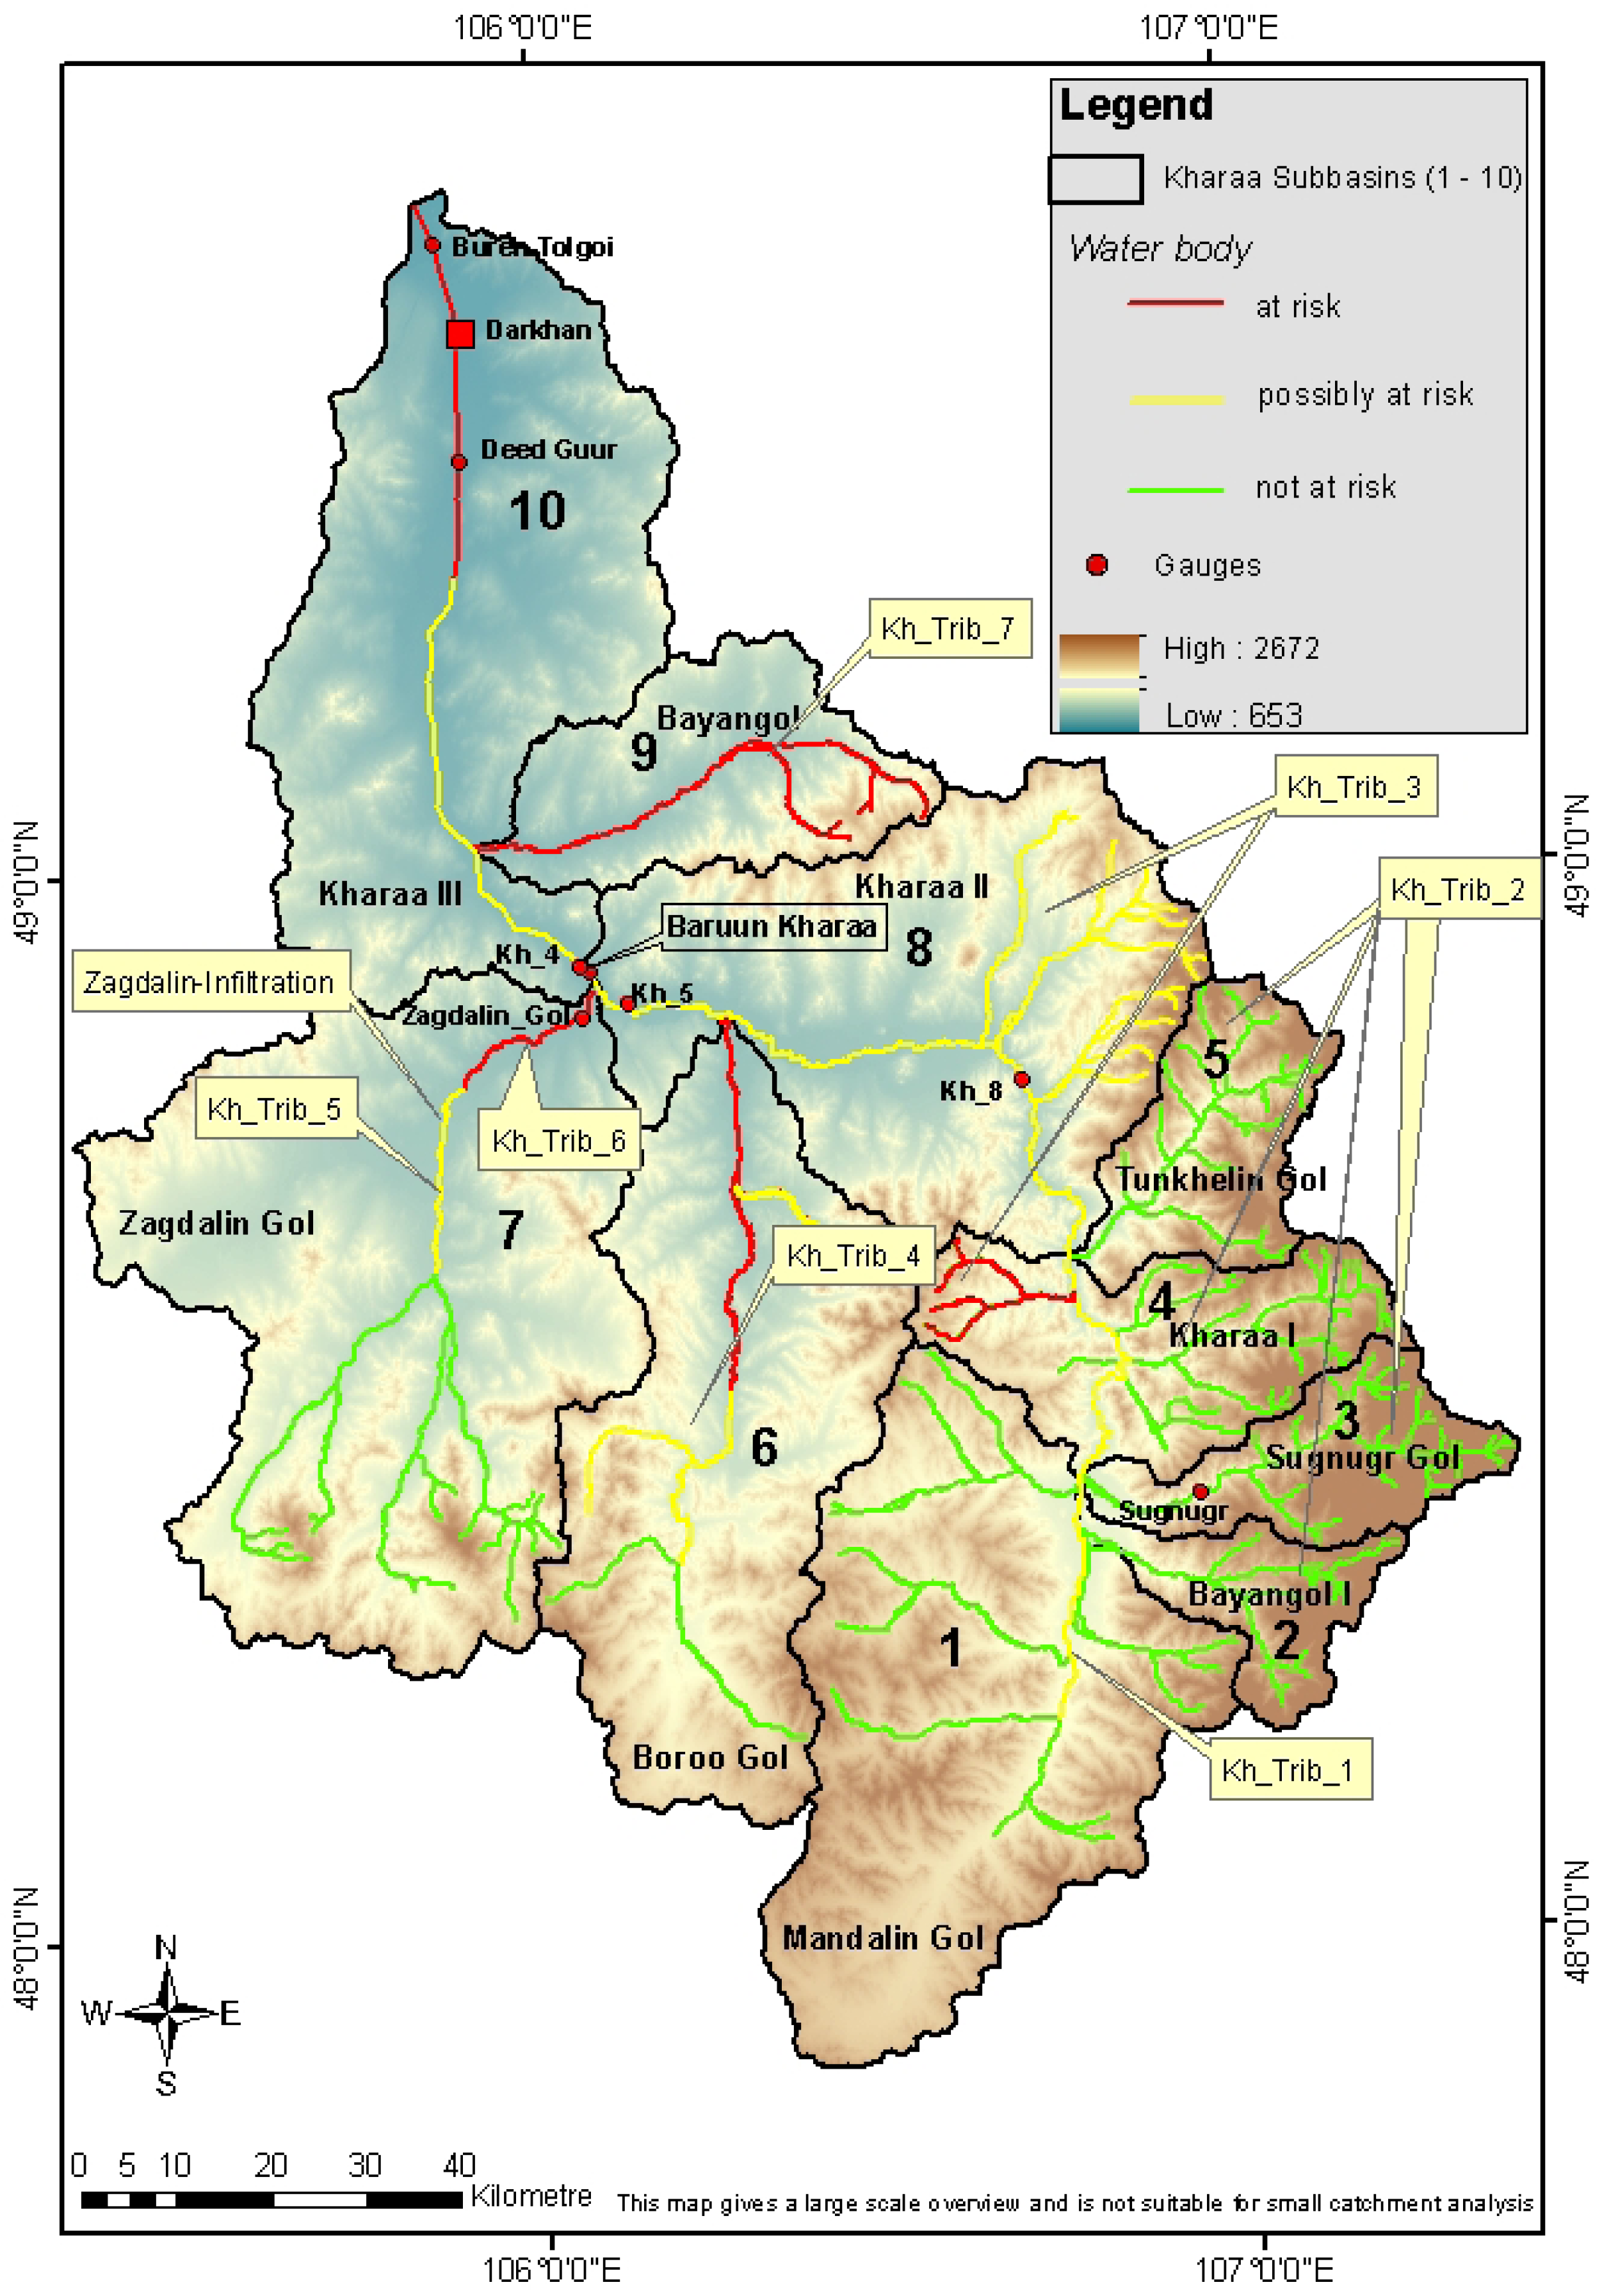
Figure 5.
Concentrations of arsenic (µg·L
−1) in a longitudinal profile from the Khentii Mountains. (Sugnugr Gol, natural reference conditions) to the river basin outlet at Buren Tolgoi based on four “snapshot” sampling campaigns of surface water in May and September 2011 and 2012 (21 May 2011, 06 September 2011, 18 May 2012, 9 September 2012). The allocation of sampling sites is indicated by the code number of the individual water bodies (
Table 5,
Figure 3). In comparison, the acceptable maximum content of arsenic according to the Mongolian drinking water quality standards (MNS (Mongolian National Standards) 900:2005) [
69] is given as a horizontal line (Monitoring data of MoMo project).
Figure 6.
Mass flows (kg·d
−1) of heavy metals, metalloids (As, Al, Fe, Mn, Cu, Zn, Cr) and pollution indicators (Chloride and Boron) at Buren Tolgoi close to the KRB outlet (Lower Kharaa Kh_Main_4, Sel_Kh10_001) based on four “snapshot” sampling campaigns in May and September 2011 and 2012 (21 May 2011, 06 September 2011, 18 May 2012, 9 September 2012). For exact locations of the water body and sampling site refer to
Figure 3,
Table 1 and
Table 5. (Monitoring data of MoMo project).
Figure 7.
Concentrations of total nitrogen (TN) (mg·L
−1) in a longitudinal profile from the Khentii Mountains (Sugnugr, Kh_Trib_2, natural reference conditions) to the KRB outlet (Kh_Main_4) between 2007 and 2012. For each water body the number of analyzed water samples is indicated (
n). For exact locations of the water body and sampling sites, see
Figure 3,
Table 1 and
Table 5. (Monitoring data of MoMo project).
Figure 8.
Loads of ortho-phosphate (t·yr
−1) at the KRB outlet (Lower Kharaa, Kh_Main_4, Sel_Kh10_001) for the monitoring period 2007 to 2012. The exact location of the water body and monitoring site Buren Tolgoi is given in
Figure 3,
Table 1 and
Table 5. (Monitoring data of MoMo project).
Figure 8.
Loads of ortho-phosphate (t·yr
−1) at the KRB outlet (Lower Kharaa, Kh_Main_4, Sel_Kh10_001) for the monitoring period 2007 to 2012. The exact location of the water body and monitoring site Buren Tolgoi is given in
Figure 3,
Table 1 and
Table 5. (Monitoring data of MoMo project).
The observed total nitrogen loads in the KRB illustrate a substantial increase from 240 to 470 t TN·yr
−1 indicating an increase of nutrients entering the river from diffuse sources [
18].
Modeling results of nutrient emissions confirmed urban settlements as the main source of nitrogen and phosphorus emissions, contributing 55% (nitrogen) and 52% (phosphorus) of the total emissions of each nutrient [
15]. As only 35% of the total population in the river basin is connected to a WWTP, unconnected urban areas represent a key proportion of the total emissions (38% of phosphorus and 25% of nitrogen emissions). In addition, the WWTP of Darkhan City with around 40,000 connected inhabitants was a substantial point source for nutrient influxes into the basin surface waters due to inefficient operations. According to additional modeling results, agriculture contributes 35% of total nitrogen and 32% of total phosphorus emissions [
21], mostly through erosion from cultivated land and fallows. Moreover, sediment input caused by river bank erosion is a significant emission pathway for phosphorus [
31,
42].
High loads of fine sediment do not only act as a carrier of nutrients, but also constitute a major stressor themselves as sediment-induced clogging inhibits essential habitat functions of the hyporheic zones [
31,
32,
70]. As a consequence, functional shifts of the macroinvertebrate community and fish fauna have already been observed [
15,
64]. Fine sediments are closely linked to the suspended transport of heavy metals, which is more extensive than the dissolved transport phase in the Selenge River basin [
24]. Isotope-based sediment source fingerprinting techniques identified riverbank erosion (74.5%) and surface upland erosion (21.7%) as the main contributors to the suspended fine sediment load (grain size <10 µm) in the catchment [
31,
42]. Considering that only 20% to 35% of the river bank contains riparian vegetation in the lower catchment, there is only a limited capacity to restrain eroded sediments from entering the streams. Hence, erosion abatement is considered being a major management challenge in the KRB [
35]. In the future, erosion could potentially increase more than twofold in the steppe regions of the lower KRB and up to sevenfold in the forested and mountainous regions of the upper KRB due to the combined impacts of land-use and climate change [
71].
3.4. Water Quality and Ecological Assessment of Surface Water Bodies
The previously described water quality assessment applied in Mongolia, was based on a comparison of monitoring data for chemical substances, physical parameters and MNS (4586) [
69,
72,
73]. The derived surface water quality index (WQI) is defined as a simple expression of a more or less complex combination of several parameters (e.g., NO
3–N, or TP), which serves as a measure for water quality [
74]. This method is used to assess the ecological state of surface waters in Mongolia, which is then classified into six classes, ranging from “very good” (WQI < 0.3) to extremely polluted (WQI > 6.0). However, considering the maximum tolerable concentrations of chemical substances in MNS 4586 [
72] are not derived from sound biological assessments, in relation to the impact of a given concentration to the ecological situation in a water body (e.g., TP concentration
vs. Chlorophyll a concentration as expression of phytoplankton biomass), these concentrations describe more or less the threshold with an increased risk of impact to human health for a given exposure time.
Following the philosophy of the EC-WFD [
50], it was proposed to identify reference conditions for undisturbed aquatic ecosystems which should be used to set standards for restoration goals. Thus a reference system with its concentration of chemical substances, its ecological state and the resulting ecological potential, represents a scientifically sound basis for the assessment of the water quality status. Impacted water bodies can then be described by
n-fold increases of natural background conditions (except for pH and oxygen). In addition, the data logger measurements of pH- and oxygen amplitudes can be used as qualitative indication of eutrophication signals. The characterization of natural reference conditions was based on the Refcond Guidance [
55,
56] where the natural physical-chemical reference conditions of water bodies have been described with different anthropogenic indicators. These conditions were identified in the water body Kh_Trib_2 (Khentii Reference), thus representing the natural background conditions of nutrients and pollution indicators (chloride, boron and electrical conductivity;
Table 7).
Table 7.
Physico-chemical reference natural background conditions for the waterbody Kh_Trib_2 (Khentii reference) in comparison to the maximum tolerable concentrations of the Mongolian National Standards (MNS 900:2005, MNS 4586:1998) [
69,
72].
Table 7.
Physico-chemical reference natural background conditions for the waterbody Kh_Trib_2 (Khentii reference) in comparison to the maximum tolerable concentrations of the Mongolian National Standards (MNS 900:2005, MNS 4586:1998) [69,72].
| Parameter | Mongolian Drinking Water Quality Standard MNS 900:2005 | Mongolian Water Quality Standard MNS 4586:1998 | Reference Conditions (Absence of Geogenic/Anthropogenic Pollution |
|---|
| | | | Arithmetic Mean | Standard Deviation |
| Electrical conductivity (µS·cm−1) | n.i. | n.i. | 49 | 10 |
| Oxygen, dissolved (%) | n.i. | 90 | 100 | 10 |
| Oxygen (mg·L−1) | n.i. | >9 | 10.5 | 2.9 |
| pH | n.i. | 6.5–8.0 | 7 | 0.4 |
| Boron (µg·L−1) | 500 | n.i. | 10 | 12 |
| Chloride (mg·L−1) | 350 | <50 | 2 | 0.5 |
| TP (µg·L−1) | n.i. | <25 | 11 | 10 |
| SRP (µg·L−1) | n.i. | <20 | 5 | 1 |
| TN (mg·L−1) | n.i. | <0.3 | 0.58 | 0.22 |
| NH4–N (mg·L−1) | 1.5 | <0.02 | 0.02 | 0.01 |
| NO3–N (mg·L−1) | 1 | <1 | 0.3 | 0.2 |
| As (µg·L−1) | 10 | n.d. | 1.8 | 1 |
| Hg (µg·L−1) | 0.5 | n.d. | n.d. | n.d. |
While the natural reference concentrations for chloride (2 mg·L
−1 Cl) and boron (10 µg·L
−1 B) (
n = 25 for Cl and B) in upstream water body group Kh_Trib_2 (Khentii reference) were close to or below the analytical detection range, the anthropogenic altered concentrations in the downstream water bodies Kh_Main_1 to Kh_Main_4 exceeded the natural background by a factor of 4 (boron 38 µg·L
−1) and 6 (chloride 12 mg·L
−1) [
68].
The comparison of the three data logger stations clearly shows a gradient from the upstream regions to the middle and lower reaches in the KRB (
Table 8,
Supplementary Material S.2.).
The water level measurements from the three monitoring stations along the Kharaa River (
Supplementary Material S.2., Figure S1a) exhibited a natural flooding regime including flood pulses and broadened flood peaks in the downstream direction (Sugnugr >> Baruunkharaa >> Buren Tolgoi). The gauging stations clearly reflected the increased intensity in rainfall events during the spring and summer periods resulting in prolonged flooding events during the summer months in the downstream regions (Buren Tolgoi).
Table 8.
Physical and chemical measurements (mean ± SD) of the automatic water quality monitoring stations at Sugnugr (Khentii reference Kh_Trib_2), Baruunkharaa (Middle/Lower Kharaa. Kh_Main_3) and Buren Tolgoi (Lower Kharaa. Kh_Main_4) for the vegetation period (May to October) in 2012. For allocation of primary code ID of stations see
Table 1.
Table 8.
Physical and chemical measurements (mean ± SD) of the automatic water quality monitoring stations at Sugnugr (Khentii reference Kh_Trib_2), Baruunkharaa (Middle/Lower Kharaa. Kh_Main_3) and Buren Tolgoi (Lower Kharaa. Kh_Main_4) for the vegetation period (May to October) in 2012. For allocation of primary code ID of stations see Table 1.
| Station Primary Code ID | Sugnugr Sel_Kh03_009 | Baruunkhaara Sel_Kh10_012 | Buren Tolgoi Sel_Kh10_001 |
|---|
| Temperature (°C) | 7.1 ± 3.9 | 12.9 ± 5.3 | 14.8 ± 6.2 |
| Conductivity (µS·cm−1) | 41.7 ± 6.6 | 250.8 ± 63.6 | 250.3 ± 63.6 |
| pH | 7.19 ± 0.26 | 8.1 ± 0.2 | 8.36 ± 0.12 |
| Oxygen saturation (%) * | 99.8 ± 3.1 | 95.0 ± 9.5 | 98.6 ± 4.7 * |
| Oxygen concentration (mg·L−1) * | 10.6 ± 1.2 | 9.3 ± 1.4 | 8.9 ± 1.1 * |
The water temperature regime of the Kharaa River was recorded during the ice free period and was predominantly shaped by strong seasonal and diurnal temperature fluctuations caused by the continental climatic conditions (
Supplementary Material S.2., Figure S1b). The increased temperature at the middle and downstream stations of Baruunkharaa and Buren Tolgoi, in comparison to the upstream station (Sugnugr), was most likely caused by lower flow velocities during the summer months where increased channel width and low shading effects triggered by fragmentary riparian vegetation in these reaches increased the water temperature.
The electrical conductivity (EC) recorded in the upper region of the Kharaa River was very low, mostly below 50 µS·cm−1, which further highlights the pristine water quality conditions of the upper basin (
Supplementary Material S.2., Figure S1c). The EC measurements were elevated in the middle basin at Baruunkharaa station where the associated flood events caused fine sediments to be (re-) mobilized from river substrate and river banks. On the contrary, EC measurements at the lower monitoring station were decreasing during flooding events, which may be interpreted as a simple dilution effect due to more stable river morphology in this downstream area.
Considering the dependency of dissolved oxygen on water temperature, lower oxygen concentrations in the middle and the downstream regions of the KRB were expected (
Supplementary Material S.2., Figure S2a). However, an increased oxygen saturation in the mid catchment station, and to a lesser extent at the downstream station, especially under low flow situations, may indicate a potentially enhanced eutrophication risk in these areas, as an increase in photosynthesis and primary production is evident (
Supplementary Material S.2., Figure S2b).
In the present study, a human health perspective involving the investigation of faecal indicators and its bacteriological status were not included in the monitoring schemes. The pivotal question for the future will be whether these parameters provide essential and additional information about the river’s status and its quality.
Stream biological quality indicators including the benthic invertebrate community and fish fauna investigations suggested a “good” ecological status for most river stretches in the Kharaa River basin (
Table 9 and
Table 10). Nevertheless, the structural and functional metrics of the benthic invertebrate community indicated negative impacts in certain parts of the catchment, especially in the middle reaches of the Kharaa River main channel (water bodies Kh_Main_2 und Kh_Main_3,
Figure 4), but also in certain tributaries (water bodies Kh_Trib_1, Kh_Trib_4 und Kh_Trib_6, see
Table 9).
Table 9.
The ecological assessment of the Kharaa River, using the benthic invertebrate community. The table shows ecological quality metrics on a five step scale with 1 being “very good” and 5 being “bad” (EQ = Ecological quality. E = Ephemeroptera = mayflies. P = Plecoptera = stoneflies. T = Trichoptera = caddisflies).
| Water Body/Sampling Site | EQ of Site | EQ of Water Body | Total Number of Species | Number of P | Number of E | Shannon Diversity Index | Share of EPT Individuals | Share of Fine Sediment Colonizers |
|---|
| Kharaa River main course |
| Kh_Main_1 | | 2 | |
| Kh_8.5 | 2 | | 1 | 2 | 2 | 2 | 1 | 2 |
| Kh_8.3 | 2 | 1 | 2 | 3 | 1 | 1 | 2 |
| Kh_8 | 2 | 1 | 1 | 2 | 2 | 1 | 2 |
| Kh_Main_2 | 3 | |
| Kh_7 | 2 | | 2 | 1 | 2 | 2 | 2 | 2 |
| Kh_6 | 3 | | 2 | 3 | 2 | 2 | 3 | 3 |
| Kh_5 | 2 | | 2 | 2 | 2 | 3 | 3 | 2 |
| Kh_4 | 3 | | 2 | 2 | 3 | 3 | 2 | 2 |
| Kh_3.5 | 3 | | 3 | 3 | 2 | 2 | 2 | 3 |
| Kh_Main_3 | 3 | |
| Kh_3 | 3 | | 3 | | 3 | 4 | 4 | 2 |
| Kh_Main_4 | 3 | |
| Kh_2 | 3 | | 3 | | 3 | 3 | 3 | 1 |
| Kh_1 | 2 | 3 | | 3 | 2 | 1 | 2 |
| Kharaa River tributaries |
| Kh_Trib_1 | 3 | |
| Mand_1 | 3 | | 2 | 5 | 4 | 3 | 5 | 1 |
| Mand_2 | 3 | | 1 | 4 | 3 | 3 | 5 | 1 |
| Kh_Trib_2 | 2 | |
| Sug_2 | 2 | | 1 | 1 | 3 | 2 | 3 | 2 |
| Sug_1 | 2 | | 2 | 1 | 3 | 2 | 3 | 2 |
| Baya_1 | 2 | | 1 | 2 | 3 | 1 | 1 | 1 |
| Tun_1 | 2 | | 2 | 1 | 3 | 2 | 2 | 2 |
| Kh_Trib_3 | 2 | |
| Shiv_1 | 2 | | 1 | 3 | 3 | 1 | 1 | 1 |
| Kh_Trib_4 | 3 | |
| Bor_0.5 | 3 | | 1 | 4 | 4 | 3 | 5 | 1 |
| Kh_Trib_5 | | |
| Zagdalin upstream | no data | | | | | | |
| Kh_Trib_6 | 4 | |
| Zag_1 | 4 | | 3 | 5 | 5 | 3 | 4 | 2 |
| Kh_Trib_7 | | |
| Bayangol2 | no data | | | | | | |
Table 10.
The ecological assessment of fish fauna along sample sites in the KRB. The table shows the ecological quality metrics on a five step scale with 5 being “very good” and 1 being “bad”. Note that the evaluation scale (5–1) of
Table 10 are inverted compared to the evaluation scale (1–5) of
Table 9 due to the applied FIBS tool [
59] (“species and ecological guilds” = occurrence of river type specific species, accompanying species, migratory species, habitat guilds, reproductive guilds and trophic guilds; “abundances and ecological guilds” = relative abundance of dominant species, relative abundances of perch/roach, distribution of ecological guilds; “age structure” = relative share of 0+ species).
Table 10.
The ecological assessment of fish fauna along sample sites in the KRB. The table shows the ecological quality metrics on a five step scale with 5 being “very good” and 1 being “bad”. Note that the evaluation scale (5–1) of Table 10 are inverted compared to the evaluation scale (1–5) of Table 9 due to the applied FIBS tool [59] (“species and ecological guilds” = occurrence of river type specific species, accompanying species, migratory species, habitat guilds, reproductive guilds and trophic guilds; “abundances and ecological guilds” = relative abundance of dominant species, relative abundances of perch/roach, distribution of ecological guilds; “age structure” = relative share of 0+ species).
| Water Body/Sampling Site | EQ of Site | EQ of Water Body | Species and Ecological Guilds | Abundances and Ecological Guilds | Age Structure | Migratory Index | Fish Region | Community Dominance Index |
|---|
| Kharaa River main course |
| Kh_Main_1 | 3 | |
| Kh_8.5 | 3.13 | | 2.67 | 2.67 | 4.2 | 3 | 5 | 1 |
| Kh_8 | 2.65 | | 2 | 2.33 | 4.6 | 1 | 3 | 1 |
| Kh_Main_2 | 3 | |
| Kh_7 | 3.13 | | 2.33 | 3 | 4.2 | 1 | 5 | 3 |
| Kh_6 | 2.84 | | 3 | 1.83 | 4.2 | 1 | 5 | 1 |
| Kh_5 | 2.93 | | 3.1 | 2.5 | 3 | 2 | 5 | 2 |
| Kh_4 | 3.02 | | 3 | 2.91 | 3.2 | 2 | 5 | 2 |
| Kh_Main_3 | 2 | |
| Kh_3 | 2.15 | | 2.67 | 2.6 | 1.67 | 1 | 3 | 1 |
| Kh_Main_4 | 3 | |
| Kh_2 | 3.40 | | 3.67 | 2.6 | 5 | 1 | 3 | 3 |
| Kh_1 | 2.81 | | 3 | 2.5 | 3.33 | 3 | 4 | 1 |
| Kharaa River tributaries |
| Kh_Trib_1 | 2 | |
| Mand_1 | 3.06 | | 4 | 1.91 | 4 | 1 | 5 | 1 |
| Mand_2 | 2.30 | | 2.33 | 1.55 | 3 | 1 | 5 | 1 |
| Kh_Trib_2 | 3 | |
| Sug_2 | 2.66 | | 3 | 1.8 | 1.5 | 5 | 5 | 3 |
| Sug_1 | 3.31 | 3.84 | 2.5 | 3.5 | 3 | 5 | 2 |
| Baya_1 | 2.91 | 3.5 | 1.8 | 4 | 1 | 5 | 1 |
| Tun_1 | 4.02 | 3.67 | 3.4 | 4 | 5 | 5 | 5 |
| Kh_Trib_3 | 3 | |
| Shiv_1 | 2.72 | | 2.67 | 1.55 | 3 | 5 | 5 | 1 |
| Kh_Trib_4 | 3 | |
| Bor_0.5 | 3.55 | | 3.67 | 3.55 | 4 | 1 | 5 | 3 |
| Kh_Trib_5 | | |
| Zagdalin upstream | no data | | | | | | |
| Kh_Trib_6 | 3 | |
| Zag_1 | 3.31 | | 4 | 2.09 | 3.5 | 1 | 5 | 5 |
| Kh_Trib_7 | | |
| Bayangol2 | no data | | | | | | |
The vertical exchange of water between the river and hyporheic zone was measured by Hartwig [
31,
32], who found evidence for the physical clogging of the river bed in some stretches of the Kharaa River downstream from the confluence with the Zagdalin River. The physical clogging of the river bed may reduce habitat quality for benthic invertebrate species having life stages that are associated with the hyporheic zone as well as for gravel spawning fish. Analyses of the river fish fauna composition illustrated a reduced number of those species that are targeted or regularly caught by resident fishers. The taimen (
Hucho taimen), an endangered salmonid, is once such species, which is all but locally extinct in the basin and is continually facing rapid population declines across all Mongolia due to increased poaching activities. Additionally, a relative reduction of larger individuals of several fish species (e.g.,
B. lenok and
T. baicalensis) was also identified (see
Table 10).
In order to successfully maintain healthy fish stocks throughout the KRB, better compliance and stricter enforcement of Mongolia’s existing fishing regulations is vital. It is essential that illegal fishers are detected and prosecuted for their use of prohibited and damaging fishing gear (e.g., nets, dynamite, or triple hooks), for fishing during spring spawning closed seasons (1st of April until the 15th of June every year), and for the intentional killing of protected species. In addition, further enhancements to the fishing legislation such as minimum sizes and total take limits should also be introduced to mitigate overfishing practices and better protect these threatened fish communities and the ecological health of the river for the future. A recent survey among fishers in the KRB conducted in 2012, highlighted the fact that many local fishers could not identify fish species correctly nor were many aware of the existing regulations (Andrew Kaus, unpublished data 2012). Therefore, widespread educational campaigns and capacity development activities are urgently required to improve fisher knowledge, understanding and compliance in the Kharaa River basin.
The ecological quality of surface waters in the upstream reaches of the KRB (water body Kh_Main_1), as indicated by benthic invertebrate assessments, was classified as “very good” or “good” between 2006 and 2011. Benthic invertebrate communities were highly diverse and represented a more or less natural reference condition. The fish-based assessment using FIBS also indicated a “good” ecological condition between 2006 and 2012, denoting an un-impacted and healthy river. Human activities in these regions only moderately affected fish species richness, relative abundances and diversity of fish species.
In the middle reaches of the Kharaa River (water body Kh_Main_2) a “good” to “moderate” ecological status was determined from the assessment of benthic invertebrates, with deficits identified in the structural composition of the community especially in the lower sections. The fish community composition in the mid Kharaa River catchment indicated in general a “good ecological status” for the years 2006 to 2012. Some minor deficits were identified with regards to species abundance and the distribution of age classes and indicator indices. These deficits were attributed to increased fishing pressure in the region over recent decades. Furthermore, the assessment shifted from “good” to “moderate” between 2006 and 2012.
The middle and lower reaches of the Kharaa River (water body Kh_Main_3) were assessed in 2006 and 2007 at a single location, with structural and functional deficits in the benthic invertebrate communities identified, which in turn resulted in a “moderate” ecological status classification. The assessment of resident fish communities also suggested a “moderate” ecological status, although with similar deficits as described for water body Kh_Main_2. However, it must be noted that only one sampling site could be analyzed for this section of the river.
The lower reaches of the Kharaa River (water body Kh_Main_4), from close to the city of Darkhan until the confluence with the Orkhon River were assessed as being at a “good” or “moderate” ecological status. Some minor effects on ecological quality downstream from Darkhan were identified, but 20 km further downstream, close to the hydrological measuring station “Buren Tolgoi”, these deficits were no longer observed. The unknown reference conditions for this stream type (Mid-sized and large lowland rivers dominated by sand and loam) impeded the ecological assessment which therefore was based on the creation of a reference biocoenosis with expert knowledge. The fish-based assessment indicated a “good” ecological status with some minor deficits in species abundance and the distribution of ecological guilds. The total density of individual fish was relatively low in the Kharaa River lower reaches, which may have been caused by increased fishing pressure in the region, but is also likely due to the relatively low species diversity in this river section.
The tributaries in the southernmost part of the catchment (Mandalin Gol, water body Kh_Trib_1), are characterized by a gradually declination, ground slope (around 2 per mill) with pasture farming close to the rivers. The ecological quality as indicated from macroinvertebrate assessment, during 2006/2007, was “moderate” to “poor”. By contrast, fish assemblages indicated a “moderate” ecological quality with deficits in abundance and guild distributions.
The tributaries originating in the Khentii Mountains (water bodies Kh_Trib_2) were identified as being in a natural reference state with regards to benthic invertebrates, and could be classified from 2006 to 2011 as “very good” to “good” with some seasonal variability. The fish community surveys also indicated a “very good” to “good” ecological quality of these river sections, although showed some minor restraints in age and abundance structures, as the number of species caught were slightly reduced.
Tributaries representing lower mountainous streams originating in the forelands (Shivertin Gol, water bodies Kh_Trib_3), showed a “good” ecological status based on both benthic invertebrates and fish surveys. The small stream Gatsuurtin Gol was not assessed during the sampling period.
The initial assessment of the Boroo Gol (water body Kh_Trib_4) indicated a “moderate” ecological status, with the number of EPT species strongly reduced in the benthic invertebrate samples. An increased share of potamophilous and lotic species was identified, which may have been caused by an altered hydrological regime. Additionally, green filamentous and blue-green algae were observed during the samplings, also indicating altered hydrology and increased nutrient concentrations. Nonetheless, the fish fauna assessment indicated a “good” ecological status in the Boroo River.
The lower reaches of the Zagdalin River sub-catchment (water body Kh_Trib_6), a major tributary of the Kharaa River, was assessed as being in a “moderate” or “poor” ecological status. A considerable reduction in the number of EPT species was determined, with the total number of species and individuals being also relatively low resulting in a low biodiversity index (
Table 10). In contrast to these findings, the fish fauna showed only minor ecological deficits with regard to species richness and in the structure and abundances of ecological guilds.
In the water bodies of the upper Zagdalin Gol sections, (water body Kh_Trib_5) and Bayangol II (water body Kh_Trib_7), there was no ecological assessment performed.
3.6. Stressor Complexes and Need for Action at the River Basin Level
Environmental changes that cause certain responses in a system of interest (e.g., an ecosystem) can be described as a stressor [
76]. Direct stressors can represent the immediate cause of an effect (e.g., oxygen depletion causing suffocation of fish), while indirect stressors are preceding factors, in a causal pathway conditioning an effect (e.g., river bank erosion-causing clogging of the hyporheic zone- in turn creating a response in the invertebrate community). After incorporating and evaluating all available data concerning the KRB, eight thematic stressor complexes for the water management sector were identified:
- -
Insufficient provisions of safe drinking water and hygienic sanitation in ger populations (low income, peripheral settlements consisting of traditional Mongolian felt tents (ger) and/or simple, detached houses) [
77];
- -
Deficient water supply and wastewater disposal systems for rural settlements [
77];
- -
Degradation of hydrological processes in the Khentii Mountains, that are essential for the recharge of surface and groundwater resources of the entire basin [
17,
34,
35];
- -
Unregulated mining activities impacting the quality and quantity of the already scarce surface water resources [
26,
40,
41];
- -
Erosion of the cleared and structurally fragile river banks and the resulting high fine-grained sediment loads that are inhibiting habitat functions on the river substrate [
31,
32].
In general, the density of the monitoring network in the KRB for biological and chemical water quality indicators is not very high and in some regions completely lacking, so that a comprehensive assessment and stressor identification is often not possible.
Prioritizing actions is necessary in order to secure ecosystem services and sustainable utilization of water resources in the KRB. The nexus of deficits, causes and countermeasures as well as the identified stressor complexes provide an essential overview (
Supplementary Material S.4., Tables S12 and S13). The need for protection of environmental assets can be ranked as follows:
- (i)
The first critical measure must involve the conservation of the KRB’s “water towers”, which includes all tributaries originating from the Khentii mountains, (especially water body group Kh_Trib_2) in order to safeguard the current amount of surface water quantity [
17,
78] and quality [
15]. In addition, the mountainous water courses represent important places of reproduction, feeding and refuge for the aquatic fauna. Thus, these areas must be exempted from any exploitation, especially from mining, deforestation, overgrazing and overfishing.
- (ii)
The regeneration of river riparian zones must be fostered by eliminating/reducing the major pressures (e.g., livestock herding). Protecting non-degraded, remnant river riparian zones as well as areas with a high potential of self-regeneration should have the highest priority [
32].
- (iii)
The infiltration of untreated wastewater into groundwater which is then extracted for domestic self-supply in the river riparian zones must be first identified and subsequently measures implemented to abate this practice. The installation of adapted semi-central wastewater collection and treatment technologies in combination with timber production is one option that would minimize the pressure on riparian vegetation [
77].
- (iv)
Measures must be taken to avoid contamination from mining operations, while at the same time implementing rehabilitation measures of insecure tailing basins, such as the ash deposition sites of the thermal power plant in Darkhan.
With respect to water quality, the most relevant problems include erosion and the subsequent high fine sediment loads, the poor state of wastewater infrastructures, and the emission of toxic substances related to mining and industrial activities (
Supplementary Material S.4.). Grazing pressure due to large numbers of livestock contributes to the destabilization of riverbanks, thus promoting their erosion and the influx of high fine sediment loads. Strategies to prevent river bank erosion therefore must include viable alternatives for animal grazing such as the installation of protected buffer strips and the provision of alternative drinking water sources for animals [
31]. Moreover, land management practices which are better suited to the semi-arid steppe environment (e.g., mulching of croplands with wheat straw), if employed in the future could additionally help to reduce soil erosion [
71].
With regard to the emission of toxic substances, a stricter enforcement of existing environmental legislation is crucial. In the recent past, water governance in Mongolia was characterized by unclear and/or overlapping competences of a wide range of institutions, limited budgets for environmental monitoring and implementing of conservation measures, as well as a lack of water experts, especially in rural areas. However, there have been substantial reforms in recent years, including the promotion of IWRM/RBM as the national strategy for sustainable management [
79,
80,
81,
82,
83,
84,
85]. In the KRB, water contamination by heavy metals is typically linked to either gold mining or industrial activities including power generation. While mining activities have become more regulated in the past few years (including provisions to ban mining within 50 m from river banks), there is still a lack of emission control. Moreover, long lasting legacies of past emissions have led to the contamination of sediments from where toxic substances remain and continue to be released. For the KRB, unlike many other river basins of Mongolia, these hot spots of environmental contamination are documented [
15,
18,
21], allowing for a more systematic surveillance and planning of rehabilitation measures. A summary of the recommended measures is given in
Supplementary Material S.5., Tables S14 to S23.


