Article

Biomonitoring of Epilobium hirsutum L. Health Status to Assess Water Ecotoxicity in Constructed Wetlands Treating Mixtures of Contaminants

by
Anna Guittonny-Philippe
1,2,
Véronique Masotti
1,*,
Jacques Rabier
1,
Marie-Eléonore Petit
1,
Laure Malleret
3,
Bruno Coulomb
3 and
Isabelle Laffont-Schwob
1
1
Institut Méditerranéen de Biodiversité et d'Ecologie marine et continentale (IMBE), Aix Marseille Université, CNRS, IRD, Avignon Université, Case 4, 3, place Victor Hugo, F-13331 Marseille cedex 03, France
2
ECO-MED SARL, Tour Méditerranée, 65 Avenue Jules Cantini, 13298 Marseille Cedex 20, France
3
Laboratoire de Chimie de l'Environnement, Aix Marseille Université, CNRS, FRE 3416, 3 place Victor Hugo—Case 29, F-13331 Marseille Cedex 3, France
*
Author to whom correspondence should be addressed.
Water 2015, 7(2), 697-715; https://doi.org/10.3390/w7020697
Submission received: 25 September 2014 / Accepted: 29 January 2015 / Published: 10 February 2015
(This article belongs to the Special Issue Water Quality Control and Management)

Abstract

:
For the treatment of wastewater containing organic pollutants and metals in constructed wetlands (CWs), phytoindicators may help in guiding management practices for plants and optimizing phytoremediation processes. Hairy willow-herb (Epilobium hirsutum L.) is a fast growing species commonly found in European CWs that could constitute a suitable phytoindicator of metal toxicity. E. hirsutum was exposed for 113 days in microcosm CWs, to a metal and metalloid mixture (MPM, containing Al, As, Cd, Cr, Cu, Fe, Mn, Ni, Pb, Sn, Zn), an organic pollutant mixture (OPM, containing hydrocarbonsC10-C40, phenanthrene, pyrene, anionic detergent LAS) and an organic pollutant and metal and metalloid mixture (OMPM), separately and at concentration levels mimicking levels of industrial effluents. Analyses of metal and As concentrations in biomass, and different biometric and physiological measurements were performed. Results showed that metal uptake patterns were affected by the type of pollutant mixture, resulting in variation of toxicity symptoms in E. hirsutum plants. Some of them appeared to be similar under MPM and OMPM conditions (leaf chlorosis and tip-burning, decrease of green leaf proportion), while others were characteristic of each pollutant mixture (MPM: Decrease of water content, increase of phenol content; OMPM: reduction of limb length, inhibition of vegetative reproduction, increase of chlorophyll content and Nitrogen balance index). Results emphasize the potential of E. hirsutum as a bioindicator species to be used in European CWs treating water with metal, metalloid and organic pollutants.

1. Introduction

Metals and organic pollutants are often found together in contaminated waters released by anthropogenic activities [1,2]; and constructed wetlands (CWs), that have been used for decades for treating organic matter in municipal wastewater, are increasingly used for their treatment [3,4,5]. In these systems, the presence of organic pollutants may influence metal uptake and accumulation by plants [6,7]; and metals may affect organic pollutant biodegradation through impacting the physiology and ecology of both plants and microorganisms that degrade organic pollutants [8,9,10,11]. The concentrations and bioavailability of contaminants—which determine the level of toxicity for organisms—may change in CWs, as they depend on wastewater characteristics, design of the CW basins, and environmental conditions [12,13].
In this context, three aspects need to be assessed: (i) the tolerance of plants to mixed contamination with metals and organic pollutants; (ii) the effects of co-contamination on plant phytoremediation abilities; and (iii) the variation of pollutant ecotoxicity along the longitudinal axis of the CW and during time. Assessment of the first two attributes should be done before the design stage of the CW and may be useful for selecting suitable plant species for phytoremediation of mixed contaminants [7,14]. The assessment of the third attribute may help in managing the spatial organization of the plant species in CWs for maintaining plant good health status, which is one of the key factors for optimizing the phytoremediation process [14,15,16]. This is the focus of the present study.
A first possibility could be to estimate the level of water toxicity in CWs by assessing contaminant accumulation and distribution in the organs of plants such as Phragmites australis, Phalaris arundinaceae, or Typha latifolia, in which metal concentrations were found to be proportional to the concentrations in the environment [17,18,19]. Such an assessment requires the use of laboratory equipment (e.g., forced-air oven, blender, etc.) and measurement involving complex and expensive technology (e.g., GC-MS, ICP-AES, etc.) may not be appropriate in the context of mixed-contamination as interactions between contaminants may modify accumulation patterns. In multi-contaminated environments, especially those with low levels of contamination, other types of plant monitoring based on morphological observations or physiological measurements may be used to indicate harmful effects of exposure to contaminants, in complement with conventional physico-chemical analyses [14,20,21]. Biomonitoring is based on the assumption that water quality affects the organisms that live in it, and therefore, reciprocally, the organisms’ health status reflects water quality [22]. For instance, Shelef et al. [22] found that Canna lily could serve as a bioindicator of water quality in hyper arid conditions, as photochemical efficiency, cell membrane stability, and photosynthetic rate in this plant species appeared to be correlated with the improvement of water quality within the CW. Using biomonitoring of plant health status as a bioindication tool in CWs requires further research [14], especially in the context of mixed contamination which has received too little attention given the huge challenges it raises [9].
A good bioindicator plant species for CWs should be sensitive to contaminant toxicity changes, have the ability to tolerate variations of water table level and be widely distributed geographically. Epilobium hirsutum L. (Hairy willow herb, Onagraceae) is a fast growing plant species [23] commonly found in European CWs as a weed [24,25], and is already known to be sensitive to Fe and Mn contamination [26,27]. This species seems to be a good potential phytoindicator to use in CWs for informing on spatial and temporal ecotoxicity variations, with a potential for economic viability if the plant is regularly harvested [28,29,30].
For the treatment of organic and metallic pollutants in CWs, the use of phytoindicators may help in distinguishing zones in which the main pollutant toxicity is linked with (i) bioavailable metals; (ii) bioavailable organic pollutants; or (iii) both organic pollutants and metals in bioavailable forms. Such information may help in organizing plant species with respect to their pollutant tolerance, with a view to maintaining good plant health status. The delimitation of zones may also guide plant harvesting practices for metal removal in plant biomass. It is preferable to harvest plants in zones where the bioavailable fraction of metals is high, as the expected concentration in biomass would be higher [31,32]; and to maintain plant root systems in zones where the bioavailable fraction of organic pollutants is high, in order to favor biodegradation [33].
The aim of this study is to confirm the potential of E. hirsutum as a bioindicator species, with a view to providing eco-friendly tools [21] for optimizing plant species spatial arrangement and phytoremediation performance in European CWs treating waters containing metals and organic pollutants.

2. Materials and Methods

2.1. Aims of the Experimental Design

E. hirsutum was exposed during 113 days in microcosm CWs, to three different types of contaminant mixtures mimicking industrial effluents. The purpose was to distinguish metals and As or/and organic pollutant effects on this species. Different biometric and physiological measurements were used in order to cover a wide range of toxicity symptoms.

2.2. Planted Microcosms Set-up

Plantlets of Epilobium hirsutum L. were collected from the wetland Les Paluns, south of the Berre lagoon, south-east France (43°35'90'' N; 06°42'65'' E) as previously described in Guittonny-Philippe et al. [34]. Following a four months period of vegetative reproduction of the plants in a greenhouse and initial plant biometric measurements, 24 plant individuals were planted in four rectangular plastic (polypropylene) microcosms (413 × 345 × 294 mm; 6 plants per microcosm) filled with 22 kg of pozzolan (Ø = 7–12 mm). After another acclimation period of 42 days, three microcosms were exposed separately to a metallic pollutant mixture (MPM), an organic pollutant mixture (OPM) or an organic and metallic pollutant mixture (OMPM). A fourth microcosm used as control was left uncontaminated.

2.3. Chemicals and Pollutant Exposure

Two main criteria were considered for the selection of contaminants used in this study: ubiquity of chemicals in industrial context [35,36,37] and their potential ecotoxicity in mixtures [7,38,39,40,41]. Three types of pollutant mixtures mimicking industrial effluents were added in the microcosms. The MPM consisted of an aqueous mixture of 11 metal and metalloids salts: AlCl3.2H2O; AsO3; CdSO4.8H2O; K2Cr2O7; CuSO4; Fe2O12S3; MnSO4.4H2O; NiSO4.7H2O; Pb(NO3)2; SnCl2; ZnCl2 (Table 1). Stock metallic solutions were prepared individually by dissolving metallic salts in deionized water, and then the MPM was prepared in a container by dissolving appropriate amounts of the different stock solutions in water from each microcosm. The OPM consisted of Blend Arabian Light petroleum topped at 250 °C (BAL 250) (THC), as well as phenanthrene (PHE) and pyrene (PYR) obtained in reagent quality from Merck (Darmstadt, Germany) and an anionic detergent Linear Alkylbenzene Sulfonate (LAS) named CARPHEM® (from Chiminvest, Villepinte, France). Stock solutions of THC, PHE and PYR were prepared by dissolving individually each contaminant in dichloromethane. The spiking mixtures were then prepared in a container by diluting the appropriate amount of stock solutions in acetone (20 mL in 13 L of solution) and then in water from each microcosm. The anionic detergent LAS was directly added to the aqueous spiking solutions. The OMPMs were prepared following a similar methodology, by adding both types of stock solutions in water from each microcosm. Before addition, the spiking solutions were homogenized by gently hand-shaking the containers over ten seconds. The plants were exposed to the pollutants during 113 days, through three steps of contamination (Table 1): A first phase (for 35 days), with concentrations corresponding to the European environmental quality standards [42], followed by two phases with concentrations ten times higher (except for the detergent that was kept at an equal concentration during the three phases), during 35 days and then 43 other days (second and third test-phases). The spiking solutions were added to the microcosms in one batch of 13 L, on the day of the beginning of the corresponding test-phase. Over the experimental period, the microcosms were watered with tap water at least three times a week, in order to keep a constant level of solution in the tanks, corresponding to the surface of the pozzolan. Before each test-phase, the liquid content of each microcosm was totally siphoned-off. This water was used to dilute the corresponding stock solution used for the next phase. In this way, no solution was removed from the microcosms at any time during the experiment, and the potential residual pollution contained in the water of a microcosm at the end of one test-phase was reintroduced into the same microcosm for the following test-phase.
Table 1. Targeted metal and organic pollutant concentrations (mg/L) in the pollutant mixtures.
ChemicalsTargeted Concentrations (mg/L)
Phase 1Phases 2–3
Al2.525
As 0.050.5
Cd0.22
Cr0.55
Cu0.55
Fe2.525
Mn110
Ni0.55
Pb0.55
Sn220
Zn220
PHE0.050.5
PYR0.050.5
THC10100
LAS1010

2.4. Chemical Analysis in Water, Substrate, and Plants

Before enriching the microcosms with the artificial effluents, three samples were taken in order to determine the concentrations of pollutants. In every tank, one PVC pipe was placed upright about 150 mm from the center of the tank for collecting water samples and immersing measuring probes. At the end of the first and second test-phases, in the contaminated microcosms, water samples were collected to determine the concentrations of pollutants. For THC, PHE and PYR analyses, 250 mL samples were taken. For the anionic detergent LAS and the metal analyses, two samples of 50 mL were taken.
Rhizospheric pozzolan (pozzolan in contact with plant roots) and water samples were also taken at the end of the third test-phase in each microcosm in order to analyze metals, As, and organic pollutants. At this time, five plant individuals per microcosm were harvested for metal analysis in plant biomass. Plant aboveground (AG) and belowground (BG) parts were washed separately with tap water to remove particle deposition. The AG parts were not desorbed (no EDTA nor hard scrubbing) to preserve the fraction of metal adsorbed to cell walls, to enable comparison with what would happen after harvesting in CW [43]. Plant and pozzolan samples were dried at 80 °C over one week. Plant samples (AG and BG parts separately) were pooled by microcosm (n = 5) as well as rhizospheric pozzolan samples (n = 6), before being ground to 0.2 mm (RETSCH zm 1000 blender, Haan, Germany). Three replicates from each pooled sample were then mineralized with aqua regia in a microwave oven before ICP-AES analysis [44]. Organic pollutant concentrations were not determined in plant biomass. Absorption of organic contaminants in plant biomass is unlikely to have occurred given their physico-chemical characteristics (log Kow > 3.5 for THC, PHE and PYR and log Kow < 0.5 for the anionic detergent LAS) [13,45,46,47].
The water samples were analyzed for Al, As, Cd, Cr, Cu, Fe, Mn, Ni, Pb, and Zn using an Inductively Coupled Plasma-Atomic Emission Spectrometer (ICP-AES Jobin Yvon Horiba, Spectra 2000, Edison, NJ, USA) according to the norm DIN EN ISO 11885 (2009) [48]. Sn was not quantified because of analytical constraints. The concentration of anionic surfactants was monitored by MBAS analysis according to EPA 425.1 method [49].
For the analysis of PHE, PYR and THC, water samples were extracted by liquid-liquid extraction with n-hexane following Guittonny-Philippe et al. [34]. Pressurized liquid extraction with a mixture of n-hexane/dichloromethane (1/1) was used for solid samples (i.e., pozzolan or plants). Extracts were reduced to 1 mL and analyzed using a gas chromatograph (7890A GC System, Agilent Technologies, Santa Clara, CA, USA) coupled to a 7000 Triple Quad mass spectrometer (Agilent, Santa Clara, CA, USA), equipped with an HP-5MS silica fused capillary column (30 m × 0.25 mm inner diameter × 0.25 μm film thickness). The quantification of PHE and PYR was performed by using chrysene D12 as surrogate and phenanthrene D10 as internal standard. The amount of THC was determined as the sum of resolved and unresolved components eluted from the GC capillary column between the retention times of n-decane and n-tetracontane.

2.5. Microcosm and Plant Parameter Monitoring

The light exposure was monitored throughout the day, over each microcosm, throughout the experiment, to ensure they had received a similar quantity of light (ca. 350 μmol/m2/s). During the experiment, in each microcosm, pH was monitored in the water column with a portable pH meter (Hanna Instruments®, Tanneries, France), and electrical conductivity, dissolved oxygen, and temperature were monitored with a WTW® (Weilheilm, Germany) device. Several growth and development parameters of the plant aerial parts (number of leaves: Green, senescent, with chlorosis or dead; aerial height; length of the longest limb) were monitored at least every two weeks during the experiment (yielding a total of 13 times of measurements during the 113 days of pollutant exposure). A leaf was considered senescent when at least one third of its surface was yellow or brown. The proportion of green leaves was calculated as follows: Number of green leaves/total number of leaves [50]. In a similar way, the proportion of leaves with chlorosis was calculated. Fitness biomarkers were also monitored using non-destructive Multiplex® (Force-A, Orsay, France) equipment that uses fluorescence technology with multiple excitations to measure chlorophylls and phenolic compounds indices (SFR_R: Simple Fluorescence Ratio under Red excitation; NBI_R: Nitrogen Balance Index under Red excitation; BRR_FRF: Blue to Red Fluorescence Ratio under UV excitation) [51].
At the end of the experiment, five plant individuals per microcosm were harvested. Each plant part was measured separately and fresh biomass weighed (FW). Dry weights (DW) were obtained after oven drying at 80 °C for five days. Water content (WC) was calculated as: WC = (FW − DW)/DW [52].

2.6. Statistical Analysis

Prior to analyses, analytical steps were performed (testing homoscedasticity and normality of data and transforming data if necessary) and did not enable the use of parametric tests. Biometric and physiological data monitored during the experiment were thus compared at each time of measurement, with Dunn’s multiple comparison test, p ≤ 0.05. Statistical analyses were carried out using the GraphPad PRISM 6.00 for Windows, GraphPad Software.

3. Results and Discussion

3.1. Metal and As Accumulation in Biomass

Organic pollutants as well as metal and As concentrations in water at the end of the experiment were below the regulatory limits [42] in all microcosms (Table 2). E. hirsutum plants accumulated rather high concentrations of metals and As in biomass, whatever the condition (Table 3), in comparison with the commonly expected composition for control plants [53] and with the harmful concentrations for MPM and OMPM plants [54]. Overall, larger amounts of metals were retained in belowground (BG) parts than in aboveground (AG) parts of plants, as previously reported in other plant species exposed to metals [55,56,57]. This suggests that regular harvesting of plant aerial parts would not be of particular interest for the purpose of exporting metals from the CW. Under control condition, where the only source of metals came from the natural content of pozzolan (Table 2), plants accumulated rather high concentrations of metals in their biomass, which suggests that root exudates and microorganisms may be capable of dissolving metals from pozzolan. Metal concentrations in BG parts were generally higher in plants exposed to the pollutant mixtures than in control plants, and differences were statistically significant (Dunn’s multiple comparison test, p ≤ 0.05) between MPM plants and control plants for Al, Cd, Cu, Ni, and Zn; and between OMPM and control plants for As, Cr, Fe, Mn, and Pb (Table 3). Inversely, in AG parts, concentrations were generally higher in control plants than in plants exposed to the pollutant mixtures (Table 3), except for Mn. Statistically significant differences (Dunn’s multiple comparison test, p ≤ 0.05) were observed for Al, Cr, and Fe between control plants and MPM plants, as well as for Ni between control plants and OMPM plants. These results are consistent with Wheeler et al. [27], who reported that iron concentrations in the roots of E. hirsutum increased considerably at high iron concentrations (probably due to precipitated iron) in the medium but increased slightly in shoots. It is worth noting that our results did not confirm that E. hirsutum was hyperaccumulator of Cu, as has been previously reported [58].
Under control conditions, the lowest values of the “possible toxicity range” (Prasad et al., 2006 in [54]) was only exceeded for Cr and Ni concentrations in whole plant biomass (Table 4); but for all metals, concentrations were higher than the commonly expected composition (Markert, 1994 in [53]). Under MPM and OMPM conditions, the highest values of the possible toxicity range were exceeded for Cr and Ni concentrations, as well as for Cd under MPM conditions, and for Mn under OMPM conditions (Table 4).
Thus, the addition of artificial effluents containing dissolved forms of metals and As modified element uptake patterns of E. hirsutum, both in AG and BG parts; and the main drivers of metal toxicity were also affected by the presence of organic pollutants.
Table 2. Metal and organic pollutant concentrations analyzed in pozzolan (mg/kg) and water (mg/L) of E. hirsutum microcosms at the end of the experiment.
Environ.Cond.AlAsCdCrCuFeMnNiPbZnTHCPHEPYRLAS
Pozzolan (mg/kg)Control23.103 ± 1.103n.m.7.3 ± 0.3272 ± 725 ± 133.103 ± 1.103541±27227±95.4 ± 0.342 ± 145.650.02310.028n.m.
MPM23.103 ± 1.103n.m.5.1 ± 0.1268 ± 1022 ± 133.103 ± 1.103522±18225±45.2 ± 0.249 ± 1n.m.n.m.n.m.n.m.
OPMn.m.n.m.n.m.n.m.n.m.n.m.n.m.n.m.n.m.n.m.47.160.02530.0298n.m.
OMPM22.103 ± 1.103n.m.4.9 ± 0.3241 ± 721 ± 132.103 ± 2.103499 ± 17209 ± 45.1 ± 0.646 ± 050.950.02320.0298n.m.
Water (mg/L)Control<0.1<0.03<0.010.020.020.020.010.01< 0.040.030.1980.000250.0001n.m.
MPM1.23< 0.030.090.040.080.690.070.430.050.83n.m.n.m.n.m.n.m.
OPMn.m.n.m.n.m.n.m.n.m.n.m.n.m.n.m.n.m.n.m.0.00030.160.00040.31
OMPM0.13<0.03<0.01<0.020.010.130.240.18<0.040.060.00071.060.00060.19
Notes: n.m. = not measured; Environ. = environment; Cond. = condition; n.m. = not measured.
Table 3. Metal concentrations analyzed in E. hirsutum dry biomass (mg/kg DW) at the end of the experiment. For a considered biomass type, means followed by a same letter are not significantly different at p ≤ 0.5 (Dunn’s multiple comparison test).
Type of BiomassTreatmentMetal Concentration in Dry Biomass (mg/kg DW)
AlAsCdCrCuFeMnNiPbZn
BGControl2372 ± 53a1.6 ± 0.1a1.6 ± 0.1a23 ± 1a19 ± 5a5425 ± 102a734 ± 13a30 ± 1a4.5 ± 0.5a126 ± 3a
MPM3801 ± 561b21 ± 3ab187 ± 14b160 ± 14ab199 ± 19b6984 ± 863ab1370 ± 121ab653 ± 35b74 ± 7ab1317 ± 82b
OMPM3107 ± 161ab77 ± 2b85 ± 2ab194 ± 8b122 ± 4ab11867 ± 565b2960 ± 68b348 ± 13ab144 ± 4b643 ± 26ab
AGControl714 ± 21b<2.5<0.538 ± 1b15 ± 7791 ± 31b115 ± 2a36 ± 3b1.9 ± 0.264 ± 22
MPM140 ± 7a<2.55.2 ± 0.13.5 ± 0.5a12 ± 1239 ± 5a253 ± 2ab26 ± 1ab2.0 ± 0.2138 ± 3
OMPM284 ± 7ab<2.52.1 ± 0.119 ± 1ab14 ± 1532 ± 33ab452 ± 8b21 ± 1a3.3 ± 0.195 ± 15
Notes: n.m. = not measured; DW = Dry Weight.
Table 4. Metal concentrations in the whole plant dry biomass (mg/kg DW) of E. hirsutum, at the end of the experiment compared to normal composition of plants1 and possibly harmful concentrations2.
Metal Concentration in Plant Dry Biomass (mg/kg DW)
AlAsCdCrCuFeMnNiPbZn
Normal Composition 180n.g.0.051.5101502001.51.050
Possibly Harmful Concentration 2n.g.5–205–305–3020–100n.g.300–50010–10030–300100–400
E. hirsutumControl1171 ± 30n.c.n.c.34 ± 116 ± 72070 ± 51286 ± 534 ± 22.6 ± 0.381 ± 17
MPM845 ± 113n.c.40 ± 334 ± 348 ± 41538 ± 170468 ± 25147 ± 716 ± 1365 ± 18
OMPM1240 ± 59n.c. 30 ± 077 ± 350 ± 24369 ± 2131301 ± 28131 ± 551 ± 1281 ± 19
Notes: n.g. = not given; n.c. = non-calculable; DW = Dry Weight. 1 Markert (1994) in [53]; 2 Prasad et al. (2006) in [54].

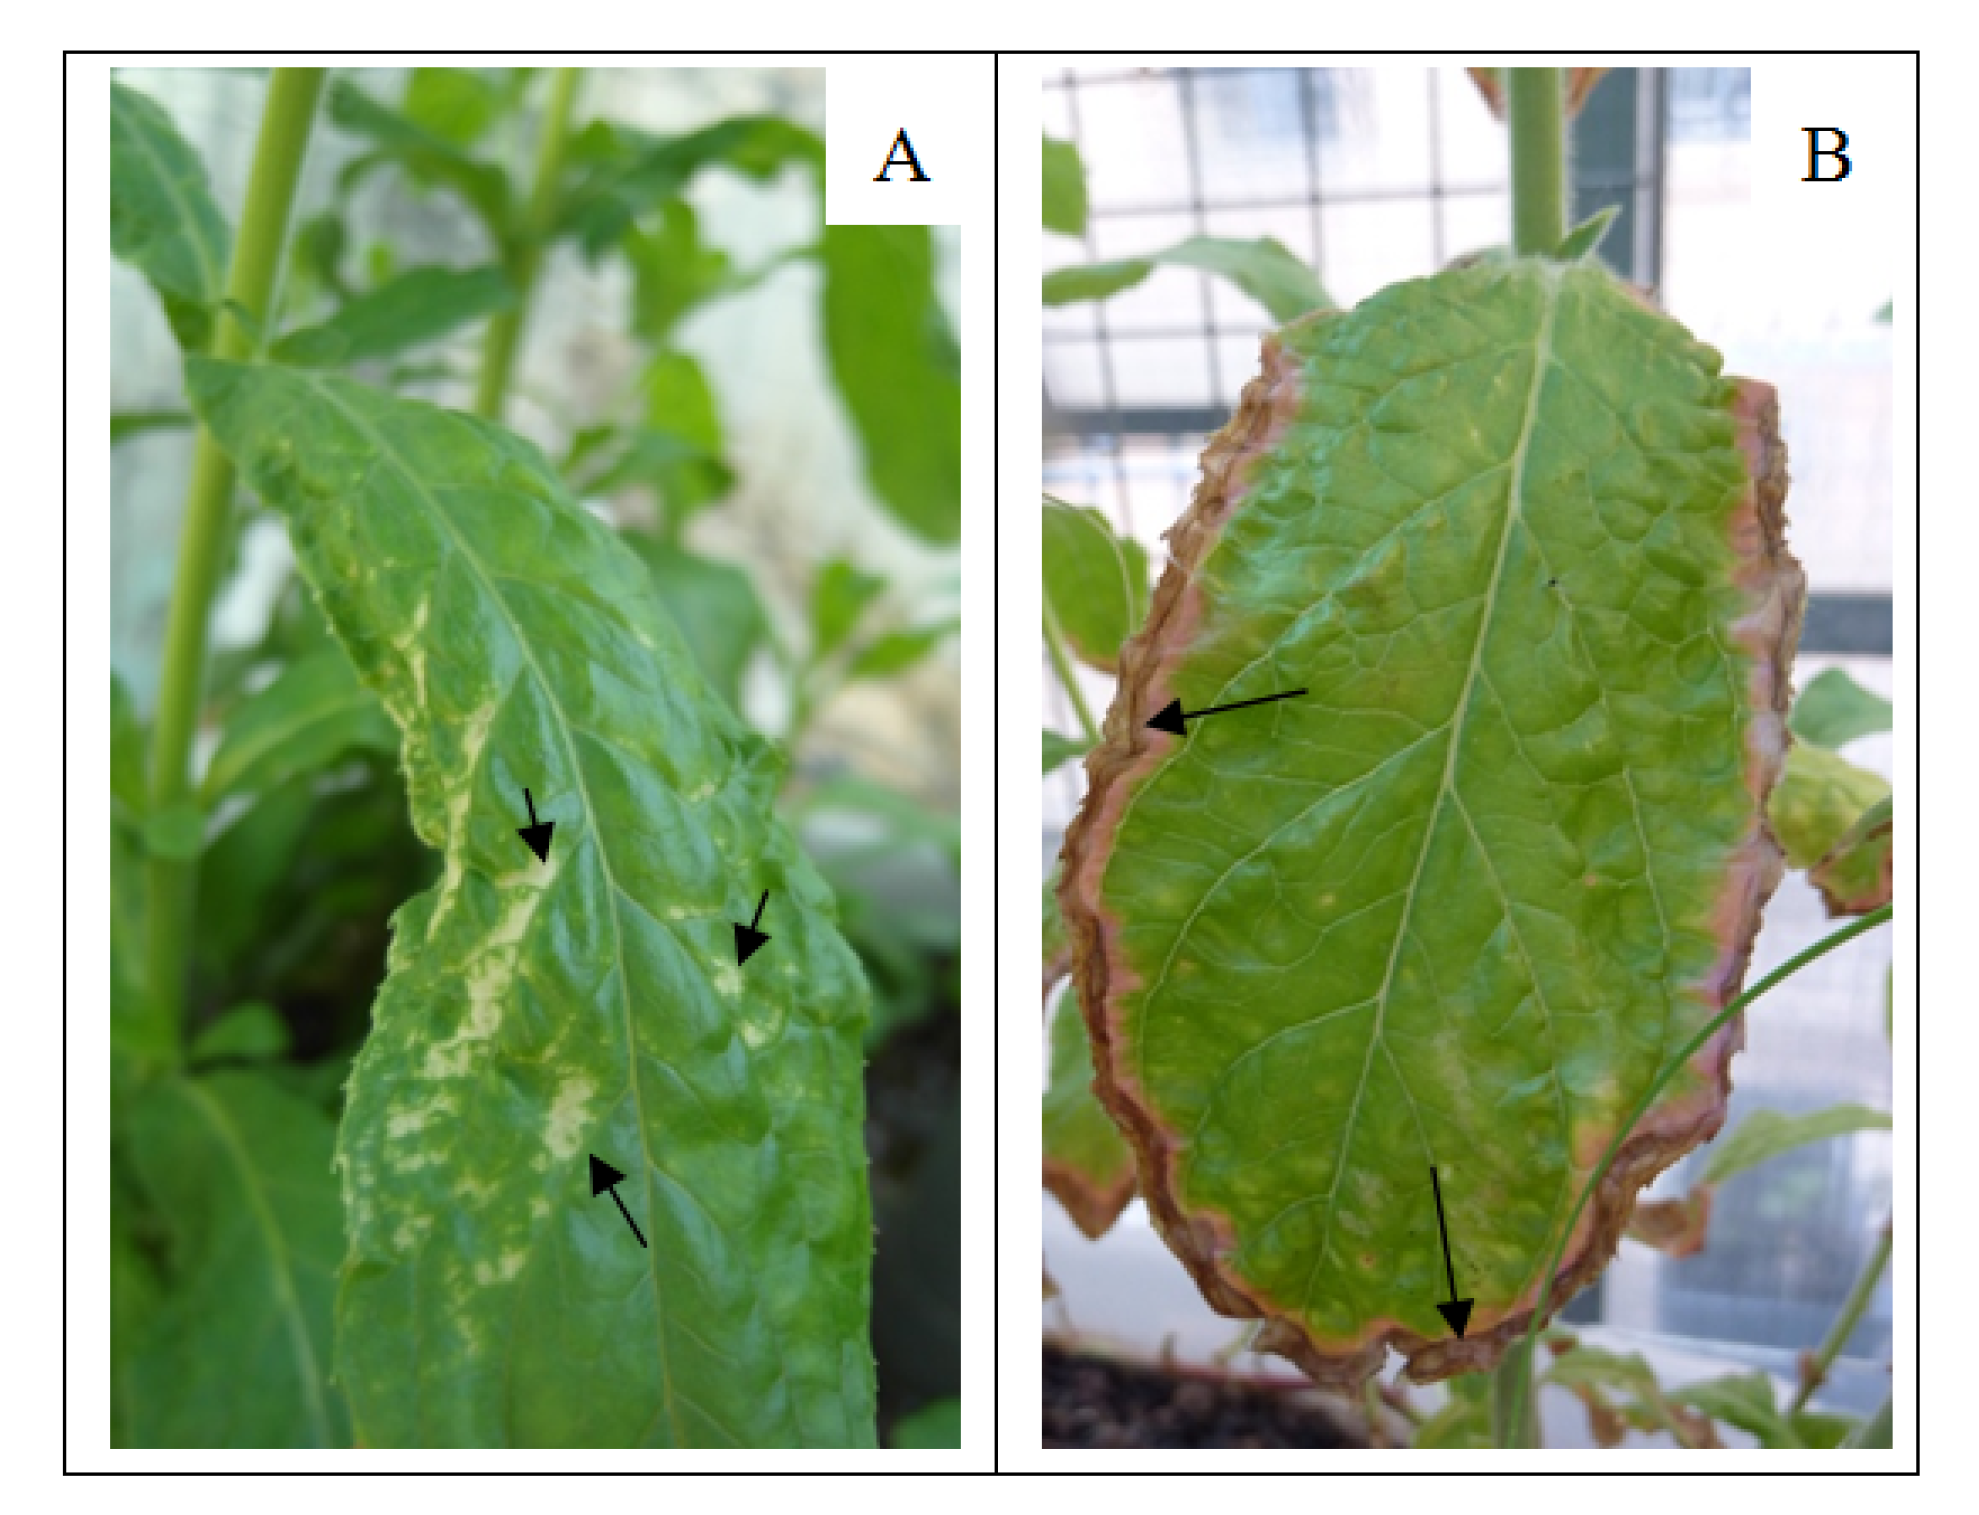
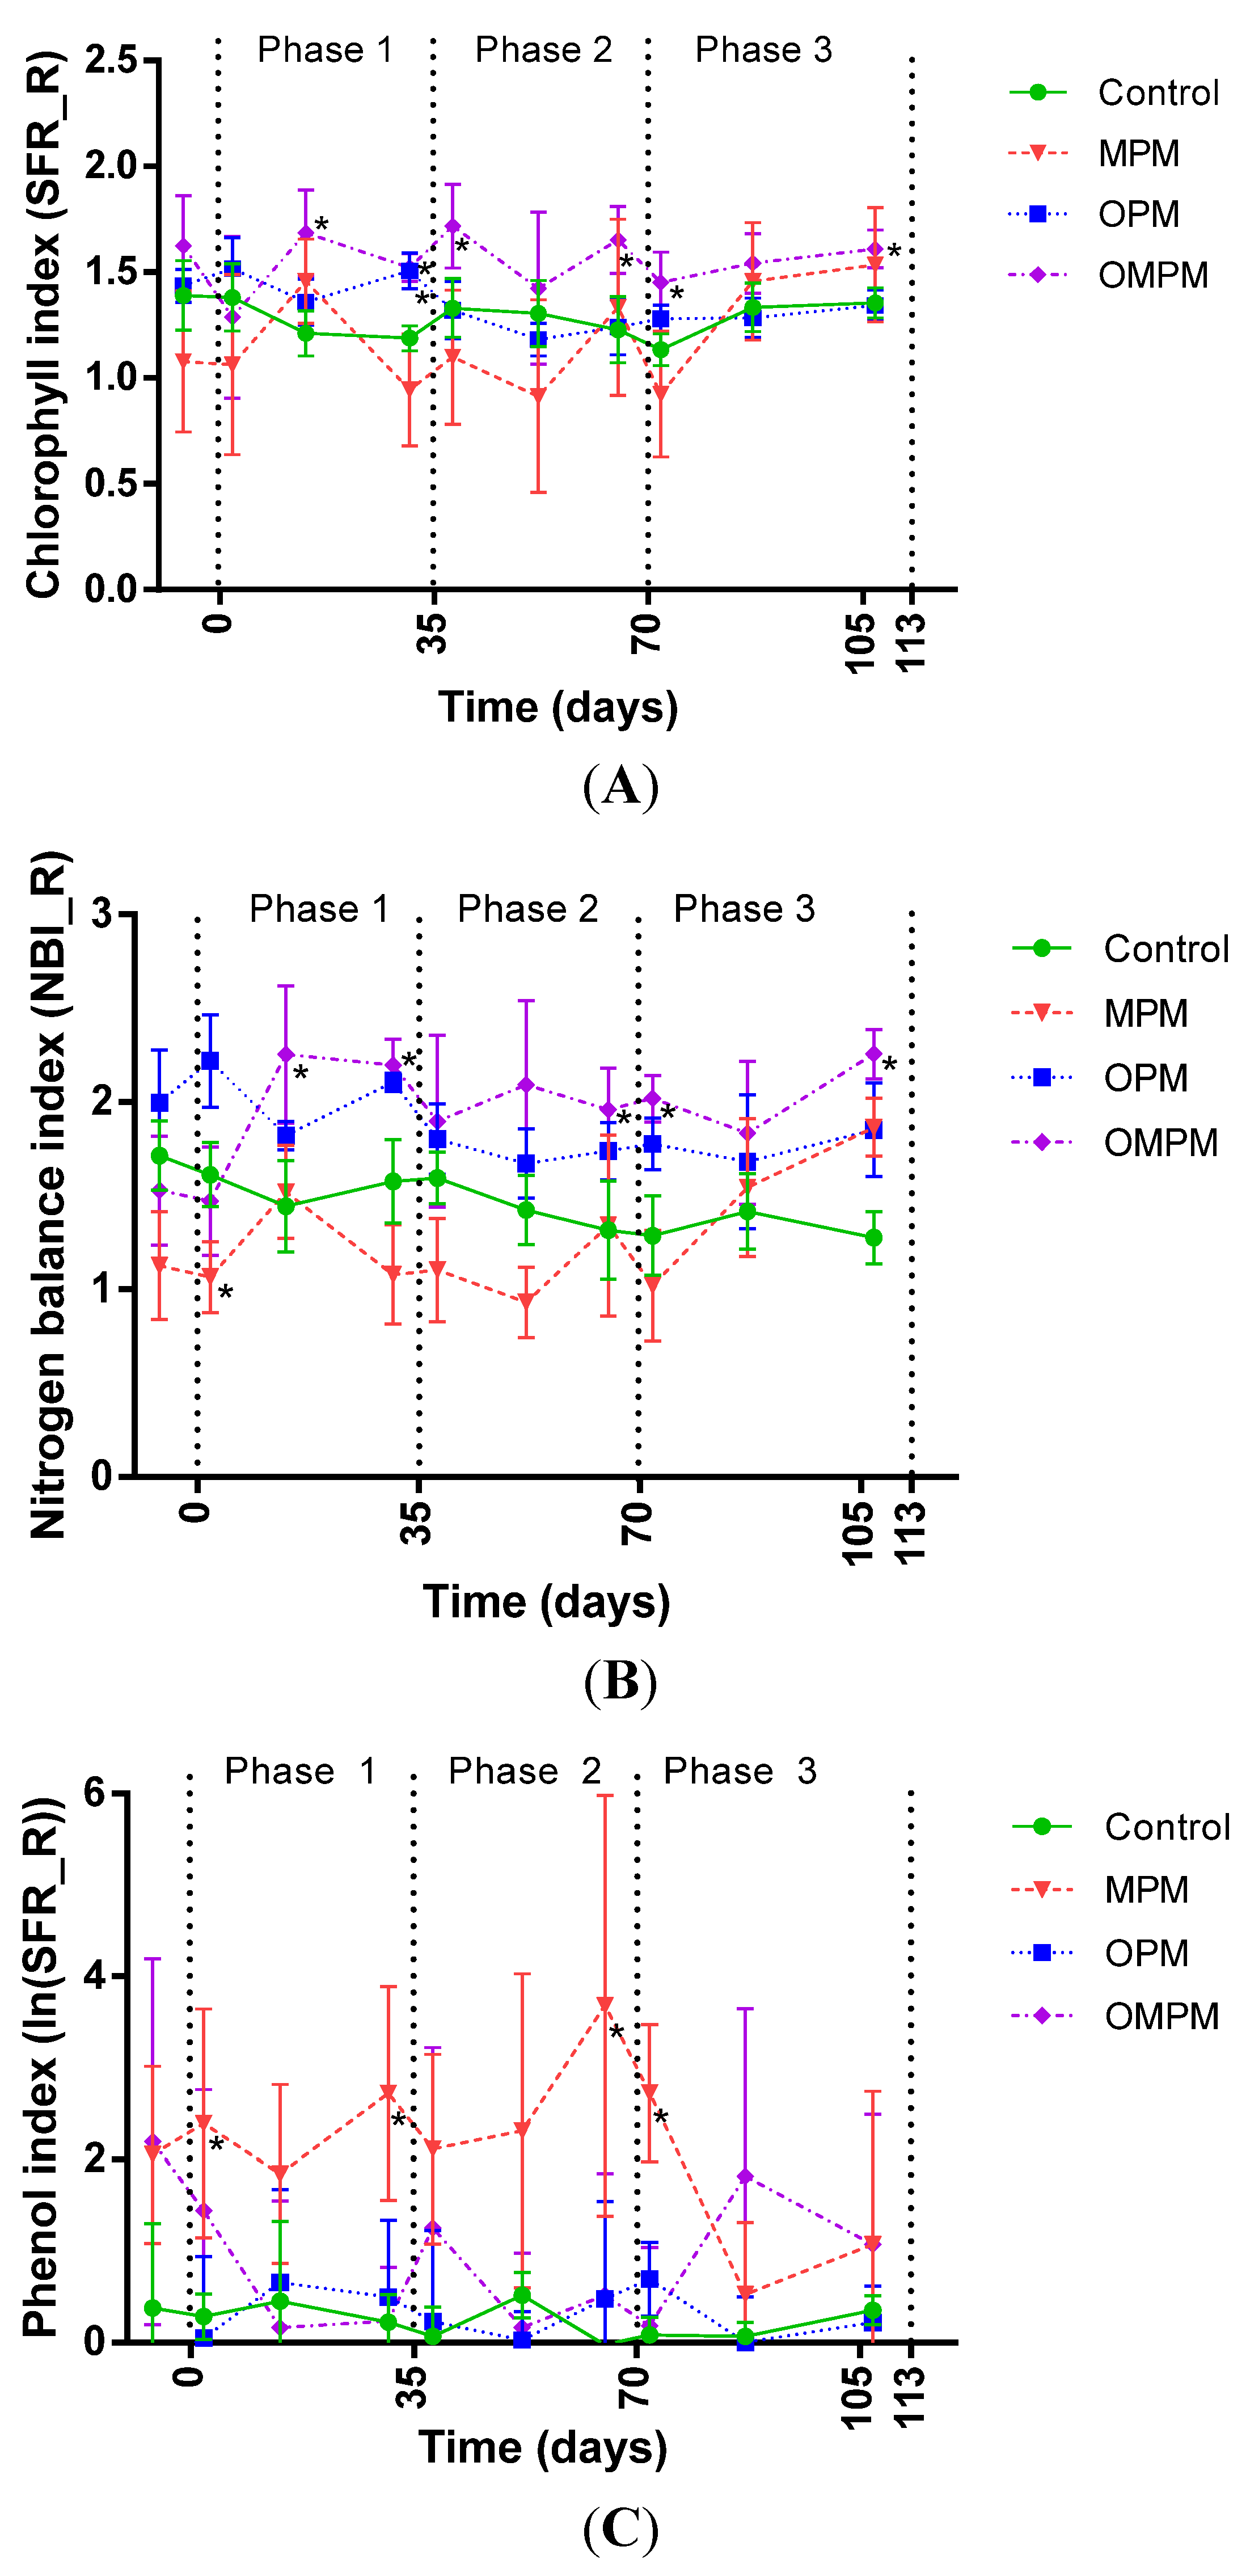
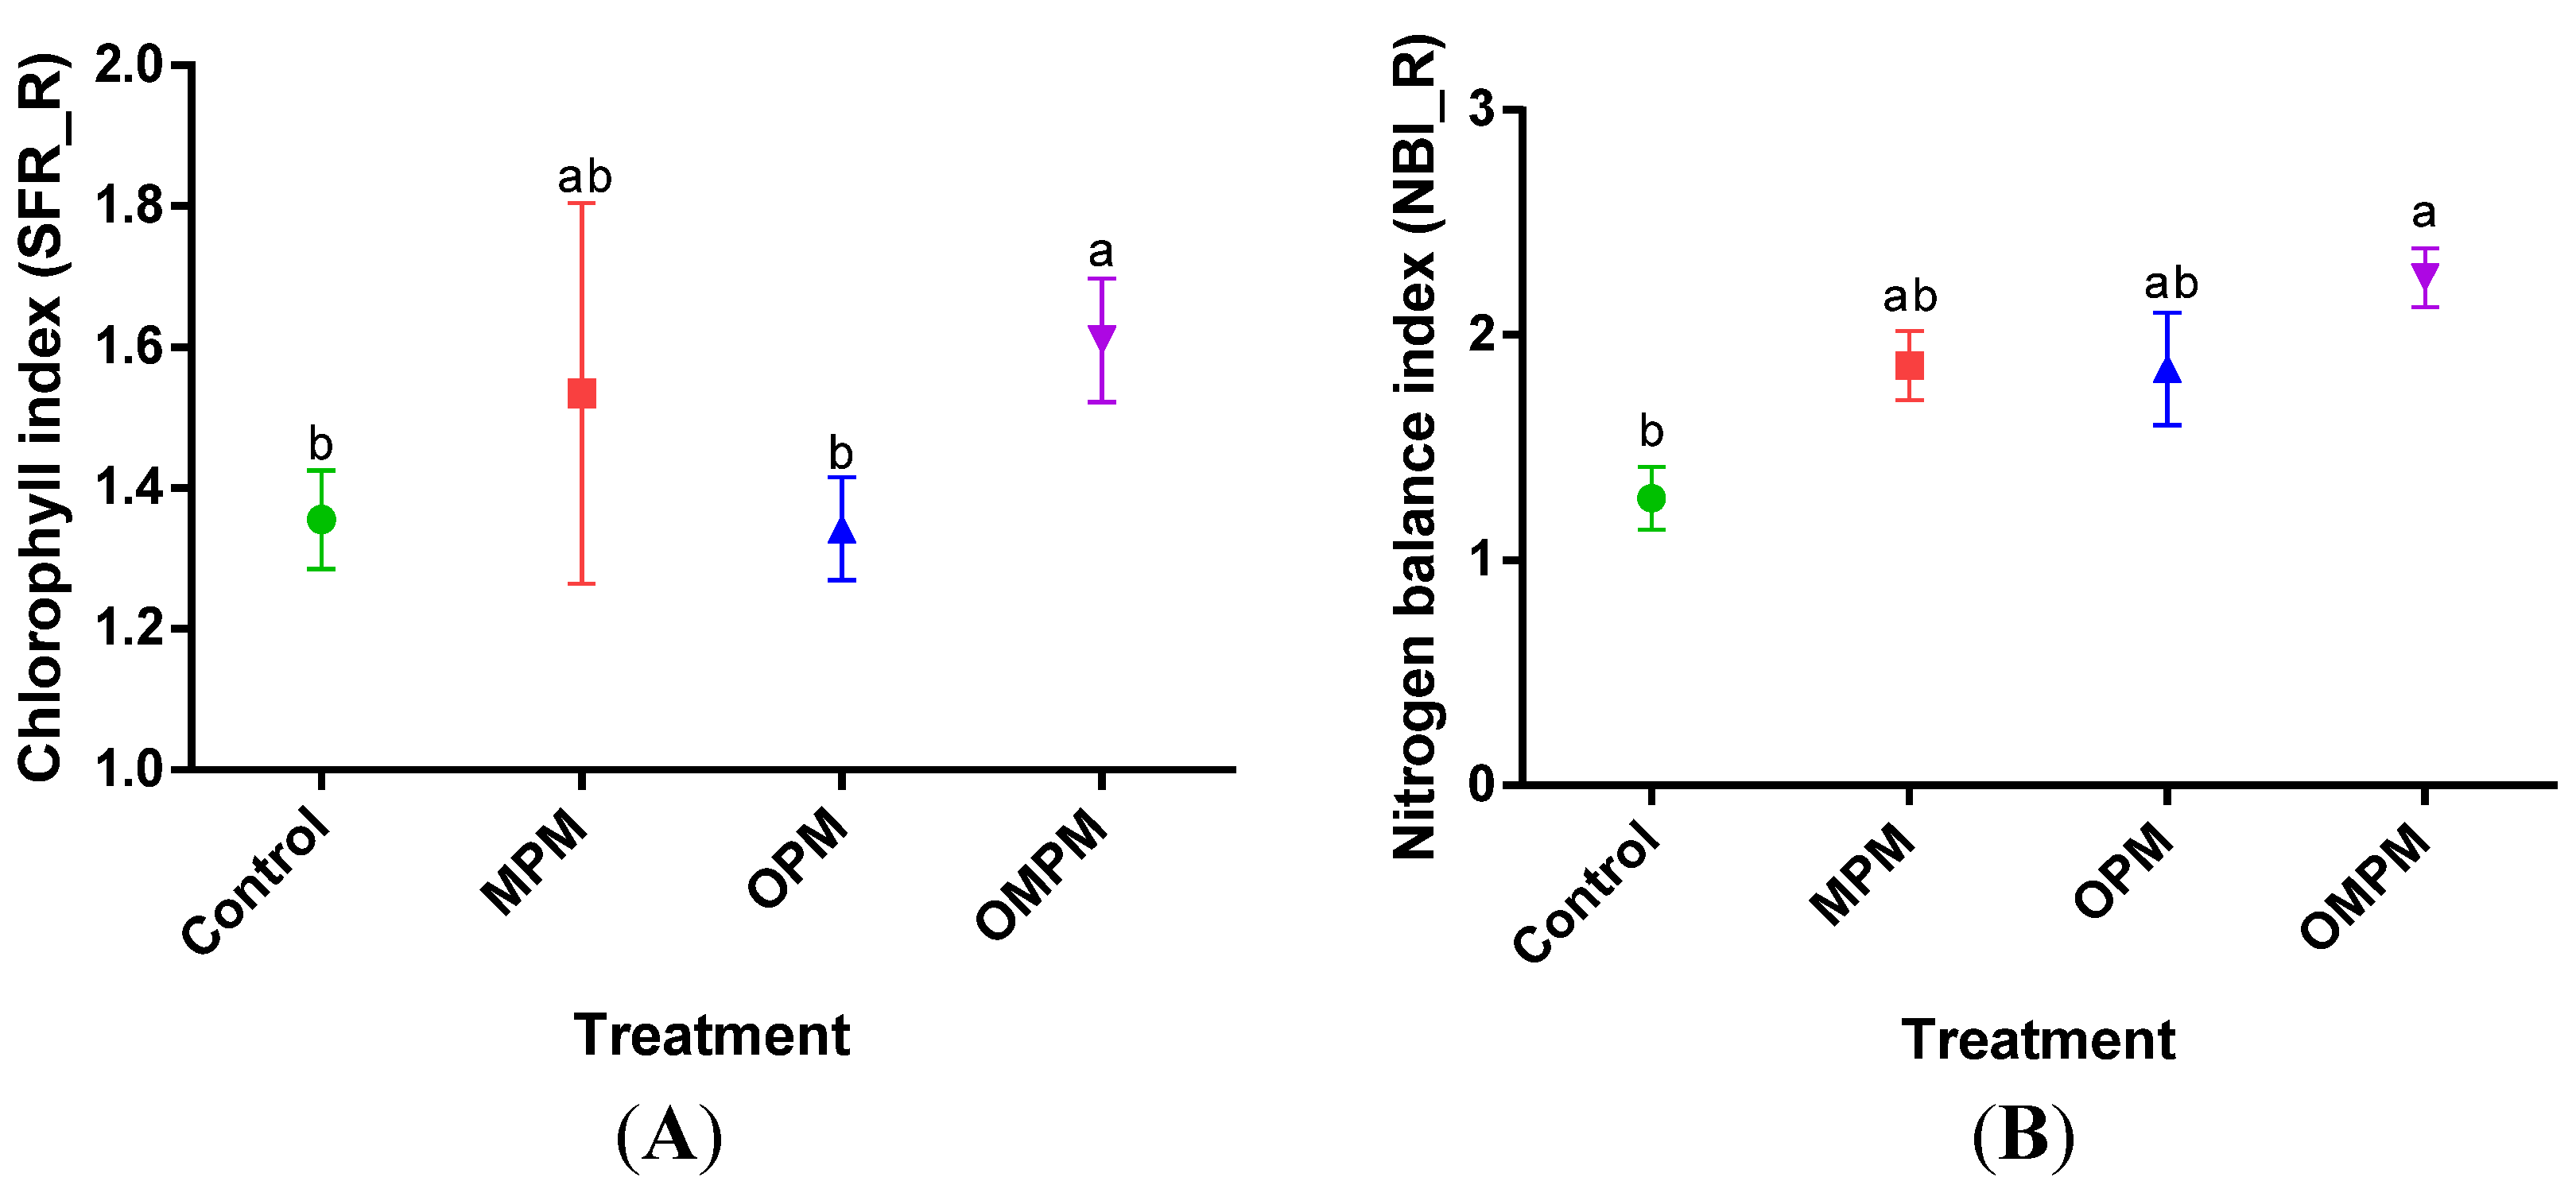
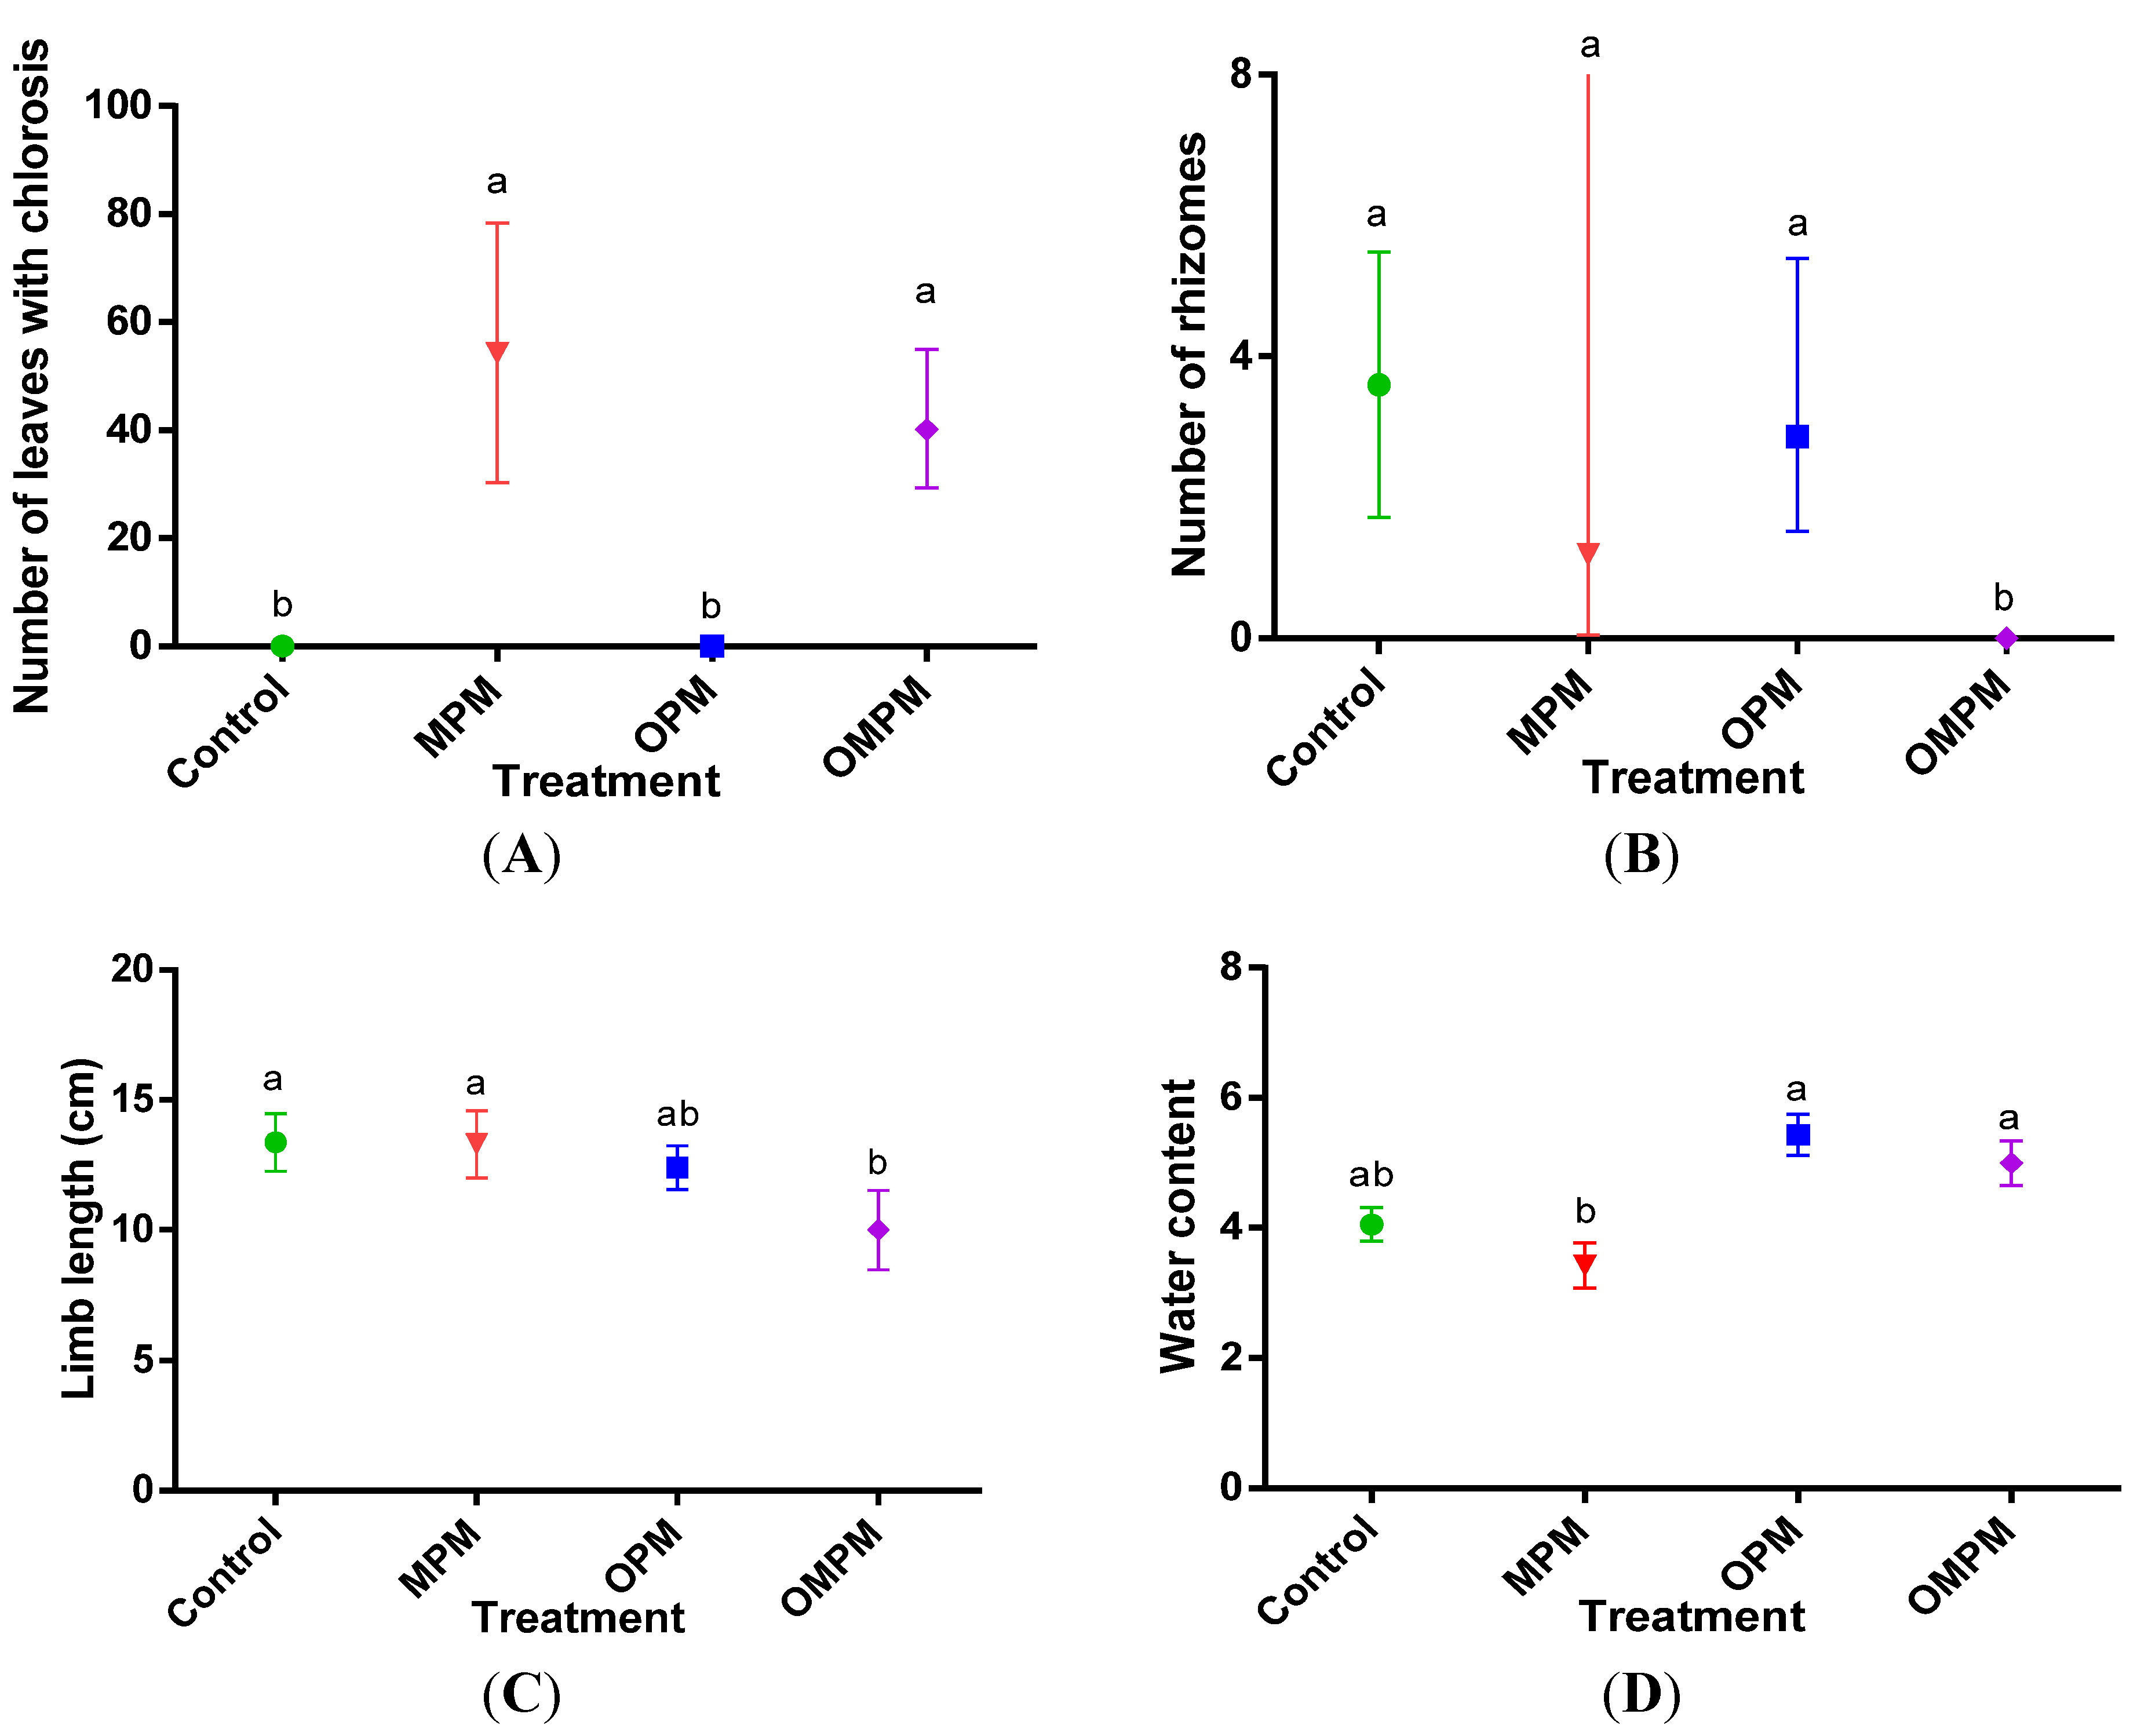
3.2. Toxicity Symptoms due to Mixtures of Pollutants

E. hirsutum plants exhibited different toxicity symptoms in the presence of the pollutant mixtures. Some of them appeared to be similar under MPM and OMPM conditions, while others were characteristic of a specific type of pollutant mixture. Under MPM and to a lesser extent OMPM conditions, middle-aged leaves exhibited chlorosis symptoms (Figure 1A and Figure 2A) and then tip burning (Figure 2B), ending in senescence. This resulted in a statistically significant (Dunn’s multiple comparison test, p ≤ 0.05) drastic diminution of the proportion of green leaves under both conditions (Figure 3A). It is worth noting that leaf chlorosis and leaf-tip burning are rather common symptoms observed in plants exposed to metals [59,60,61,62]. These symptoms were not observed in control or OPM plants and could thus reveal metal toxicity for E. hirsutum.
Figure 1. Effects of the pollutant mixtures on E. hirsutum plants (means ± 95% C.I.) at the end of the experiment on (A) number of leaves with chlorosis; (B) number of rhizomes; (C) limb length; (D) water content. For each parameter separately, a same letter on the top of plots means that the means are not statistically significantly different at p ≤ 0.05 (Dunn’s multiple comparison test). n.m. = not measured; C.I. = Confidence Interval.
Water 07 00697 g001
Figure 2. Photographs of E. hirsutum middle-age leaves in the MPM microcosm presenting (A) chlorosis during the second test-phase; and (B) chlorosis and tip-burning during the third test-phase.
Water 07 00697 g002
Figure 3. Effects of the treatments on E. hirsutum (A) proportion of green leaves (mean ± 95% C.I.); (B) aerial height (mean ± 95% C.I.), during the experiment. Asterisks associated with values at a given time indicate a statistically significant difference between the control and the contaminated plant groups (Dunn’s multiple comparison test). C.I. = Confidence Interval.
Water 07 00697 g003
The MPM plants exhibited an ecologically significant decrease in water content (Figure 1D) not noticed on OMPM plants, which is usually a common reaction encountered in plants exposed to metallic stress [63]. A statistically significant increase of the phenol index was also detected occasionally during the monitoring of phytometabolites (Figure 4C).
Figure 4. Effects of the treatments on E. hirsutum plants (mean ± 95% C.I.) on (A) chlorophyll index (SFR_R); (B) nitrogen balance index (NBI_R); (C) phenol index (ln(BRR_FRF)), during the experiment. Asterisks associated with values at a given time indicate a significant difference between the control and the contaminated plant groups (Dunn’s multiple comparison test). C.I. = Confidence Interval.
Water 07 00697 g004
In addition to leaf chlorosis, tip-burning and water content increase, the OMPM caused an inhibition of vegetative reproduction and a reduction of the limb length (Figure 1B,C), statistically significant at the end of the experiment (Dunn’s multiple comparison test, p ≤ 0.05). A statistically significant slowdown of aerial elongation was also detected during the third test-phase (Figure 3B), but was not statistically significant at the end of the experiment. At the physiological level, non-destructive measurements performed with the Multiplex® (Force-A, Orsay, France) equipment highlighted a statistically significant increase (Dunn’s multiple comparison test, p ≤ 0.05) of both chlorophyll and nitrogen balance indices (Figure 4A,B and Figure 5A,B). These symptoms seem to be the result of combined metal and organic pollutant interactions since they were not detected under the MPM or OPM conditions, and the underlying causes are difficult to explain, as there is a lack of knowledge in this scientific domain [7]. The substitution of Mg2+ in the chlorophyll molecule by heavy metal ions may have led to the formation of heavy metal substituted chlorophylls and the modification of its spectral properties [64,65,66]. Because the SFR_R index is a method based on the fluorescence emission ratio between the far red and red, it is possible that the apparent increase of chlorophyll detected was in reality caused by a decrease of red fluorescence or an increase of far red fluorescence [67]. The fact that this effect was detected only with OMPM could be related to the mobilization of metals by surfactants. More research is necessary before using the appearance of these different symptoms in E. hirsutum plants as specific indicators of the toxicity linked with metals and organic pollutants co-occurrence.
Figure 5. Effects of the pollutant mixtures on E. hirsutum plants (means ± 95% C.I.) at the end of the experiment on (A) chlorophyll index (SFR_R); (B) nitrogen balance index (NBI_R). For each parameter separately, the same letter on the top of plots means that the means are not statistically significantly different (Dunn’s multiple comparison test). C.I. = Confidence Interval.
Water 07 00697 g005
Thus, as expected, E. hirsutum plants exhibited a high number of toxicity symptoms when exposed to the pollutant mixtures containing metals and As in microcosm CWs. Nevertheless, at the end of the experiment, plants exhibited visually healthy root systems (no apparent blackening or necrosis); and biomass production was not affected, as no significant differences of AG or BG dry weights were encountered (Table 5). This is a remarkable point because a good phytoindicator in CWs should be able to survive when exposed to rather high contaminant concentrations. Therefore, as we hypothesized, E. hirsutum could be a good candidate to use in CWs for providing information about the changes of pollutant toxicity within the CW, when treating metal and organic pollutant mixtures.
Table 5. Fresh weight (FW) and dry weight (DW) of the aboveground (AG) and belowground (BG) biomass of E. hirsutum plants for the four experimental conditions.
TreatmentBG FW (g)BG DW (g)AG FW (g)AG DW (g)
Control26 ± 33.0 ± 0.629 ± 47.7 ± 0.9
MPM21 ± 122.4 ± 1.235 ± 2010.1 ± 5.9
OPM35 ± 133.2 ± 1.229 ± 106.9 ± 2.6
OMPM20 ± 121.9 ± 1.114 ± 63.8 ± 1.7

4. Conclusions

A high diversity of metals and organic pollutants is often found in contaminated waters released by industrial activities in Europe, and constructed wetlands are more and more widely used for their treatment. In this context, as there are potential interaction and cumulative effects between contaminants, physico-chemical measurements may not be sufficient to inform on the toxicity of water for plants. Thus, the use of phytoindicators may provide information complementary to chemical analyses that could for example aid in distinguishing main zones of metal and/or organic pollutants toxicity within the CW, and their progression in time. This may help in managing the other plant species used for phytoremediation in the CW. In this study it was shown that Epilobium hirsutum L. was a good potential phytoindicator, and that simple non-destructive monitoring could be used to detect metal and As toxicity and possibly trace elements and organic pollutants co-toxicity. Further studies are now being performed in on-site constructed wetlands, treating mixtures of organic contaminants and metals in the field in order to confirm our results; and the bioindication potential of other species should also be studied.

Acknowledgments

This research was supported by a CIFRE grant (No. 2010/0696) for Anna Philippe, from the Association Nationale de la Recherche et de la Technologie and the company ECO-MED. The work presented here is part of the program ECO-PHYT funded by the Rhone-Mediterranean and Corsica Water Agency. Many thanks to the botanist Daniel Pavon for his help in plant determination, to Arnaud Alary (RECYCL’EAU company) for his advice on wetland plantlets and providing pozzolan media, and to Carine Demelas, Laurent Vassalo and Fehmi Kanzari for their help with chemical analyses. Thank you to Michael Paul for the English revision of the text.

Author Contributions

Anna Guittonny-Philippe wrote the paper and performed the experiment, statistical analysis, and data interpretation. Marie-Eléonore Petit performed the experiment. Laure Malleret and Bruno Coulomb directed the chemical analyses and the adjustment of contaminant mixtures. Jacques Rabier helped in the Multiplex® data interpretation. Véronique Masotti and Isabelle Laffont-Schwob provided guidance and directed this research, contributed to editing and data interpretation. All the authors contributed to the revision of the manuscript.

Conflicts of Interest

The authors declare no conflict of interest.

References

  1. Sun, Y.; Zhou, Q.; Xu, Y.; Wang, L.; Liang, X. Phytoremediation for co-contaminated soils of benzo[a]pyrene (B[a]P) and heavy metals using ornamental plant Tagetes patula. J. Hazard. Mater. 2011, 186, 2075–2082. [Google Scholar]
  2. Zhang, Z.; Rengel, Z.; Chang, H.; Meney, K.; Pantelic, L.; Tomanovic, R. Phytoremediation potential of Juncus subsecundus in soils contaminated with cadmium and polynuclear aromatic hydrocarbons (PAHs). Geoderma 2012, 175–176, 1–8. [Google Scholar]
  3. Groudeva, V.I.; Groudev, S.N.; Doycheva, A.S. Bioremediation of waters contaminated with crude oil and toxic heavy metals. Int. J. Miner. Process. 2001, 62, 293–299. [Google Scholar]
  4. Terzakis, S.; Fountoulakis, M.S.; Georgaki, I.; Albantakis, D.; Sabathianakis, I.; Karathanasis, A.D.; Kalogerakis, N.; Manios, T. Constructed wetlands treating highway runoff in the central Mediterranean region. Chemosphere 2008, 72, 141–149. [Google Scholar]
  5. Tu, Y.T.; Chiang, P.C.; Yang, J.; Chen, S.H.; Kao, C.M. Application of a constructed wetland system for polluted stream remediation. J. Hydrol. 2014, 510, 70–78. [Google Scholar]
  6. Kabata-Pendias, A. Trace Elements in Soils and Plants, 4th ed.; Taylor and Francis Group, CRC Press: Boca Raton, FL, USA, 2011; p. 505. [Google Scholar]
  7. Zhang, Z.; Rengel, Z.; Meney, K.; Pantelic, L.; Tomanovic, R. Polynuclear aromatic hydrocarbons (PAHs) mediate cadmium toxicity to an emergent wetland species. J. Hazard. Mater. 2011, 189, 119–126. [Google Scholar]
  8. Chen, Y.X.; Lin, Q.; He, Y.F.; Tian, G.M. Behavior of Cu and Zn under combined pollution of 2,4-dichlorophenol in the planted soil. Plant Soil 2004, 261, 127–134. [Google Scholar]
  9. Lin, Q.; Shen, K.L.; Zhao, H.M.; Li, W.H. Growth response of Zea mays L. in pyrene-copper co-contaminated soil and the fate of pollutants. J. Hazard. Mater. 2008, 150, 515–521. [Google Scholar]
  10. Riis, V.; Babel, W.; Pucci, O.H. Influence of heavy metals on the microbial degradation of diesel fuel. Chemosphere 2002, 49, 559–568. [Google Scholar]
  11. Sandrin, T.R.; Maier, R.M. Impact of metals on the biodegradation of organic pollutants. Environ. Health Perspect. 2003, 111, 1093–1101. [Google Scholar]
  12. Guittonny-Philippe, A.; Masotti, V.; Höhener, P.; Boudenne, J.L.; Viglione, J.; Laffont-Schwob, I. Constructed wetlands to reduce metal pollution from industrial catchments in aquatic Mediterranean ecosystems: A review to overcome obstacles and suggest potential solutions. Environ. Int. 2014, 64, 1–16. [Google Scholar]
  13. Imfeld, G.; Braeckevelt, M.; Kuschk, P.; Richnow, H.H. Monitoring and assessing processes of organic chemicals removal in constructed wetlands. Chemosphere 2009, 74, 349–362. [Google Scholar]
  14. Shelef, O.; Gross, A.; Rachmilevitch, S. Role of plants in a constructed wetland: Current and new perspectives. Water 2013, 5, 405–419. [Google Scholar]
  15. Beharrell, M. Planting, Selection and Plant Establishment in Constructed Wetlands in a Tropical Environment. In Wetlands Ecosystems in Asia: Function and Management; Wong, M.H., Ed.; Elsevier B.V.: Amsterdam, Netherlands, 2004; Volume 1, pp. 311–329. [Google Scholar]
  16. Brisson, J.; Chazarenc, F. Maximizing pollutant removal in constructed wetlands: Should we pay more attention to macrophyte species selection? Sci. Total Environ. 2009, 407, 3923–3930. [Google Scholar]
  17. Bonanno, G.; lo Giudice, R. Heavy metal bioaccumulation by the organs of Phragmites australis (common reed) and their potential use as contamination indicators. Ecol. Indic. 2010, 10, 639–645. [Google Scholar]
  18. Polechońska, L.; Klink, A. Trace metal bioindication and phytoremediation potentialities of Phalaris arundinacea L. (reed canary grass). J. Geochem. Explor. 2014, 146, 27–33. [Google Scholar]
  19. Klink, A.; Macioł, A.; Wisłocka, M.; Krawczyk, J. Metal accumulation and distribution in the organs of Typha latifolia L. (cattail) and their potential use in bioindication. Limnol. Ecol. Manag. Inland Waters 2013, 43, 164–168. [Google Scholar]
  20. Bonanno, G. Arundo donax as a potential biomonitor of trace element contamination in water and sediment. Ecotoxicol. Environ. Saf. 2012, 80, 20–27. [Google Scholar]
  21. Zhou, Q.; Zhang, J.; Fu, J.; Shi, J.; Jiang, G. Biomonitoring: An appealing tool for assessment of metal pollution in the aquatic ecosystem. Anal. Chim. Acta 2008, 606, 135–150. [Google Scholar]
  22. Shelef, O.; Golan-Goldhirsh, A.; Gendler, T.; Rachmilevitch, S. Physiological parameters of plants as indicators of water quality in a constructed wetland. Environ. Sci. Pollut. Res. 2011, 18, 1234–1242. [Google Scholar]
  23. Vale, M.; Nguyen, C.; Dambrine, E.; Dupouey, J. Microbial activity in the rhizosphere soil of six herbaceous species cultivated in a greenhouse is correlated with shoot biomass and root C concentrations. Soil Biol. Biochem. 2005, 37, 2329–2333. [Google Scholar]
  24. Vymazal, J. Plants in constructed, restored and created wetlands. Ecol. Eng. 2013, 61, 501–504. [Google Scholar]
  25. Vymazal, J. Vegetation development in subsurface flow constructed wetlands in the Czech Republic. Ecol. Eng. 2013, 61P, 575–581. [Google Scholar]
  26. Nazrul-Islam, A.K.M. Effects of interaction of calcium and manganese on the growth and nutrition of Epilobium hirsutum L. Soil Sci. Plant Nutr. 1986, 32, 161–168. [Google Scholar]
  27. Wheeler, B.D.; Al-Farraj, M.; Cook, R.E.D. Iron toxicity to plants in base-rich wetlands: Comparative effects on the distribution and growth of Epilobium hirsutum L. and Juncus subnodulosus Schrank. New Phytol. 1985, 100, 653–669. [Google Scholar]
  28. Roman, I.; Rusu, M.A.; Puică, C.; Borşa, M. Citotoxic effects of three species of Epilobium (Onagraceae) herbal extracts in rats. Stud. Univ. Vasile Goldis Ser. Stiint. Vietii (Life Sci. Ser.) 2010, 20, 19–23. [Google Scholar]
  29. Wojdyło, A.; Oszmianski, J.; Czemerys, R. Antioxidant activity and phenolic compounds in 32 selected herbs. Food Chem. 2007, 105, 940–949. [Google Scholar]
  30. Battinelli, L.; Tita, B.; Evandri, M.G.; Mazzanti, G. Antimicrobial activity of Epilobium spp. extracts. II Farmaco 2001, 56, 345–348. [Google Scholar]
  31. Grisey, E.; Laffray, X.; Contoz, O.; Cavalli, E.; Mudry, J.; Aleya, L. The bioaccumulation performance of reeds and cattails in a constructed treatment wetland for removal of heavy metals in landfill leachate treatment (Etueffont, France). Water Air Soil Pollut. 2012, 223, 1723–1741. [Google Scholar]
  32. Soda, S.; Hamada, T.; Yamaoka, Y.; Ike, M.; Nakazato, H.; Saeki, Y.; Kasamatsu, T.; Sakurai, Y. Constructed wetlands for advanced treatment of wastewater with a complex matrix from a metal-processing plant: Bioconcentration and translocation factors of various metals in Acorus gramineus and Cyperus alternifolius. Ecol. Eng. 2012, 39, 63–70. [Google Scholar]
  33. Faulwetter, J.L.; Gagnon, V.; Sundberg, C.; Chazarenc, F.; Burr, M.D.; Brisson, J.; Camper, A.K.; Stein, O.R. Microbial processes influencing performance of treatment wetlands: A review. Ecol. Eng. 2009, 35, 987–1004. [Google Scholar]
  34. Guittonny-Philippe, A.; Petit, M.E.; Masotti, V.; Monnier, Y.; Malleret, L.; Coulomb, B.; Combroux, I.; Baumberger, T.; Viglione, J.; Laffont-Schwob, I. Selection of wild macrophytes for their use in constructed wetlands for phytoremediation of contaminant mixtures. J. Environ. Manag. 2015, 147, 108–123. [Google Scholar]
  35. Haritash, A.K.; Kaushik, C.P. Biodegradation aspects of polycyclic aromatic hydrocarbons (PAHs): A review. J. Hazard. Mater. 2009, 169, 1–15. [Google Scholar]
  36. Megharaj, M.; Ramakrishnan, B.; Venkateswarlu, K.; Sethunathan, N.; Naidu, R. Bioremediation approaches for organic pollutants: A critical perspective. Environ. Int. 2011, 37, 1362–1375. [Google Scholar]
  37. Wasi, S.; Tabrez, S.; Ahmad, M. Toxicological effects of major environmental pollutants: An overview. Environ. Monitor. Assess. 2013, 185, 2585–2593. [Google Scholar]
  38. Banat, K.; Forstner, U.; Muller, G. Experimental mobilization of metals from aquatic sediments by nitrilotriacetic acid. Chem. Geol. 1974, 14, 199–207. [Google Scholar]
  39. Hernández-Soriano, M.D.C.; Degryse, F.; Smolders, E. Mechanisms of enhanced mobilisation of trace metals by anionic surfactants in soil. Environ. Poll. 2011, 159, 809–816. [Google Scholar]
  40. Thavamani, P.; Malik, S.; Beer, M.; Megharaj, M.; Naidu, R. Microbial activity and diversity in long-term mixed contaminated soils with respect to polyaromatic hydrocarbons and heavy metals. J. Environ. Manag. 2012, 99, 10–17. [Google Scholar]
  41. Radić, S.; Stipaničev, D.; Vujčić, V.; Rajčić, M.M.; Širac, S.; Pevalek-Kozlina, B. The evaluation of surface and wastewater genotoxicity using the Allium cepa test. Sci. Total Environ. 2010, 408, 1228–1233. [Google Scholar]
  42. Council Directive of 4 May 1976 on Pollution Caused by Certain Dangerous Substances Discharged into the Aquatic Environment of the Community (76/464/EEC); European Union: Brussels, Belgium, 18 May 1976.
  43. Caldelas, C.; Araus, J.L.; Febrero, A.; Bort, J. Accumulation and toxic effects of chromium and zinc in Iris pseudacorus L. Acta Physiol. Plant. 2012, 34, 1217–1228. [Google Scholar]
  44. Lotmani, B.; Fatarna, L.; Berkani, A.; Rabier, J.; Prudent, P.; Laffont-Schwob, I. Selection of Algerian populations of the Mediterranean saltbush, Atriplex halimus, tolerant to high concentrations of lead, zinc and copper for phytostabilization of heavy metal-contaminated soils. Eur. J. Plant Sci. Biotechnol. 2011, 5, 20–26. [Google Scholar]
  45. Dietz, A.; Schnoor, J.L. Advances in phytoremediation. Environ. Health Perspect. 2001, 109, 163–168. [Google Scholar]
  46. Pilon-Smits, E. Phytoremediation. Annu. Rev. Plant Biol. 2005, 56, 15–39. [Google Scholar]
  47. Schowanek, D.; David, H.; Francaviglia, R.; Hall, J.; Kirchmann, H.; Krogh, P.H.; Schraepen, N.; Smith, S.; Wildemann, T. Probabilistic risk assessment for linear alkylbenzene sulfonate (LAS) in sewage sludge used on agricultural soil. Regul. Toxicol. Pharmacol. 2007, 49, 245–259. [Google Scholar]
  48. Water Quality—Determination of Selected Elements by Inductively Coupled Plasma Optical Emission Spectrometry (ICP-OES); ISO 11885:2009; International Organization for Standardization (ISO): Geneva, Switzerland, 2009.
  49. Clesceri, L.S.; Greenberg, A.E.; Eaton, A.D. Methylene Blue Active Substances Method # 5540 C. In American Public Health Association, Standards Methods for the Examination of Water and Wastewater, 20th ed.; American Public Health Association (APHA): Washington, DC, USA, 1998; pp. 5–47. [Google Scholar]
  50. Holopainen, J.K.; Heijari, J.; Oksanen, E.; Alessio, G.A. Leaf volatile emissions of Betula pendula during autumn coloration and leaf fall. J. Chem. Ecol. 2010, 36, 1068–1075. [Google Scholar]
  51. Rabier, J.; Laffont-Schwob, I.; Pricop, A.; Ellili, A.; D’Enjoy-Weinkammerer, G.; Salducci, M.D.; Prudent, P.; Lotmani, B.; Tonetto, A.; Masotti, V. Heavy metal and arsenic resistance of the halophyte Atriplex halimus L. along a gradient of contamination in a French Mediterranean spray-zone. Water Air Soil Pollut. 2014, 225, 1993. [Google Scholar]
  52. Creus, C.M.; Sueldo, R.J.; Barassi, C.A. Shoot growth and water status in Azospirillum-inoculated wheat plantlets grown under osmotic and salt stresses. Plant Physiol. Biochem. 1997, 35, 939–944. [Google Scholar]
  53. Prasad, M.N.V. Heavy Metal Stress in Plants: From Biomolecules to Ecosystems, 2nd ed.; Springer-Verlag: Berlin, Germany, 2004; p. 462. [Google Scholar]
  54. Teuchies, J.; Jacobs, S.; Oosterlee, L.; Bervoets, L.; Meire, P. Role of plants in metal cycling in a tidal wetland: Implications for phytoremediation. Sci. Total Environ. 2013, 445–446, 146–154. [Google Scholar]
  55. Cheng, S.; Grosse, W.; Karrenbrock, F.; Thoennessen, M. Efficiency of constructed wetlands in decontamination of water polluted by heavy metals. Ecol. Eng. 2002, 18, 317–325. [Google Scholar]
  56. Liu, J.G.; Li, G.H.; Shao, W.C.; Xu, J.K.; Wang, D.K. Variations in uptake and translocation of copper, chromium and nickel among nineteen wetland plant species. Pedosphere 2010, 20, 96–103. [Google Scholar]
  57. Yadav, A.K.; Abbassi, R.; Kumar, N.; Satya, S.; Sreekrishnan, T.R.; Mishra, B.K. The removal of heavy metals in wetland microcosms: Effects of bed depth, plant species, and metal mobility. Chem. Eng. J. 2012, 211–212, 501–507. [Google Scholar]
  58. Ghaderian, S.M.; Ghotbi Ravandi, A.A. Accumulation of copper and other heavy metals by plants growing on Sarcheshmeh copper mining area, Iran. J. Geochem. Explor. 2012, 123, 25–32. [Google Scholar]
  59. López-Millán, A.F.; Sagardoy, R.; Solanas, M.; Abadía, A.; Abadía, J. Cadmium toxicity in tomato (Lycopersicon esculentum) plants grown in hydroponics. Environ. Exp. Bot. 2009, 65, 376–385. [Google Scholar]
  60. Mishra, S.; Srivastava, S.; Tripathi, R.D.; Kumar, R.; Seth, C.S.; Gupta, D.K. Lead detoxification by coontail (Ceratophyllum demersum L.) involves induction of phytochelatins and antioxidant system in response to its accumulation. Chemosphere 2006, 65, 1027–1039. [Google Scholar]
  61. Shaibur, M.R.; Kawai, S. Effect of arsenic on visible symptom and arsenic concentration in hydroponic Japanese mustard spinach. Environ. Exp. Bot. 2009, 67, 65–70. [Google Scholar]
  62. Singh, A.K. Effect of trivalent and hexavalent chromium on spinach (Spinacea oleracea L). Environ. Ecol. 2001, 19, 807–810. [Google Scholar]
  63. Rabier, J.; Laffont-Schwob, I.; Bouraïma-Madjèbi, S.; Léon, V.; Prudent, P.; Viano, J.; Nabors, W.M.; Pilon-Smits, E.A.H. Characterization of metal tolerance and accumulation in Grevillea Exul VAR Exul. Int. J. Phytoremediat. 2007, 9, 419–435. [Google Scholar]
  64. Küpper, H.; Küpper, F.; Spiler, M. Environmental relevance of heavy metal substituted chlorophylls using the example of submersed water plants. J. Exp. Bot. 1996, 47, 259–266. [Google Scholar]
  65. Küpper, H.; Šetlík, I.; Spiller, M.; Küpper, F.C.; Prášil, O. Heavy metal-induced inhibition of photosynthesis: Targets of in vivo heavy metal chlorophyll formation. J. Phycol. 2002, 38, 429–441. [Google Scholar]
  66. Thomas, G.; Stärk, H.J.; Wellenreuther, G.; Dickinson, B.C.; Küpper, H. Effects of nanomolar copper on water plants-Comparison of biochemical and biophysical mechanisms of deficiency and sublethal toxicity under environmentally relevant conditions. Aquat. Toxicol. 2013, 140–141, 27–36. [Google Scholar]
  67. Tremblay, N.; Wang, Z.; Cerovic, Z.G. Sensing crop nitrogen status with fluorescence indicators. A review. Agron. Sustain. Dev. 2012, 32, 451–464. [Google Scholar]

