Article

Development of a Comprehensive Fouling Model for a Rotating Membrane Bioreactor System Treating Wastewater

Water Sustainability Research Centre, Department of Mechanical, Aerospace, and Civil Engineering, Brunel University London, Uxbridge, Middlesex UB8 3PH, UK
*
Author to whom correspondence should be addressed.
Water 2015, 7(2), 377-397; https://doi.org/10.3390/w7020377
Submission received: 28 November 2014 / Accepted: 9 January 2015 / Published: 23 January 2015
(This article belongs to the Special Issue Water Quality Control and Management)

Abstract

:
Membrane bioreactors (MBRs) are now main stream wastewater treatment technologies. In recent times, novel pressure driven rotating membrane disc modules have been specially developed that induce high shear on the membrane surface, thereby reducing fouling. Previous research has produced dead-end filtration fouling model which combines all three classical mechanisms that was later used by another researcher as a starting point for a greatly refined model of a cross flow side-stream MBR that incorporated both hydrodynamics and soluble microbial products’ (SMP) effects. In this study, a comprehensive fouling model was created based on this earlier work that incorporated all three classical fouling mechanisms for a rotating MBR system. It was tested and validated for best fit using appropriate data sets. The initial model fit appeared good for all simulations, although it still needs to be calibrated using further appropriate data sets.

1. Introduction

Membrane bioreactors (MBRs) are now main stream wastewater treatment technologies used extensively for both municipal and industrial situations. In recent times pressure driven rotating membrane disc modules have been specially developed that have high shear effects on the membrane surface thereby reducing associated fouling whilst minimising energy usage. These systems have been shown to yield high permeate flux in the ultra-filtration range [1]. The reason for their good performance is the very high shear rate of approximately 2 × 10⁵ s−1 which prevents cake formation and concentration polarisation [2]. However, this is not limited to rotating MBRs only. Vibration systems are known to also produce high shears with a maximum membrane shear rate of 1.4 × 10⁵ s−1 for fluids having viscosities comparable to that of water [2,3]. The shear rate at the membrane in these vibratory systems is created by the inertia of the retentate which moves at 180 degrees out of phase with the membrane and is a sinusoidal time variant [2]. Rotary filtration systems come in many forms, some of which are bespoke where a rotating disc operates near a stationary circular membrane disc or systems where the membrane module rotates on a single shaft driven by a motor. Experimental studies reported so far include filtration of mineral suspension [4], black liquor [1] and skimmed milk [5]. Sarkar and Bhattacharjee [6] presented a semi analytical model based on the evaluation of back transport flux, which was later refined by Sarkar et al. [7]. Conversely the shear stresses occurring near the surface of a rotating disc located adjacent to a stationary circular membrane encased in a cylindrical housing was modelled by means of computational fluid dynamics by Torras et al. [8]. A similar study for a rotational cross-flow membrane bioreactor was undertaken by Bentzen et al. [9]. In a related study, Engler and Mark [10] investigated the fouling mechanism of a rotating membrane disc as a function of operating conditions. Finally, using rotating ceramic membrane discs which were fouled by sludge, Jørgensen et al. [11] showed the dependence of shear on fouling and ultimately presented a model that linked the shear rate to the limiting flux.
Unfortunately like any other system filtering activated sludge, a defining issue of rotating membrane systems is the decline of permeate flux with time. This is mostly attributed to the phenomenon known as concentration polarisation with associated fouling problems. The true origin of fouling has yet to be fully defined, although many researchers widely acknowledge that SMP (soluble microbial products) and EPS (extracellular polymeric substances) are the most likely fouling agents [12]. This is since the build-up of SMP and EPS can cause reduction in membrane permeability [13,14]. Additional factors affecting fouling mechanisms include; Scaling, biofilm formation, operating conditions such as pH, temperature and flow rates, solution properties such as particle size distribution [12]. Different approaches have also been developed for modelling the physical and biological aspects of membrane fouling in a normal non-rotating MBR system. A main one was developed by Hermia [15] where a power law model is used to distinguish between different fouling mechanisms, namely cake filtration, intermediate pore blockage, pore constriction and complete pore blockage. Meng et al. [16] established the fractal permeation model while Liu et al. [17] presented the empirical hydrodynamic model. Furthermore, Duclos-Orsello et al. [18] introduced a dead-end filtration fouling model that combined the first three classical fouling mechanisms mentioned by Hermia [15] that was later used by Paul [19] as a starting point for a greatly refined model for a cross flow side-stream MBR that incorporated both hydrodynamics and SMP effects.
Despite several experimental studies, modelling and simulation of a rotating membrane module is still a nascent topic to date. This is mainly attributed to the poor understanding and great complexity of the hydrodynamics involved. Since mathematical modelling can be used to simulate flux decline and thus potentially afford a greater understanding of the membrane fouling mechanisms involved, the aims of this research work was to create: (i) A fully comprehensive fouling model incorporating all three classical fouling mechanisms for a rotating MBR system; (ii) The model would also incorporate the rotational hydrodynamics and SMP effects; and (iii) Full data sets would be used to validate and calibrate it under short and medium term filtration conditions.

2. Theoretical Modelling Approach

Using the power law for non-Newtonian fluids, such as activated sludge, the viscosity (Pa s) of mixed liquor suspended solids (MLSS) in a MBR is proportional to the shear rate as depicted in Equation (1) [9].
μ = m γ ˙ n 1
To calculate the shear rate over the rotating membrane, consideration must be given to the type flow through the membrane module. The shear rate based on different flow regimes is computed using Equation (2) [20].
if ,   { Re NN 2 · 10 5 ,   l a m i n a r   f l o w ,   γ ˙ = 1.81 · ( k ω · ω ) 1.5 · r o · ν 0.5 Re NN 2 · 10 5 ,   t u r b u l e n t   f l o w ,   γ ˙ = 0.057 · ( k ω · ω ) 1.8 · r o 1.6 · ν 0.8
Firstly, it was assumed that the pores were cylindrical and uniformly distributed throughout the membrane, so that fluid flow could be described by Hagen-Poiseuille flow. Hence, pore constriction occurs through all open pores, and gradually the membrane surface becomes obstructed by aggregates forming a somewhat uneven blocked area. Once the pores are blocked by aggregates pore constriction is stopped. Consequently, a cake layer will form over any blocked area. The resistance of this deposit layer is time dependent with regions of greatest resistance delivering the smallest flux. However, in reality the actual membrane fouling process is extremely complex in nature with usually all effects simultaneously occurring. Nevertheless, to simplify the model the above assumptions are made as well as overlooking the effect of frictional forces and temperature. Figure 1 shows the combined fouling mechanisms in the model.
Figure 1. Diagram of the combined fouling mechanisms. Colloids or small particles constrict the pores while larger particles blocked them, forming a cake.
Water 07 00377 g001
In a similar manner to the reformulation of the Duclos-Orsello et al. [18] model undertaken by Paul [19], the bulk concentration Cb (g/L) is replaced by the MLSS concentration, CMLSS (g/L). Although in order to facilitate later model descriptions, the term Cb does still appear in later discussions.
Assuming the membrane rotates around a fixed axis (here defined as an imaginary straight line passing through the shaft) with angular velocity, ω, and using the pore constriction model, the unblocked flux, Ju (m s−1), is defined as a function of time within the unblocked area, A u (m2), as shown in Equation (3) [18,19].
J u ( t ) J 0 = 1 ( 1 + β · Q 0 · C MLSS · t ) 2 ;  where β = σ a   π · ( r p ) 2 · δ m J u ( t ) = r 0 . k ω . ω ( 1 + β · Q 0 · C MLSS · t ) 2 ;  where J 0 = r 0 · k ω · ω 
As the membrane fouls with time, the unblocked area also decreases at the same rate, and the rate of unblocked area reduction is given in Equation (4).
dA u A u = α · C MLSS . r 0 · k ω · ω ( 1 + β · Q 0 · C MLSS · t ) 2 dt
Assuming that at time t = 0, the initial unblocked area through the membrane is Au0 (m2), then by integrating Equation (4) between the time filtration boundaries, Equation (5) is derived.
A u ( t ) = A u 0 · e α · r 0 · k ω · ω β · Q 0 . ( 1 1 + β · Q 0 · C MLSS · t 1 )
By combining Equations (3) and (5), the volumetric flow rate (Qu, m3/s) through open pores can be calculated as shown in Equation (6).
Q u ( t ) = A u ( t ) · J u ( t ) = A u 0 · r 0 · k ω · ω ( 1 + β · Q 0 · C MLSS · t ) 2 . e { α · r 0 · k ω · ω β · Q 0 . ( 1 1 + β · Q 0 · C MLSS · t 1 ) }
The blocked flux, Jb (m.s−1), can be calculated from Equation (7) using Darcy’s law and a resistance in-series approach, whilst the trans-membrane pressure (TMP), can be expressed in terms of density and angular velocity in Equation (8) [20].
J b = TMP μ · ( R in , b + R b )
TMP = PT ( 1 4   · ρ f · ( k ω · ω · r o ) 2 )
Once the pore constriction stops at time, tb, the time at which a pore was first blocked, Rin,b can be calculated from Equation (9) [18].
R in , b = R m ( 1 + β · Q 0 · C MLSS . t b ) 2
The resistance of the particles deposited increases with time due to the growth in mass (or thickness) of the cake layer, and within the cake filtration model, the resistance Rb is determined in Equation (10).
dR b dt = f · R · J b · C MLSS
Assuming, no loss in area, the blocked area, Ab (m2), is given by Equation (11), and is directly proportional to the unblocked area Au (m2) at time tb.
dA b dt b = dA u dt b  A b ( t b ) = 0 t ( A u 0 · α · C MLSS · r′ 0 · k ω · ω ( 1 + β · Q 0 · C MLSS · t b ) 2 . e { α . r′ 0 . k ω . ω β · Q 0 . ( 1 1 + β · Q 0 · C MLSS ·  t b 1 ) } ) dt b
At low rotational speeds, the flow is considered laminar and by combining Equations (1), (2), (7)–(9) and (11), the volumetric flow rate (Qb, m3/s) through the blocked pores is given by Equation (12).
Q b ( t ) = PT ( 1 4   · ρ f . ( k ω · ω · r o ) 2 )   m · ( 1.81 · ( k ω · ω ) 1.5 · r o · ν 0.5 ) n 1 . ( R m ( 1 + β · Q 0 · C MLSS · t b ) 2 + R b ) . 0 t ( A u 0 · α · C MLSS · r′ 0 · k ω · ω ( 1 + β · Q 0 · C MLSS · t b ) 2 · e { α · r′ 0 · k ω · ω β · Q 0 · ( 1 1 + β · Q 0 · C MLSS ·  t b 1 ) } ) dt b
Hence the total volumetric flow rate through the membrane is expressed as the summation of the flow rate through the unblocked Qu and blocked Qb pores respectively as shown in Equation (13).
Q t = A u 0 · r 0 · k ω · ω   ( 1 + β · Q 0 · C MLSS · t ) 2 . e { α · r 0 · k ω · ω β · Q 0 . ( 1 1 + β · Q 0 · C MLSS · t 1 ) } +   PT ( 1 4   . ρ f . ( k ω . ω . r o ) 2 )   m · ( 1.81 · ( k ω · ω ) 1.5 · r o · ν 0.5 ) n 1 · ( R m ( 1 + β · Q 0 · C MLSS · t b ) 2 + R b ) · 0 t ( A u 0 · α · C MLSS · r′ 0 · k ω · ω ( 1 + β · Q 0 · C MLSS · t b ) 2 . e { α · r′ 0 · k ω · ω β · Q 0 . ( 1 1 + β · Q 0 · C MLSS · t b 1 ) } ) dt b

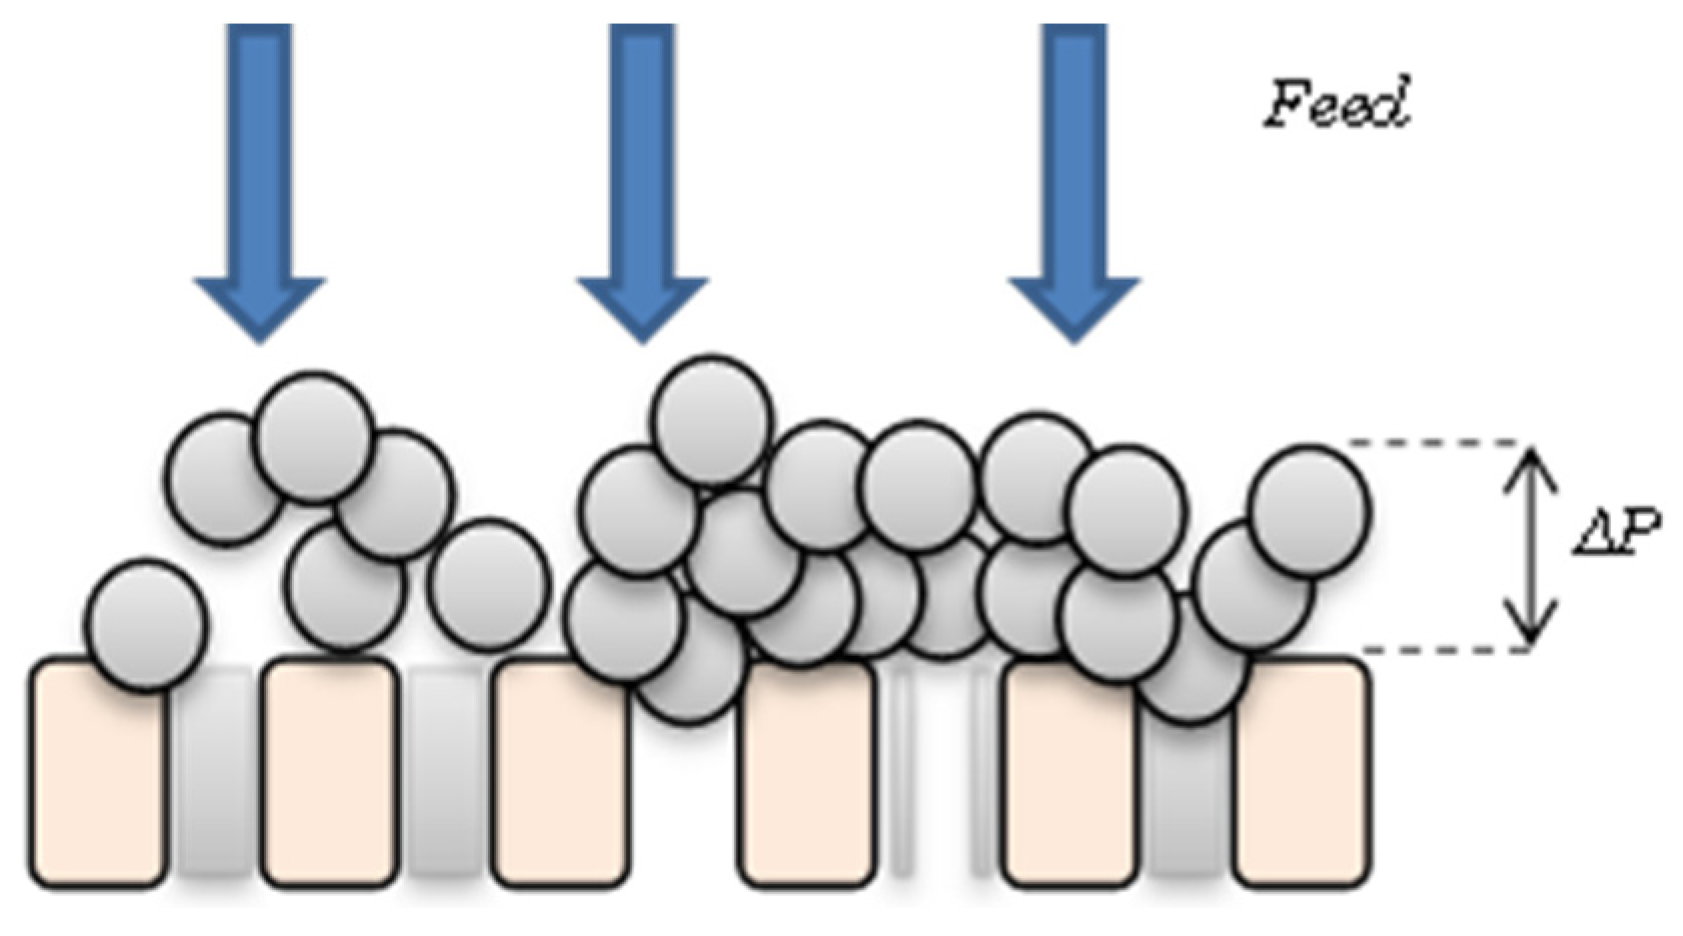
2.1. Hydrodynamic Regime

When describing the hydrodynamic regime in this model, the air scouring flux, Jair (m/s), is a key parameter for the management and prevention of membrane fouling in most submerged MBR systems. As such, cake layer growth rate depends on the scouring energy induced by the aeration. Furthermore, rotation in rotating MBRs produces a torque which induces additional shear effects to reduce fouling on the membrane surface. Rightfully so, since the rotating MBR has a very low rotational speed of 2.09 rad/s (or 20 revolutions per minute), the aforementioned scenario and ensuing equations will be correct. However, it is worth mentioning that at very high rotational speeds there is a high possibility that the air scouring effect will be significantly much less than that induce by rotation. The net total effect on the membrane responsible for reducing fouling can tentatively be calculated by the summation of the air scouring and rotational effects. However in hindsight, at some point during the filtration process, these two effects work in opposite directions. This fact alone ultimately poses a physical limitation to the model since a completely isolated hydrodynamic study of the shear stresses will be required, which is not the scope of this study. In the aforementioned scenario, the cake’s resistance is consequently decreased to allow the system to gain flux due to these membrane cleaning effects. To account for these changes, an additional removal term was added to the rate of membrane blocked area as shown in Equation (14), and was defined as the flux induced by the air scouring flow combined with rotational effects. This additional removal term is also in-line with Liang et al. [21] cake’s formulation equation which accounted for the change in reversible fouling due to cake build-up. An analogous reformulation is found in Equation (14) but includes air scouring and rotational effects.
dR b dt = f · R · J b · C MLSS g o · ( α v · J air k ω · ω · r o ) · δ · R c
Subsequently, the blocked area, Ab (m2), is mathematically given by Equation (15).
dA b dt = α · J u · A u · C MLSS k A b · ( α v · J air k ω · ω · r o ) · θ c ( t )

2.2. Soluble Microbial Products’ (SMP) Inclusion

To account for variations in the sludge properties, it was assumed that the concentration of MLSS as CMLSS was directly proportional to the concentration of SMPs, CSMP, on the membrane surface. CSMP (g/L) is calculated in accordance with the model of Giraldo and Le Chevallier [22] as shown in Equation (16).
C SMP = C b · e k i · θ c J m 0
Thus, differentiating Equation (3) yields the unblocked flux in Equation (17) with SMP effects included.
dJ u dt = 2 · β · Au 0 · ( ϵ smp · C b · e k i . θ c J m 0 ) . ( r′ 0 · k ω · ω ) 2 · 1 ( 1 + β · Q 0 · ( ϵ smp · C b · e k i · θ c J m 0 ) · t ) 3

2.3. Constant Flow/Varying Trans-Membrane Pressure (TMP) Mode

As TMP increases, the total available area for permeate will decrease at a uniform rate such that there exists a time constant, tc (s−1) < 1/t, that yields Equation (18) where the time constant is proportional to initial flux.
A = A 0 ( 1 t c · t ) = A 0 ( 1 K α · Jm o · t )
Using a Taylor’s expansion of order 1, Equation (18) reduces conveniently into Equation (19).
A = A 0 · ln ( e · ( 1 K α · Jm o · t ) ) A 0 · e ( K α · Jm o · t )
However, this reformulation has an extreme limitation in that simulated values will be under estimated after a certain period of time due to the truncation induced by the Taylor’s expansion term. For the same Kα, both the reformulation and original area model will exhibit almost similar behaviour so long as the following is true: 0 < K α · Jm o · t 0.1 K α 0.1 Jm o · t ; Outside this range, it is expected that large errors of more than 10% would occur.
In this model and as experienced in practice, as the pore constriction continues, there is an exponential increase in TMP. Since total membrane resistance (Rtotal) is the summation of cake’s resistance and all other mechanisms, this is approximated in the model as a constant term known as φ as shown in Equation (20).
R total = ( R in , b + φR c )
Equation (21) is yielded by using Darcy’s law and differentiating the TMP with respect to filtration time, t.
μ A 0 . ( lim · t 0 ( Q t ) ) = A A 0 . ( d ( TMP ) dt . ( 1 R total ) + TMP . d ( 1 R total ) dt )
Since the flow, Q (m3/s), is kept constant, dQ/dt = 0, and thus combining Equations (19)–(21), yields the final and full model formulation shown in Equations (22) and (23). Equation (22) also includes the specific cake resistance (m−2) formulation via the Carman–Kozeny equation [22]. It was assumed that the particles forming the sludge floc are spherical in shape. In reality however, characteristics of activated sludge floc viewed under the microscope show a varying difference in the particles’ shape. Thus, this assumption induces a limitation to the derived model.
TMP ( t ) = TMP 0 . ( R m · ( ( 1 + β · Q 0 · C MLSS · t b ) 2 1 ) + φ · ( 180 · ( 1 ε c ) 2 d pi 2 · ε c 3 · C d · Jm o · t ( 1 τ ) · ρ b ) + R t 0 )   ( 1 K α . Jm o . t ) . R t 0
PT ( t ) = 1 4 · ρ f · ( k ω · ω · r o ) 2 μ · Jm o · e ( K α · Jm o · t ) · ( R m · ( ( 1 + β · Q 0 · C MLSS · t b ) 2 1 ) + φ · ( 180. ( 1 ε c ) 2 d pi 2 · ε c 3 · C d · Jm o · t ( 1 τ ) · ρ b ) + R t 0 )

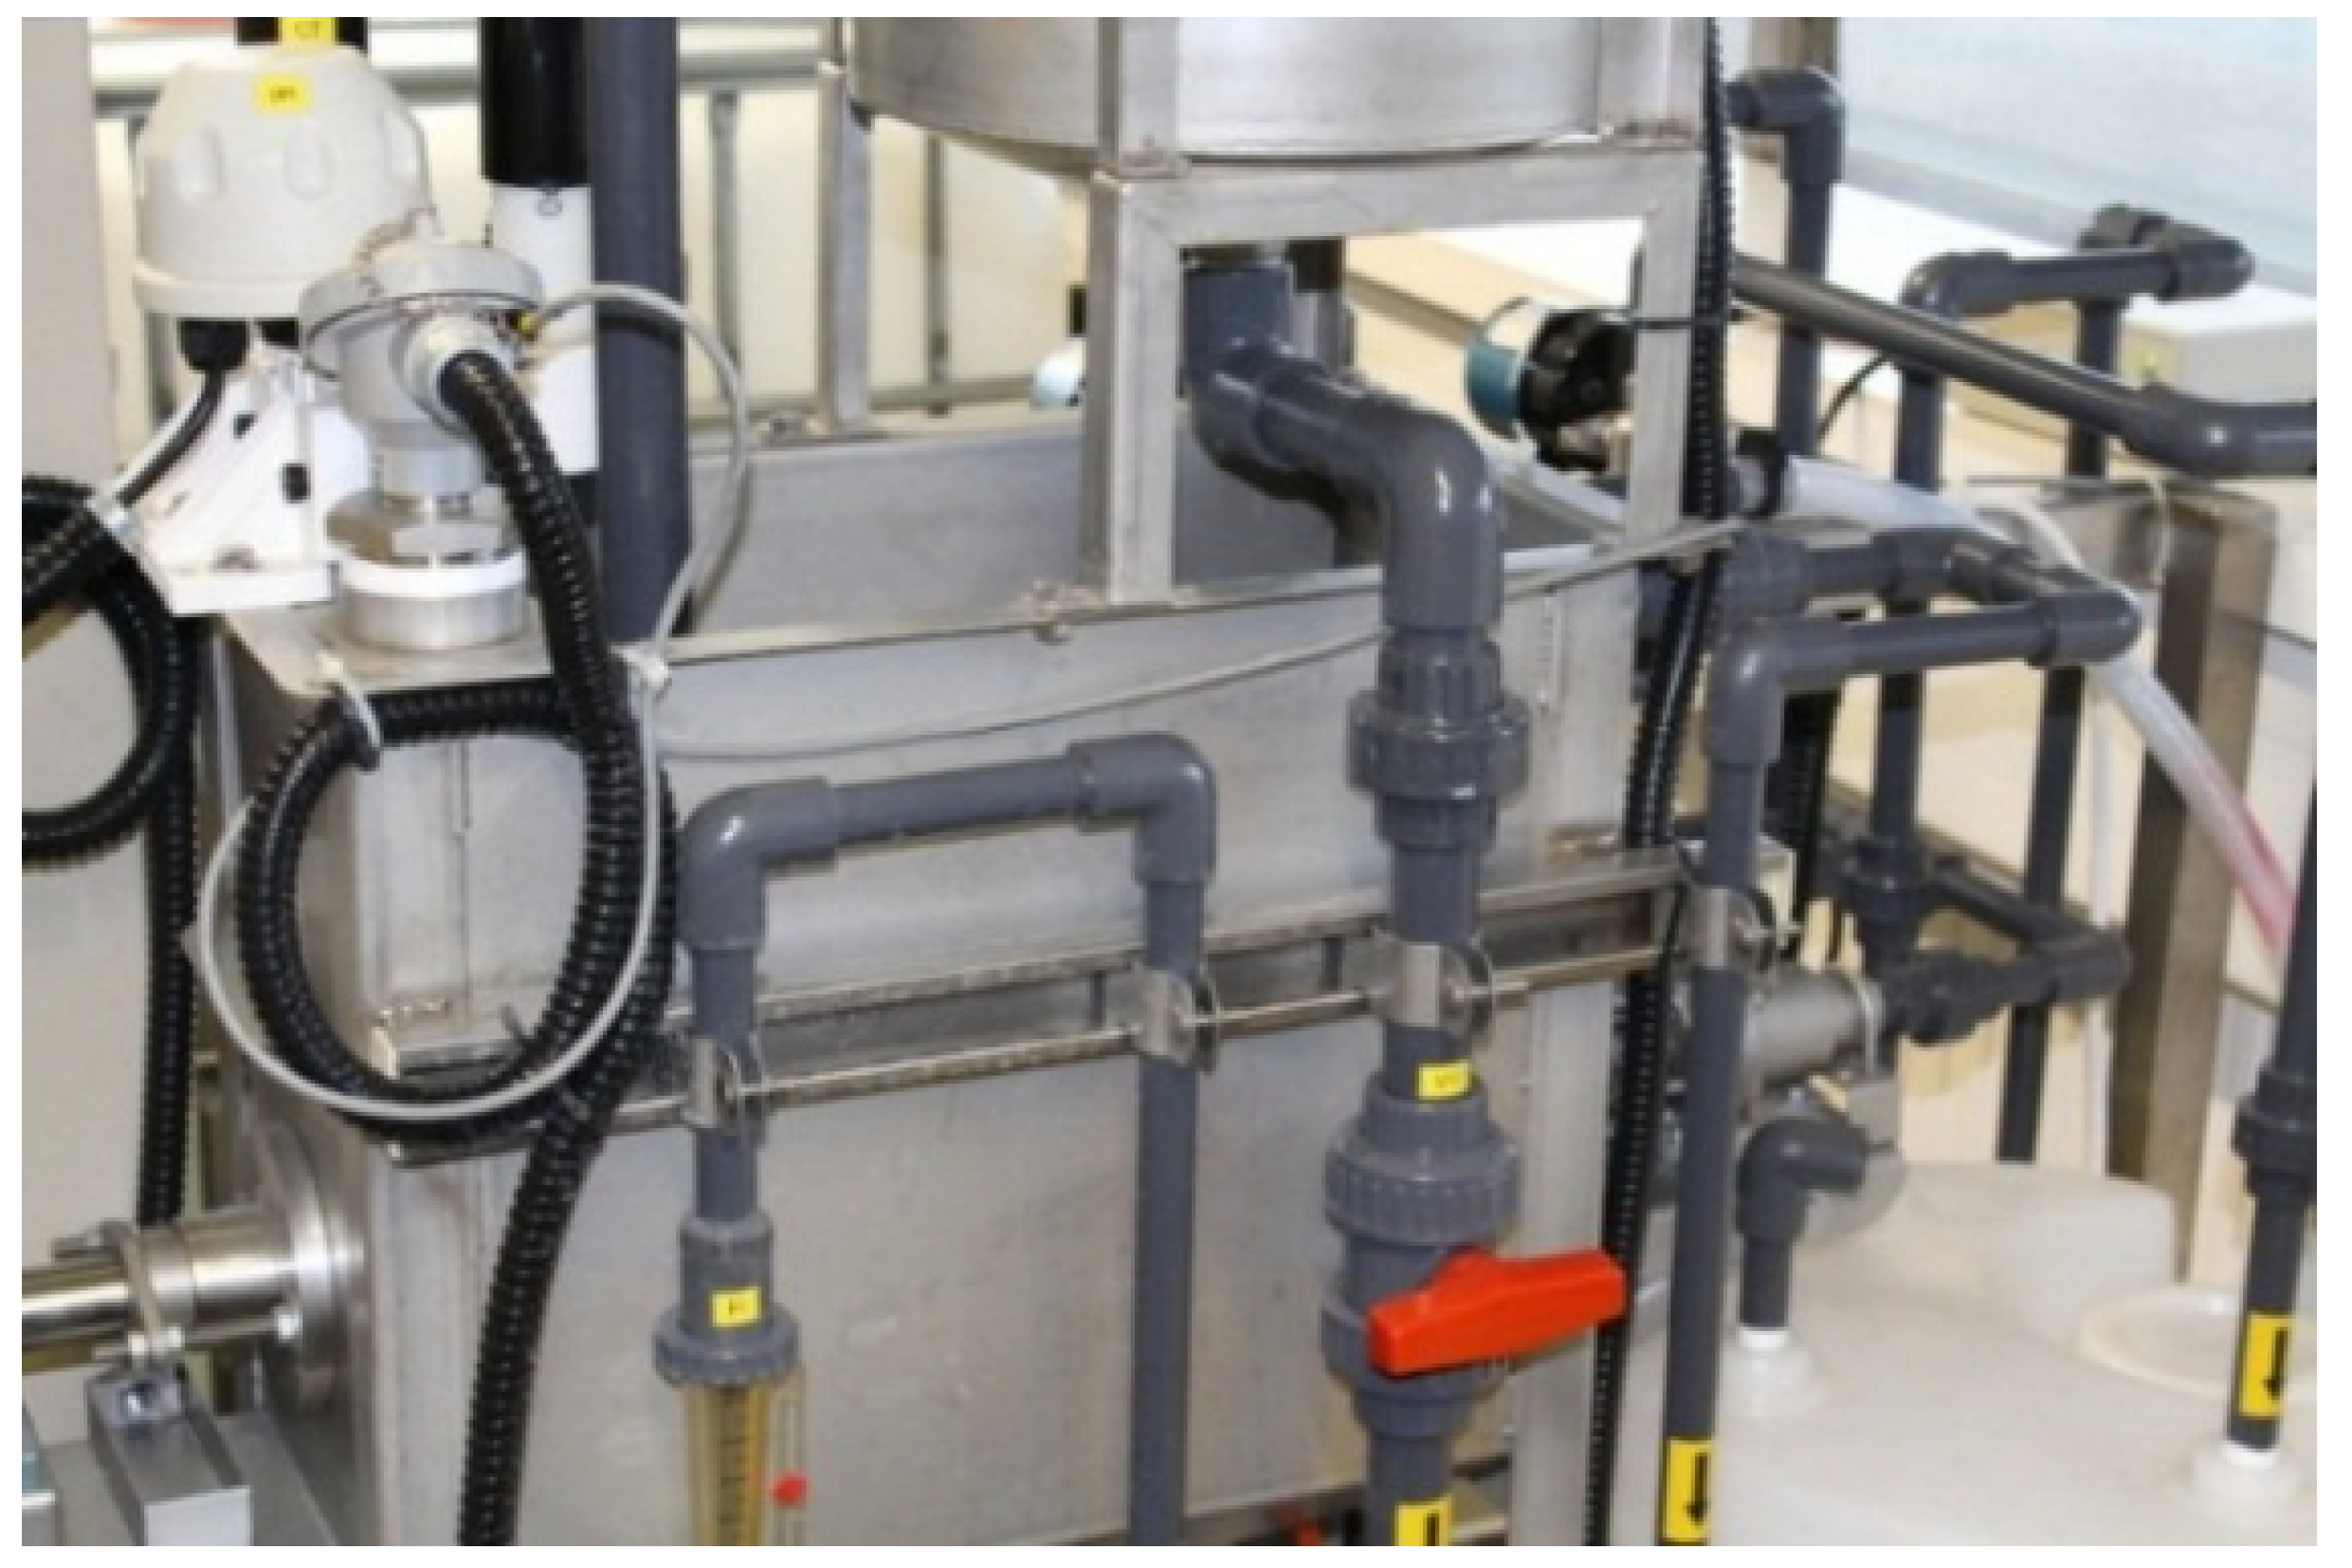
3. Materials and Methods
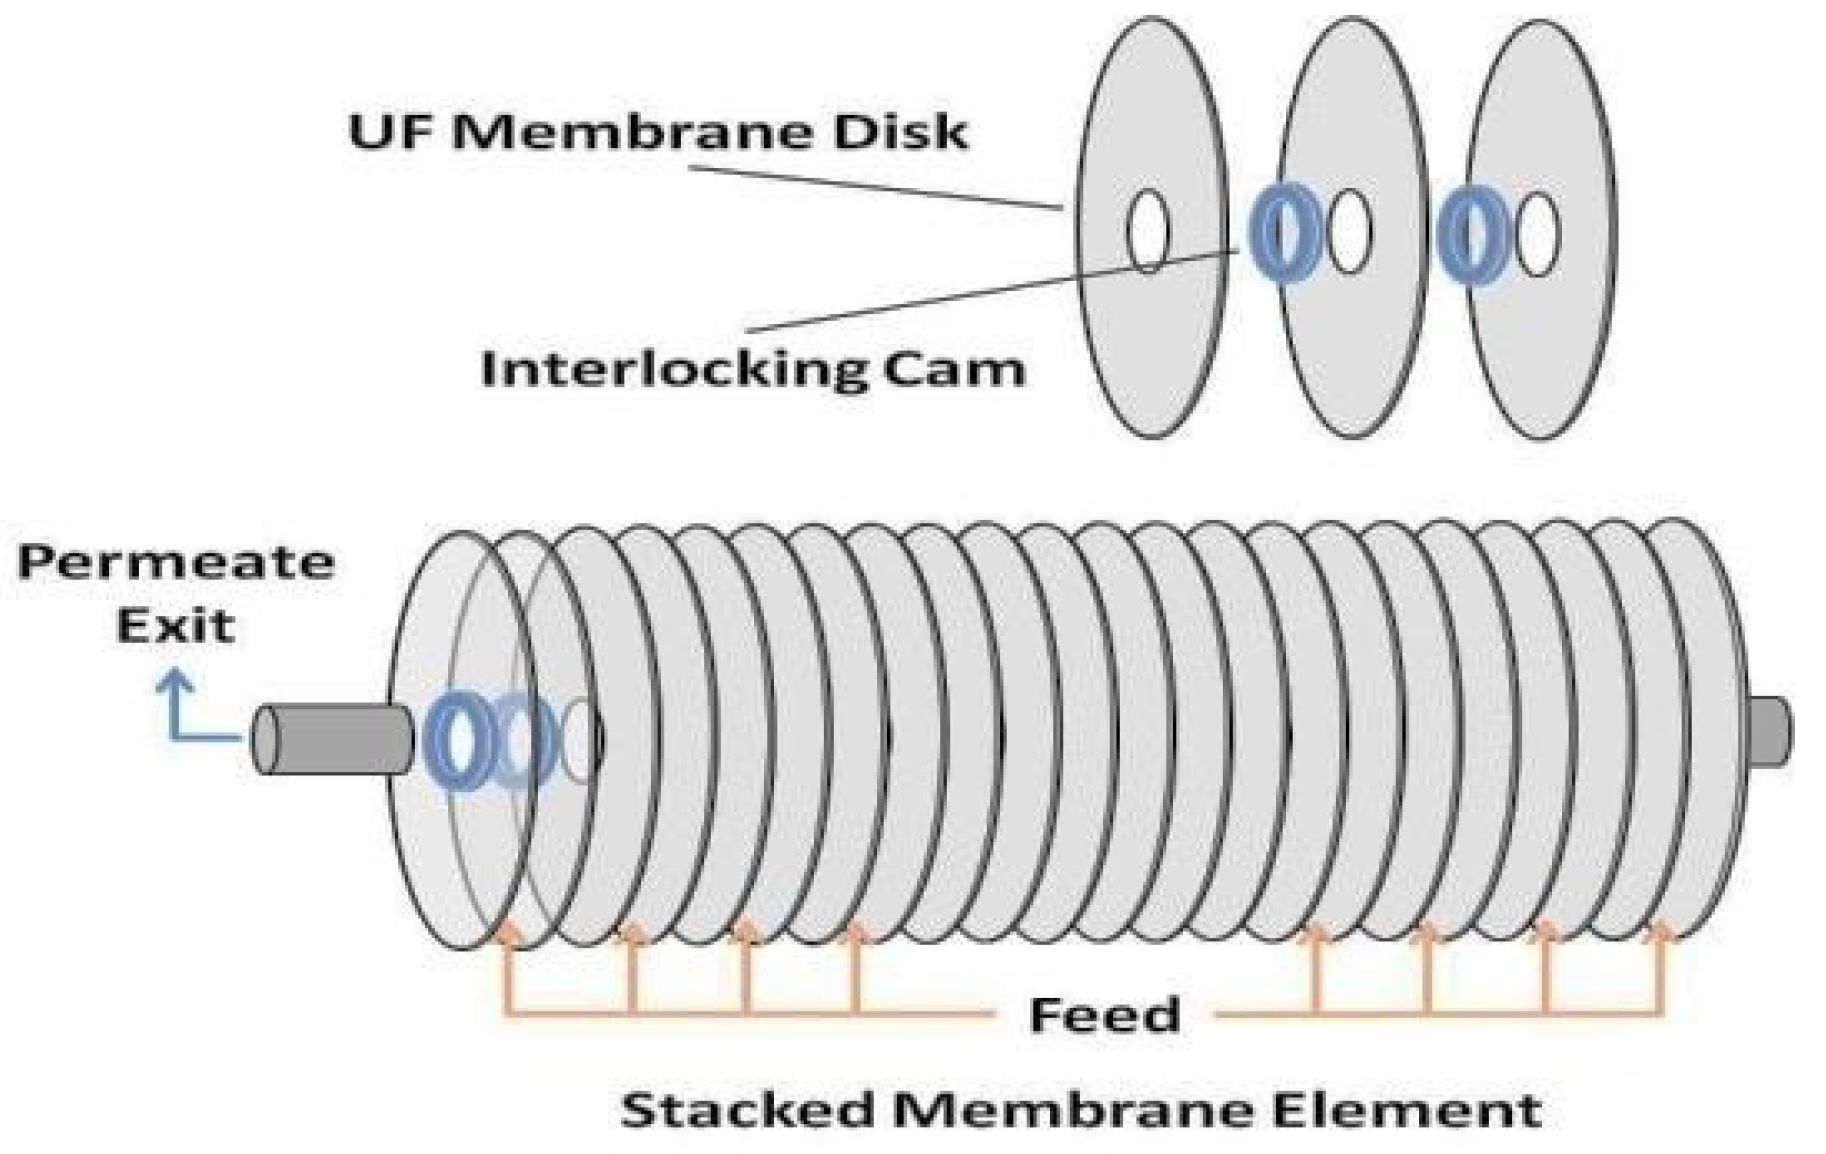
3.1. Materials

The rotating MBR pilot unit used to generate short and medium term filtration data for testing of the fouling model consisted of a ultra-filtration (UF) module of 36 circular flat membrane sheets as shown on Figure 2 (FUV-185-A15R Flexidisks by Avanti Membrane Technology, Walnut, CA, USA). These circular membrane sheets were attached to a single shaft rotating via an electrical motor with an operational speed of 20 revolutions per minute (RPM). Each membrane sheet in disc form was composed of hydrophilic, low fouling PVDF (Polyvinylidene Fluoride) with the manifold that collected the permeate flow being located in the single shaft. TMP, dissolved oxygen levels, temperature, pH, permeate flux and air scouring flow rates were all measured and logged automatically by the pilot unit itself (RPU-185 Flexidisks MBR System by Avanti Membrane Technology, Walnut, CA, USA). The viscosity of the fluid was measured daily by the aid of rotating viscometers (Rotary-Viscometer ASTM by PCE Instruments UK Ltd, Southampton, UK and High Shear CAP-2000+ by Brookfield Viscometers Ltd, Essex, UK); while the MLSS concentration was constantly logged by a MLSS analyser (GE-138 MLSS Suspended Solids Sludge Concentration Meter Analyser Monitor by A. Yite Technology Group, Wanchai, Hong Kong).
Figure 2. Rotating membrane module FUV-185-A15R manufactured by Avanti Membrane Technology, Walnut, CA, USA.
Water 07 00377 g002
Manufactured in Taiwan, this unique, bespoke pilot unit was designed as a research tool and included all data logging and measuring system interfaces. An anoxic tank was also included for de-nitrification experiments but this option was never used for the data sets used in this study. Figure 3 shows a partial picture and set-up of this research rig in operation.
Figure 3. Partial picture and set-up of the rotating membrane bioreactor (MBR) system RPU-185 (Avanti Membrane Technology, Walnut, CA, USA) in operation. The membrane module is located in the batch tank for filtration purposes.
Water 07 00377 g003
Table 1 shows this unit’s membrane dimensioning and a general overview of the operating conditions of the MBR system as provided by the manufacturer.
Table 1. Dimensions and operating conditions of the FUV-185-A15R Flexidisks.
DescriptionUnitValues
Membrane outer diameterm0.177
Membrane inner diameterm0.055
Membrane area m21.6006
Angular velocityrad/s2.094
Permeate fluxL.m2.H−1Up to 50
TSS (Total suspended solids)g L−18–30
Transmembrane pressurebar≤2

3.2. Filtration Experiments

This MBR plant was initially seeded with activated sludge supplied by Thames Water (UK) and was semi-batch fed a synthetic wastewater made up using a standard recipe to mimic an influent source. MLSS concentrations were kept between the range of 3.34 and 4.26 g/L by periodic excess sludge wasting. The influent had an average pH of 8.2 and experiments were carried out at constant room temperature (23 °C).

3.2.1. Shear and Viscosity Experiments

Using the Brookfield rotating viscometer (mentioned in Section 3.1) which also acted as rheometer, measurements were taken following protocols in-line with Yang et al. [23] and Ratkovich et al. [24]. The readily designed software program for the apparatus was used for system control and collection of data. The sludge was tested at constant room temperature of 23 °C at MLSS of 4.26 g/L (although data points at MLSS range of 3.2–4.6 g/L were also analysed). Additionally, the shear stress and viscosity were carefully tested in shear rate range of 10–350 s−1. Although full on rheology tests were not carried on the activated sludge to ascertain its properties more precisely, the data collected appeared consistent. It should be noted that at MLSS of 3.34 g/L, the viscosity readings were largely similar to those measured at 4.26 g/L with a deviation of roughly 4% on the data. Thus, both yielded fairly similar m and n values which were kept constant during simulation and this was further confirmed via sensitivity analysis (data obtained is further discussed in Section 4).

3.2.2. Flux Steps Filtration Tests

Flux steps tests were carried out using standard protocols in-line with Le Clech et al. [25], with four flux steps being carried out for each variation in MLSS concentration. Flux steps up were carried out at constant TMPs of 15, 30, 45 and 58 kPa. The corresponding initial flow rates were respectively 1 × 10⁻⁵, 1.83 × 10⁻⁵, 2.25 × 10⁻⁵ and 2.75 × 10⁻⁵ m3/s. Although data was constantly being logged, for the sake of simplicity and to keep model computation time down to a minimum, only the average data point for every 5 min of filtration time was actually used in the simulation study with the total filtration period being two hours. This meant a total of 25 data points were generated for each individual MLSS concentration. After each flux step testing, a chemical backwash was carried out with 125 mg/L worth of sodium hypochlorite solution and the membrane resistance was calculated to measure the extent of irreversible fouling. On unit start up, the clean membrane resistance was determined to be 6.26 × 10¹¹ m−1, while the cake water content, τ, was found to be 0.456 on average.

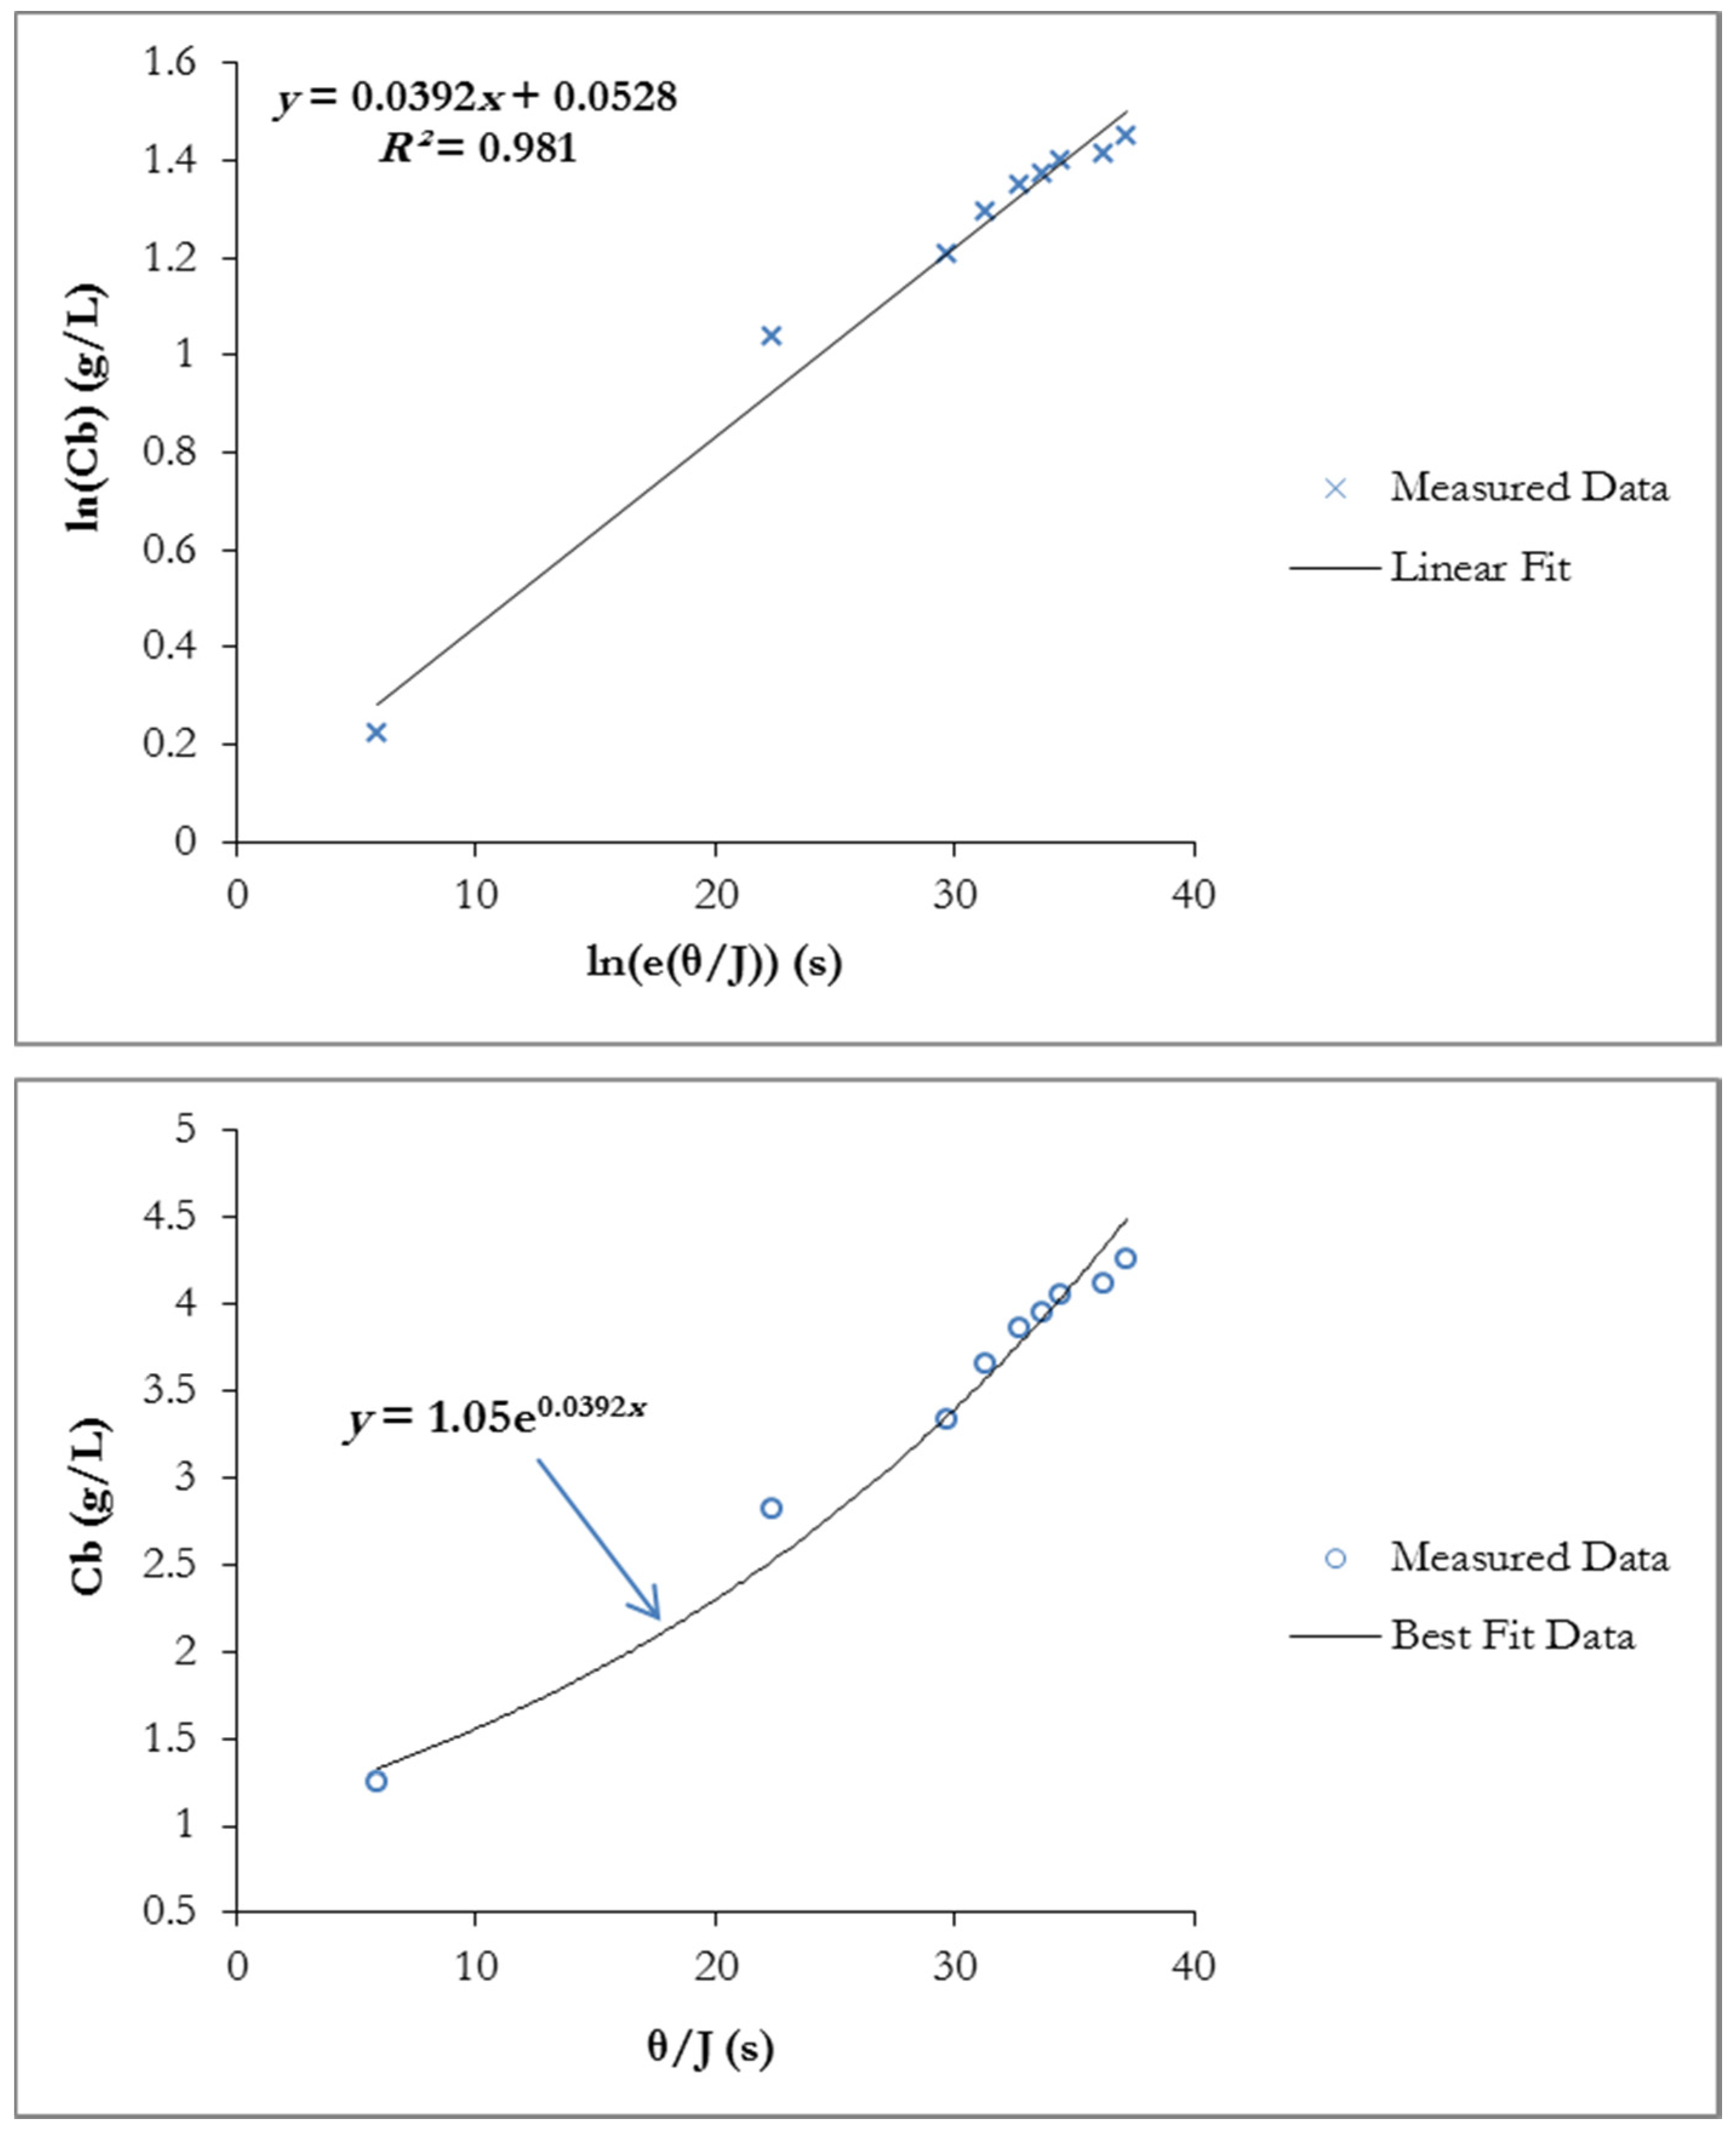
3.2.3. SMP Inclusion Experiments

In order to study the implications of foulants (i.e., SMPs) and cake formation in relation to the MLSS concentration, after a filtration process, the total cake thickness was measured for desired bulk MLSS concentration used and was then divided by flux. This value was later referred to as cake thickness ratio. The MLSS concentrations used for cake thickness measurements varied from 1.2 to 4.3 g/L. The initial flow rate starting was 1 × 10⁻⁵ m3/s and MBR was operated under constant TMP of 15 kPa.

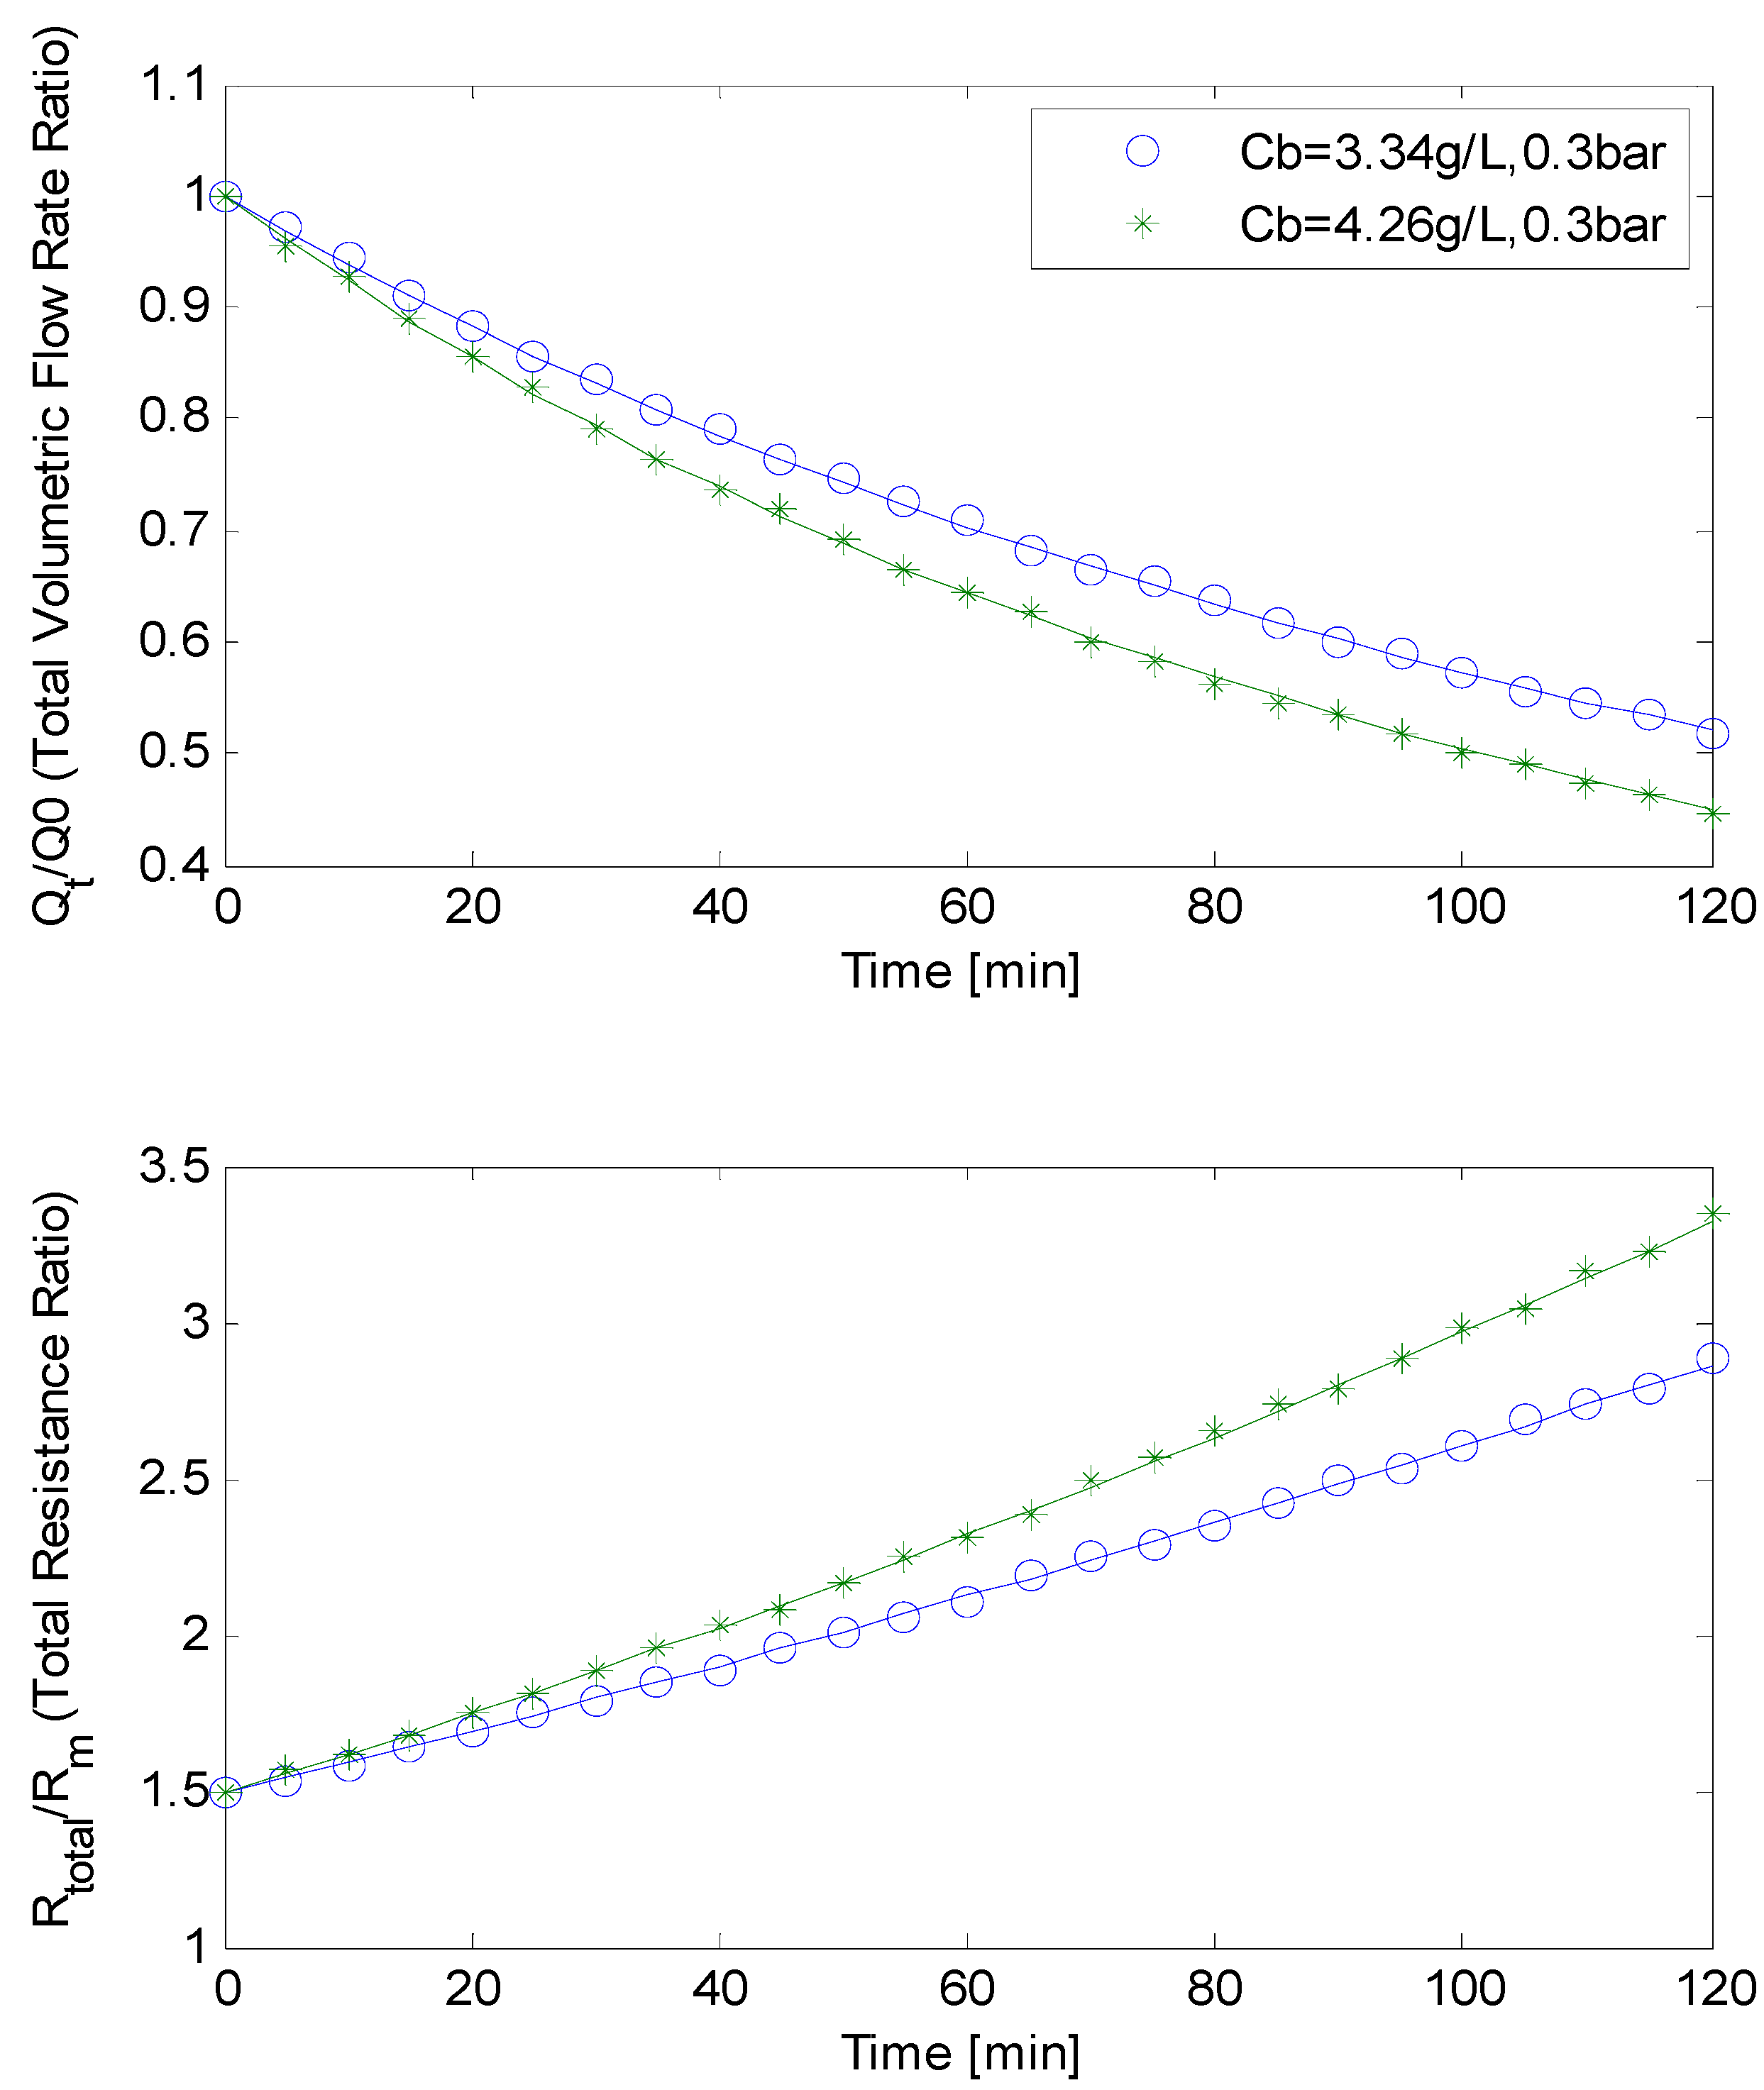
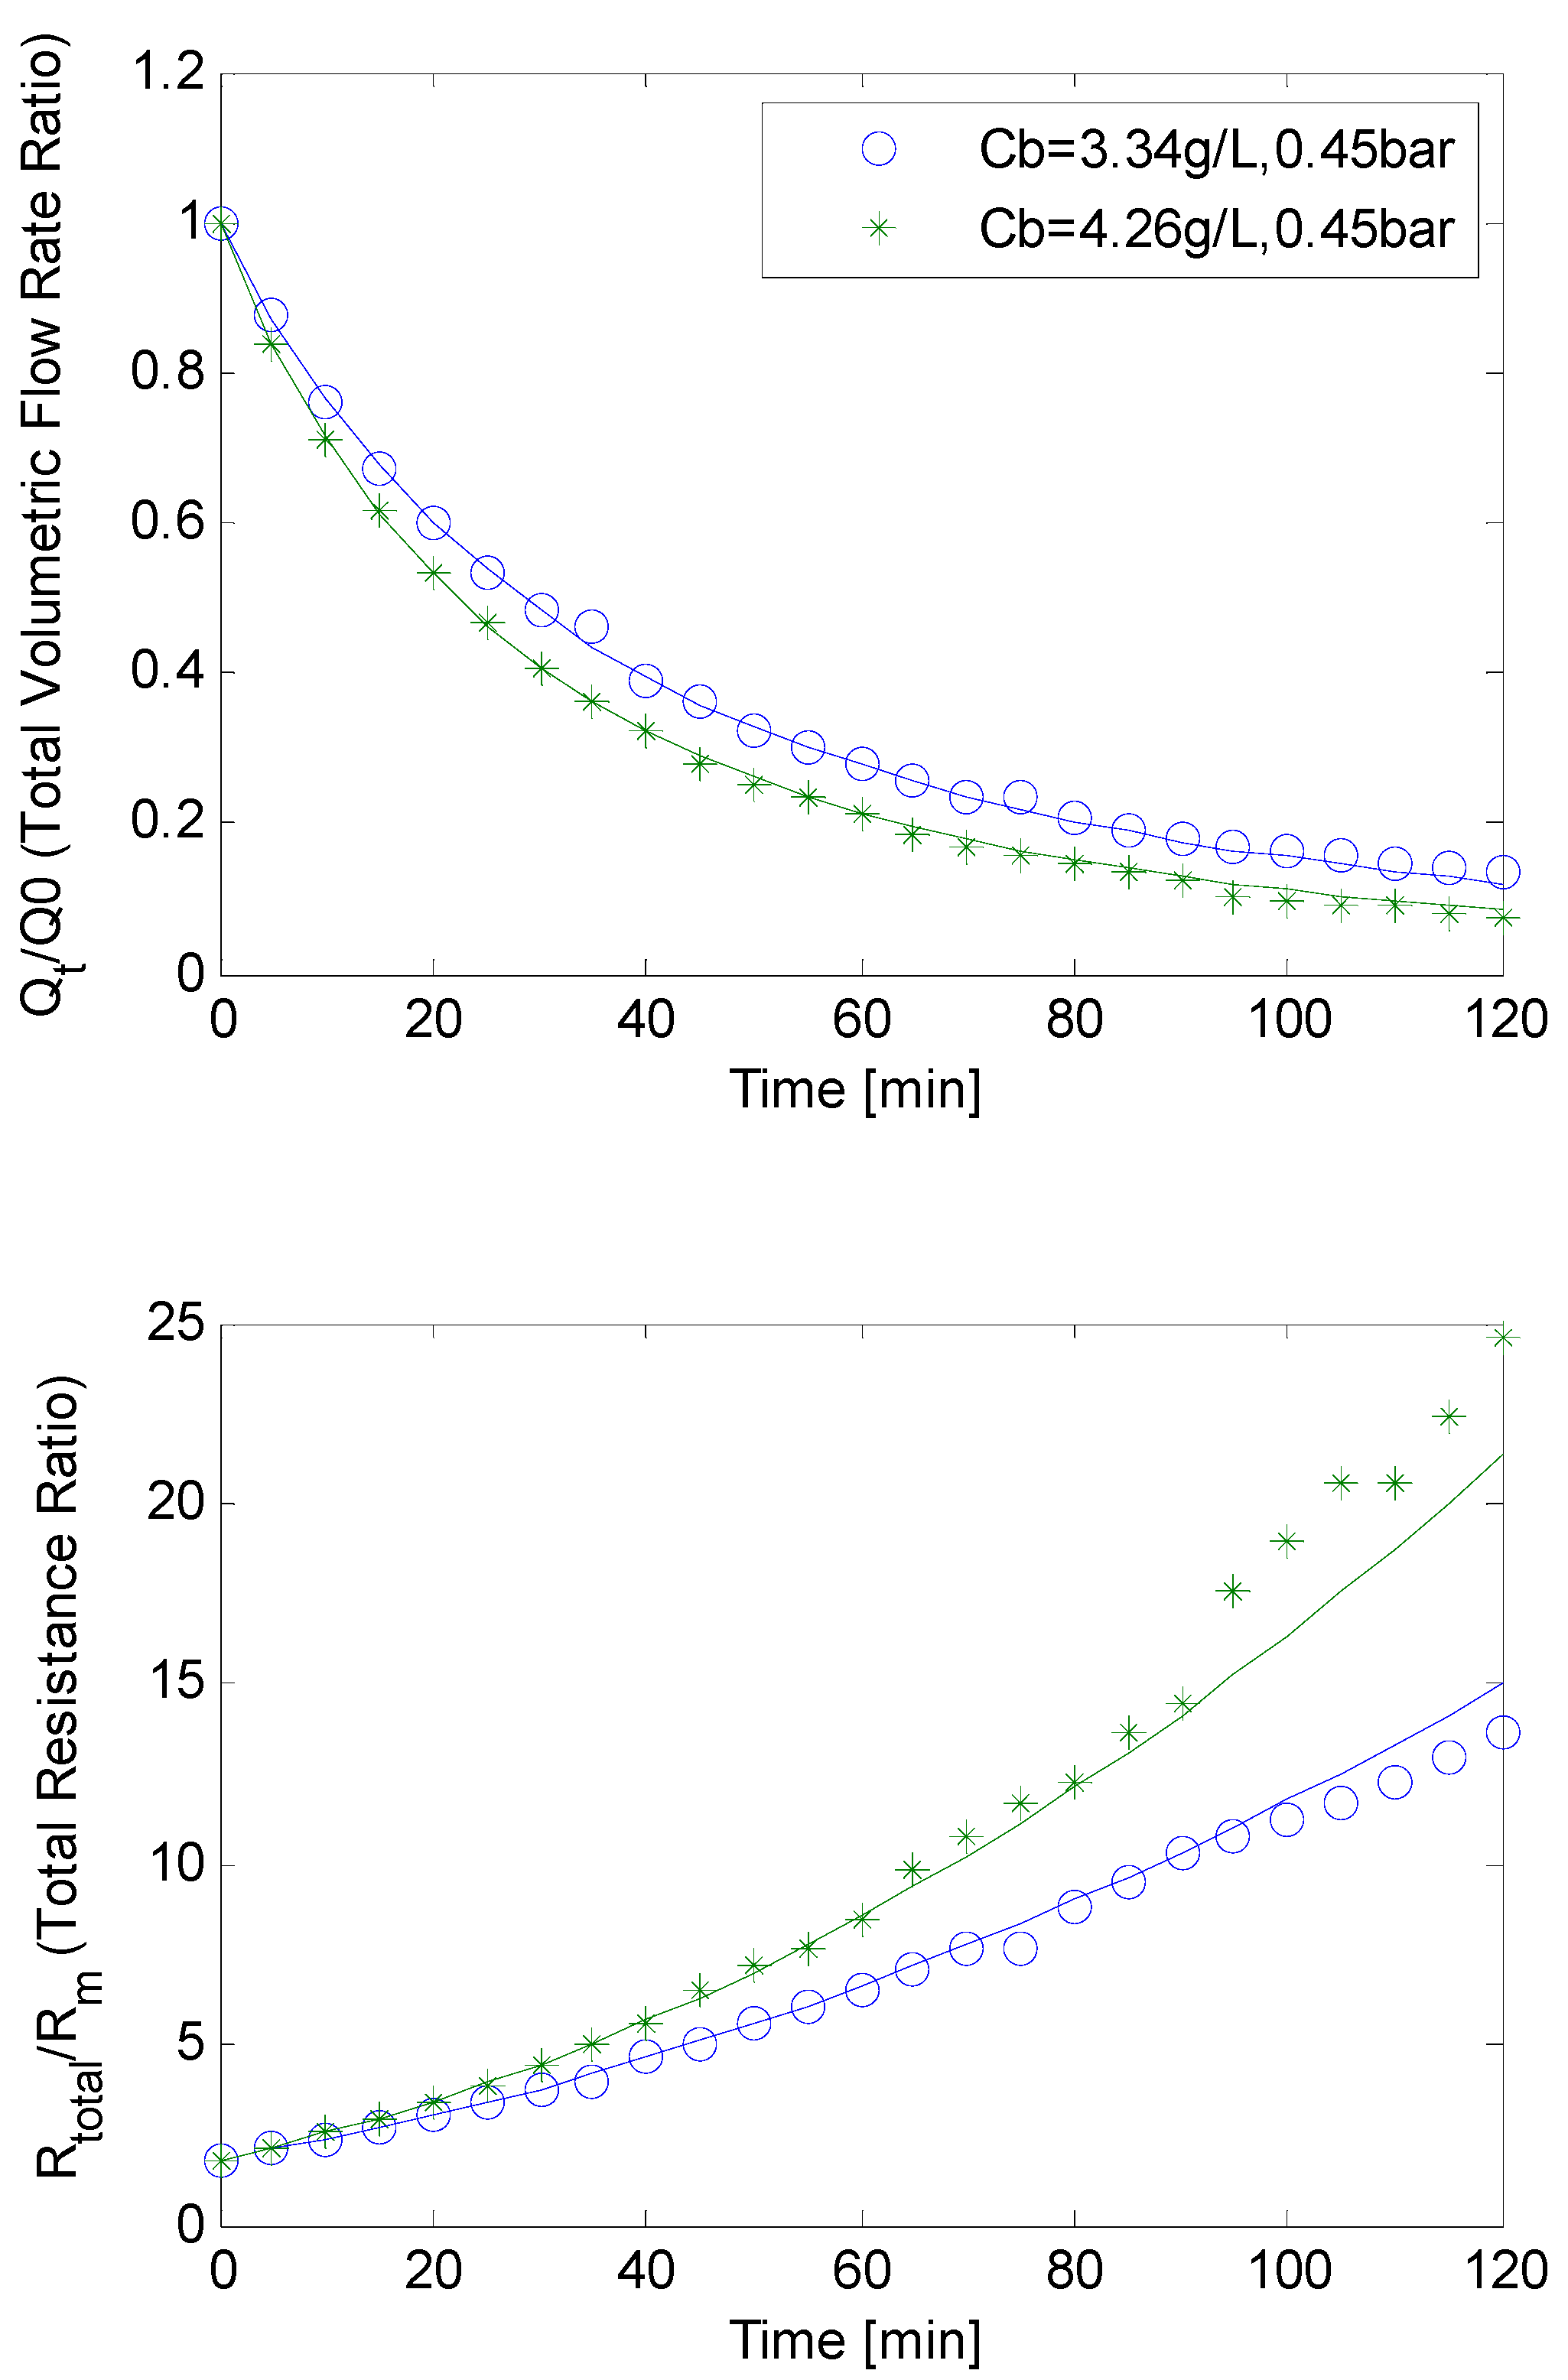
3.2.4. Constant Flow Rate Experiments

The filtration process and ensuing experiments occurred under constant flow MBR operation. The flow rate was 8.67 × 10⁻⁶ m3/s while the corresponding starting TMP was 12 kPa. In total, 25 TMP data points each averaged at 5 min interval for bulk MLSS concentrations at respectively 3.34 and 4.26 g/L were obtained and thus, plotted against the filtration time.

4. Results and Discussion

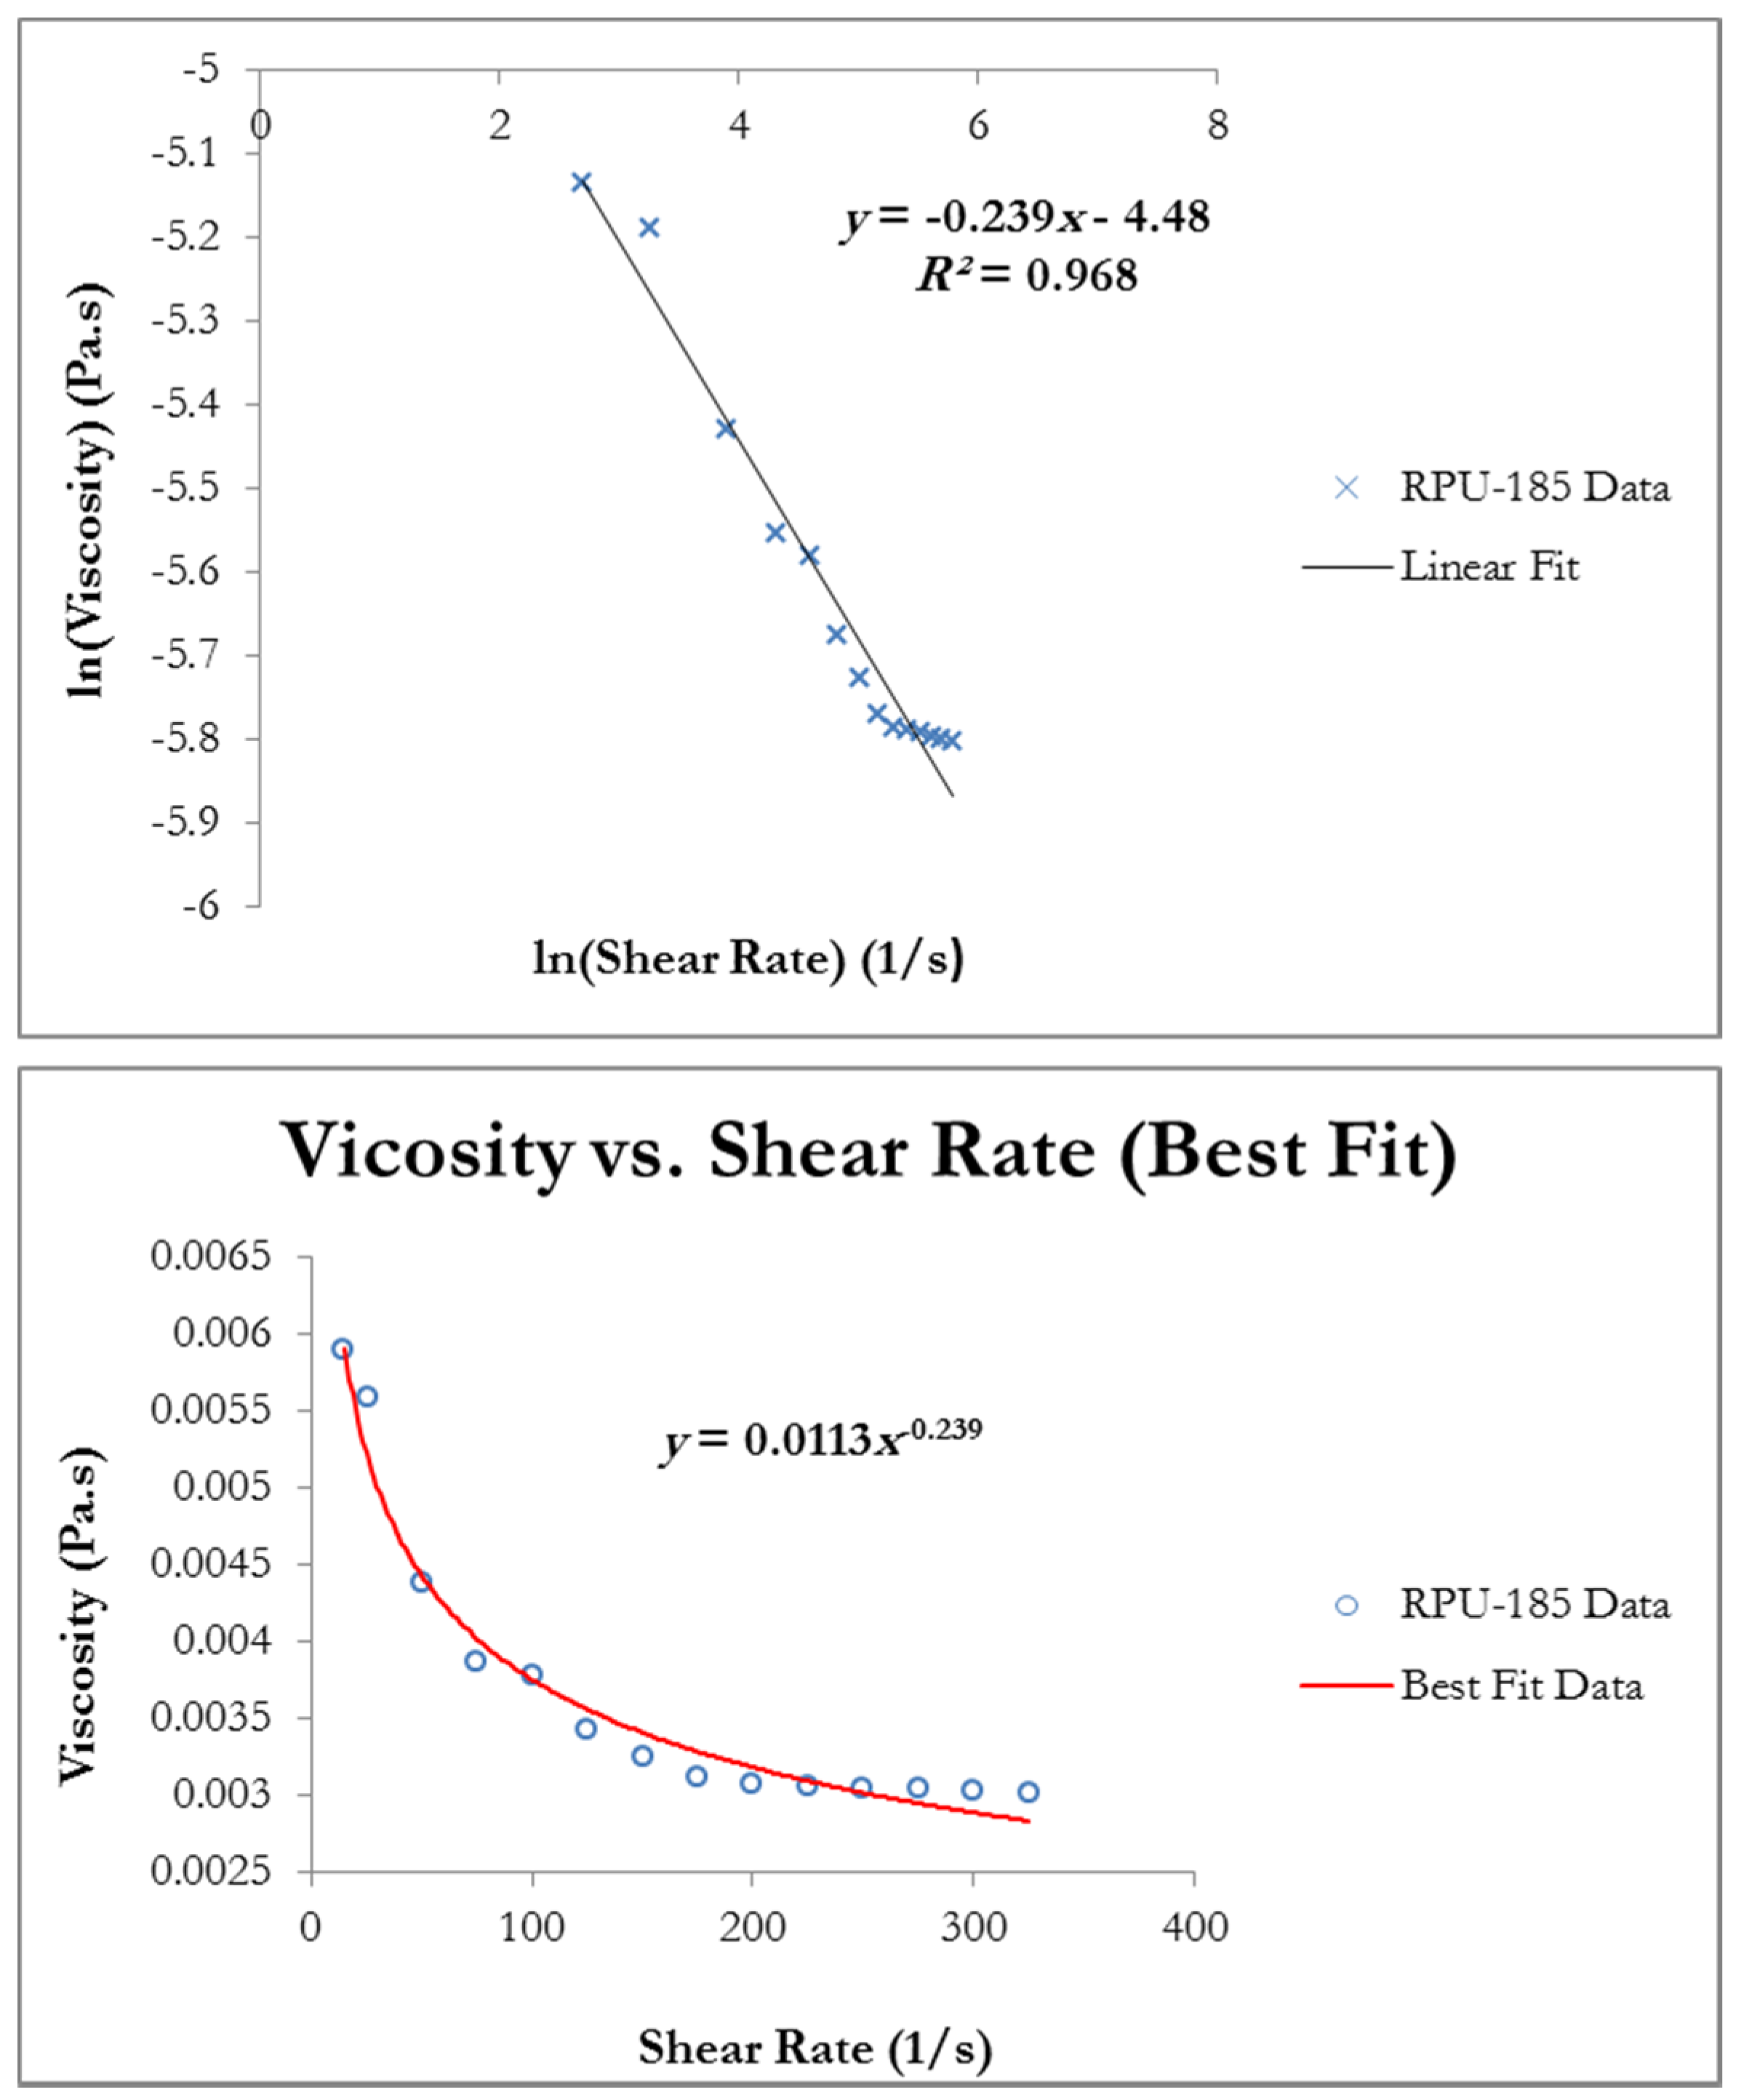
4.1. Shear and Viscosity Relationship

A major parameter included in this model formulation was the combined shear due to both rotation and aeration. To that end, the viscosity of the MLSS at 4.26 g/L concentration was measured at different shear rates. The rotational speed of the spindle was 20 RPM and this equated to a shear rate of 26 s−1. Results indicated that the fluid’s viscosity had decreased much faster at higher shear rate (by almost 56%), which was expected since the calculated radial Reynolds number (ReNN) showed that the flow was laminar. Furthermore, it should be noted that since activated sludge is a shear thinning fluid (as seen in literature), the rheological measurement must be kept in the laminar regime otherwise the outcome of the rheometer becomes increasingly hard to interpret.
Parameters m and n in Equation (1) which are the coefficients controlling the shear rate and viscosity respectively were determined by plotting logarithm of viscosity against logarithm of shear rate using a linear curve fitting process in Matlab.
Figure 4 shows the viscosity plotted against shear rate. The coefficient m was found to be 0.0113 whilst n gave a value of 0.761. The coefficient of determination for the linear fit process was 0.968 indicating a respectable model fit. A value of n less than one indicated that the fluid had deviated from Newtonian behaviour. The value of m was considered reasonable for this type of MBR operated at a relatively low MLSS of 4.26 g/L.
Figure 4. Viscosity plotted against shear rate for rotating MBR system (RPU-185).
Water 07 00377 g004

4.2. Model Validation-Hydrodynamic Regime

The earlier developed fouling model was tested for accuracy using the data generated from the unique hydrodynamic regime employed by this rotating MBR pilot unit. The bulk MLSS concentrations used for all the flux steps were 3.34 and 4.26 g/L. The flow regimes were laminar which were well within expectations since calculated ReNN values were much less than 2 × 10⁵.
The air scouring coefficient, αv, and the resistance distribution, δ, were obtained via sensitivity analysis. The values found were respectively 0.0292 and 4.6 × 10⁻⁴ m−1 for αv and δ. The air scouring flow rate of 3.55 × 10⁻⁴ m3/s was also kept the same for all simulations. Due to varying fluxes the values of the term kω were also obtained via sensitivity analysis and are shown in Table 2. These aforementioned and determined values were used in all subsequent simulations to determine the best fit values for this model. To ensure validity, only the 6 most important parameters pertaining the three fouling mechanisms were used for data and curve fitting during simulations and these were f·R’, α, β, Rbo/Rm, go and kAb. These best fit simulation values were attained by minimising the sum of squared residuals between the model and the collected experimental data. This was used in conjunction with “Genetic Algorithm” function in the Matlab software package with an initial population large enough for the data set used to converge to the minimal possible error. The simulations were performed for each TMP at respectively 15, 30, 45 and 58 kPa for MLSS concentrations of 3.34 and 4.26 g/L. The term σa was calculated upon obtaining the fitting value of β since the membrane pore size was known. Table 2 summarises best fit values for all four flux steps for the rotating membrane FUV-185-A15R (Avanti Membrane Technology, Walnut, CA, USA).
Table 2. Best fit simulation values and key data used during simulations that includes hydrodynamics effects.
ParameterUnit15 kPa Flux Step30 kPa Flux Step45 kPa Flux Step58 kPa Flux Step
Best Fit Simulation Values
go21.7923.17870.62835.6743
kAb29.787229.7729.270.382
Rbo/Rm0.1740.8670.2390.390
f’·R’m/kg489.04 × 109435.88 × 109490.67 × 10965.72 × 109
αm2/kg0.3320.05794.9290.670
βkg2.3420.8561.7510.472
Key Data Used During Simulations
mPa sn0.0113 ± 0.010.0113 ± 0.010.0113 ± 0.010.0113 ± 0.01
n0.761 ± 0.020.761 ± 0.020.761 ± 0.020.761 ± 0.02
αv0.02920.02920.02920.0292
δm−14.6 × 10−44.6 × 10−44.6 × 10−44.6 × 10−4
kωrad−12.446 × 10−54.484 × 10−55.503 × 10−56.725 × 10−5
σakg m31.788 × 10−166.535 × 10−171.336 × 10−163.601 × 10⁻¹⁷
At a constant TMP of 15 kPa and MLSS concentration of 4.26 g/L, after two hours of filtration time, the flux had declined at a steady rate and had gone down by 60%. A similar decrease was observed for MLSS concentration of 3.34 g/L. This gradual drop in flux is as expected and in-line with critical flux theory. At a constant TMP of 30 kPa, the flux increased from initial value 1 × 10⁻⁵ to 1.83 × 10⁻⁵ m3/s. This was within expectations since flux increases with increasing TMP. After two hours of filtration of a MLSS concentration 4.26 g/L, the flux had declined by 48% from its original value. Again this gradual drop in flux is as expected although not as much as theory would predict.
Figure 5 shows the normalised volumetric flow rate and the total resistances ratios plotted against the filtration time at constant TMP of 15 kPa (flux step data), for MLSS concentrations of 3.34 and 4.26 g/L for the rotating membrane FUV-185-A15R; with the solid lines representing the best fit simulation data. The total resistance was calculated using Darcy’s law. The resistances displayed a rather linear trend, suggesting fouling was caused by the combination of all three fouling mechanisms. A weak caking layer showcased by a relatively small Rb0, a big cake removal factor go and almost equally big blocked pores area constant kAb, suggested that fouling was dominated by pore constriction (as β >> α).
Figure 5. Flux decline and total resistance for flux step at trans-membrane pressure (TMP) 15 kPa for FUV-185-A15R.
Water 07 00377 g005
Figure 6 shows the normalised volumetric flow rate and the total resistances ratios plotted versus the filtration time at constant TMP of 30 kPa (flux step data), for MLSS concentrations of 3.34 and 4.26 g/L for the rotating membrane FUV-185-A15R; with the solid lines representing the best fit simulation data. The resistance-time plot, again, seems to indicate that fouling could be attributed to the combined effect of all three mechanisms. A strong caking layer showcased by a relatively bigger Rb0 and a small cake removal factor go, all seemingly implied that fouling was dominated by both cake filtration and pore blocking mechanisms.
Figure 6. Flux decline and total resistance for flux step at TMP 30 kPa for FUV-185-A15R.
Water 07 00377 g006
At a constant TMP of 45 kPa and MLSS concentration of 3.34 and 4.26 g/L, the initial flow rate was 2.25 × 10⁻⁵ m3/s. After two hours of filtration time, at MLSS concentration of 4.26 g/L, the flux had decreased drastically and gone down by 85%. A similar reduction was detected at MLSS concentration of 3.34 g/L. As expected this meant that not only had the initial flux increased at higher TMPs, but also that the flux decline rate had increased with more pressure. These findings are in-line with theory since a membrane is likely to foul more quickly especially when approaching or exceeding critical flux. At a constant TMP of 58 kPa, the initial flow rate increased from 2.25 × 10⁻⁵ to 2.75 × 10⁻⁵ m3/s. Results showed that at MLSS concentration of 4.26 g/L, the flux had still decreased considerably, and had gone down by only 62%; which is a consistent decline when compared with the 45 kPa TMP flux step data.
Figure 7 depicts the effects of the fouling behaviour of FUV-185-A15R, using both the normalised volumetric flow rate and total resistance ratios for MLSS concentrations of 3.34 and 4.26 g/L at a constant TMP of 45 kPa (with the solid lines representing the best fit simulation data). Due to a colossal drop in flux, the total resistance had also increased at an exponential rate. Although fouling may have been caused by the combined effect of all three fouling mechanisms, it can be argued that the fouling was mainly dominated by pore blocking. A weak caking layer showcased by a relatively small Rb0, a very big cake removal factor go and pore blocking parameter β being roughly four times that of the pore constriction, clearly suggested that fouling was dominated by the pore blocking mechanism.
Figure 7. Flux decline and total resistance for flux step at TMP 45 kPa for FUV-185-A15R.
Water 07 00377 g007
Figure 8 depicts the fouling behaviour of FUV-185-A15R, by using both the normalised volumetric flow rate and total resistance ratios for MLSS concentrations of 3.34 and 4.26 g/L at constant TMP of 58 kPa. The solid lines represent the best fit data obtained from the simulation. The total resistance seemed to intrinsically increase linearly with filtration time, albeit at a much higher rate. This is arguably because fouling was caused by a combine effect of the three fouling mechanisms. Pore blocking factor α and pore constriction β are of almost equal value, suggesting neither of the two mechanisms was dominant. Furthermore, Rb0 being almost half Rm and the somewhat small blocked pores area constant kAb suggested cake filtration also took place although to a lesser degree than the other fouling mechanisms.
Overall, the modelling calculations are seemingly in reasonable agreement with the collected data, with a 25% deviation on the resistance curve at constant TMP of 45 kPa (i.e., for MLSS concentration of 4.26 g/L) for the end data points. This could be attributed to a permeate restart needed before the flux stepping was carried out due to the low batch tank fluid levels.
As a short conclusion, it was noticed that viscosity indirectly affects fouling. A less viscous mixed liquor under the same operating conditions as those experienced by higher viscous mixed liquor will likely foul less (i.e., flux likely to drop slower). This is because, generally, higher viscosities are associated to high MLSS concentrations.
Figure 8. Flux decline and total resistance for flux step at TMP 58 kPa for FUV-185-A15R.
Water 07 00377 g008

4.3. SMP Inclusion

Using Equations (16) and (17), and then by plotting logarithm of MLSS concentration against cake thickness ratio whilst also doing a linear fit using Matlab’s polyfit function, the ki and єSMP Cb values were obtained as shown in Figure 9; with solid line being best fit for a two hour filtration period. Simulation best fit value for єSMP.Cb in g/L was found to be 1.054 while ki in s−1 was 0.039 respectively. At first glance, the exponential fit appears to not accurately predict SMP concentration for MLSS concentrations of 2.82, 4.12 and 4.26 g/L respectively. This is likely because their corresponding cake thickness values were simply interpolated based on other experimentally measured cake thicknesses. However, upon closer inspection, the fit seems to succinctly describe the fouling behaviour of the membrane. Thus, the model predicts that for a bigger thickness cake to form, an exponentially bigger MLSS concentration is required and with it, a subsequent increase in SMP concentration on the membrane surface. This appears to explain why higher MLSS concentrations give rise to faster total flux decline whilst membrane resistances climb rapidly at the same rate. This finding is in-line with Yuan et al. [26] study.
Figure 9. Mixed liquor suspended solids (MLSS) concentration plotted against cake thickness ratio for rotating MBR system.
Water 07 00377 g009

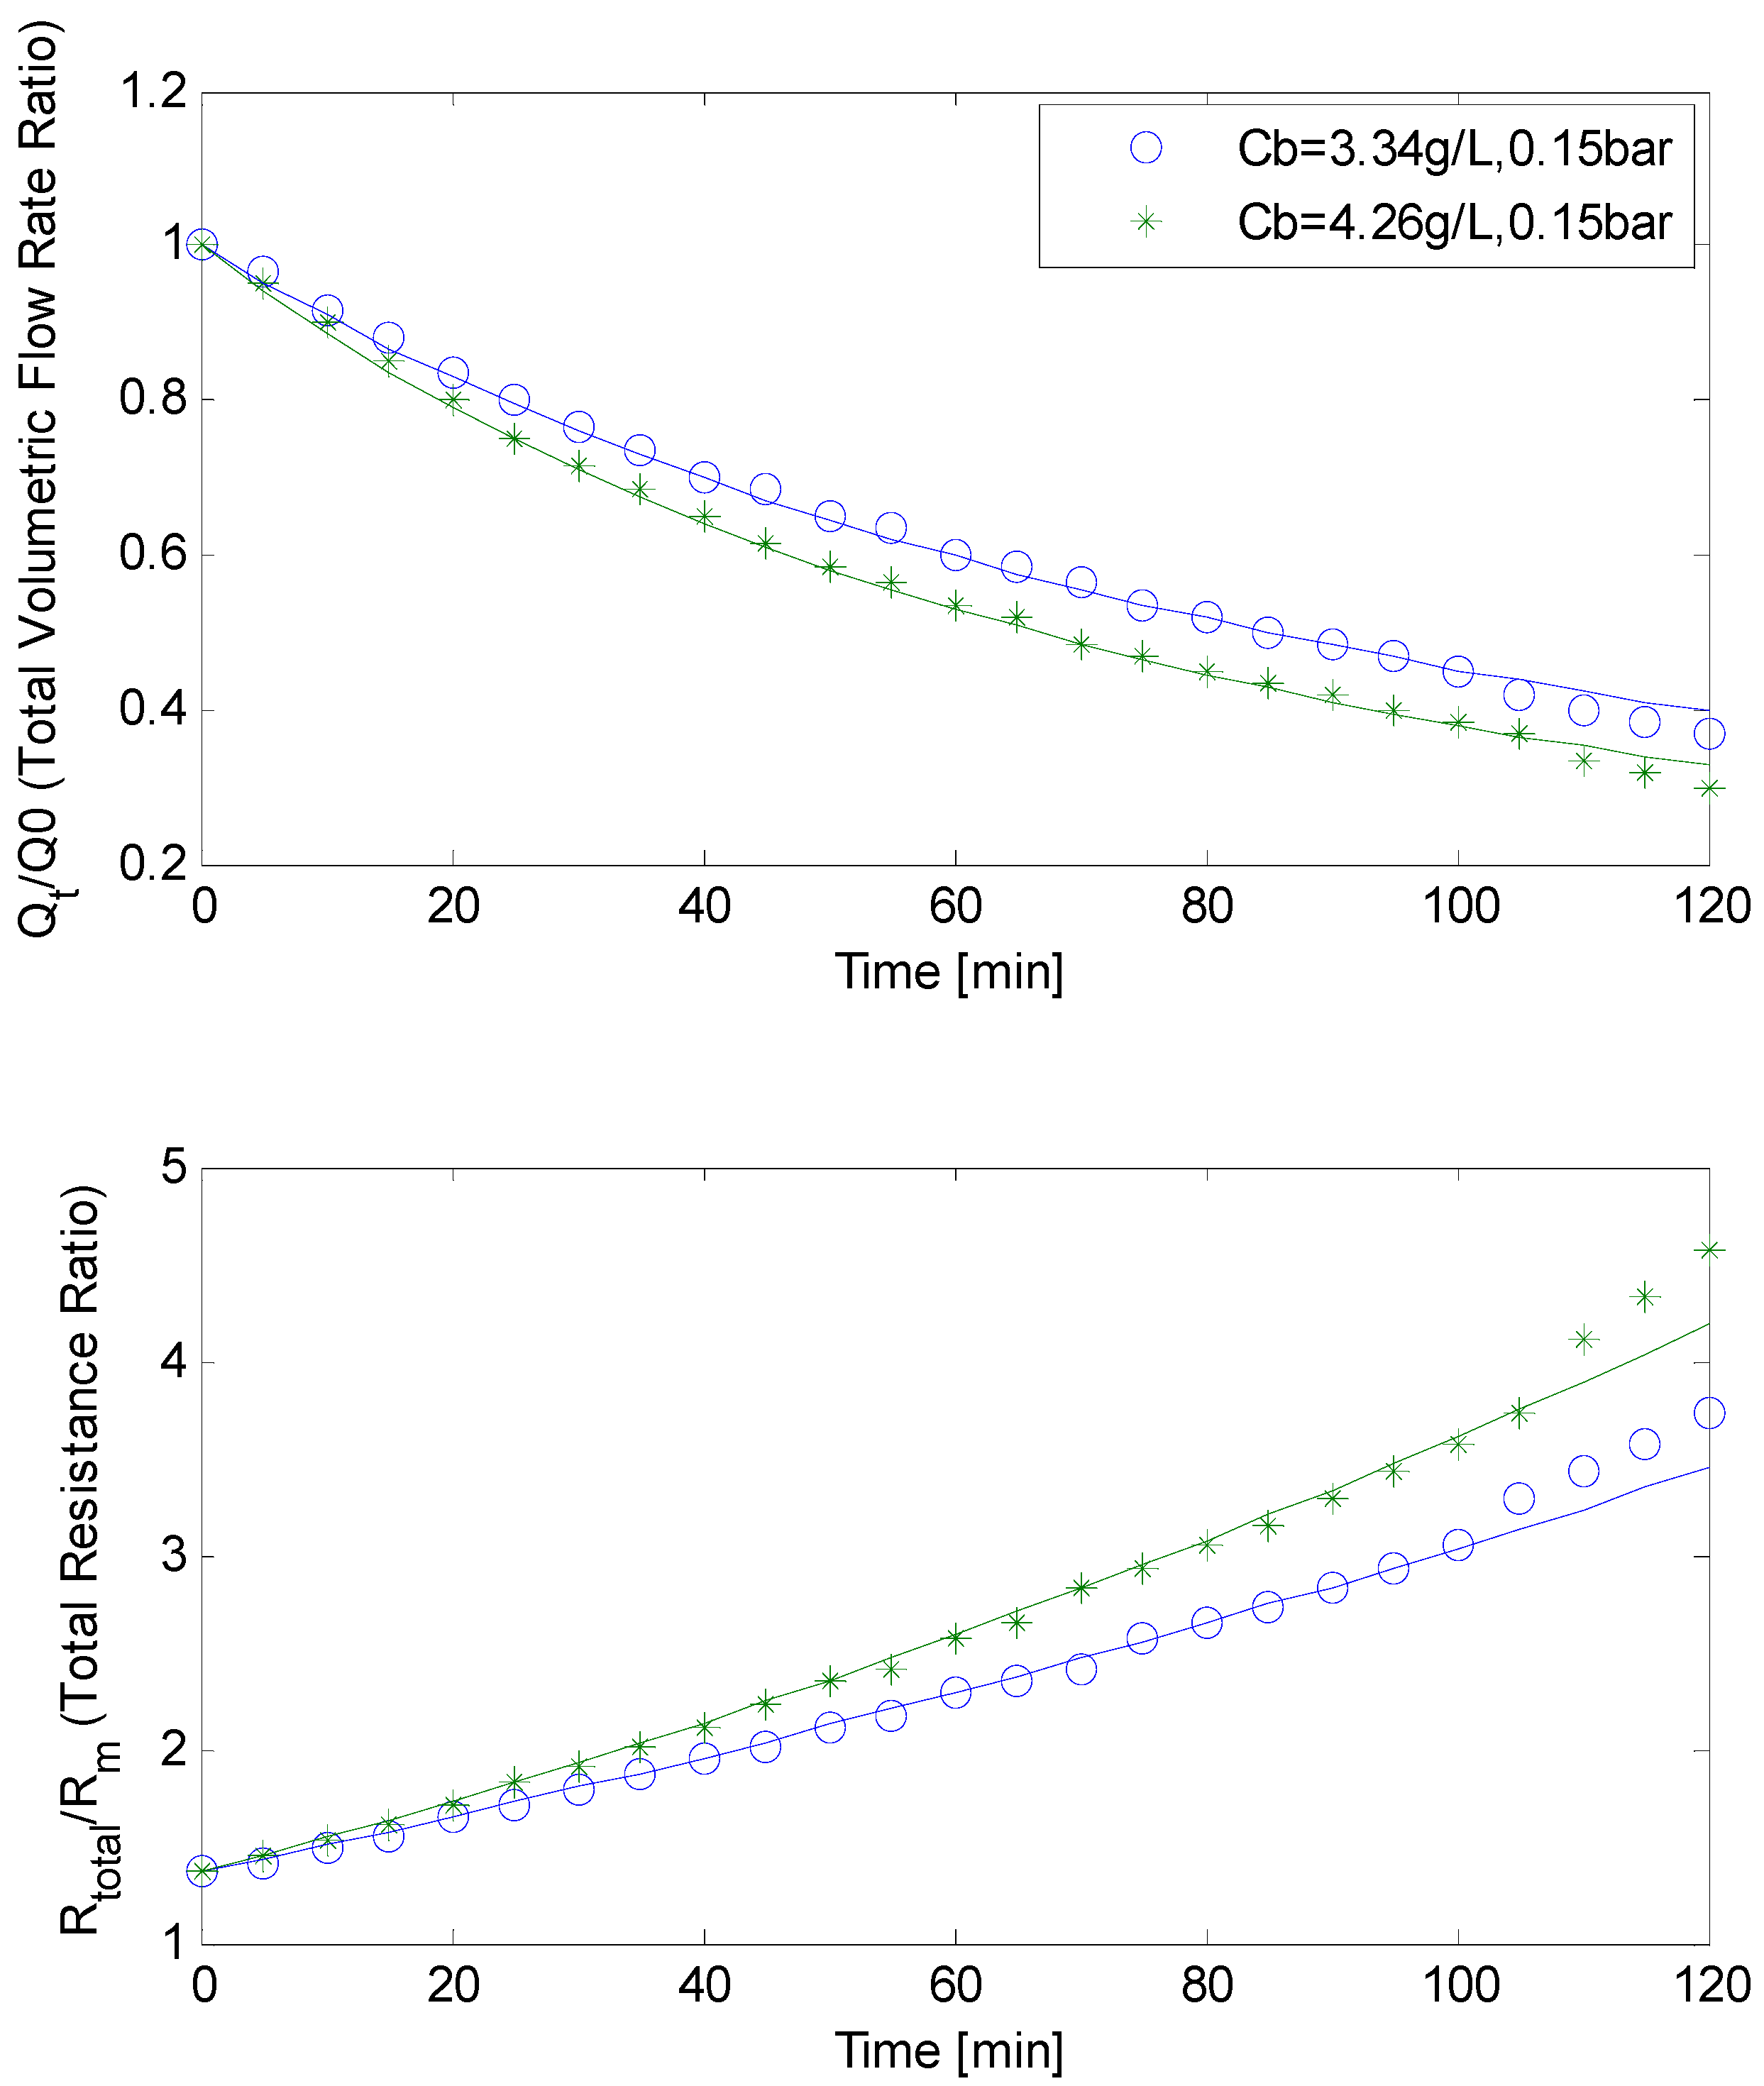
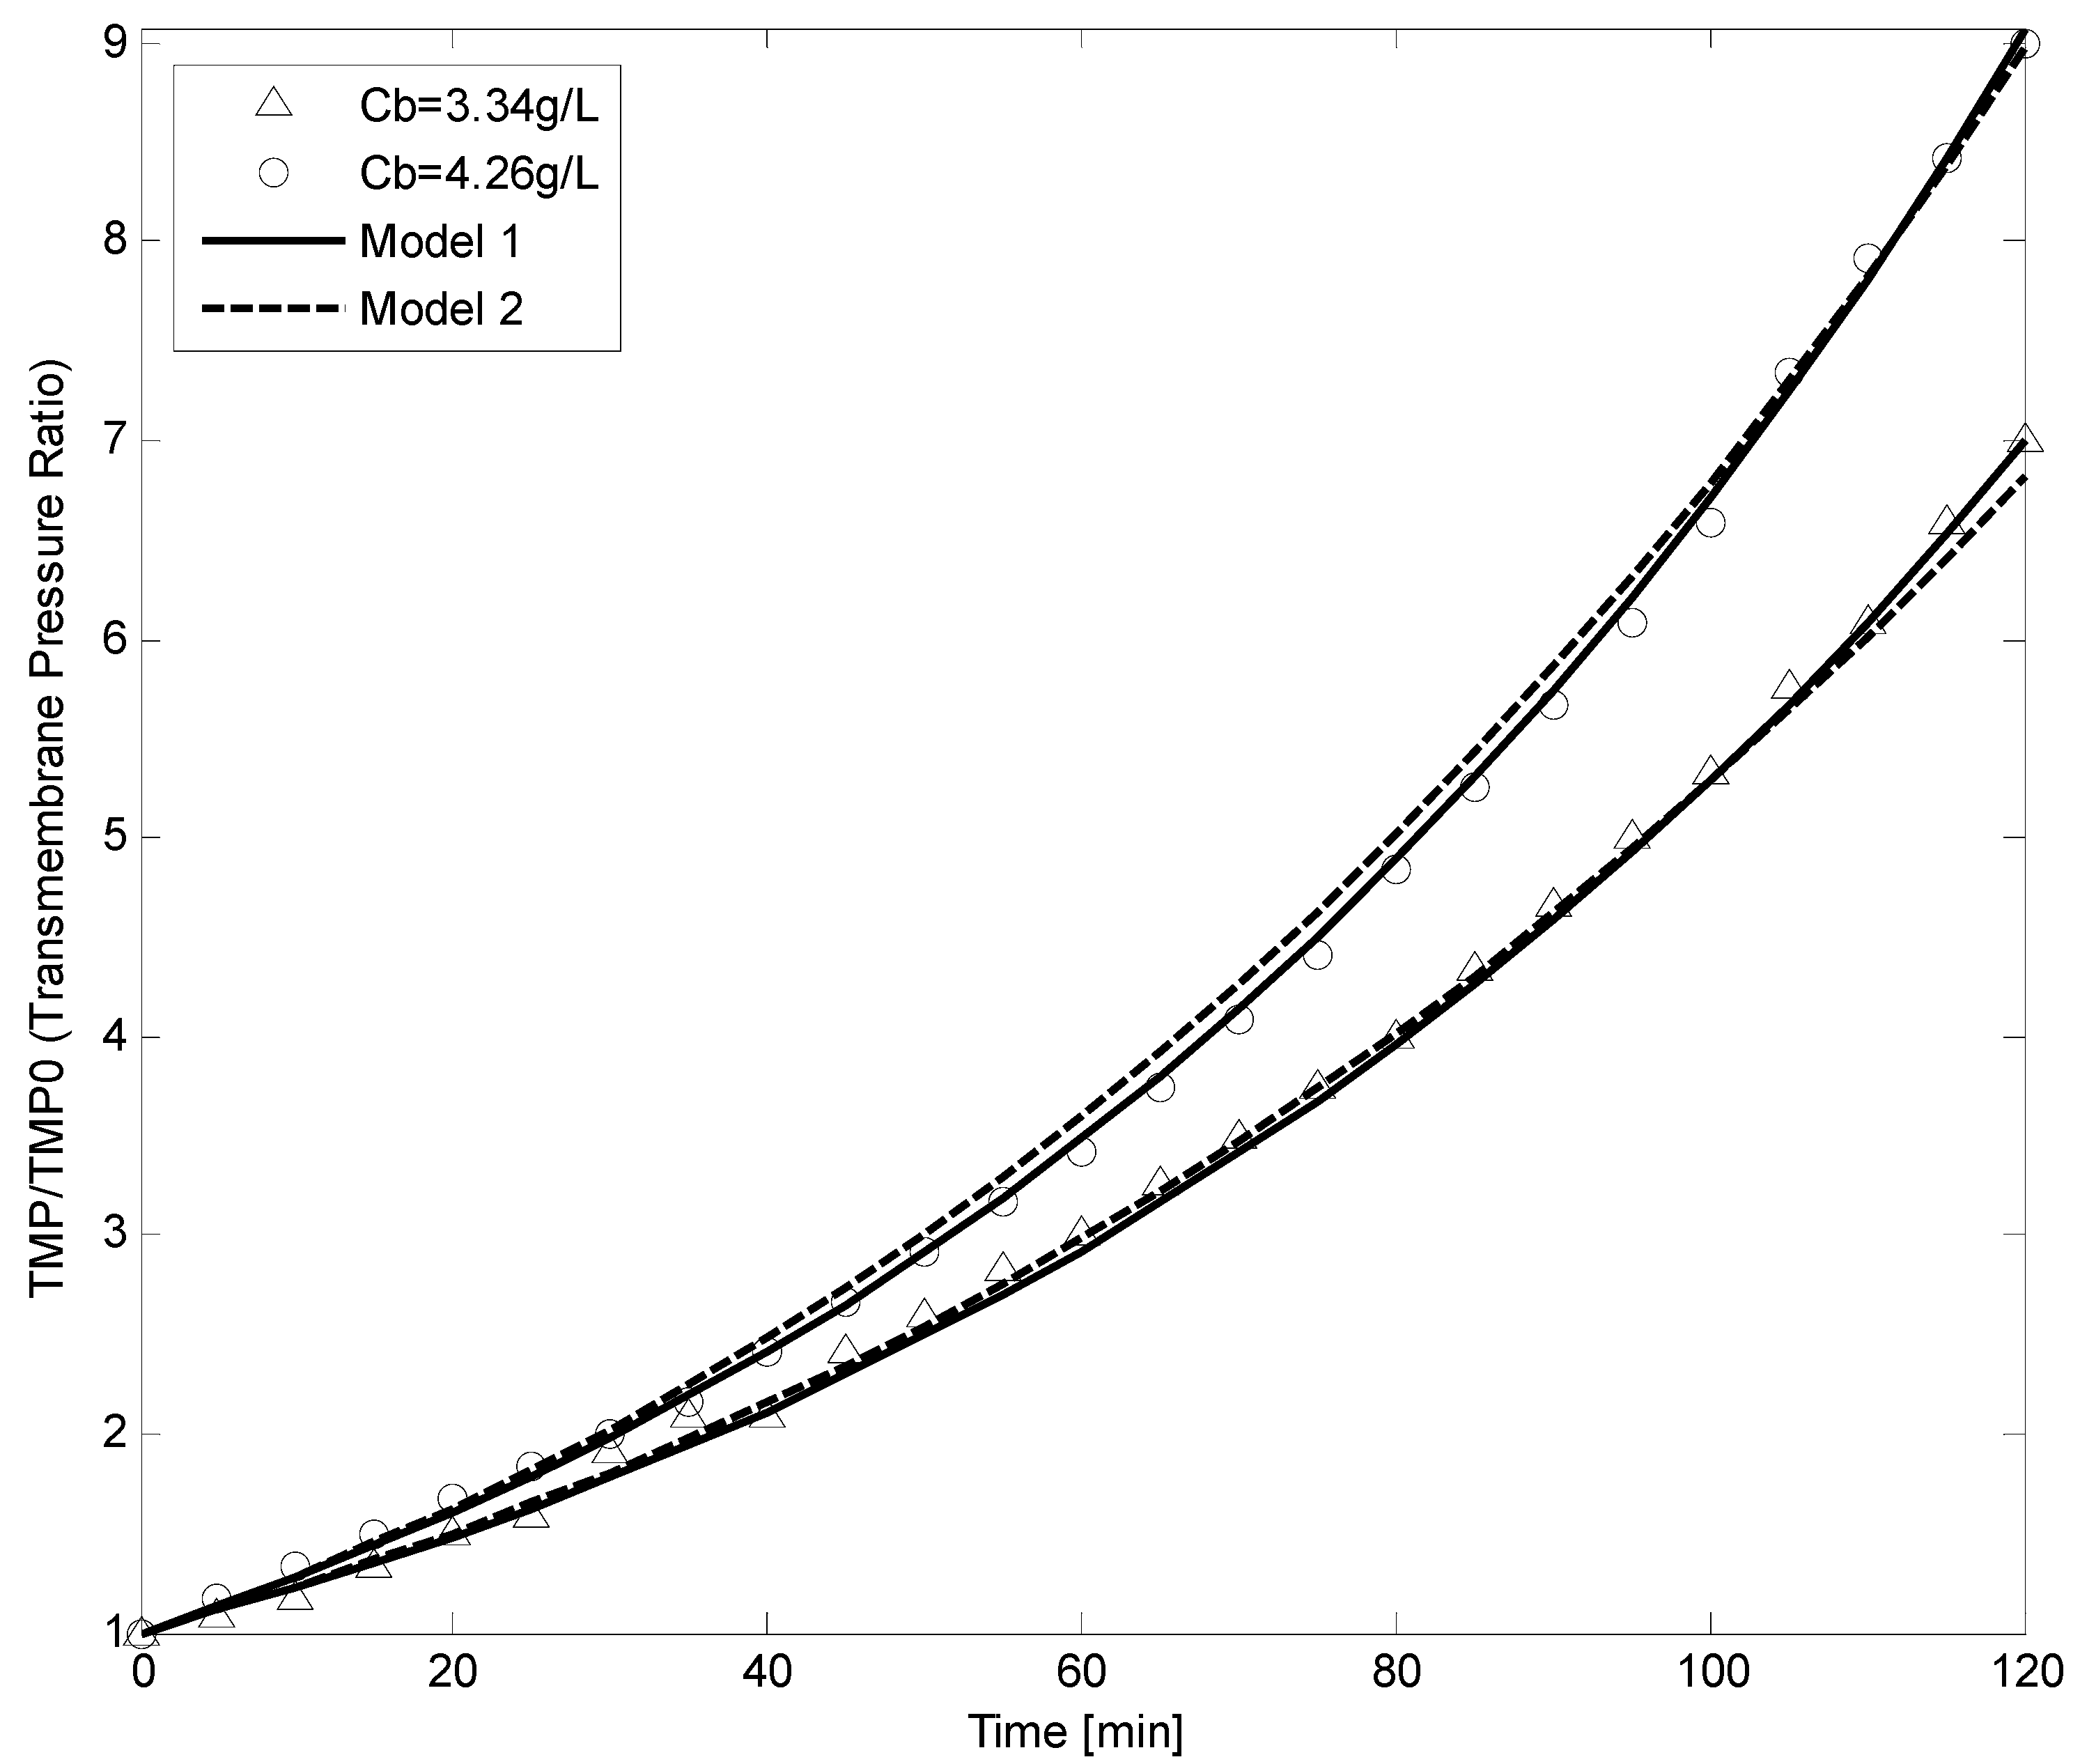
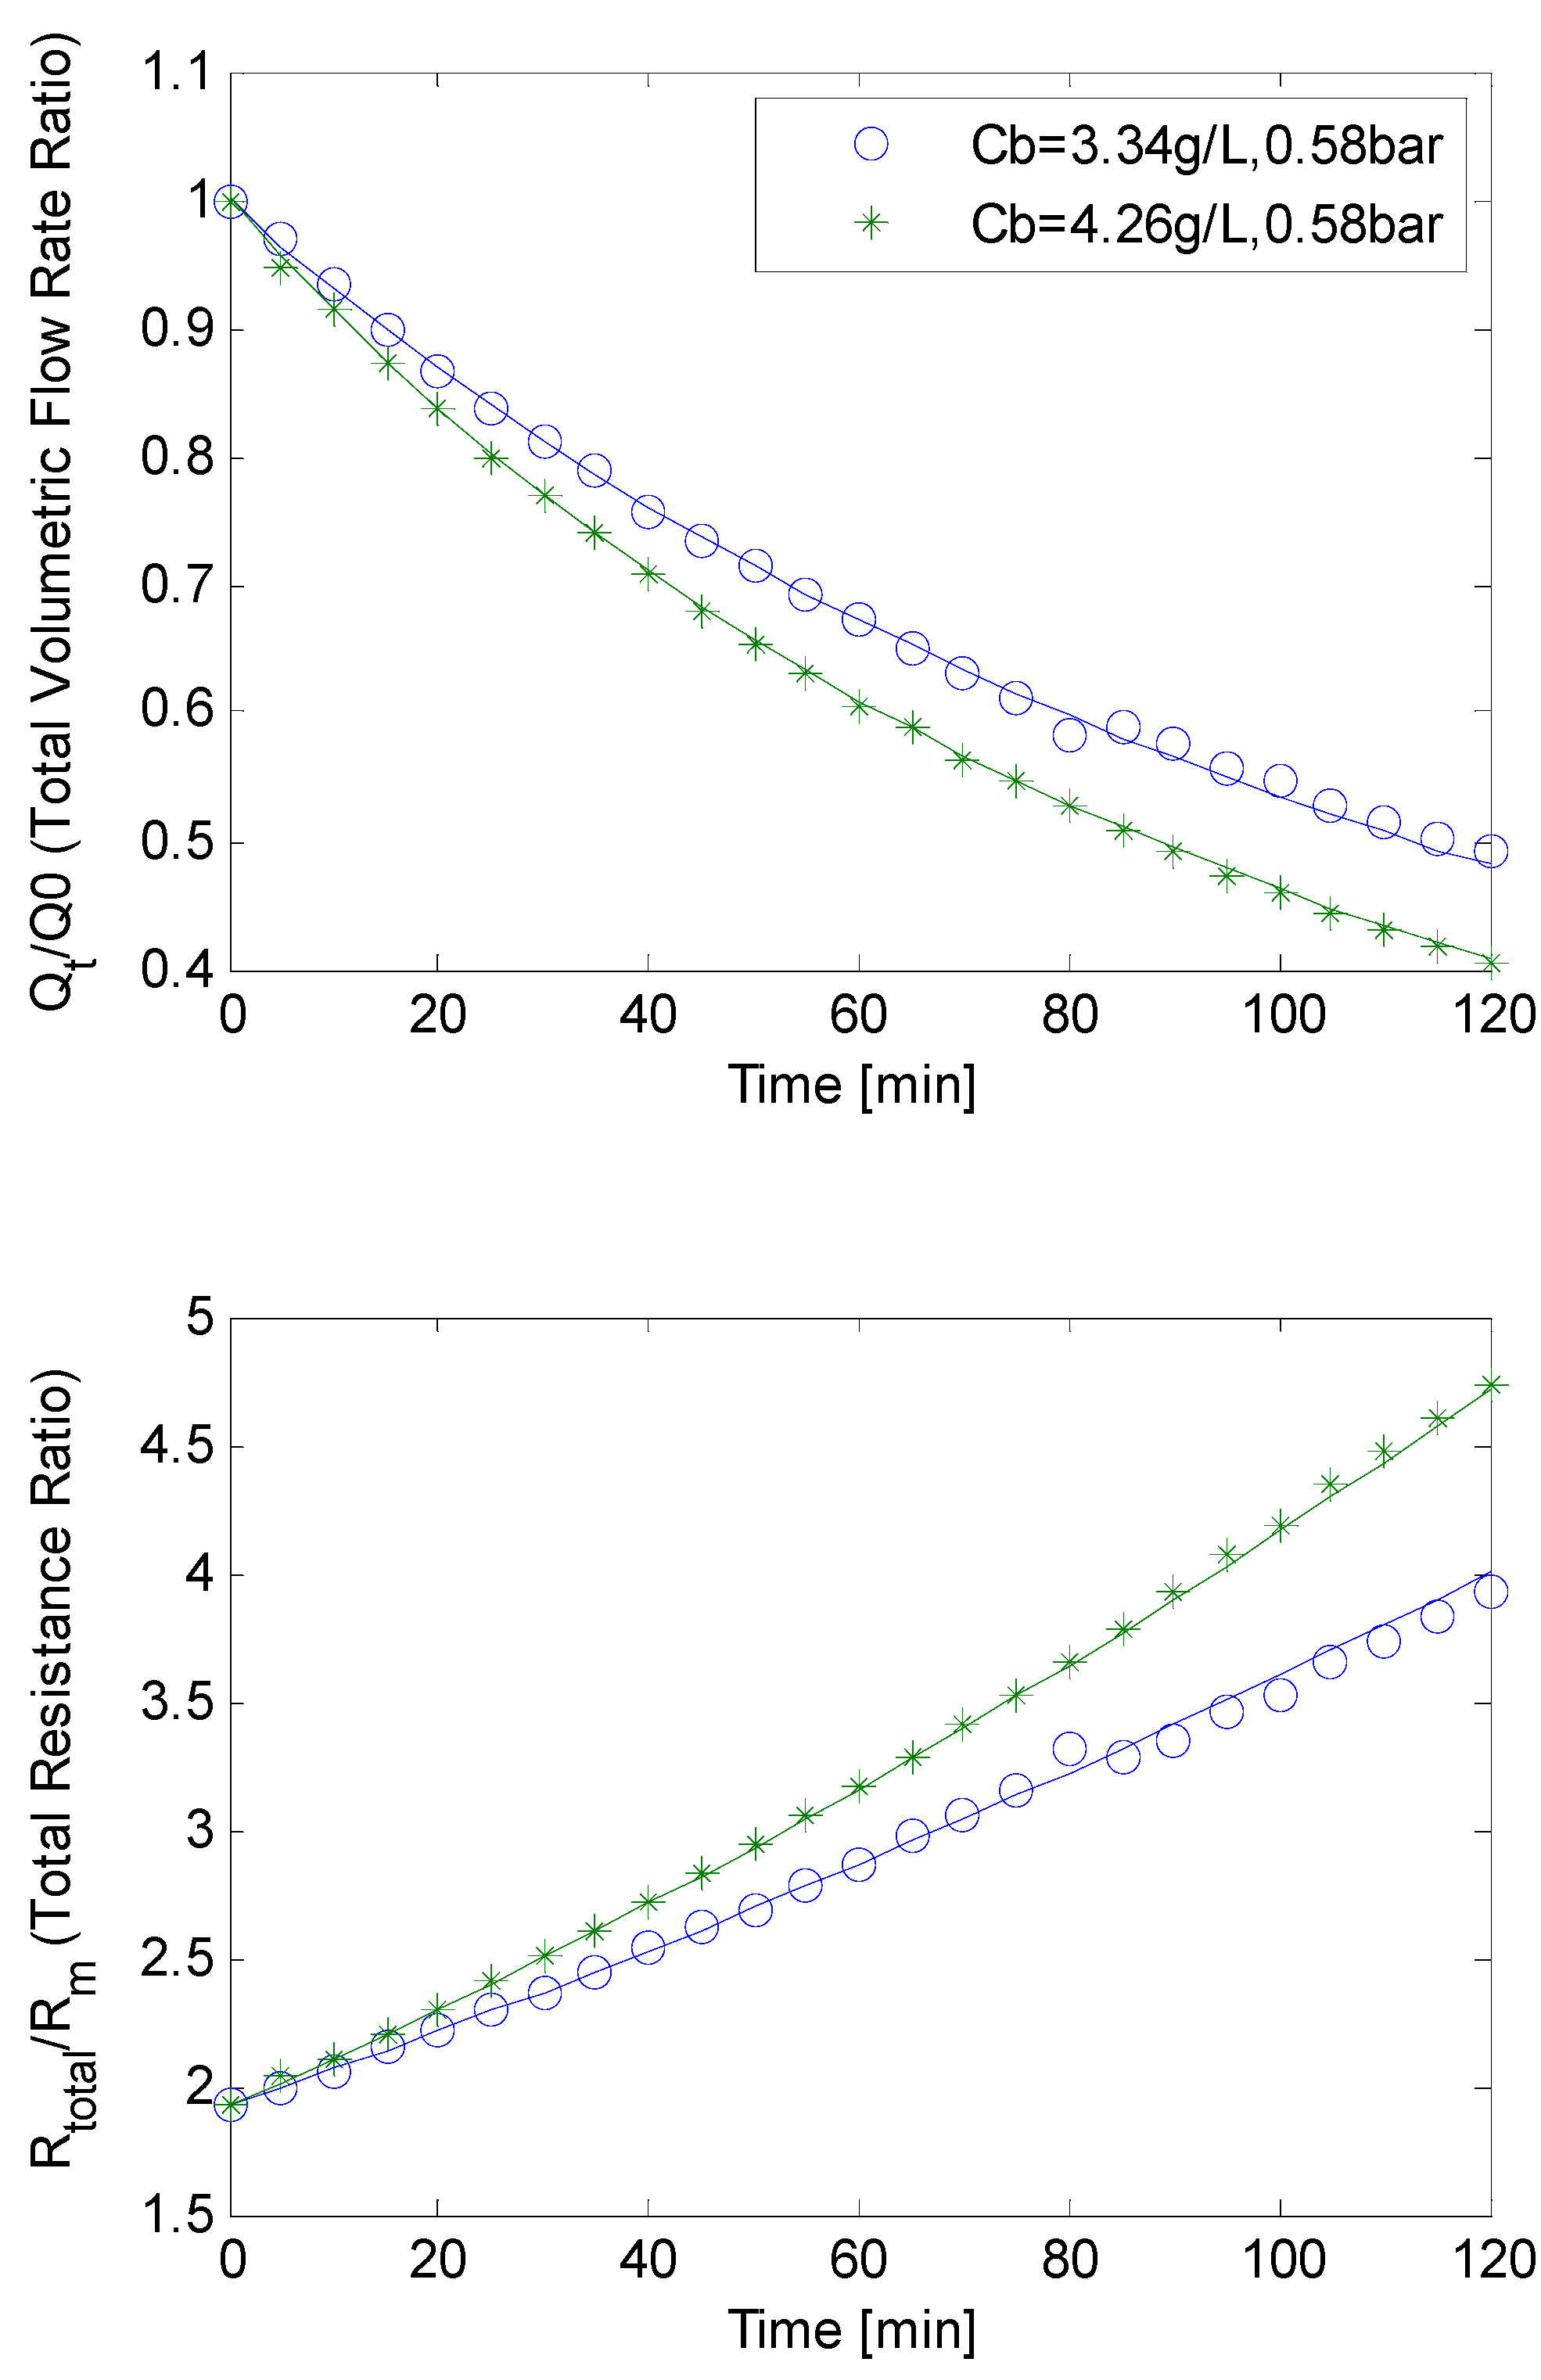
4.4. Constant Flow Rate/Varying TMP Mode

The collected experimental data indicated that TMP had increased by almost 88% for MLSS of 4.26 g/L and 85% for MLSS of 3.34 g/L. An increase in TMP is a clear indication that the membrane had become progressively fouled. The fouling rate seemingly increased with bigger MLSS concentration values, as seen by higher TMP readings at MLSS concentrations. As already explained, this is likely due to the fact that at higher MLSS concentrations more caking is observed due to the higher solids content in the liquor, causing more clogging of the membrane and thus progressively increasing the TMP over time.
Figure 10 shows best fit solutions for two different models that depict constant flow rate/varying TMP operation. Model 1 is derived from Equation (18) whilst Model 2 is derived from Equation (19) which relies on the truncated Taylor’s expansion. Between time intervals from 30 to 90 min for MLSS concentration of 4.26 g/L, Model 2 had an error deviation of 9% on simulated data when compared with Model 1. This is a direct consequence of the Taylor’s expansion truncation error. Thus, Model 2 predicted the available remaining area to be much lower than expected and so it predicts higher TMP values than Model 1. This is reflected in parameter Kα where for Model 2 it had a value of 10.53 while for Model 1 it had a value of 9.975. The bigger this value the higher the predicted TMP will be with more subsequent fouling. The shape of the curve of TMP versus time indicates that fouling was likely caused by cake filtration although initially induced by the pore constriction effects, with β found to be 16.308 for Model 1 and 17.58 for Model 2 respectively. Once again, the best fit simulation parameters for these two models were attained by using Matlab’s Genetic Algorithm function. It was found that for both models kω amounted to 1.4044 × 10⁻⁵ whilst φ was 0.0939 for Model 1 and 0.06 for Model 2 respectively.
Figure 10. TMP plotted against filtration time at constant flow rate of 8.67 × 10⁻⁶ m3/s for rotating MBR.
Water 07 00377 g010

5. Conclusions

In this study, a unique rotating MBR fouling model was formulated from prior extensive work produced by Duclos-Orsello et al. [18] and later by Paul [19]. It was tested using relevant data sets, and the rotation efficiency in terms of fouling prevention was estimated to be 12%. This suggests that prevention of cake build-up and fouling is mostly accomplished by air scouring. New parameters related to the shear hydrodynamics, especially those describing the rotational membrane effects, were determined for the first time and seemed reasonably realistic and consistent with good agreement achieved using experimental data. This work initially indicates this model gives a decent representation and description of the fouling mechanisms occurring within a rotating MBR system. To further develop this model, it needs to be calibrated using data sets generated by the rotating MBR RPU-185 for long term filtration. Furthermore, by turning-off the rotating terms and obtaining a linear model, it can be compared to a non-rotating MBR model and, thereby, the true extent of the rotation on fouling reduction can be measured for this pilot unit.

Acknowledgments

The authors would like to acknowledge Avanti Technology (USA) for their technical contribution and The Royal Society (UK) for providing funding to allow this work to proceed.

Author Contributions

The experimental work, data processing, and model development in this study were carried out by Franck Anderson Jones under the direction and supervision of Parneet Paul, and is based upon earlier work originally carried by Parneet Paul [19]. The first draft of the original manuscript was prepared by Franck Anderson Jones, and later versions were revised and edited extensively by Parneet Paul before publication. This included broadening the scope and nature of this study to be in-line with other researchers working in this field.

Abbreviations

A
remaining membrane area available for permeate (m2);
A0
total membrane area (m2);
Au0
initial unblocked area (m2);
Cb
liquid bulk concentration (g/L);
Cb
concentration of the clogging particles in the bulk liquid (g/L);
Cd
solid content in bulk (kgm−3);
CMLSS
mixed liquor suspended solids concentration (g/L);
dpi
mean diameter of floc particle forming the cake (m);
go
adjustable parameter or cake removal factor (−),
f
fractional amount of total foulants contributing to deposit growth (−);
J0
initial filtrate flux of clean membrane (m s−1);
Jmo
initial total flux (m/s);
Ju
unblocked flux (m s−1);
kAb
area constant parameter for blocked pores (−);
ki
1st order particle removal coefficient (1/s);
Kα
area distribution density (m−1);
kω
angular velocity factor (−);
m
flow consistency index (Pa sn);
n
flow behaviour index (−);
PT
trans-membrane pressure at membrane periphery (Pa);
Q
volumetric flow rate (m3 s−1);
Qb
blocked volumetric flow rate (m3 s−1)
Q0
initial volumetric flow rate (m3 s−1);
Qu
unblocked volumetric flow rate (m3 s−1);
R
specific protein layer or cake layer resistance (m/kg);
Rb
resistance of solids deposit over a region of membrane (m−1);
Rbo
initial resistance of solids deposit (m−1);
Rc = R’c θc
total net cake’s resistance (m−1);
Rc
specific cake resistance (m−2);
ReNN
radial Reynolds number (−);
ri
membrane’s inner radius (m);
Rin,b
membrane’s resistance & resistance from pore constriction (m−1);
ro
membrane’s outer radius (m);
r0
distance radius from the spinning axis (m), thus (r’0 = ro − ri);
Rm
clean membrane’s resistance (m−1);
rp
radius of membrane pore (m);
Rt0
initial total membrane’s resistance (m−1) at t = 0;
t,
filtration time (s);
tb
time at which a membrane region was first blocked (s);
TMP
trans-membrane pressure (Pa);
TMP0
initial trans-membrane pressure (Pa);
α
pore blockage parameter (m2/kg);
αv
air scouring coefficient (−);
β
pore constriction parameter (kg);
γ ˙
shear rate (s−1);
δ
resistance distribution constant (m−1);
∆P
cake’s trans-membrane pressure (Pa);
δm
membrane thickness (m);
εc
cake’s porosity (−);
ϵsmp
SMP concentration factor (−);
θc
cake’s depth or thickness (m);
µ
viscosity (Pa s);
υ
fluid kinematic viscosity (m2 s−1);
ρb
bulk cake density (kg m−3);
ρf
fluid’s density (kg m−3);
σa
adjustable parameter related to pore constriction (m3 kg);
τ
cake water content (−);
φ
adjustable parameter related to the total resistance (−);
ω
angular velocity (rad s−1).

Conflicts of Interest

The authors declare no conflict of interest.

References

  1. Bhattacharjee, C.; Bhattacharya, P.K. Ultrafiltration of black liquor using rotating disk membrane module. Sep. Purif. Technol. 2005, 49, 281–290. [Google Scholar] [CrossRef]
  2. Jaffrin, M.Y.; Ding, L.H.; Akoum, O.; Brou, A. A hydrodynamic comparison between rotating disk and vibratory dynamic filtration systems. J. Membr. Sci. 2004, 242, 155–167. [Google Scholar] [CrossRef]
  3. Al-Akoum, O.; Jaffrin, M.Y.; Ding, L.H.; Paullier, P.; Vanhoutte, C. An hydrodynamic investigation of microfiltration and ultrafiltration in a vibrating membrane module. J. Membr. Sci. 2002, 197, 37–52. [Google Scholar] [CrossRef]
  4. Bouzerar, R.; Paullier, P.; Jaffrin, M.Y. Concentration of mineral suspensions and industrial effluents using a rotating disk dynamic filtration module. Desalination 2003, 158, 79–85. [Google Scholar] [CrossRef]
  5. Frappart, M.; Jaffrin, M.Y.; Ding, L.H. Reverse osmosis of diluted skim milk: Comparison of results obtained from vibratory and rotating disk modules. Sep. Purif. Technol. 2008, 60, 321–329. [Google Scholar] [CrossRef]
  6. Sarkar, D.; Bhattacharjee, C. Modeling and analytical simulation of rotating disk ultra-filtration module. J. Membr. Sci. 2008, 320, 344–355. [Google Scholar] [CrossRef]
  7. Sarkar, D.; Datta, D.; Sen, D.; Bhattacharjee, C. Simulation of continuous stirred rotating disk-membrane module: An approach based on surface renewal theory. Chem. Eng. Sci. 2011, 66, 2554–2567. [Google Scholar] [CrossRef]
  8. Torras, C.; Pallares, J.; Valls, R.G.; Jaffrin, M.Y. CFD simulation of a rotating disk flat membrane module. Desalination 2006, 200, 453–455. [Google Scholar] [CrossRef]
  9. Bentzen, T.R.; Ratkovich, N.; Madsen, S.; Jensen, J.C.; Bak, S.N.; Rasmussen, M.R. Analytical and numerical modelling of Newtonian and non-Newtonian liquid in a rotational cross-flow MBR. Water Sci. Technol. 2012, 66, 2318–2327. [Google Scholar] [CrossRef] [PubMed]
  10. Engler, J.; Mark, R.W. Particle fouling of a rotating membrane disk. Water Res. 2000, 34, 557–565. [Google Scholar] [CrossRef]
  11. Jørgensen, M.K.; Malene, T.P.; Morten, L.C. Dependence of shear and concentration on fouling in a membrane bioreactor with rotating membrane discs. AIChE J. 2014, 60, 706–715. [Google Scholar] [CrossRef]
  12. Judd, S. The MBR Book: Principles and Applications of Membrane Bioreactors, 1st ed.; Elsevier: Amsterdam, the Netherlands, 2006. [Google Scholar]
  13. Rosenberger, S.; Laabs, C.; Lesjean, B.; Gnirss, R.; Amy, G.; Jekel, M.; Schrotter, J.C. Impact of colloidal and soluble organic material on membrane performance in membrane bioreactors for municipal wastewater treatment. Water Res. 2006, 40, 710–720. [Google Scholar] [CrossRef] [PubMed]
  14. Ahn, Y.T.; Choi, Y.K.; Jeong, H.S.; Shin, S.R. Modeling of extracellular polymeric substances and soluble microbial products production in a submerged MBR at various SRTs. Water Sci. Technol. 2006, 53, 209–216. [Google Scholar] [CrossRef] [PubMed]
  15. Hermia, J. Constant pressure blocking filtration laws-application to power-law non-Newtonian fluids. Chem. Eng. Res. Des. 1982, 60a, 183–187. [Google Scholar]
  16. Meng, F.; Zhang, H.; Li, Y.; Zhang, X.; Yang, F. Application of fractal permeation model to investigate membrane fouling in membrane bioreactor. J. Membr. Sci. 2005, 262, 107–116. [Google Scholar] [CrossRef]
  17. Liu, R.; Huang, X.; Sun, Y.F.; Qian, Y. Hydrodynamic effect on sludge accumulation over membrane surfaces in a submerged membrane bioreactor. Process Biochem. 2003, 39, 157–163. [Google Scholar] [CrossRef]
  18. Duclos-Orsello, C.; Li, W.; Hob, C.-C. A three mechanism model to describe fouling of microfiltration membranes. J. Membr. Sci. 2006, 280, 856–866. [Google Scholar] [CrossRef]
  19. Paul, P. Development and testing of a fully adaptable membrane bioreactor fouling model for a sidestream configuration system. Membranes 2013, 3, 24–43. [Google Scholar] [CrossRef] [PubMed]
  20. Jaffrin, M.Y. Dynamic shear-enhanced membrane filtration: A review of rotating disks, rotating membranes and vibrating systems. J. Membr. Sci. 2008, 324, 7–25. [Google Scholar] [CrossRef]
  21. Liang, S.; Song, L.; Tao, G.; Kekre, K.A.; Seah, H. A modeling study of fouling development in membrane bioreactors for wastewater treatment. Water Environ. Res. 2006, 78, 857–863. [Google Scholar] [CrossRef] [PubMed]
  22. Giraldo, E.; Le Chevallier, M. Dynamic mathematical modelling of membrane fouling in submerged membrane bioreactors. In Proceedings of the Water Environment Federation; Session 61 through Session 70. Water Environment Federation: Alexandria, VA, USA, 2006; Volume 19, pp. 4895–4913. [Google Scholar]
  23. Yang, F.; Bick, A.; Shandalov, S.; Brenner, A.; Oron, G. Yield stress and rheological characteristics of activated sludge in an airlift membrane bioreactor. J. Membr. Sci. 2009, 334, 83–90. [Google Scholar] [CrossRef]
  24. Ratkovich, N.R.; Horn, W.; Helmus, F.; Rosenberger, S.; Naessens, W.; Nopens, I.; Bentzen, T.R. Activated Sludge Rheology: A critical review on data collection and modelling. Water Res. 2013, 47, 463–482. [Google Scholar] [CrossRef] [PubMed]
  25. Le Clech, P.; Jefferson, B.; Chang, I.S.; Judd, S.J. Critical flux determination by the flux-step method in a submerged membrane bioreactor. J. Membr. Sci. 2003, 227, 81–93. [Google Scholar] [CrossRef]
  26. Yuan, W.; Kocic, A.; Andrew, L.Z. Analysis of humic acid fouling during microfiltration using a pore blockage–cake filtration mode. J. Membr. Sci. 2002, 198, 51–62. [Google Scholar] [CrossRef]

