Article

Public Perception of Water Consumption and Its Effects on Water Conservation Behavior

1
State Key Laboratory of Soil Erosion and Dryland Farming on the Loess Plateau, Institute of Soil and Water Conservation, Northwest A&F University, Yangling 712100, Shaanxi Province, China
2
School of Surveying and Land Information Engineering, Henan Polytechnic University, Jiaozuo 454003, Henan Province, China
3
Wageningen University and Research Centre, Alterra, Soil Science Centre, P.O. Box 47, 6700 AA Wageningen, The Netherlands
*
Author to whom correspondence should be addressed.
Water 2014, 6(6), 1771-1784; https://doi.org/10.3390/w6061771
Submission received: 15 April 2014 / Revised: 7 June 2014 / Accepted: 10 June 2014 / Published: 16 June 2014
(This article belongs to the Special Issue Water Consumption and Water End-uses in Buildings)

Abstract

:
The usual perception of consumers regarding water consumption is that their bills do not match their actual water consumption. However, this mismatch has been insufficiently studied; particularly for cases related to specific water-use patterns, water conservation practices, and user socio-demographics. In this study, a total of 776 households in 16 villages situated in the rural Wei River Basin are investigated to address the gap in the literature. Questionnaires and 3-day water diaries are used for data collection and comparison. Results show that significant relations exist between perceived water consumption and actual water consumption. Participants have different perceptions of specific water-use patterns. Participants tend to underestimate their outdoor and kitchen water consumption and overestimate their indoor water consumption. Females and elder consumers accurately estimate their water consumption, whereas consumers with high education levels and incomes underestimate their actual water consumption. The groups who can accurately estimate water consumption have better water conservation consciousness and water conservation practices than those who underestimate their water consumption. The huge disparities highlighted by the results suggest that community policies and programs to improve public water conservation consciousness or practices must be implemented to enhance consumer understanding of water consumption.

1. Introduction

Water is essential to life because it heavily influences public health and living standard. However, water is unequally distributed throughout the world. At present, approximately 1.2 billion people live in areas wherein water is scarce and 1.6 billion people face economic water shortage [1]. Therefore, the World Health Organization, United Nations Children’s Fund, various governments, and public and private sector entities have exerted intensive efforts to provide sufficient water supply to residents, particularly in rural areas in developing countries [2]. Over 2 billion people have gained access to improved water supplies since 1990. The percentage of the world’s population that has access to drinking water has increased from 77% to 89% between 1990 and 2010. This percentage is expected to increase further to 92% by 2015 to meet the drinking-water target of the Millennium Development Goals, i.e., halve the proportion of the population without sustainable access to safe drinking water (compared to base year 1990) by 2015 [3]. Meanwhile, the United Nations estimates that the domestic water consumption of developing countries is expected to increase by over 50% because of improvements in water supply, living standards, and water appliances [4]. As a result, given the unpredictable global demand for water, serious and chronic water shortages may still persist in developing countries [1].
The water supplies of major Indian cities are projected to run dry by 2020 according to the World Bank [5], and half of the 662 cities in China will have insufficient water supply, with 110 cities experiencing severe water shortage [6]. Governments have now begun imposing restrictive policies to reduce water demand and resolve issues related to water shortage. The intermittent mode of water supply in many developing countries has been criticized in [7], thus urging governments and NGOs to reduce water demand by improving water conservation awareness and promoting water conservation behavior [8].
A study in Australia reported that the water consumption of Melbourne have been reduced by 57% through education and public awareness campaigns [9]. Abdul-Razzak and Ali-Khan [10] reported an 18% (about 17 liters per person per day) decrease in water consumption in Zaragoza, Spain, because of improved water conservation awareness. The 20% reduction in the water consumption of California residents is also attributed to water conservation awareness programs [11]. Dolnicar et al. [12] suggested that several factors affect water conservation behavior. These factors include environmental attitudes [13,14] and a range of demographic variables, including gender, age [15], education [16], and information transparency of water consumption, which is the strongest factor.
An improved understanding of daily water consumption practices will encourage consumers to adopt water conservation behavior [12]. Studies have shown that people often have misconceptions on actual water consumption [17,18]. Some users tend to underestimate their water consumption [19]. However, studies are lacking on consumer misconceptions regarding actual water consumption on specific water-use patterns and their relation to the socio-demographic profiles of users and household conservation awareness [17].
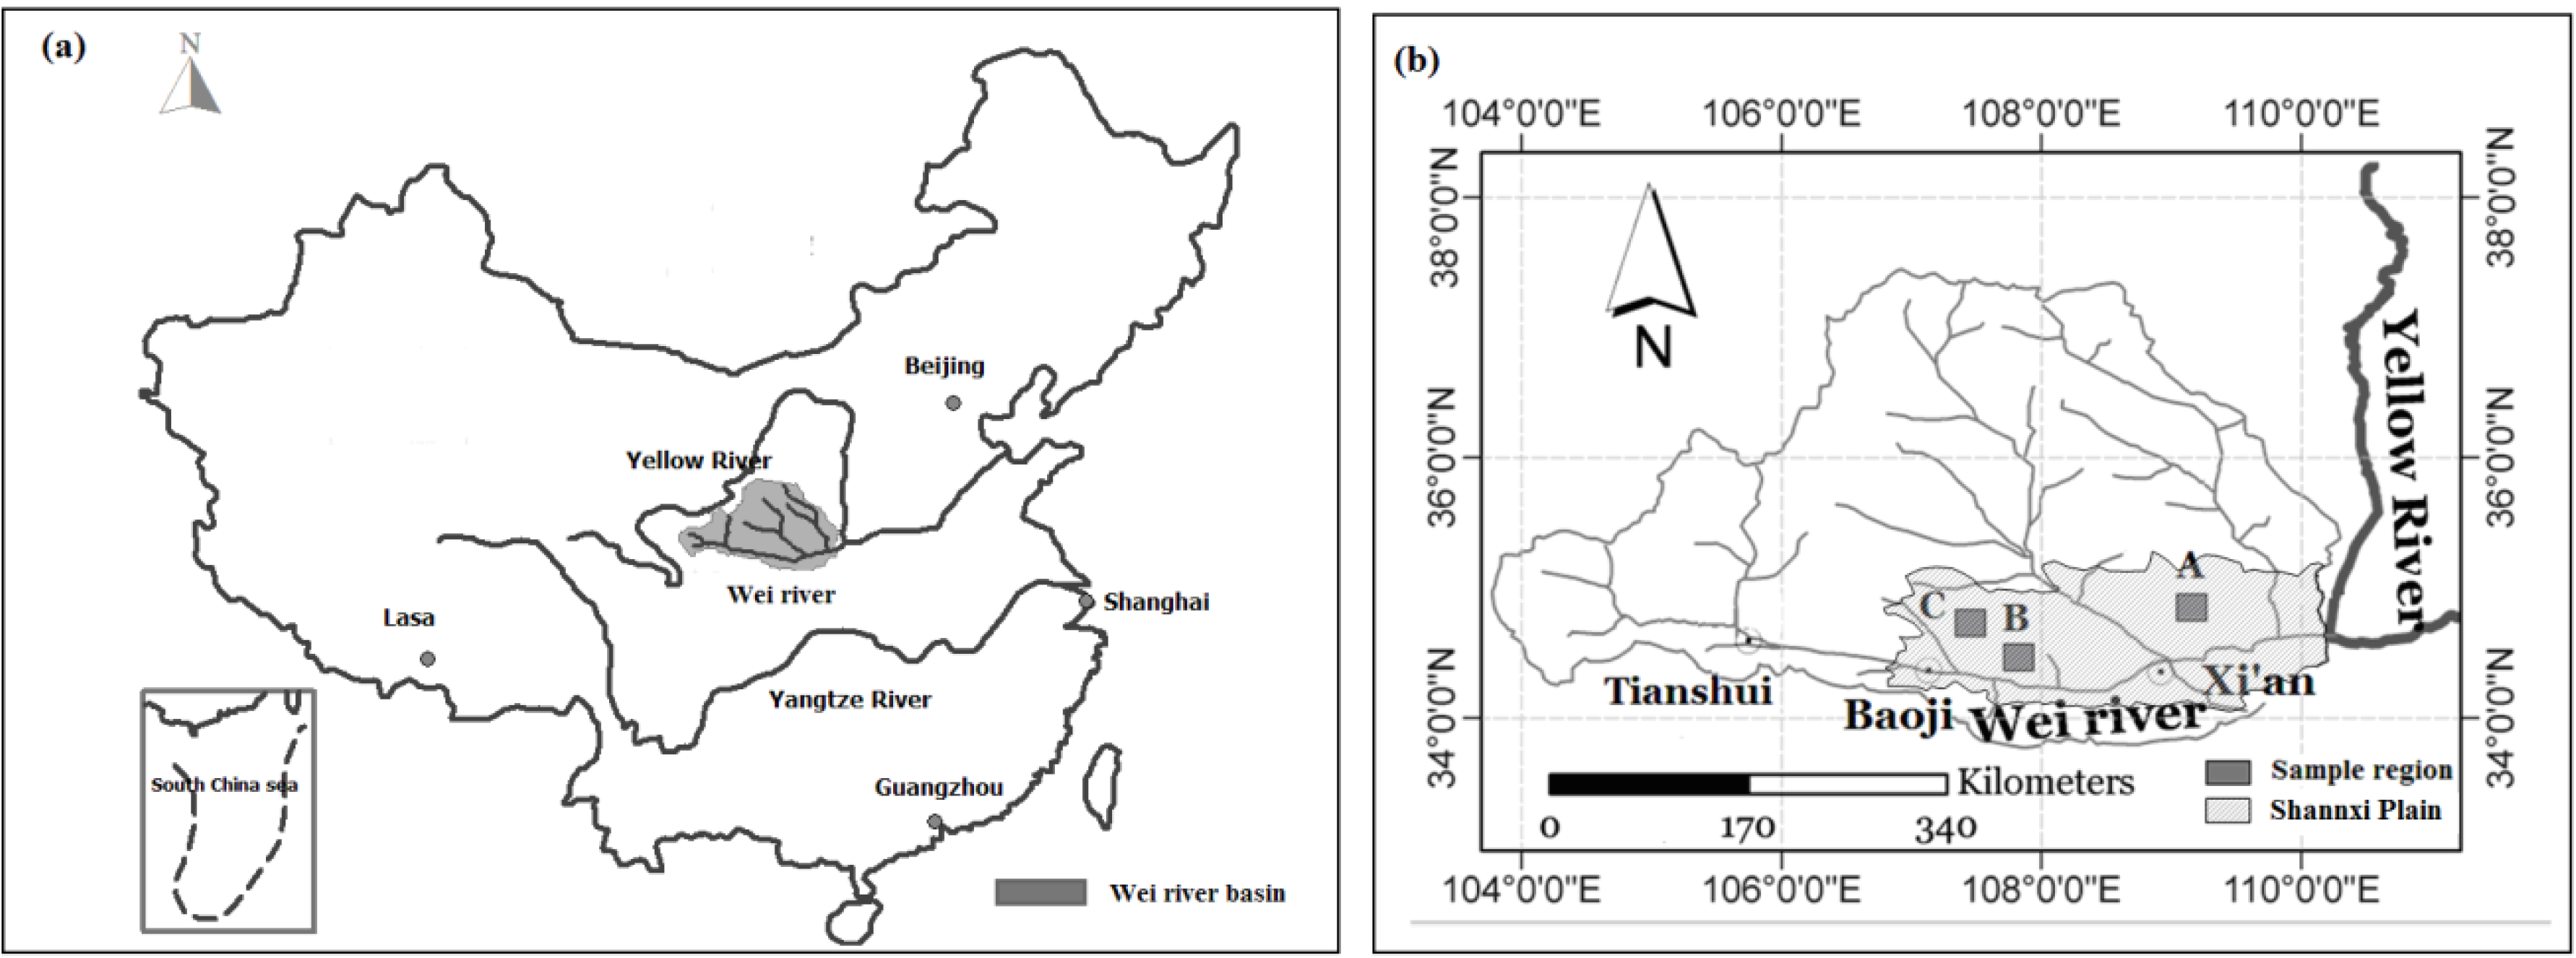
The objectives of our study are as follows: (1) identify which part of household water consumption is usually underestimated and (2) discover the differences in socio-demographic profiles, conservation awareness, and conservation practices among groups. These objectives can be achieved by analyzing the water consumption patterns of households located in the rural Wei River Basin in China.

2. Materials and Methods

2.1. Field Survey and Data Collection

The study site was located at Shannxi Plain, which is at the middle of the Wei River Basin in China (Figure 1). The Shannxi Plain is the economic center of the Wei River Basin and comprises 64% of the total population, 56% of the cultivated land, and 75% of the irrigated land of this area. The Shannxi Plain is also responsible for over 65% of the GDP of the whole basin [20]. A total of 776 households living in 16 villages were recruited for the study (water supply patterns: 24 h piped water supply; water prices: 0.20 USD/m3 to 0.35 USD/m3; exchange rate: 1 CNY = 0.1585 USD) (Table 1). The survey was conducted by using the direct observation method (a water-use diary) [21] and a paralleled questionnaire survey of 35 to 55 randomly selected households in each village. The whole survey was conducted from May 2011 to November 2011. The participants were entirely volunteered to join the study. The participants were asked to complete the questionnaire and keep a water-use diary for 3 days. Each participant received a 1.6 USD gift certificate for daily household items (towels, soaps, and shampoos). The diaries were used to record when, where, and how the participants (households) used water for different activities, as well as the volume of water consumed for each activity. Only the data collected from participants who accomplished the questionnaires, and the 3-day water-use diaries were used for data analysis. Incomplete data (i.e., with missing values) from a household were excluded from the analysis. For an example, showering may not always take place during the 3-day period; thus, this activity was excluded in the analysis. As a result, the sample size of each water use activity for analysis differed.
Figure 1. Location of the study region: (a) and (b) represent location of Wei River Basin and sample region; A, B and C represent sample region of Shannxi Plain.
Water 06 01771 g001
Table 1. Demographic characteristics of the sampled families.
Sampled SitesDistrictSampled FamiliesNet Family SizeAnnual Household Income (USD)Water Supply PatternsWater Price (USD/m3)Sample Location
AWeinan2094.1412024-h piped water supply0.3534°45' N–34°49' N, 109°09' E–109°15' E
BYanglin-Wugong3343.9432024-h piped water supply0.2034°17' N–34°20' N, 107°57' E–108°04' E
CBaoji2334.2401024-h piped water supply0.3234°21' N–34°24' N, 107°24' E–107°29' E
Notes: Net household size is excluding members who reside outside the household for more than 8 months; Exchange rate of currency: 1 CNY = 0.1585 USD.
The survey information addressed the following:
(1) Information obtained from questionnaires were socioeconomic profiles (age, gender, education, and income), conservation awareness of interviewers (Table 2), individual water-use patterns, water consumption activities, and water conservation practices [22]; (2) information obtained from the water-use diary included individual water-use patterns and activities.
Table 2. Interview questions for indicators of water conservation consciousness [16,23].
ItemsInterview Questions
Q1Our society is undergoing water shortages and pollution issues
Q2It is important to always conserve water to avert water shortages
Q3People should use no more water in the home than is necessary
Q4If each household reduces the amount of water it uses by just a little, it will make a big difference for the community
Q5Making an effort to save water is an indication of good upbringing and culture
Q6I feel a moral obligation to use water carefully
Q7My neighbors and friends always practice water conservation
Q8I always regular check the water bill

2.2. Data Analysis

Smart metering was used to measure “actual water use” in households. Smart metering is a method that can provide accurate high-resolution data and enable the exact quantification of water consumption activities at an end-user level (e.g., shower, tap, toilet, etc.) [17,24,25]. However, in the rural areas of China, the installation of smart meters is unfeasible because of technical and financial constraints. Instead of smart metering, the diary method can be used to collect data in rural China.
The diary method has been proven to be a more accurate and valid data collection technique than the recall method for a range of behavioral phenomena [26,27], which include water consumption [21], drug use [28], nutrient intake [29], and alcohol consumption [30]. Wutich [31] compared three methods (i.e., water-use diary, prompted recall, and free recall) used in collecting data on household water use. The results showed that the water-use diary provided the most accurate data on household water use than the two other methods. In the current paper, the data collected from water-use diaries were considered the actual water use and data from the questionnaire were considered perceived water use.
All data were coded and analyzed by using SPSS (Version 15.0) to obtain the mean ± standard deviation for each case. The actual and perceived water consumption patterns in several aspects (i.e., drinking and personal hygiene, kitchen, showering, laundry, vegetable garden, and house and yard cleaning) were plotted and the participants were divided into three groups (i.e., overestimation, accurate estimation, and underestimation groups). One-way ANOVA combined with Tukey’s post-hoc test was used to statistically analyze and compare multiple water consumption awareness and practices among the perceived groups. A difference in p-value < 0.05 was considered statistically significant.

3. Results

3.1. Perceived and Actual Water Use

The participants show good perceptions on the amount of water they consumed for laundry. However, the participants easily underestimate their water consumption for vegetable and garden watering, house and yard cleaning, and kitchen use. A slight overestimation of water consumption for showering, drinking, and personal hygiene was also observed (Figure 2). The participants were divided into three groups depending on their perceived and actual water consumption: the overestimation group (the amount of perceived water consumption exceeded 30% of the actual water consumption), the accurate estimation group (the amount of perceived water consumption is between 70% and 130% of the actual water consumption), and the underestimation group (the amount of perceived water consumption is less than 70% of the actual water consumption) (Figure 3). Only 30% of the participants accurately estimate their actual water consumption, whereas over 70% of the participants provide incorrect estimations of their total water consumption (45% and 25% underestimated and overestimated their actual water use, respectively). Females and elderly participants usually estimate their water consumption accurately, whereas males or younger participants often underestimate their water consumption. Educated participants with high income levels also underestimate their water consumption compared with their less educated participants (Table 3).
Table 3. Average socio-economic characteristics of estimation groups with total consumption.
Socio-Economic characteristicsOverestimation groupAccurate estimation groupUnderestimation groupSignificance
Gender1.5 a1.7 a1.2 b0.004
Age/year50 a46 a37 b0.000
Education/year7.2 b6.4 b10.5 a0.000
Household income (USD)3850 b3680 b5140 a0.000
Notes: Gender: male = 1, female = 2; Education/year: 1–6 year (primary education), 7–9 year (junior secondary education), and 10–12 (high school). Exchange rate of currency: 1 CNY = 0.1585 USD; means with different superscripts within each row differ significantly (p < 0.05) on Tukey post hoc tests.
Figure 2. Mean value of perceived and actual water consumed for the water use patterns of the participants.
Water 06 01771 g002
Notes: Lpcd indicates liters per capita per day; error bars for 95% confidence intervals are omitted because they are typically no taller than the symbols themselves; the diagonal dashed line represents perfect accuracy; the samples of the water use activities are different due to some activities, for example showering are not always take place and recorded in the periods diaries, but sated in the questionnaire were excluded in analysis.
Figure 3. Division of overestimation, accurate estimation and underestimation of water consumption groups.
Water 06 01771 g003
Notes: the blank region above the line (A) means overestimated of water consumption, and below the line (B) means underestimated of water consumption; dotted region mean accurately estimated of water consumption.

3.2. Relations between Perceived and Actual Water Consumption

The public perception of water consumption is significantly associated with actual water consumption. Perceived water consumption for laundry is strongly associated with actual consumption (r = 0.838, p < 0.01) followed by showering (r = 0.666, p < 0.01), vegetable and garden watering (r = 0.558, p < 0.01), and drinking and personal hygiene (r = 0.516, p < 0.01). Household and yard cleaning (r = 0.39, p < 0.01) and kitchen use (r = 0.431, p < 0.01) show less association with actual consumption. Water consumed for house and yard cleaning are the most underestimated, followed by vegetable and garden watering and kitchen. Water consumption for outdoor purposes is easily underestimated by the majority of residents (Figure 2 and Figure 4) compared with indoor water use. Water consumption varies among the three perception groups. The underestimation group consumes more water for kitchen use, vegetable gardening, and house and yard cleaning purposes than the overestimation and accurate estimation groups (Table 4).
Figure 4. Perceived and actual water consumed of different water use patterns. (AF) represent drinking and personal hygiene, kitchen, laundry, showering, vegetable and garden watering, house and yard cleaning.
Water 06 01771 g004
Notes: Dots located left, inside and right of gray region represent overestimation, accurate estimation and underestimation of actual water consumed, respectively.
Table 4. Water use patterns under different estimation groups.
Water Use PatternsOverestimation GroupAccurate Estimation GroupUnderestimation GroupN
Personal hygiene (L/person)6.5 ± 1.9 b8.5 ± 2.2 a8.3 ± 2.3 a538
Kitchen (L/household)27.5 ± 5.0 c39.3 ± 10.6 b50.9 ± 12.1 a519
Showering (L/person)9.5 ± 1.9 a9.2 ± 2.5 a8.8 ± 2.4 a507
Laundry (L/household)34.6 ± 10.3 a32.2 ± 9.3 a28.4 ± 6.8 a472
Vegetable gardening (L/household)31.8 ± 8.6 c52.9 ± 16.8 b81.7 ± 16.1 a517
House and yard cleaning (L/household)13.5 ± 2.3 c22.3 ± 5.8 b28.2 ± 6.3 a517
Note: Means with different superscripts within each row differ significantly (p < 0.05) a > b > c.

3.3. Water Conservation Consciousness and Practices under Different Perception Groups

Local residents show good water conservation consciousness (mean score: 3.93 to 3.96; Cronbach’s alpha from 0.883 (n = 472) to 0.901 (n = 538), (Table 5). The participants who accurately estimate their water consumption show better water conservation consciousness than those from the two other groups, particularly for outdoor and kitchen purposes. An insignificant difference in conservation consciousness was observed between the overestimation and underestimation groups. For water conservation practices, participants who underestimate their water consumption observe fewer conservation practices than the overestimation and accurate estimation groups, particularly in terms of vegetable gardening, house and yard cleaning, kitchen use, and showering. An insignificant difference in the adoption of conservation practices was observed between the overestimation and accurate estimation groups (Table 6).
Table 5. Water conservation consciousness under different perception groups for each water use pattern (Mean ± SD).
Water Use PracticeMeanOverestimation GroupAccurate Estimation GroupUnderestimation GroupSignificance
Personal hygiene (n = 538)3.96 ± 1.424.11 ± 1.563.89 ± 1.363.96 ± 1.270.241
Showering (n = 507)3.95 ± 1.434.03 ± 1.463.93 ±1.423.86 ±1.410.663
Laundry (n = 472)3.93 ± 1.433.89 ± 1.383.98 ± 1.443.67 ±1.460.349
Kitchen (n = 519)3.95 ± 1.433.71 ± 1.60 b4.11 ± 1.35 a3.70 ± 1.50 b0.007
House cleaning (n = 517)3.95 ± 1.433.24 ± 1.68 b4.22 ± 1.28 a3.70 ± 1.49 b0.000
Vegetable gardening (n = 517)3.95 ± 1.433.11 ± 0.94 b4.53 ± 0.94 a3.68 ± 1.52 b0.000
Notes: Means with different superscripts within each row differ significantly (p < 0.05) a > b; Cronbach’s alpha from 0.883 (n = 472) to 0.901 (n = 538); very likely = 5, somewhat likely = 4, unsure = 3, somewhat unlikely = 2, very unlikely = 1.
Table 6. Water conservation practices under different perception groups for each water use pattern (Mean ± SD).
Water Use Conservation PracticesOverestimation GroupAccurate Estimation GroupUnderestimation GroupSignificanceN
Personal hygieneTurning off the faucet while brushing teeth, or lathering your face and hands4.04 ± 1.203.96 ± 1.274.15 ± 1.500.484538
ShoweringAvoiding running water in the shower while shampooing hair and soaping body3.92 ± 0.96 a3.79 ± 1.41 a2.98 ±0.98 b000507
Taking short showers2.72 ± 1.252.67 ± 1.212.70 ± 1.340.965
LaundryLaundering full loads whenever possible4.33 ± 1.344.20 ± 0.104.42 ± 0.820.308472
Hand washing several items at the same time, and using the rinse water from one group of items as the wash water for next4.43 ± 1.194.31 ± 1.044.58 ± 1.050.194
KitchenAvoiding the use of running water when washing fruits and vegetables; washing them in a basin to conserve water.3.85 ± 1.11 a3.68 ± 1.59 a3.29 ± 1.08 b0.000519
Washing all the dishes together in a basin3.92 ± 1.313.96 ± 1.314.13 ± 1.510.587
Avoiding the unnecessary rinsing of dishes, wiping dishes with duster cloth or using a scraper to minimize rinsing3.65 ± 1.16 a3.82 ± 1.51 a3.18 ± 1.28 b000
House and yard cleaningCleaning yards with a broom or mopping instead of using a hose4.58 ± 0.50 a4.51 ± 0.86 a3.08 ± 1.29 b000517
Cleaning floors with a broom and avoiding frequent floor mopping2.84 ± 1.163.28 ± 1.373.07 ± 1.280.19
Using gray water from washing machines for cleaning yards, or flushing toilets4.49 ± 0.86 a4.38 ± 1.08 a4.12 ± 1.14 b0.001
Vegetable gardeningWatering vegetable garden only in the evening or morning4.76 ± 0.64 a4.82 ± 0.47 a4.11 ± 1.13 b000517
Watering vegetable garden less frequently3.49 ± 1.29 a3.24 ± 1.34 a2.29 ± 1.43 b000
Notes: means with different superscripts within each row differ significantly (p < 0.05) a > b; very likely = 5; somewhat likely = 4; unsure = 3; somewhat unlikely = 2; very unlikely = 1.

4. Discussion

Many studies have confirmed that water conservation attitudes and behavior are closely related [23,32]. Some studies have revealed that residents with positive attitudes may not always exhibit positive behavior [33]. This finding reveals that a big gap exists between attitude and behavior. The reasons behind such a gap include water-use habits, price, water-saving behavior information, water consumption perception, and trust in authorities. Corral-Verdugo et al. [13] emphasized the importance of public perception on water consumption because this perception helps develop attitudes and behavior that lead to water conservation. If residents have false perceptions of water consumption, water-saving methods such as proper education to change behavior and the use of water-saving devices to improve efficiency will be unsuccessful [
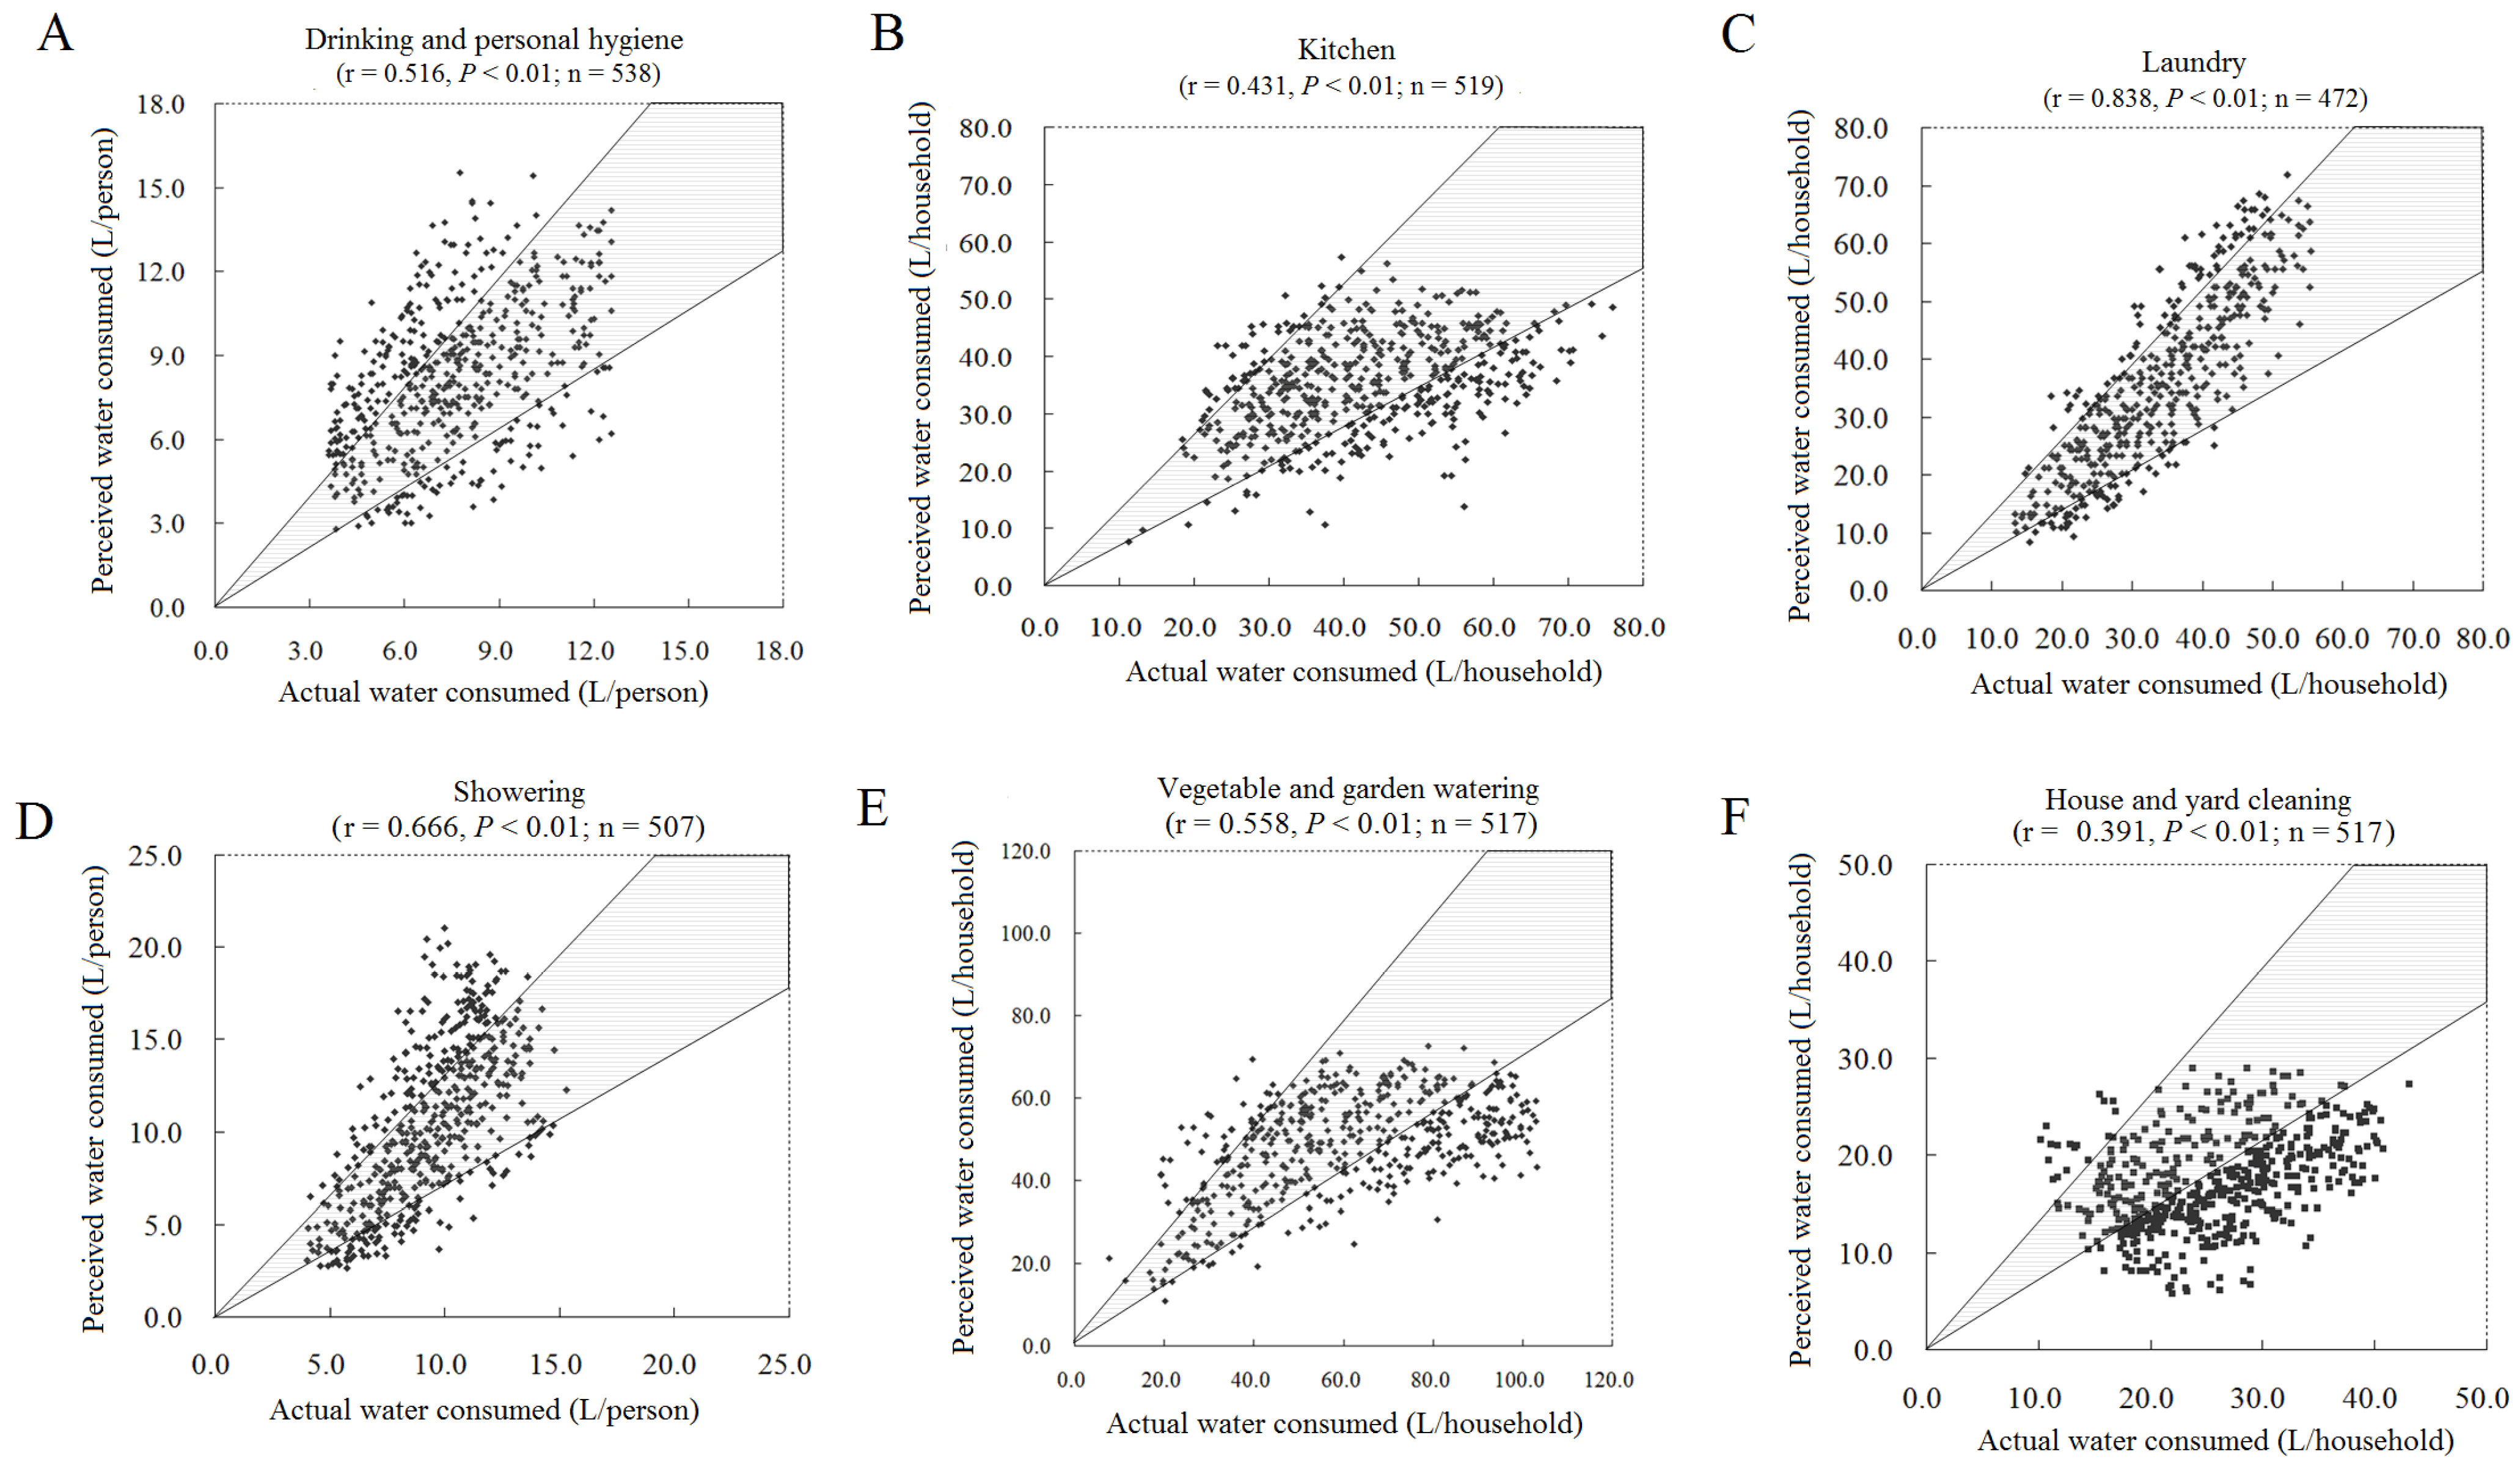
34]. Although the water use activities of families are repeatedly performed every day, the participants in this study exhibit little knowledge about the water consumption of certain activities. Our findings confirm the results of previous studies, i.e., big gaps exist between perceived and actual water consumption [17].
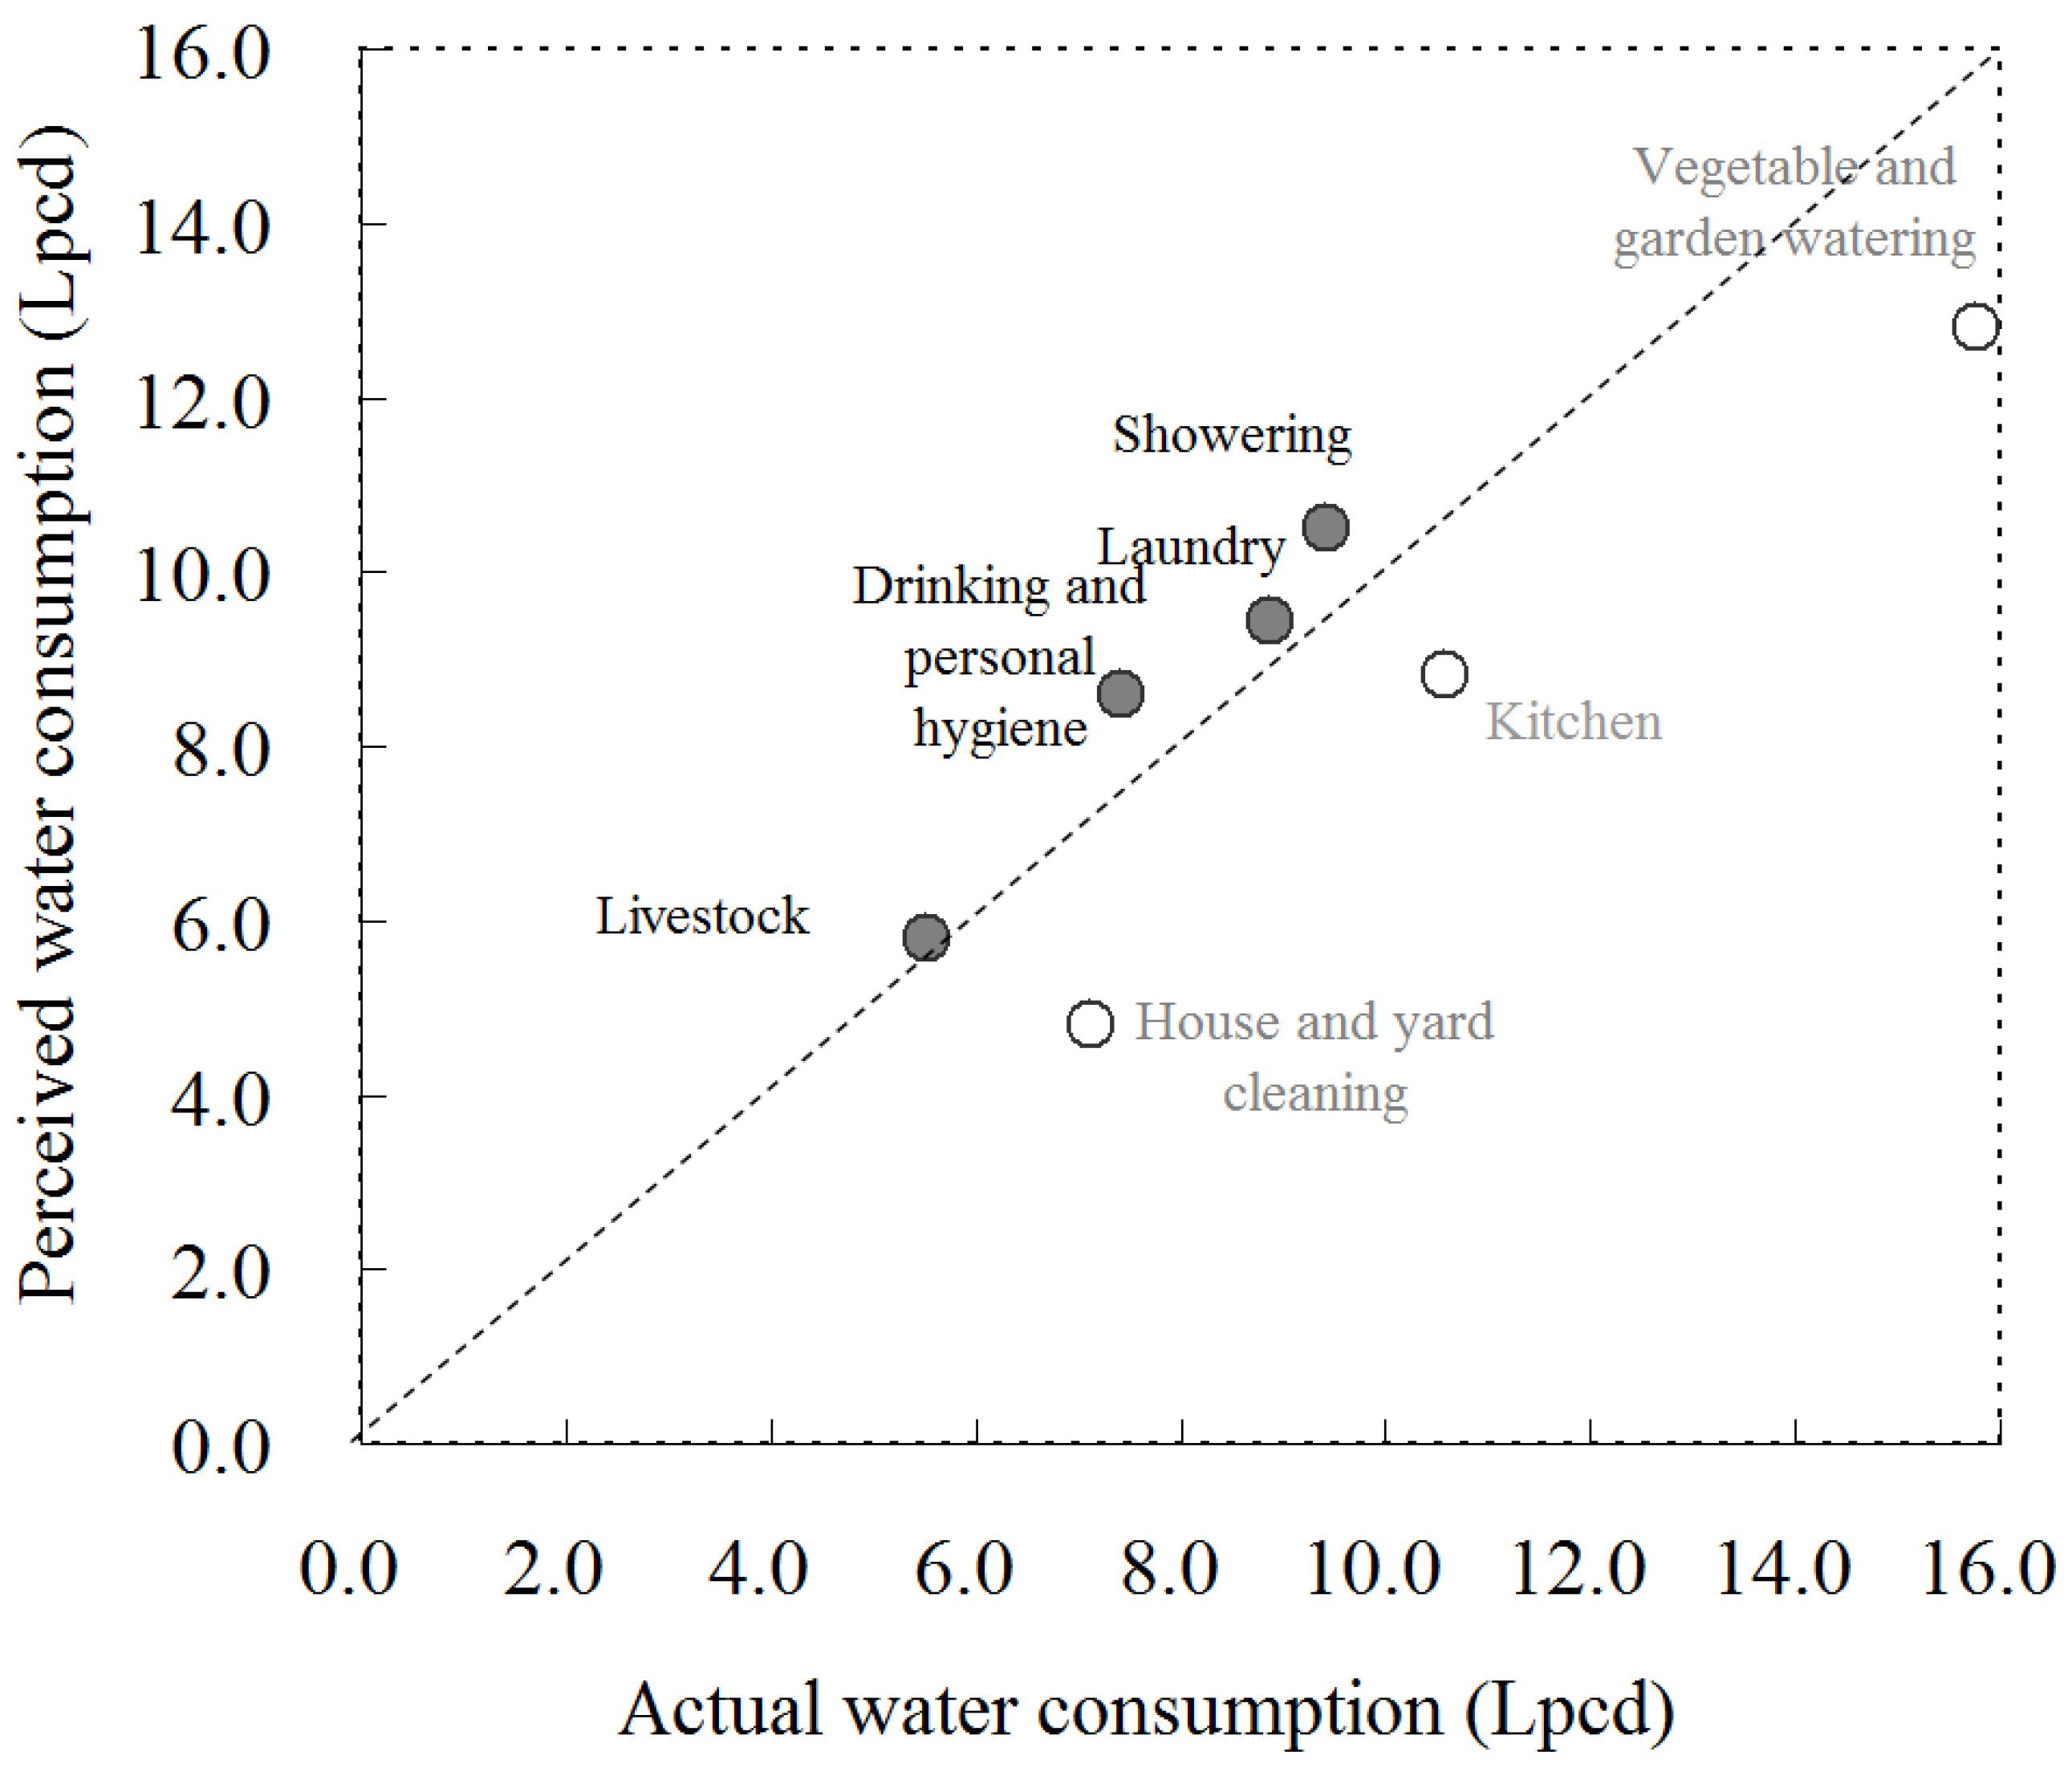
Water-use patterns are divided into indoor use (drinking, personal hygiene, kitchen use, and laundry) and outdoor use (vegetable garden, livestock, and house and yard cleaning) [7]. The current study presented residents with different estimated water-use activities, such as easily overestimated indoor water-use patterns and underestimated outdoor water-use patterns. Indoor water-use activities consumed less water than outdoor water-use activities even though the former was more frequently performed than the latter [22]. Residents commonly perceive that their indoor water-use activities expend more water than their actual consumption. Moreover, residents easily disregard their actual outdoor water use for vegetable gardening and house and yard cleaning because of arbitrary outdoor water consumption [35]. Kitchen water consumption includes fruit washing, food preparation, and cleaning utensils and tableware. Overlooking other water activities in the kitchen can lead to the underestimation of water consumption among female participants. Furthermore, males also tend to underestimate their kitchen water consumption because they seldom participate in kitchen activities in rural developing countries [36,37]. Residents show good perception of water consumption for laundry because water consumed with regular vessels can be easily estimated.
The Department of Sustainability and Environment (2005) indicated that water conservation behavior and attitudes heavily rely on the perception of residents regarding water resource and usage [19]. The water conservation consciousness of the accurate estimation group is higher than those of the overestimation and underestimation groups. Moreover, the Water Services Association of Australia found that the majority of households underestimate their water consumption, thus leading to wastage [38]. Our study verified that the underestimation groups usually observe fewer conservation practices and consumed more water than the overestimation and accurate estimation groups. The water consumption, conservation consciousness, and water-use practices of residents in the rural Wei River Basin are highly affected by their own perception of water consumption. Moreover, large disparities were found in the perceived and actual water use among residents across gender, age, education, and income groups. Females and elderly users easily overestimate their water consumption compared with males and younger users because the former resident group performs more water activities in rural households than the latter resident group [22]. Residents with high income and educational levels easily underestimate their own consumption. These groups usually have a number of appliances that consume water for operation (washing machine, solar water heater, etc.) and outdoor activities, such as household and yard cleaning and vegetable and garden watering. The members of this group consume more water than the other groups and are not concerned with their water bills, thus leading to water consumption underestimation. Residents are unaware of these aspects of water use, thus increasing their overall consumption. Almost half of the water consumption is allotted for outdoor use, particularly in the high water consumption group [35]. Therefore, ensuring that consumers are well informed about the actual amount of water use, particularly for high income and well-educated groups, is important in changing this group’s attitude and behavior toward water conservation.

5. Conclusions

Correct perception of water consumption and usage are the key factors that affect water-use behavior. The majority of the population has misconceptions on water consumption, thus leading to water wastage in households. Residents underestimate their outdoor water consumption and overestimate their indoor water consumption. Females and elders show good perception of water consumption, whereas highly educated residents with high income levels underestimate their water consumption. Residents with correct estimates of water consumption have high water conservation awareness.

6. Study Implications

This study shows that the information transparency of the water consumption of residents is the key factor that affects water-use behavior. This result indicates that household water consumption can be reduced easily (1) if residents understand their water consumption levels for household activities and (2) if water authorities know the clear information of the perceived and actual water consumption of residents. Water price transparency and water bill reform are the most efficient methods for regular household water consumption because they enhance the information transparency of residents with their water consumption and water saved through behavioral changes. Therefore, community-based strategies in the rural villages of China should include the following: (1) installation of water meters and modification of the current quota pricing mode into volume pricing; (2) improvements in the transparency of water bills by adopting monthly or daily bills; (3) reform of price bills into volume bills to inform consumers about their actual daily water consumption; (4) creation of an effective mechanism to improve price incentives with ladder pricing, promote water-saving behavior among residents, and help residents correctly perceive their water consumption and water-use behavior.

Acknowledgments

This work was supported by the National Natural Science Foundation of China (Grant Nos. 41201566 and 41171420). China-Netherlands Joint Scientific Thematic Research Programme (JSTP) supported by the External Cooperation Program of the Chinese Academy of Sciences (GJHZ1018) and Netherlands Organization for Scientific Research (NWO, OND1339291). The invaluable assistance given by those households in Wei River Basin who spared the time to take part in the questionnaires and water-use diaries is gratefully acknowledged.

Author Contributions

Fei Wang and Guobin Liu conceived and designed the experiments. Liangxin Fan, Xiaomei Yangand Wei Qin performed the field survey. Liangxin Fan analyzed the data. Liangxin Fan and Fei Wang wrote the paper.

Conflicts of Interest

The authors declare no conflict of interest.

References

  1. United Nations Office for the Coordination of Humanitarian Affairs (OCHA). Water Scarcity and Humanitarian Action: Key Emerging Trends and Challenges. Policy Development and Studies Branch. 2010. Available online: http://ochanet.unocha.org/p/Documents/OCHA%20OPB%20Water%20%2011Nov10%20fnl.pdf (accessed on 8 March 2014).
  2. World Health Organization and the United Nations Children's Fund (WHO & UNICEF). Progress on Drinking Water and Sanitation: 2012 (Update), USA. 2012. Available online: http://www.unicef.org/media/files/JMPreport2012.pdf (accessed on 8 March 2014).
  3. United Nations Development Programme (UNDP). The Millennium Development Goals Report 2012. United Nations Development Programme: New York, 2012. Available online: http://www.undp.org/content/dam/undp/library/MDG/english/The_MDG_Report_2012.pdf (accessed on 8 March 2014).
  4. Reig, P.; Shiao, T.; Gassert, F. Aqueduct Water Risk Framework. 2013. Available online: http://pdf.wri.org/aqueduct_water_risk_framework.pdf (accessed on 8 March 2014).
  5. Brooks, N. Imminent Water Crisis in India. 2007. Available online: http://www.arlingtoninstitute. org/wbp/global-water-crisis/606# (accessed on 30 March 2014).
  6. Jiang, Y. China’s water scarcity. J. Environ. Manag. 2009, 90, 3185–3196. [Google Scholar] [CrossRef]
  7. Fan, L.; Liu, G.; Wang, F.; Ritsema, C.J.; Geissen, V. Domestic water consumption under intermittent and continuous modes of water supply. Water Resour. Manag. 2014, 28, 853–865. [Google Scholar] [CrossRef]
  8. Alitchkov, D.K.; Kostova, I.S. Possibilities for water conservation in Bulgaria. GeoJournal 1996, 4, 421–429. [Google Scholar]
  9. Bryx, D.; Bromberg, G. Best Practices in Domestic Water Demand Management. 2009. Available online: http://www.consensus.ie/wp/wp-content/uploads/2013/11/RUTH-DOYLE-THESIS_VOL-ONEpdf (accessed on 8 March 2014).
  10. Abdul-Razzak, M.J.; Ali-Khan, M.Z. Domestic water conservation potential in Saudi Arabia. Environ. Manag. 1990, 2, 167–178. [Google Scholar]
  11. Zuchowicki, W.; Kuczynski, W. Study on water consumption in apartment buildings in Koszalin. Przem. Chem. 2008, 5, 628–629. [Google Scholar]
  12. Dolnicar, S.; Hurlimann, A.; Grün, B. Water conservation behavior in Australia. J. Environ. Manag. 2012, 105, 44–52. [Google Scholar] [CrossRef]
  13. Corral-Verdugo, V.; Frias-Armenta, M.; Perez-Urias, F.; Orduna-Cabrera, V.; Espinoza- Gallego, N. Residential water consumption, motivation for conserving water and the continuing tragedy of the commons. Environ. Manag. 2002, 30, 527–535. [Google Scholar] [CrossRef]
  14. Corral-Verdugo, V.; Frías-Armenta, M. Personal normative beliefs, antisocial behavior, and residential water conservation. Environ. Behav. 2006, 3, 406–421. [Google Scholar] [CrossRef]
  15. Matos, C.; Teixeira, C.A.; Bento, R.; Varajão, J.; Bentes, I. An exploratory study on the influence of socio-demographic characteristics on water end uses inside buildings. Sci. Total Environ. 2014, 466, 467–474. [Google Scholar]
  16. Clark, W.A. Obstacles and Opportunities for Water Conservation in Blagoevgrad, Bulgaria. Available online: https://etda.libraries.psu.edu/paper/6567/1821 (accessed on 8 March 2014).
  17. Beal, C.D.; Stewart, R.A.; Fielding, K. A novel mixed method smart metering approach to reconciling differences between perceived and actual residential end use water consumption. J. Clean. Prod. 2013, 60, 116–128. [Google Scholar] [CrossRef]
  18. Justes, A.; Barberán, R.; Farizo, B.A. Economic valuation of domestic water uses. Sci. Total Environ. 2014, 472, 712–718. [Google Scholar] [CrossRef]
  19. Hassell, T.; Cary, J. Promoting Behavioural Change in Household Water Consumption: Literature Review. Available online: http://www.vu.edu.au/sites/default/files/Promoting%20behavioural%20Change%20in%20Household%20Water%20Consumption.pdf (accessed on 8 March 2014).
  20. Zhang, W.Z.; He, W.Q.; Wang, Y.B. Situation and countermeasure of water resources development in Yangling. J. Water Resour. Water Eng. 2005, 1, 75–77. (In Chinese) [Google Scholar]
  21. Krantz, H. Matter that Matters: A Study of Household Routines in a Process of Changing Water and Sanitation Arrangements. Ph.D. Thesis, Linköping University, Linköping, Sweden, April 2005. [Google Scholar]
  22. Fan, L.; Liu, G.; Wang, F.; Geissen, V.; Ritsema, C.J.; Tong, Y. Water use patterns and conservation in households of Wei River Basin, China. Resour. Conserv. Recycl. 2013, 74, 45–53. [Google Scholar] [CrossRef]
  23. Willis, R.M.; Stewart, R.A.; Panuwatwanich, K.; Williams, P.R.; Hollingsworth, A.L. Quantifying the influence of environmental and water conservation attitudes on household end use water consumption. J. Environ. Manag. 2011, 92, 1996–2009. [Google Scholar] [CrossRef]
  24. Gato-Trinidad, S.; Jayasuriya, N.; Roberts, P. Understanding urban residential end uses of water. Water Sci. Technol. 2011, 64, 36–42. [Google Scholar] [CrossRef]
  25. Willis, R.M.; Stewart, R.A.; Giurco, D.P.; Talebpour, M.R.; Mousavinejad, A. End use water consumption in households: Impact of socio-demographic factors and efficient devices. J. Clean. Prod. 2013, 60, 107–115. [Google Scholar] [CrossRef]
  26. Bogersa, R.P.; Brug, J.; van Assemac, P.; Dagneliea, P.C. Explaining fruit and vegetable consumption: The theory of planned behaviour and misconception of personal intake levels. Appetite 2004, 42, 157–166. [Google Scholar] [CrossRef]
  27. O’Toole, J.E.; Sinclair, M.I.; Leder, K. Collecting household water usage data: Telephone questionnaire or diary? BMC Med. Res. Methodol. 2009, 72, 2–11. [Google Scholar]
  28. Acocella, C. Using diaries to assess nonprescription drug use among university students. J. Drug Educ. 2005, 4, 267–274. [Google Scholar] [CrossRef]
  29. McNaughton, S.A.; Mishra, G.D.; Bramwell, G.; Paul, A.A.; Wadsworth, M.E.J. Comparability of dietary patterns assessed by multiple dietary assessment methods: Results from the 1946 British birth cohort. Eur. J. Clin. Nutr. 2005, 59, 341–352. [Google Scholar] [CrossRef]
  30. Heeb, J.L.; Gmel, G. Measuring alcohol consumption: A comparison of graduated frequency, quantity frequency, and weekly recall diary methods in a general population survey. Addict. Behav. 2005, 30, 403–413. [Google Scholar] [CrossRef]
  31. Wutich, A. Estimating household water use: A comparison of diary, prompted recall, and free recall methods. Field Methods 2009, 1, 49–68. [Google Scholar]
  32. Gilg, A.; Barr, S. Behavioural attitudes towards water saving? Evidence from a study of environmental actions. Ecol. Econ. 2006, 57, 400–414. [Google Scholar] [CrossRef]
  33. Jorgensen, B.; Graymore, M.; O’Toole, K. Household water use behavior: An integrated model. J. Environ. Manag. 2009, 91, 227–236. [Google Scholar] [CrossRef]
  34. Department for Environment, Food and Rural Affairs (DEFRA). Future Water: the Government’s Water. 2008. Available online: http://www.defra.gov.uk/publications/files/pb13562-future-water-080204.pdf (accessed on 8 March 2014).
  35. Keshavarzi, A.R.; Sharifzadehb, M.; Kamgar-Haghighi, A.A.; Amin, S.; Keshtkar, S.h.; Bamdad, A. Rural domestic water consumption behavior: A case study in Ramjerd area, Fars Province, I.R. Iran. Water Res. 2006, 40, 1173–1178. [Google Scholar] [CrossRef]
  36. Makoni, F.S.; Manase, G.; Ndamba, J. Patterns of domestic water use in rural areas of Zimbabwe, gender roles and realities. Phys. Chem. Earth 2004, 29, 1291–1294. [Google Scholar] [CrossRef]
  37. Upadhyay, B. Gendered livelihoods and multiple water use in North Gujarat. Agric. Hum. Values 2005, 22, 411–420. [Google Scholar] [CrossRef]
  38. Piccinin, C. Pricing for water conservation. Water Serv. Assoc. Aust. J. 2004, 1, 3–9. [Google Scholar]

