Article

Monitoring of Non-Point Source Pollutions from an Agriculture Watershed in South China

School of Civil and Transportation Engineering, South China University of Technology, Guangzhou 510640, China
*
Author to whom correspondence should be addressed.
Water 2014, 6(12), 3828-3840; https://doi.org/10.3390/w6123828
Submission received: 25 September 2014 / Revised: 22 November 2014 / Accepted: 1 December 2014 / Published: 8 December 2014
(This article belongs to the Special Issue Water Quality Control and Management)

Abstract

:
Understanding the characteristics of non-point sources (NPS) pollutions can provide theoretical support for improving water quality. Siheshui watershed located in south China was selected to explore the characteristics of NPS pollutions in rainfall-runoff process. In this small agricultural watershed, five flood events and one non-flood event were monitored, and the water quantity and quality constituents were measured. The event mean concentrations (EMCs) of pollutant constituents in runoff flows were estimated. It is shown that the EMCs of BOD5, CODMn, TSS, TP, TN, and NH3-N in the flood events are remarkably larger than those in the non-flood event. The antecedent precipitation has a large effect on the output of the pollutant concentration. The pollutant load fluxes of most pollutant constituents change synchronously with the runoff flows, and the synchronization relationship is better than that between the pollutant concentrations and the runoff flows. The Pearson correlation analysis indicates that the EMCs of CODMn, TP, and TSS are significantly correlated with rainfall runoff characteristics in the flood events, while BOD5, TN, and NH3-N show weak correlations. In addition, the mean concentration method was used to estimate the annual NPS pollution load. It is shown that the proportions of the NPS pollution load to the total pollutant load are more than 80% from 2008 to 2010.

1. Introduction

Although many efforts have been made to reduce point source pollution during the last several decades, the water quality improved slightly. This may be ascribed to the non-point sources (NPS) of pollution [1,2]. NPS is an important environmental and water quality management problem [3,4]. Unlike pollution from point source, non-point source pollution comes from many diffuse sources. NPS pollution is caused by rainfall or snowmelt flows over and through the ground. As the runoff moves, it picks up natural and anthropogenic pollutants and sends them into rivers, lakes, coastal waters, or ground waters [5]. With the development of agriculture and the increasing amount of chemical fertilizers and pesticides used in China, the proportion of NPS pollution increases significantly. The excessive use of chemicals may result in the eutrophication of many coastal and freshwater ecosystems [6,7].
In contrast to point source pollution, NPS pollution is characterized by random and intermittent occurrence, and is typically influenced by many factors, such as soil type, land use, and management practices [8,9,10,11,12,13,14,15,16]. Nutrients delivered to water bodies are always from multiple sources, and each of them has different transport and composition characteristics. Thus, the field monitoring under natural rainfall conditions plays an important role in studying the temporal and spatial variability of the nutrient pollution, and it can help to clarify the underlying mechanisms for rainfall-runoff-induced losses of nutrients. Moreover, the monitoring data can also provide useful information for the input variables in the NPS pollution load models. However, there is little synchronous monitoring data of water quantity and quality for a long series since the field onsite measurements on nutrient pollution is expensive and time consuming.
In this paper, water quantity and quality of several flood events were synchronously monitored in Siheshui watershed (South China), which is in a subtropical monsoon climate zone. The water samples were collected and analyzed. The event mean concentrations (EMCs) of runoff flows were estimated by field monitoring and statistical analysis, and the characteristics of the pollutant loads during flood events were investigated. Then, the correlation between rainfall runoff characteristics and water quality concentration was analyzed. The results can help to clarify the control scheme of water pollution and thereby improve the water environment of such moist agricultural watershed.

2. Materials and Methods
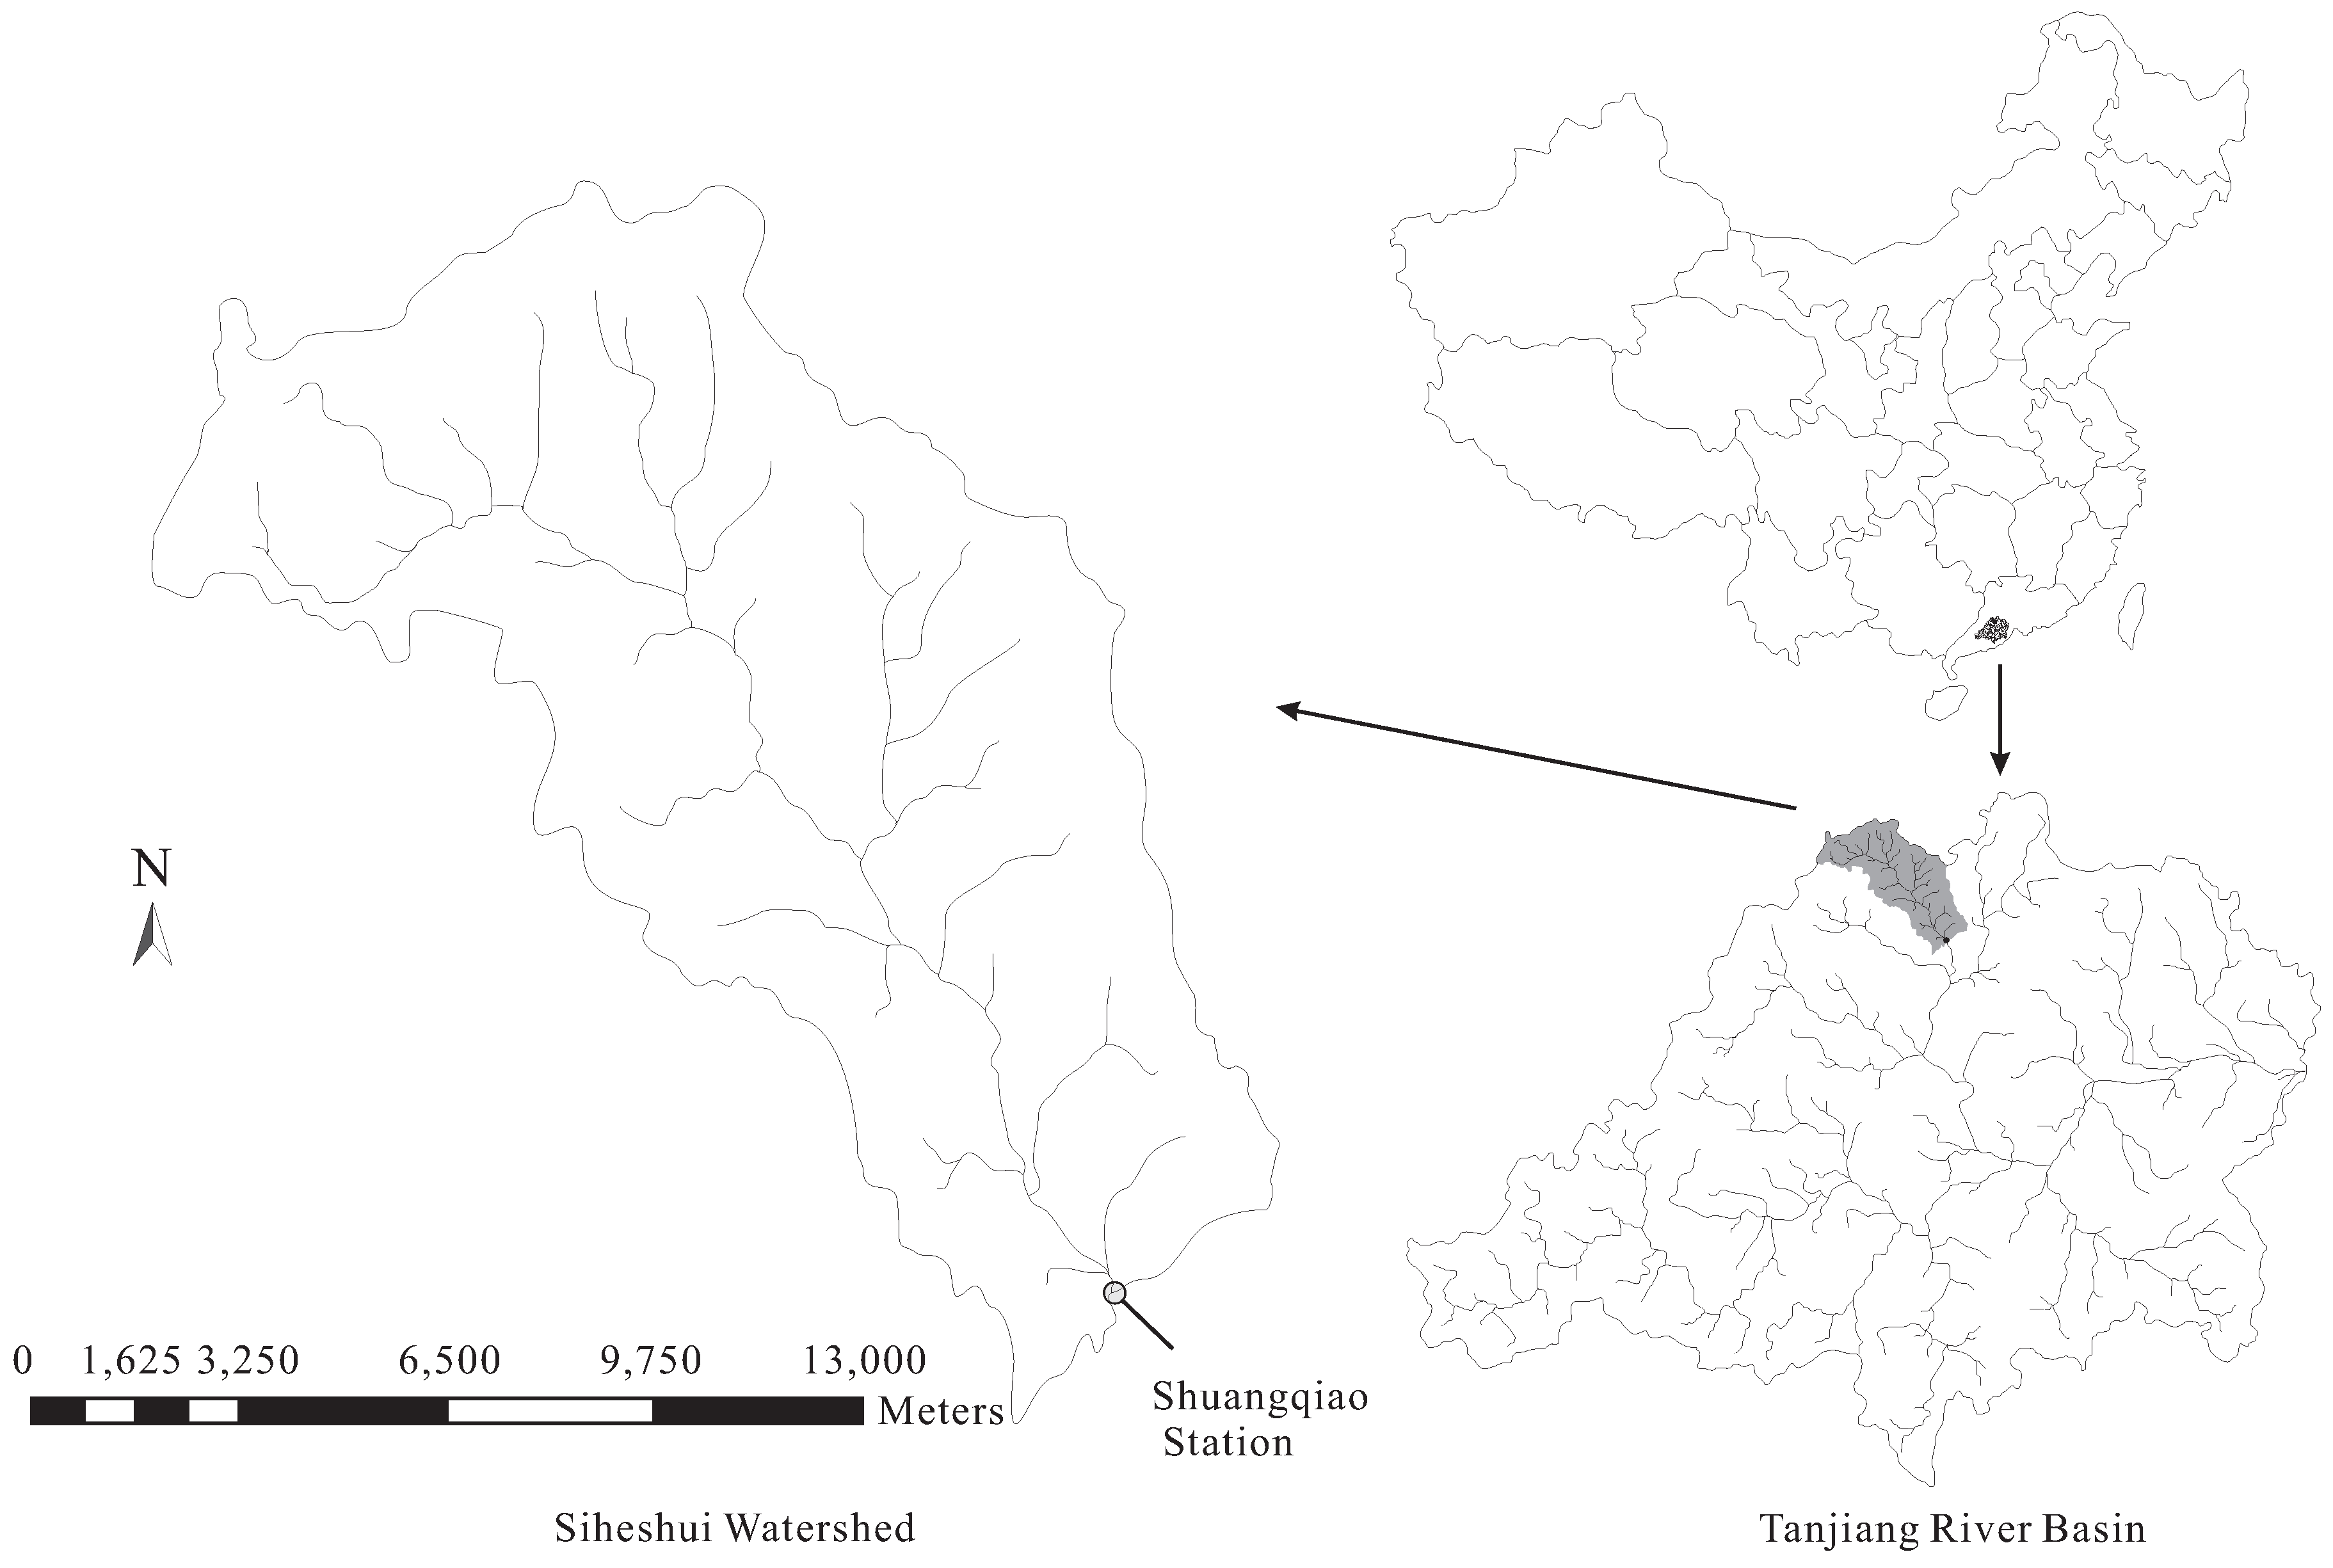
2.1. Study Area

The monitoring site was set up in Shuangqiao hydrologic station. As shown in Figure 1, the Shuangqiao hydrological station (22°35'20" N, 112°34'34" E), built in the year of 1958, is at the outlet of Siheshui watershed, which is located at the source of Tanjiang River Basin in south China. The area of Siheshui watershed is about 131 km2. The length of the main river is about 26 km and the riverbed gradient is 2.81‰. The vegetation coverage amounts to 81.5% of the watershed area, and the land use types mostly include arable, forest, and pasture land.
Figure 1. Sketch of the drainage map of Siheshui watershed in south China.
Water 06 03828 g001
The watershed is in the subtropical monsoon climate zone. The mean annual temperature in the watershed is approximately 23 °C, and the mean annual evaporation reaches 878 mm. The mean annual rainfall is 1660 mm, most of which occurs in the spring and summer season (from April to September) because of monsoon and typhoon effects. The changes of river flows are consistent with the variation of rainfall, and the maximum flow occurs in the rainy season. The mean annual runoff volume is 1.15 × 10⁸ m3.

2.2. Sample Collection

The monitoring and sampling of water quantity and quality were carried out in Shuangqiao station. From May to July 2011, five floods, which were numbered as 11-05-16, 11-05-22, 11-06-29, 11-07-12, and 11-07-19, were monitored. The naming rule of these floods is yy-mm-dd (where y, m, and d represent year, month, and date, respectively). For example, a flood occurs on 16 May 2011 is numbered as No. 110516 flood event.
The rainfall data and the water flow were synchronously monitored. The rainfall data in flood events can be obtained from the established precipitation stations in the watershed, while the water flow was measured by a flow gauge in Shuangqiao station. The starting time and the ending time of every flood event were recorded.
During the monitoring period, water samplings were also conducted in the flow gauging section. The sampling positions in the cross-section of the river were determined by the river width and the water depth. Since the river width was less than 50 m, the horizontal sampling position was located at the center of the width. However, the vertical sampling positions varied in different flood event because of the different water depths. The water depth was less than 5 m in the five flood events. If the water depth was less than 1 m, the vertical sampling position was located at 1/2 water depth; otherwise, the vertical sampling position was located at the depth of 0.5 m below the water surface. The sampling frequencies were determined by the size of the rainfall. Generally, the sampling was conducted for every 1 h. If the rainfall intensity is large, the sampling interval would be shortened to 0.5 h; if the rainfall intensity is small, the sampling interval would be extended to 2 h. Considering the basin flow concentration time, the water sampling sustained for several hours after the end of the rain.
For each flood, the rainfall runoff characteristics, including the rainfall amount, rainfall intensity, and peak flow, are listed in Table 1. In flood events, the rainfall amounts varied from 31.8 to 132.5 mm, the rainfall intensity were in the range from 2.9 to 5.4 mm/h, and the peak flow were from 8.2 to 35.5 m3/s. In order to compare the results of flood events with those of non-flood events, water samples were also collected during a non-flood period with the runoff flow of 0.80 m3/s.
Table 1. The rainfall runoff characteristics of monitored flood events.
Flood (yy-mm-dd)Rainfall Amount (mm)Rainfall Amount in the Day before the Event (mm)Rainfall Intensity (mm/h)Peak Flow (m3/s)
11-05-1632.67.94.111.1
11-05-2231.816.42.910.5
11-06-29132.51.04.635.5
11-07-1248.52.53.78.2
11-07-1970.54.05.425.7
Non-flood---0.8
The monitored water quality constituents were BOD5 (5-day biochemical oxygen demand), CODMn (chemical oxygen demand), TSS (total suspended solids), TP (total phosphate), TN (total nitrogen), and NH3-N (ammonia nitrogen). For each flood event, the collected water sample was divided into two parts, which are denoted by sample A and B, respectively. Sample A was for BOD and TSS analyses, and sample B was for COD, NH3-N, TP, and TN analyses, while the latter was acidified to pH < 2 by sulfuric acid once the water sample had been gathered. Both sample A and B were stored in 1-L polyethylene bottles, which had been pre-rinsed three times with distilled water. The water samples were analyzed immediately; otherwise they should be preserved by freezing.
Pretreatment and determination of all parameters for water quality constituents were following national standard methods in China [17]. BOD5 was measured by differential pressure method, CODMn was measured by permanganate index method, TSS was measured by gravimetric method, TP was determined using potassium persulphate oxidation and molybdenum antimony anti-spectrophotometric method, TN was determined through the alkaline potassium persulphate oxidation and ultraviolet spectrophotometric method, and NH3-N was measured with Nessler’s reagent, respectively.

2.3. Data Analysis

2.3.1. EMC Method

EMC is often used as an indicator to characterize concentrations. Due to the random change of the rainfall intensity, the pollutant constituent concentrations may change with time during a runoff event. In individual runoff event, the water quality constituents can be estimated by EMC based on the flow rate and concentration data of runoff discharge. The EMC represents a flow weighted average concentration, which can be described as [18,19]
E M C = M V = 0 T C t Q t d t 0 T Q t d t 0 T C t Q t Δ t 0 T Q t Δ t
where M is the total mass of pollutant over entire event duration (g); V is the total volume of flow over entire event duration (m3); T is the duration period of runoff event (min); t is the time (min); Qt is the variable flow (m3/min); Ct is the variable concentration (mg/L); and Δt is the discrete time interval (min).

2.3.2. Mean Concentration Method

The mean concentration method can be used to estimate NPS pollution load with the aid of limited monitoring information. It is a simple and effective method for the NPS pollution, especially useful for the annual NPS pollution [20]. In the method, it is assumed that the runoff-weighted mean concentration of several storms is approximately considered as the annual surface-runoff mean concentration. Thus, the annual NPS pollution load in the monitoring section can be obtained by the product of the annual weighted mean concentration and the annual surface runoff volume.
The mean concentrations, Cj, of each storm runoff for NPS pollution can be estimated according to synchronous monitored data of flow and water quality, and can be given as
C j = W L / W A = i = 1 n ( Q T i C T i Q B i C B i ) Δ t i / i = 1 n ( Q T i Q B i ) Δ t i
where WL is the NPS pollution load of the storm; WA is the runoff volume of the storm; Q T i is the discharge at the moment Ti; C T i is the concentration at the moment Ti; Q B i is the dry season discharge at the moment Ti; C B i is the dry season concentration at the moment Ti; n is the monitoring time during a storm event; and Δti = (ti+1ti-1)/2 is the representative time of QTi and CTi.
The NPS pollution weighted mean concentration, Cm, of all storm events is expressed as follows
C m = j = 1 m C j W A j / j = 1 m W A j
The annual NPS pollution load, W n , is expressed as
W n = W s C m
where m is the number of the storm events; Cj is the NPS pollution weighted mean concentration of the j-th storm event; WAj is runoff volume of the j-th storm event; and Ws is the annual surface runoff volume.
According to the mean concentration method, the calculated weighted-mean-concentration of monitored storm events at the Shuangqiao section in Siheshui watershed was approximately considered as the annual surface-runoff mean concentration. The mean-concentrations of NPS pollution in every rainfall events were calculated. Then, the annual NPS pollution load can be obtained from the arithmetic product of the concentration and the annual surface-runoff. Since the annual point source pollution load had little variation, it can be estimated by the product of the daily mean load and the days in non-flood event. Therefore, if the total load of the dry season was added, the annual total load can be estimated.

2.3.3. Calculation of the Pollutant Load Flux

Based on the monitoring data of runoff flows and pollutant concentrations in the watershed, the output of the pollutant load flux, F, can be calculated in each time period. It is assumed that the quality and quantity of water in each time period were constant. Consequently, F can be obtained by the product of the pollutant concentration and the runoff volume, and is given as
F = Q i × C i
where Qi and Ci are the discharge and the concentration in the hour of i, respectively.

3. Results and Discussion

3.1. The Characteristics of EMCs for Pollutants

To compare the characteristics of water quality in runoff from different flood events in Siheshui watershed, the EMCs of BOD5, CODMn, TSS, TP, TN, and NH3-N were calculated and listed in Table 2. The mean EMCs of these quality constituents in the runoff flows were estimated as 3.14, 5.75, 58.31, 0.26, 3.52, and 1.56 mg/L, respectively. It was reported that the aquatic organisms would thrive quickly and affect water quality, if the total nitrogen content of surface water reached the value of 0.9–3.5 mg/L [21]. Therefore, the runoff pollutant content may have an influence on the water quality in Siheshui watershed. The mean and maximal values of TSS concentrations during the flood events are 58.31 mg/L and 87.43 mg/L, respectively. It indicates that the soil erosion in Siheshui watershed is slightly large as compared to other reported watershed [22]. The pollutant concentrations measured during non-flood period are also shown in Table 2. It is shown that the mean EMCs of CODMn, TSS, TP, TN, and NH3-N in the runoff flows during flood event are higher than those during non-flood events. The mean EMCs of these quality constituents in the flood events are 1.14, 2.98, 2.07, 1.98, and 2.06 times of those in the non-flood event, respectively, while the maximal EMCs of these constituents in the flood events are 1.26, 5.75, 2.67, 2.78, and 3.35 times of those in the non-flood event, respectively.
It is shown in Table 2 that the estimated EMCs of pollutants (except CODMn) in No. 11-05-16 flood event are higher than those in the other four flood events. The probable reason is that the No. 11-05-16 flood is the first rain after a long time of dry days. In the rainfall event, the pollutants accumulated in the antecedent dry days would get into the river water along with the first rainfall-runoff, and, thus, the output of the pollutant concentrations may reach a high value. Moreover, the rainfall intensity of No. 11-05-16 flood event is strong (shown in Table 1). This may also affect the EMCs of pollutants [22].
Table 2. Estimated EMCs of pollutants.
ConstituentBOD5 (mg/ L)CODMn (mg/L)TSS (mg/L)TP (mg/L)TN (mg/L)NH3-N (mg/L)
11-05-16 (flood)3.806.1045.330.344.732.61
11-05-22 (flood)2.826.4918.010.303.131.39
11-06-29 (flood)3.135.4387.430.214.191.63
11-07-12 (flood)2.696.1524.200.402.661.22
11-07-19 (flood)3.345.3851.40-2.081.19
Mean (flood)3.145.7558.310.263.521.56
Max. (flood)3.806.4987.430.404.732.61
Min. (flood)2.695.3818.010.212.081.19
Cn (non-flood)-5.1715.210.151.700.78
Max. Cf/Cn-1.265.752.672.783.35
Mean Cf/Cn-1.142.982.071.982.06
Notes: Cf and Cn are the mean EMCs in flood and non-flood event, respectively. The TP data in No. 11-07-19 flood event and the BOD5 data in the non-flood event were missing.
The antecedent precipitation has large effects on the output of the pollutant concentration. Table 1 shows that the rainfall amount in the day before the event of No. 11-05-22 flood is heavy than that of No. 11-05-16 flood. If the antecedent precipitation is large, the previous accumulated surface pollutants have been partially flowed away because of the anterior rainfall runoff erosion, and the pollutant concentration of the runoff in the event was reduced.
The monitored EMCs of TSS (shown in Table 2) has a large fluctuation during the five flood events. The maximal EMC of TSS is in the No. 11-06-29 flood event with large rainfall amount and peak flow, while the minimal value is in the No. 11-05-22 flood event with relatively small rainfall amount and peak flow. This can be ascribed to the erosion effects of rainfall. Suspended solids mainly composed of fine particles, and these particles move along with the rainfall erosion in the precipitation process.

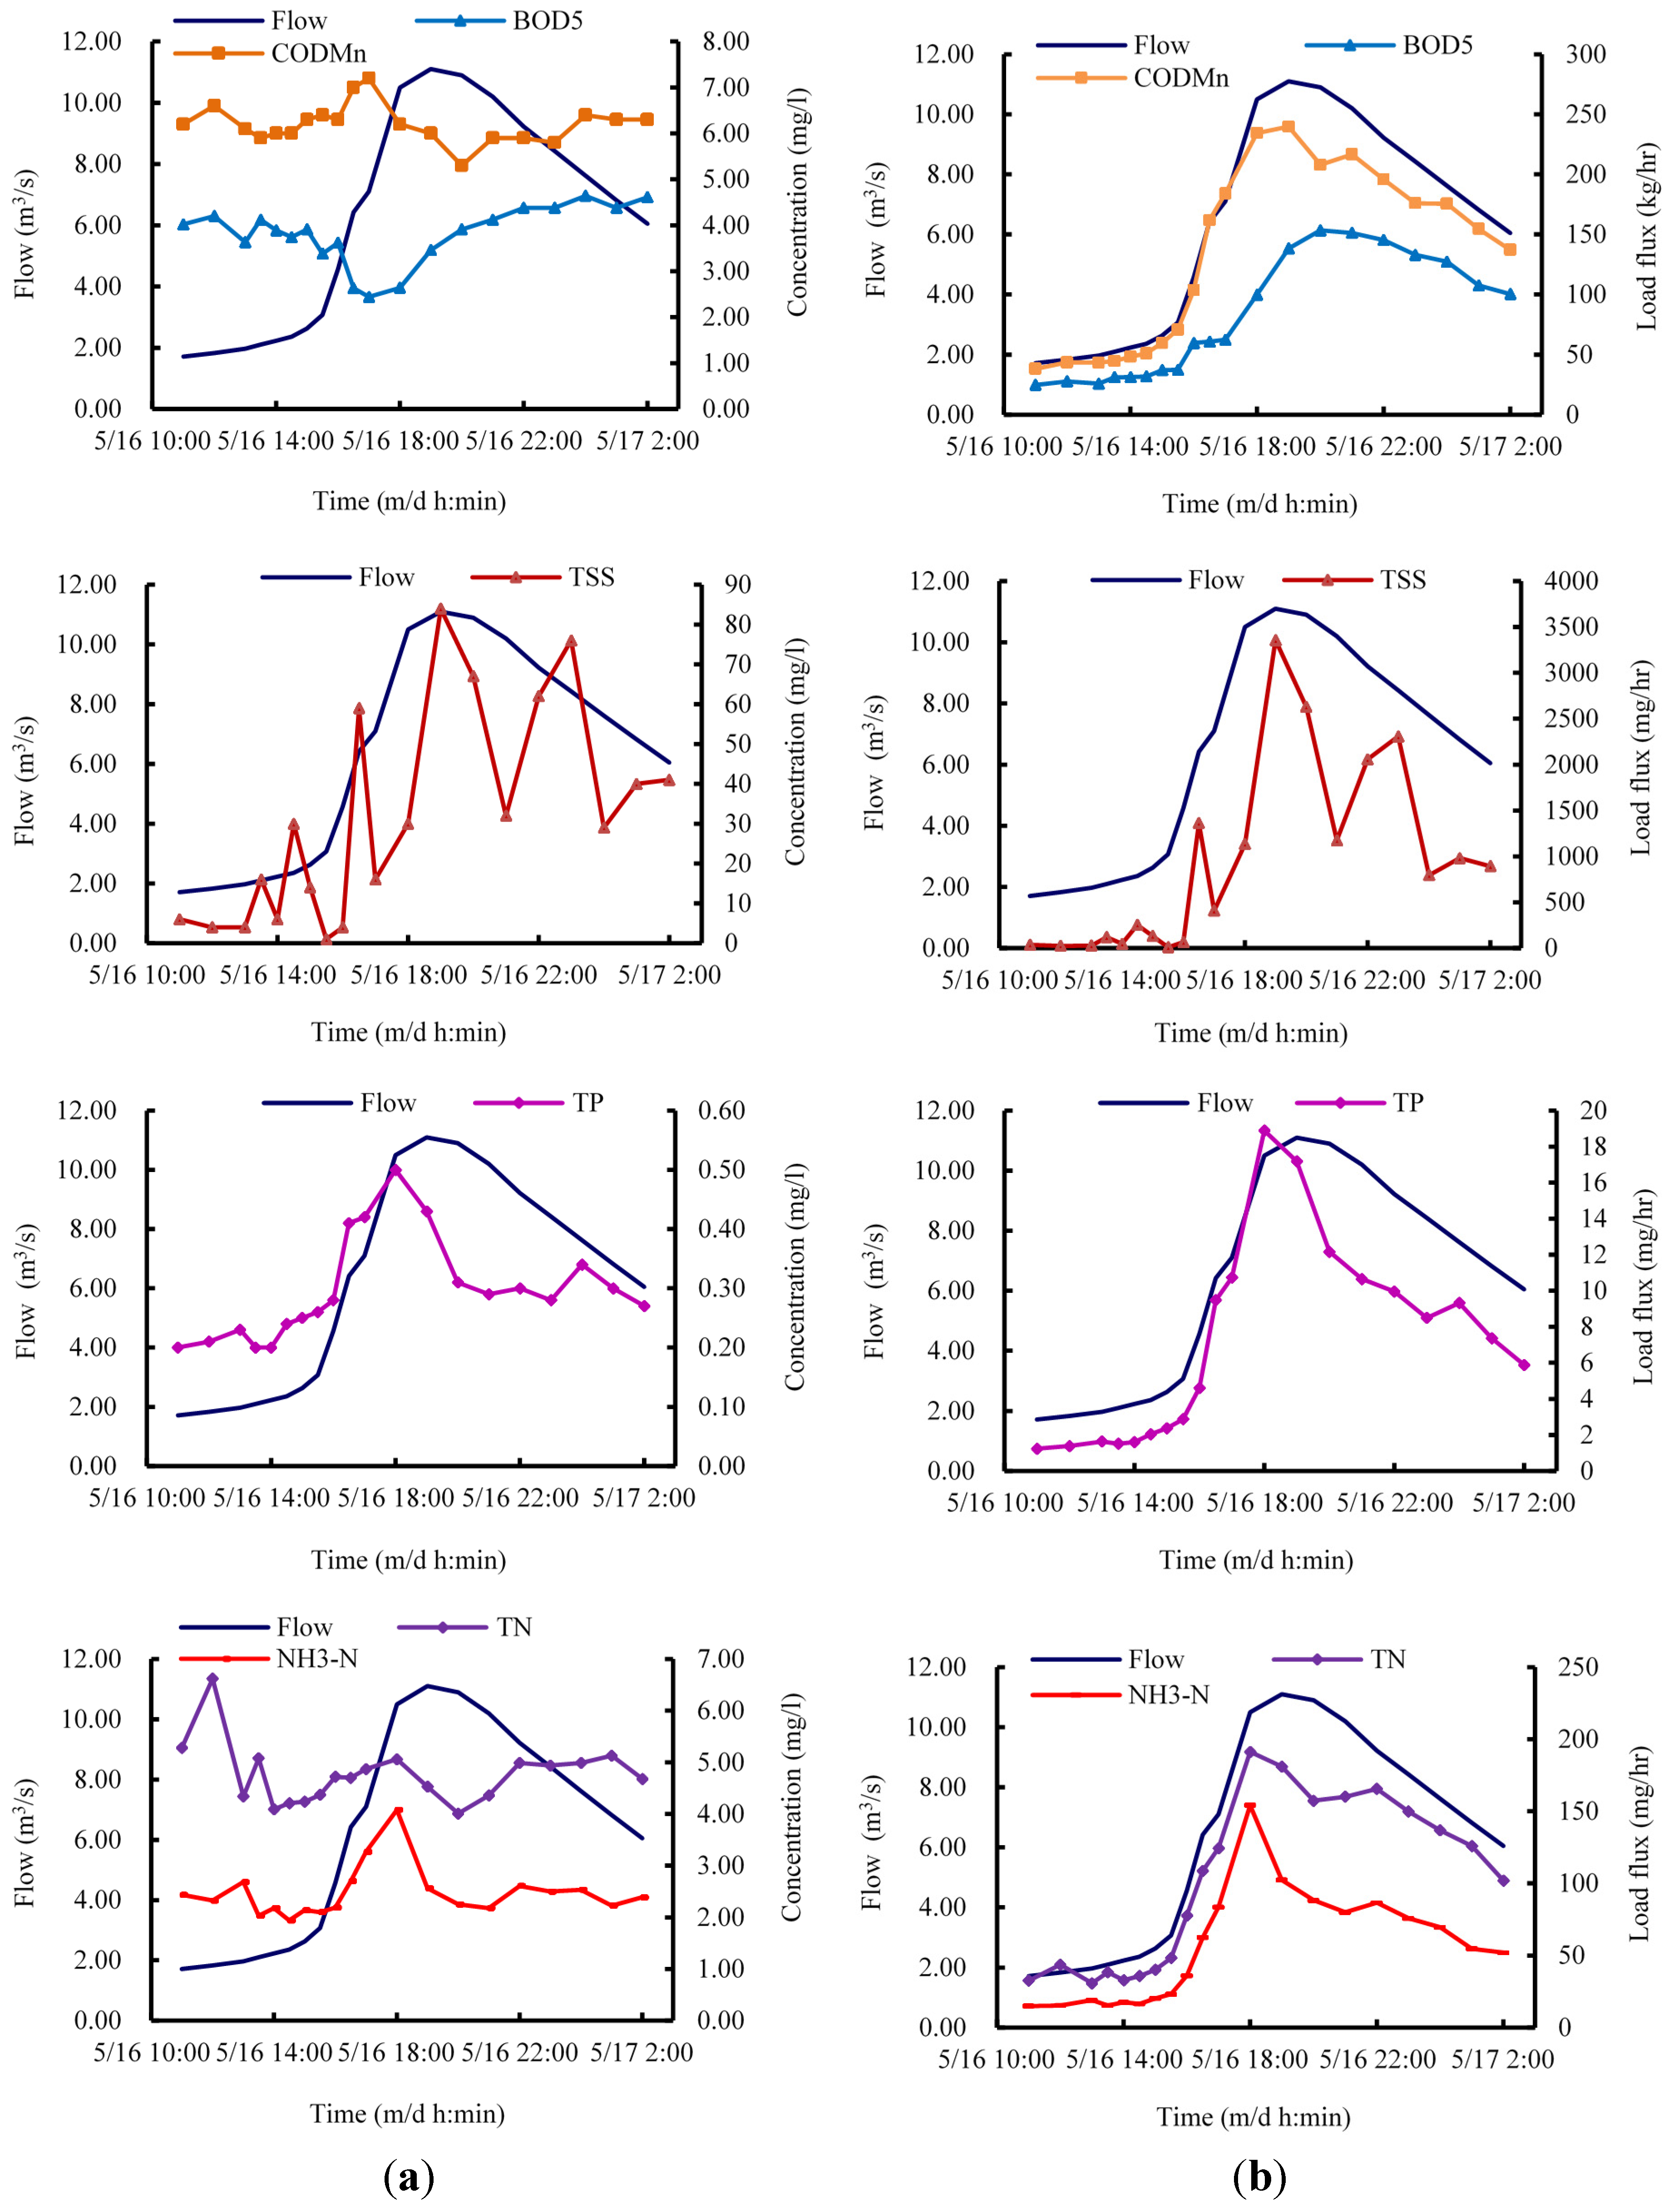
3.2. The Characteristics of the Pollutant Concentrations during Flood

In the following two sections, the No. 11-05-16 flood event was used to study the characteristics of pollutions in runoff. Figure 2a shows the concentrations of water quality constituents and the runoff flow in No. 11-05-16 flood event. It is shown that the concentrations of TP and NH3-N increase at first and then decrease later, which is in accordance with the various trend of the runoff flow. This is caused by the first-flush effect of surface runoff. The first-flush effect is defined as that the pollutants, which are disproportional to the initial runoff volume, are scoured into the surface water at the early stage of runoff [23,24]. The majority usage of the land in Siheshui watershed is for agriculture, and nitrogen and phosphorus are main components of agricultural fertilizer. In dry seasons, the nitrogen and the phosphorus elements are adsorbed by the surface soil. During the rainfall period, the nitrogen and the phosphorus compounds enriched in the surface soil were continuously migrated and diluted along with the rainfall erosion. The highest concentration of TP and NH3-N are 0.50 and 4 mg/L, respectively, which appear before the peak flow, and the concentrations decrease gradually with the increasing of runoff flow. Similar results have been reported by Li et al. [25] and Liu et al. [26]. Since the area of Siheshui watershed is small as compared with other river basins [27], the peak value of the pollutant concentrations occur only one hour before that of the peak flow.
Figure 2. Pollutant concentrations and load fluxes in the runoff from No. 11-05-16 flood event. (a) Pollutant concentrations and (b) pollutant load fluxes.
Water 06 03828 g002
The envelop function curve for TSS is also consistent with that for the runoff flow, although the concentration shows a serrated-wave fluctuation. It is shown that the concentration of TSS and the flow reach the peak at the same time [28]. After that time, the concentration of TSS decreases due to the dilution effect from the flow.
However, the variation trend of the concentrations of TN is different from that of the runoff flow. It is shown that the concentration reaches the minimum value around the time of the peak flow [29]. This is probably related to the fact that TN is the main component of soluble nitrogen and its migration depends mainly on the rain soaked solution. If the flow is large, the retention time of the pollutant in the runoff is correspondingly short, and, thus, the minimum value of the TN concentration occurs at the time of the peak flow.
The concentrations of BOD5 and CODMn vary in the form of a sawtooth-wave shape, and there is no obvious correlation between the concentrations and the runoff flows. This indicates that the solubility of pollutants may be mainly affected by the water environmental conditions instead of the influence of runoff flow.

3.3. The Characteristics of the Pollutant Load Fluxes during Flood

According to the monitored data of the runoff flow and the pollutant concentration in the watershed, the pollutant load fluxes in No. 11-05-16 flood event were calculated and shown in Figure 2b. It is shown that the pollutant load fluxes of BOD5, CODMn, TP, TN, and NH3-N change synchronously with the runoff flows, and the synchronization relationship is better than that between the pollutant concentrations and the runoff flows. Generally, the pollutant load fluxes quickly rise up to the peak value and gradually decrease, which is the same as the variation trend of the runoff flow. This indicates that the load fluxes of BOD5, CODMn, TP, TN, and NH3-N are mainly determined by runoff processes. However, a serrated-wave fluctuation exists in the function curves for TSS. This may be because the variation of the concentration shown in Figure 2a is serrated-wave and the large variation of the concentration for TSS may remarkably influence the load flux.
Moreover, the maximum values of the load fluxes of TP, TN, and NH3-N appear before the peak flow, and that of TSS and CODMn appear almost the same time as the peak flow, while that of BOD5 appears after the peak flow. The differences of the appearing times are mainly due to the different sources of the pollutants.

3.4. Correlation Analysis between EMCs and Rainfall Runoff Characteristics

Table 3 shows the results of Pearson correlation analysis between EMCs and rainfall runoff characteristics in the five flood events. It is shown that the correlation relationships are different for different pollutant. The EMCs of BOD5, TN, and NH3-N are weakly correlated with rainfall amount, rainfall intensity and peak flow, and the EMCs of CODMn and TP show significant negative correlations, while the EMC of TSS shows significant positive correlations. The relationships of water quality and rainfall runoff characteristics are complicated.
Table 3. Correlation analysis between EMCs and rainfall runoff characteristics.
ConstituentRainfall AmountRainfall IntensityPeak Flow
BOD5−0.0370.4920.172
CODMn−0.797−0.944−0.888
TSS0.9010.6820.918
TP−0.769−0.415−0.894
TN0.130−0.1690.073
NH3-N−0.200−0.052−0.154

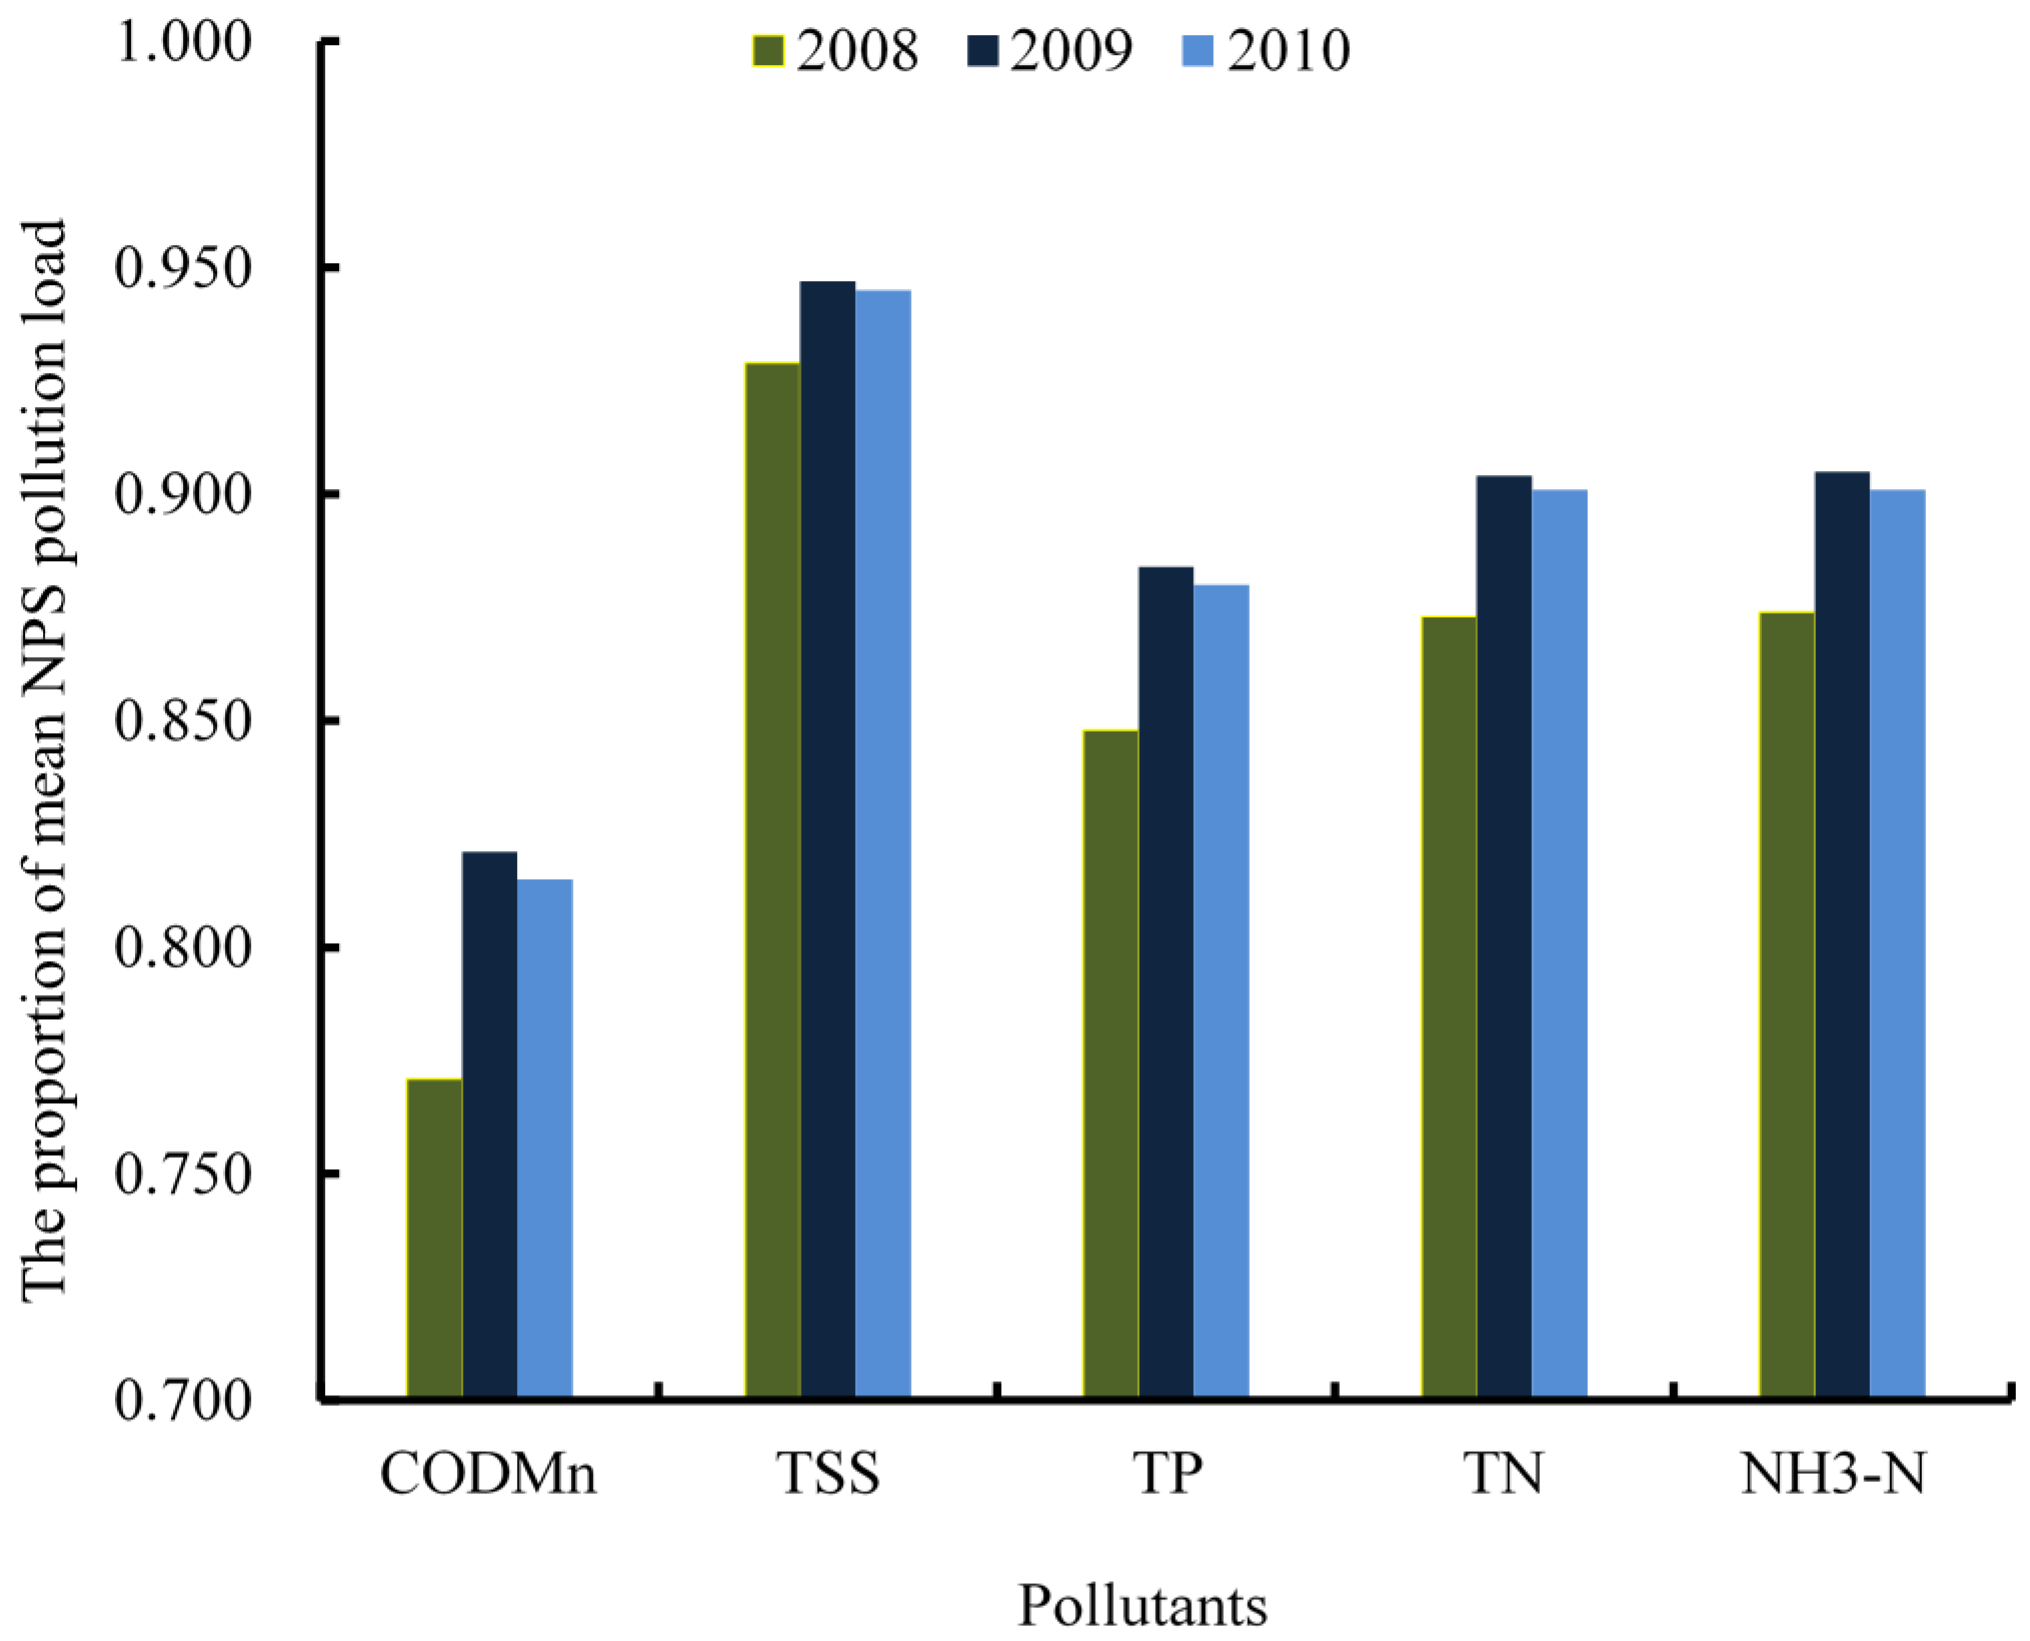
3.5. Estimation of NPS Pollution Load

According to the mean concentration method, the calculated mean-concentrations of NPS pollution in every flood event are listed in Table 4. Then, using Equation (4), the annual NPS pollution loads from 2008 to 2010 were calculated and listed in Table 5. It is shown that the annual NPS pollution loads of all pollutants in 2009 are more than those in 2008 and 2010, because the runoff volume in 2009 was large as compared to other years. Since the Siheshui watershed is a typical agricultural watershed, the annual NPS pollution loads for TSS, TP, NH3-N are slightly large as compared to other forest watershed [22].
Table 4. The mean concentration of NPS pollution in flood events.
Rainfall EventCODMn (mg/L)TSS (mg/L)TP (mg/L)TN (mg/L)NH3-N (mg/L)
11-05-166.4550.560.375.242.89
11-05-226.5143.640.344.672.42
11-06-295.4792.400.214.261.65
11-07-126.3026.720.442.831.30
11-07-195.4152.11-2.081.20
Mean5.8266.560.283.921.81
Note: The data of TP in No. 110719 flood event was missing.
Table 5. The annual NPS pollution loads from 2008 to 2010.
IndexCODMn (kg/(hm2·Year))TSS (kg/(hm2·Year))TP (kg/(hm2·Year))TN (kg/(hm2·Year))NH3-N (kg/(hm2·Year))
200838.93445.171.8726.2212.11
200953.11607.422.5635.7716.52
201051.00583.272.4534.3515.86
Average47.68545.292.2932.1114.83
Moreover, the proportions of NPS pollution loads, which are defined as NPS pollution loads divided by total loads, can be obtained and shown in Figure 3. It is shown that the average values of the proportions of NPS pollution loads for CODMn, TSS, TP, TN, and NH3-N in the flood event from 2008 to 2010 are 80.2%, 94.0%, 87.1%, 89.3%, and 89.3%, respectively. This indicates that the NPS pollutions account for large parts of the total loads and play important roles on the water pollution in Siheshui watershed.
Figure 3. The proportions of mean NPS pollution loads for each year.
Water 06 03828 g003

4. Conclusions

In summary, the characteristics of NPS pollutants from Siheshui watershed in south China were explored. The flow and the concentration data of runoff discharge in five flood events and one non-flood event were synchronously monitored. The EMCs of pollutant constituents in runoff flows were estimated, and the variation trends of the pollutant concentration and the pollutant load fluxes during flood period were analyzed. It is shown that the antecedent precipitation has a large effect on the pollutant concentration. A larger antecedent precipitation means a smaller pollutant concentration in the runoff. The TP and NH3-N concentrations show the first-flush effect. The pollutant fluxes of BOD5, CODMn, TP, TN, and NH3-N vary synchronously with the water flows, while that of TSS has sawtooth-wave function. The Pearson correlation analysis indicates that the EMCs of CODMn, TP, and TSS are significantly correlated with rainfall runoff characteristics, while the EMCs of BOD5, TN, and NH3-N show weak correlations. The mean concentration method was used to estimate annual NPS pollution load. It is shown that the proportions of the NPS pollution load to the pollutant total load were more than 80% from 2008 to 2010.

Acknowledgments

This study was supported by the National Natural Sciences Foundation of China (Grant number: 51209096) and the Fundamental Research Funds for the Central Universities, South China University of Technology (Grant number: 2013ZZ019).

Author Contributions

Haiying Hu conceived and designed the experiments, and wrote the manuscript. Guoru Huang performed the experiments.

Conflicts of Interest

The authors declare no conflict of interest.

References

  1. Leone, A.; Ripa, M.N.; Uricchio, V.; Deak, J.; Vargay, Z. Vulnerability and risk evaluation of agricultural nitrogen pollution for Hungary’s main aquifer using DRASTIC and GLEAMS models. J. Environ. Manag. 2009, 90, 2969–2978. [Google Scholar] [CrossRef]
  2. Yang, J.L.; Zhang, G.L.; Shi, X.Z. Dynamic changes of nitrogen and phosphorus losses in ephemeral runoff processes by typical storm events in Sichuan Basin, Southwest China. Soil Tillage Res. 2009, 105, 292–299. [Google Scholar] [CrossRef]
  3. Novotny, V. Diffuse pollution from agriculture—A worldwide outlook. Water Sci. Technol. 1999, 39, 1–13. [Google Scholar] [CrossRef]
  4. Ongley, E.D.; Zhang, X.L.; Yu, T. Current status of agricultural and rural non-point source pollution assessment in China. Environ. Pollut. 2010, 158, 1159–1168. [Google Scholar] [CrossRef] [PubMed]
  5. Arnold, J.G.; Allen, P.M.; Bernhardt, G.A. Comprehensive surface-ground-water flow model. J. Hydrol. 1993, 142, 47–69. [Google Scholar] [CrossRef]
  6. Vitousek, P.M.; Aber, J.D.; Howarth, R.W.; Likens, G.E.; Matson, P.A.; Schindler, D.W.; Schlesinger, W.H.; Tilman, D.G. Human alteration of the global nitrogen cycle: Sources and consequences. Ecol. Appl. 1997, 7, 737–750. [Google Scholar]
  7. Carpenter, S.R.; Caraco, N.F.; Correl, D.L.; Howarth, R.W.; Sharpley, A.N.; Smith, V.H. Non-point pollution of surface waters with phosphorus and nitrogen. Ecol. Appl. 1998, 8, 559–568. [Google Scholar] [CrossRef]
  8. Novotny, V.; Olem, H. Water Quality Prevention, Identification, and Management of Diffuse Pollution; Van Nostrand Reinhold: New York, NY, USA, 1994. [Google Scholar]
  9. Detenbeck, N.E.; Elonen, C.M.; Taylor, D.L.; Anderson, L.E.; Jichia, T.M.; Batterman, S.L. Effects of hydrogeomorphic region, catchment storage and mature forest on baseflow and snowmelt stream water quality in second-order Lake Superior Basin tributaries. Freshw. Biol. 2003, 48, 912–927. [Google Scholar] [CrossRef]
  10. Leon, L.F.; Soulis, E.D.; Kouwen, N.; Farquhar, G.J. Nonpoint source pollution: A distributed water quality modeling approach. Water Res. 2001, 35, 997–1007. [Google Scholar] [CrossRef] [PubMed]
  11. Young, R.A.; Onstad, C.A.; Bosch, D.D.; Anderson, W.P. AGNPS: A non-point source pollution model for evaluating agriculture watersheds. J. Soil Water Conserv. 1989, 44, 168–173. [Google Scholar]
  12. Hassen, M.; Fekadu, Y.; Gate, Z. Validation of agricultural non-point source (AGNPS) pollution model in Kori watershed, South Wollo, Ethiopia. Int. J. Appl. Earth Observ. Geoinform. 2004, 6, 97–109. [Google Scholar] [CrossRef]
  13. He, C.S. Integration of geographic information systems and simulation model for watershed management. Environ. Modell. Softw. 2003, 18, 809–813. [Google Scholar] [CrossRef]
  14. Beasley, D.B.; Huggins, L.F.; Monke, E.J. ANSWERS: A model for watershed planning. Trans. Am. Soc. Agric. Eng. 1980, 23, 938–944. [Google Scholar] [CrossRef]
  15. Shen, Z.Y.; Hong, Q.; Yu, H.; Liu, R. Parameter uncertainty analysis of the non-point source pollution in Daning river watershed of the Three Gorges reservoir area, China. Sci. Total Environ. 2008, 405, 195–205. [Google Scholar] [CrossRef] [PubMed]
  16. Recanatesi, F.; Ripa, M.N.; Leone, A.; Perini, L.; Salvati, L. Land use, climate and transport of nutrients: Evidence emerging from the Lake Vicocase study. Environ. Manag. 2013, 52, 503–513. [Google Scholar] [CrossRef]
  17. National Environmental Protection Bureau (NEPB). Standard Methods for the Examination of Water and Wastewater; Version 4; China Environmental Science Publish Press: Beijing, China, 2002. [Google Scholar]
  18. Charbeneau, R.J.; Barretti, M. Evaluation of methods for estimating stormwater pollutant loads. Water Environ. Res. 1998, 70, 1295–1302. [Google Scholar] [CrossRef]
  19. John, J.S.; Steven, G.B. Partitioning and first flush of metals in urban roadway storm water. J. Environ. Eng. 1997, 123, 134–143. [Google Scholar] [CrossRef]
  20. Li, H.E. Mean concentration method for estimation of nonpoint source load and its application. Acta Sci. Circumst. 2000, 20, 397–400. [Google Scholar]
  21. Zhuo, M.N.; Wu, Z.F.; Wang, J.Z.; Li, F.B.; Wan, H.F. Study on the characteristics of pollution in precipitation runoff in Zhuhai urban area. Acta Pedol. Sin. 2003, 40, 775–778. [Google Scholar]
  22. Yoon, S.W.; Chung, S.W.; Oh, D.G.; Lee, J.W. Monitoring of non-point source pollutants load from a mixed forest land use. J. Environ. Sci. 2010, 22, 801–805. [Google Scholar] [CrossRef]
  23. Zhang, R.B.; Yao, Q.; Ji, Y. A study on law of non-point source pollutants losses in a typical small watershed of Taihu basin. Resour. Environ. Yangtze Basin 2005, 14, 94–98. [Google Scholar]
  24. Hu, Y.A.; Cheng, S.T.; Jia, H.F. Regular pattern of non-point source pollutants losses in Luxi Watershed. Environ. Sci. 2004, 25, 108–112. [Google Scholar]
  25. Li, J.K.; Li, H.E.; Shen, B.; Li, Y.J. Effect of non-point source pollution on water quality of the Weihe River. Int. J. Sediment Res. 2011, 26, 50–61. [Google Scholar] [CrossRef]
  26. Liu, P.; Cheng, J.; Liu, X.N.; Chen, Z.L.; Wu, Z.F. Characteristics of output of non-point source pollution with rainfall runoff in typical agricultural watershed of Liuxi river valley. J. Ecol. Rural Environ. 2008, 24, 92–95. [Google Scholar]
  27. Zhang, H.; Zeng, F.T.; Fang, H.Y.; Zhang, H.J.; Xiao, J.E.; Guo, Q.W.; Zeng, D.; Ouyang, Z. Impact of consecutive rainfall on non-point source pollution in the Danshui River catchment. Acta Sci. Circumst. 2011, 31, 927–934. [Google Scholar]
  28. Li, J.K.; Li, H.E.; Liu, J.; Zhang, T.; Yang, T.; Ma, S.W. Characteristics of non-point source pollution and load of Weihe river based on storm runoff monitoring data. Bull. Soil Water Conserv. 2008, 28, 106–111. [Google Scholar]
  29. Huang, J.; Zhang, X.; Peng, J.; Li, G.H. Temporal and spatial distribution and transportation of nitrogen and phosphorus in stormwater runoff. J. Agro Environ. Sci. 2004, 23, 255–258. [Google Scholar]

