Reservoir Operation Rules for Controlling Algal Blooms in a Tributary to the Impoundment of Three Gorges Dam

Abstract
:1. Introduction
2. Materials and Methods
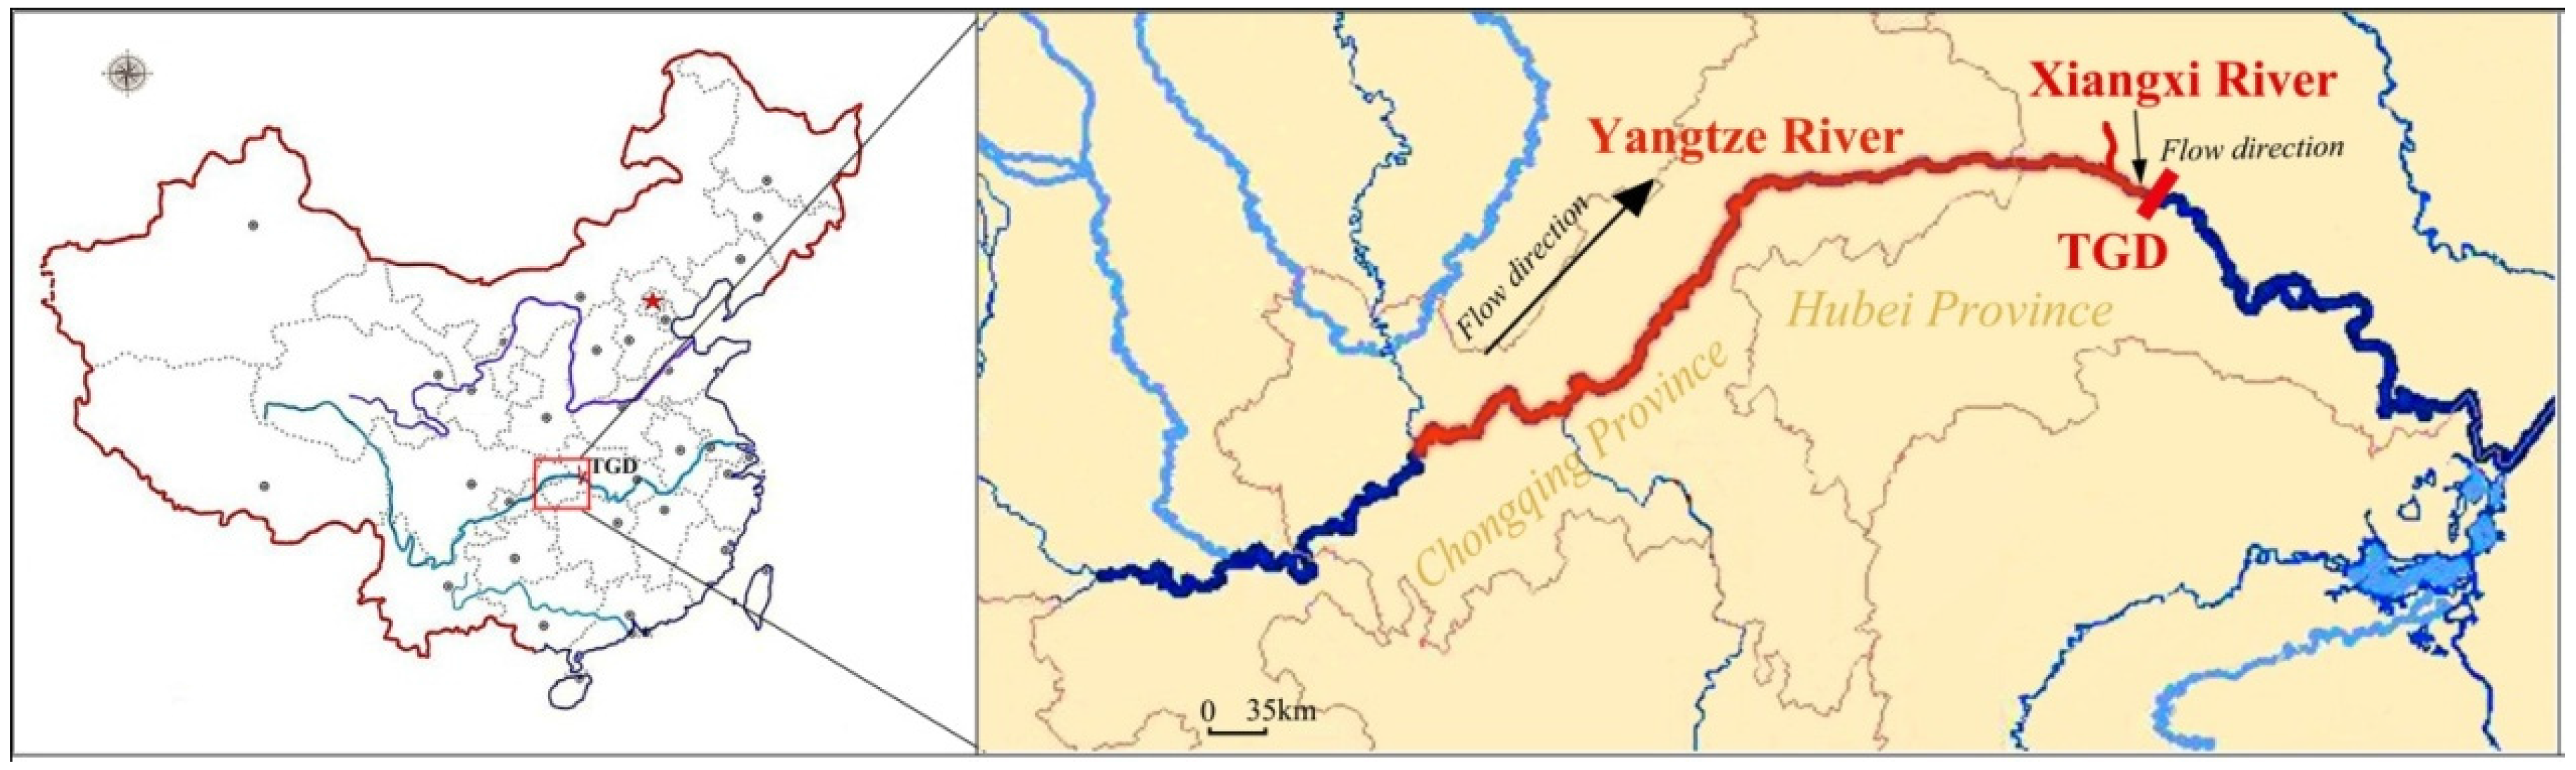
2.1. Study Area
2.2. Methodology
2.2.1. Model Introduction
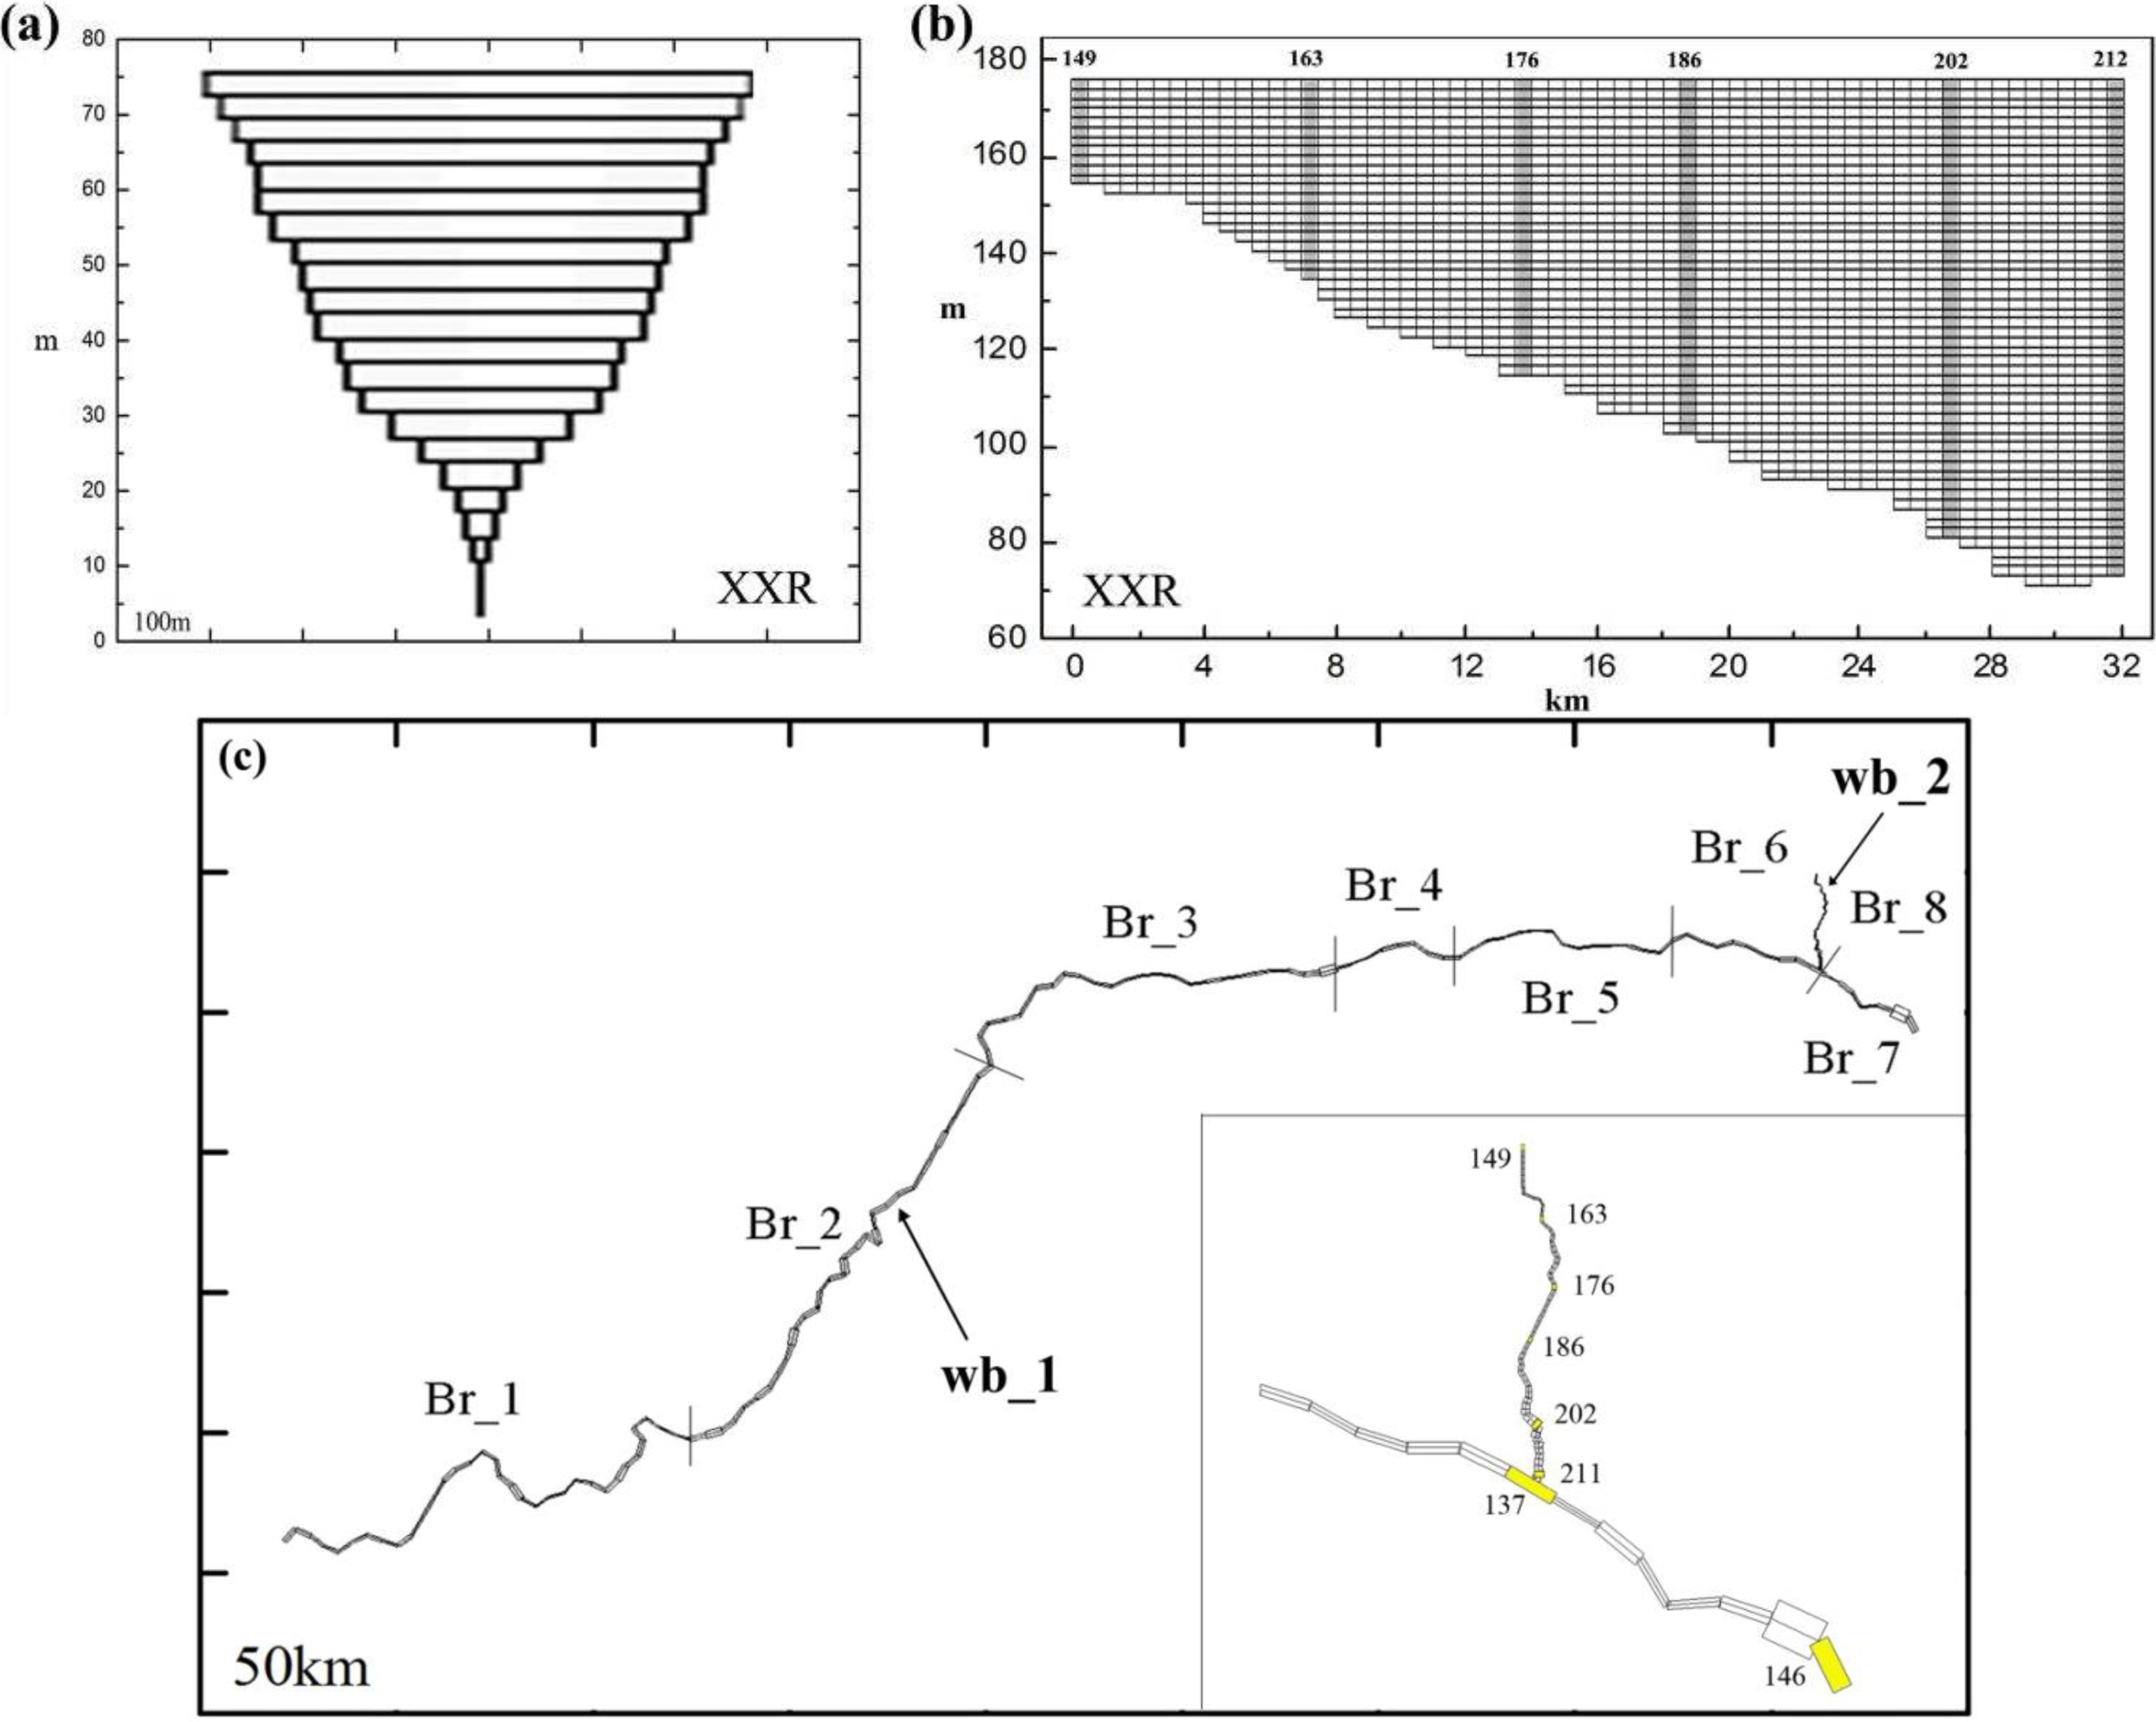
2.2.2. Model Construction


| Coefficient | Units | Calibration Value |
|---|---|---|
| Manning’s friction factor of the mainstream | - | 0.04 a |
| Manning’s friction factor of XXR | - | 0.025 ~ 0.023 b |
| longitudinal eddy viscosity | m2/s | 1.0 c |
| longitudinal eddy diffusivity | m2/s | 1.0 d |
| Extinction for pure water | m−1 | 0.25 c |
| Maximum algal growth rate | day−1 | 1.2 c |
| Maximum algal respiration rate | day−1 | 0.04 c |
| Maximum algal excretion rate | day−1 | 0.04 c |
| Maximum algal mortality rate | day−1 | 0.1 c |
| Algal settling rate | m·day−1 | 0.1 c |
| Algal half-saturation for phosphorus limited growth | g·m−3 | 0.003 c |
| Algal half-saturation for nitrogen limited growth | g·m−3 | 0.14 c |
| Light saturation intensity at maximum photosynthetic rate | W·m−2 | 75 c |
| Ammonium decay rate | day−1 | 0.01 c |
| Nitrate decay rate | day−1 | 0.1 c |
2.2.3. Field Data Collection
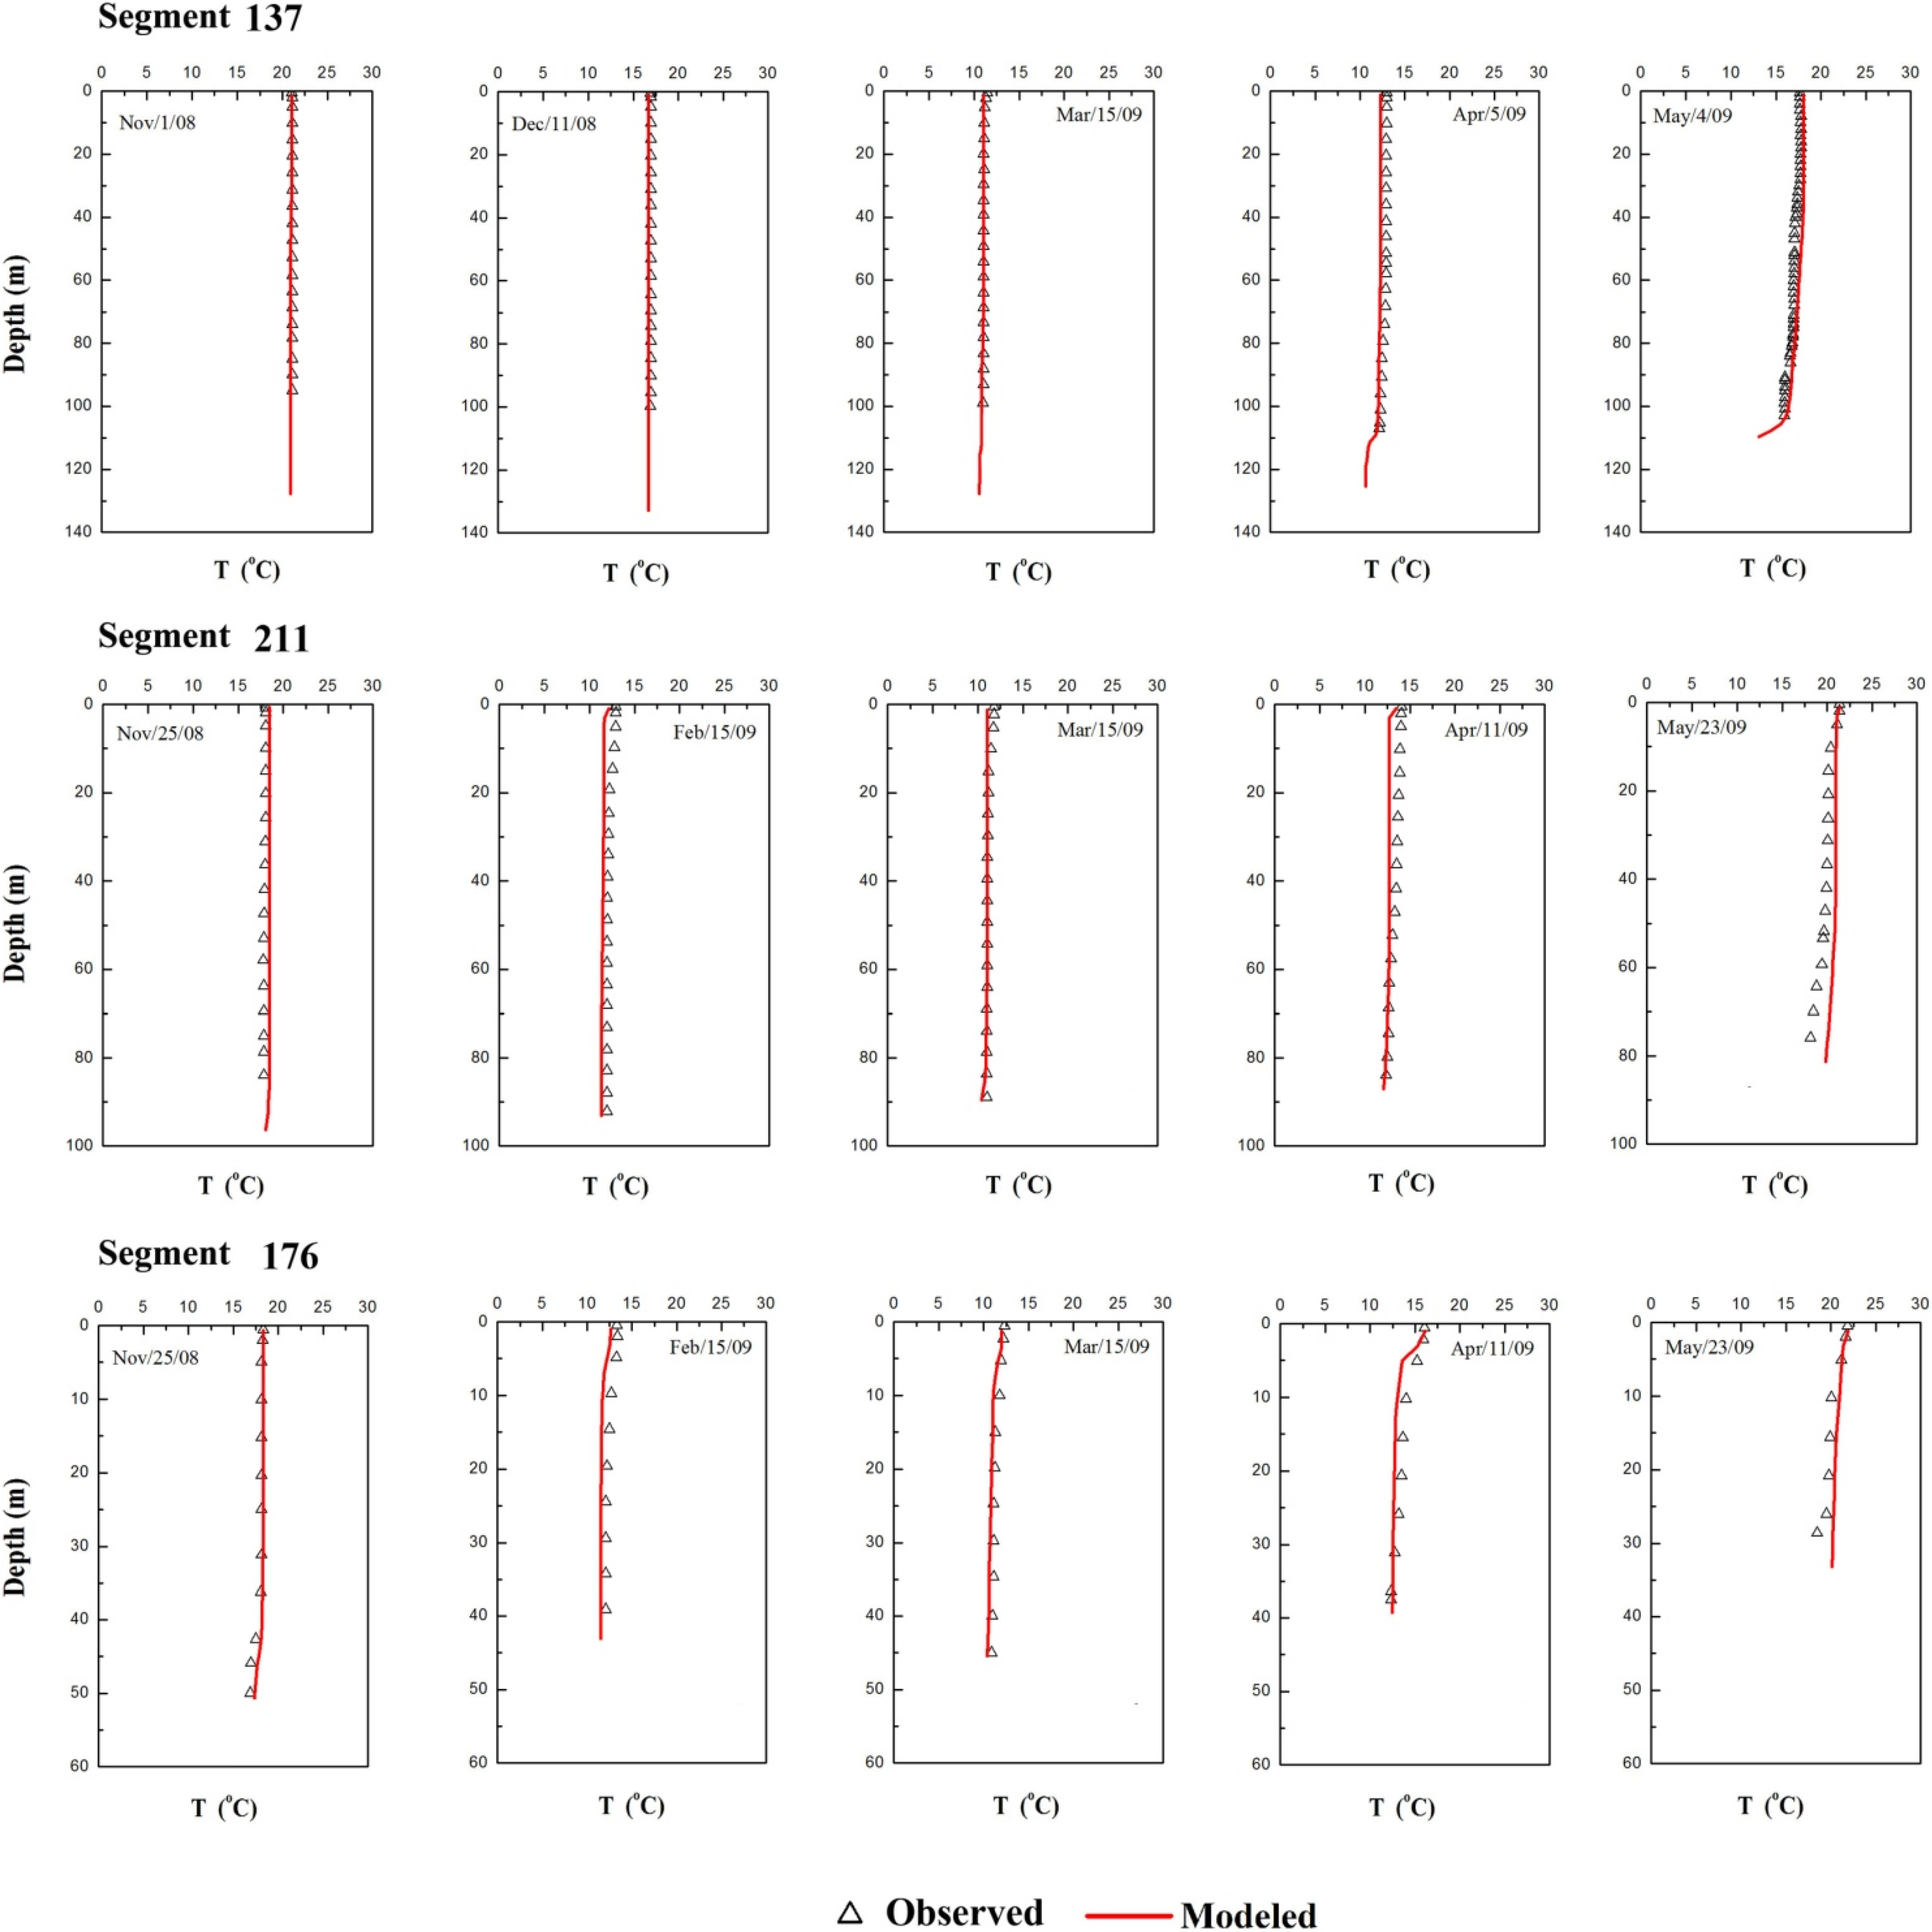
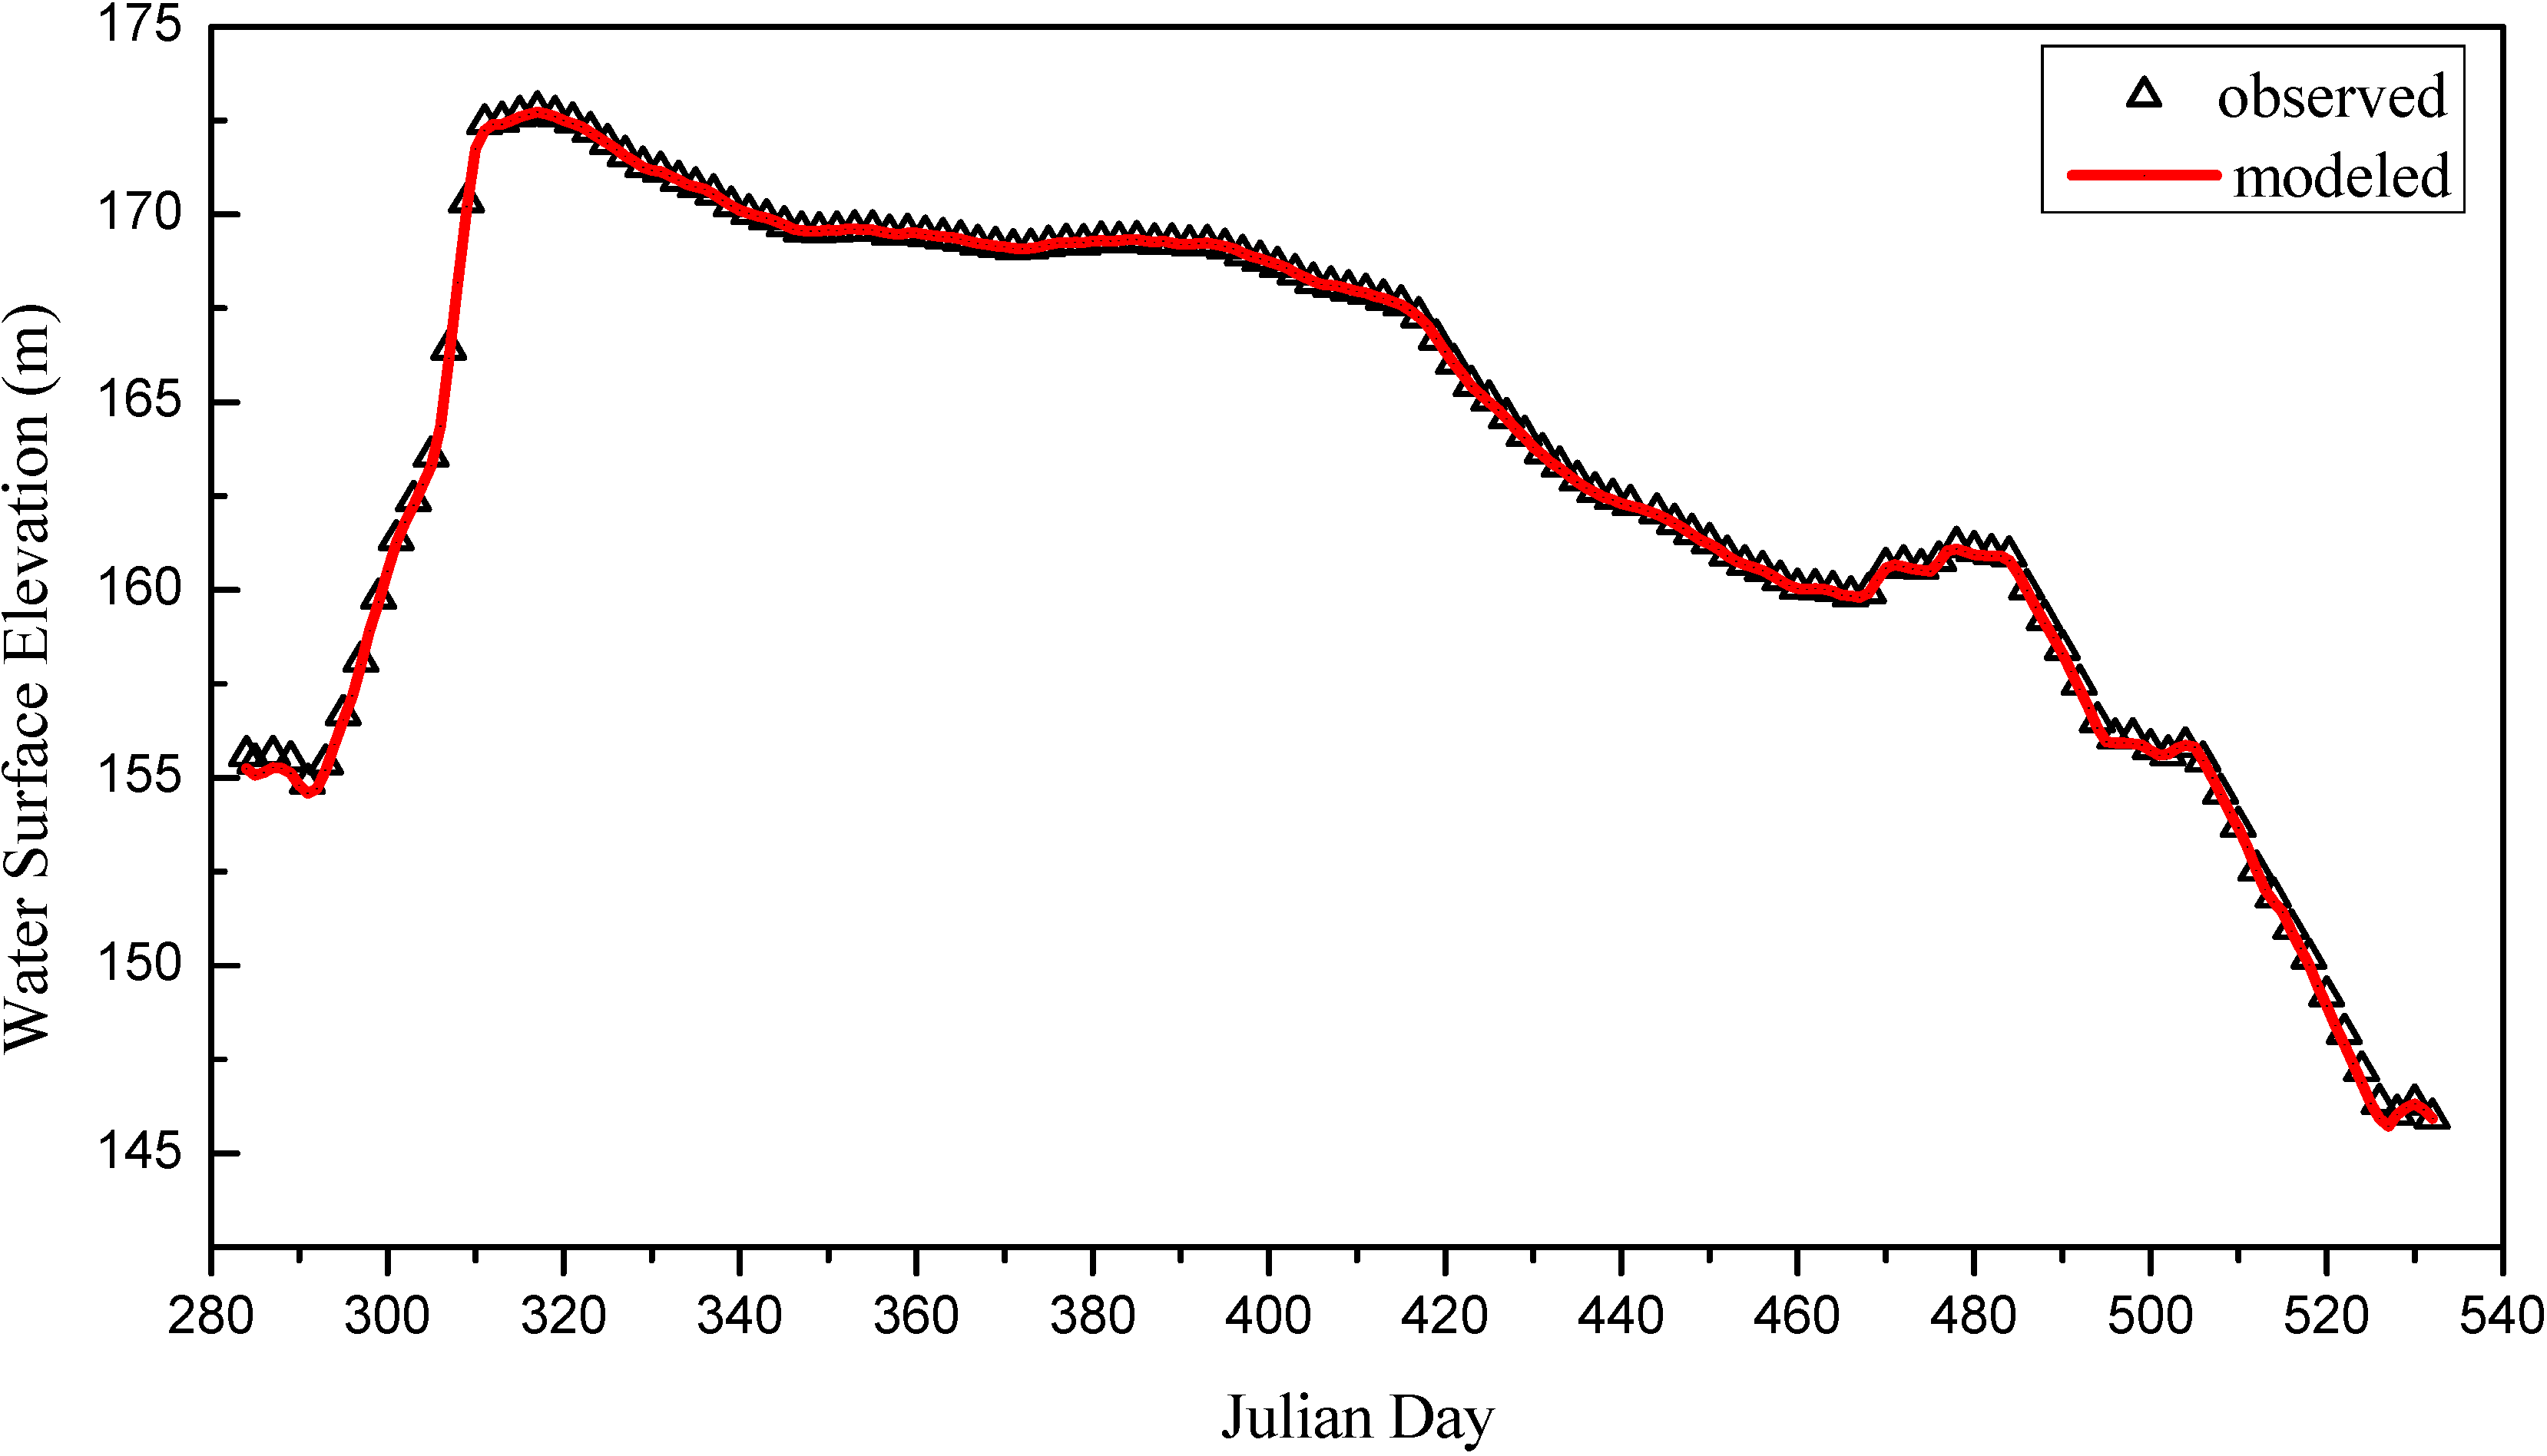
2.2.4. Hydrodynamic Model Calibration
| Statistic Error | Water Surface Elevation | T | PO4 | NO3-N | NH4-N | DSi | Chla |
|---|---|---|---|---|---|---|---|
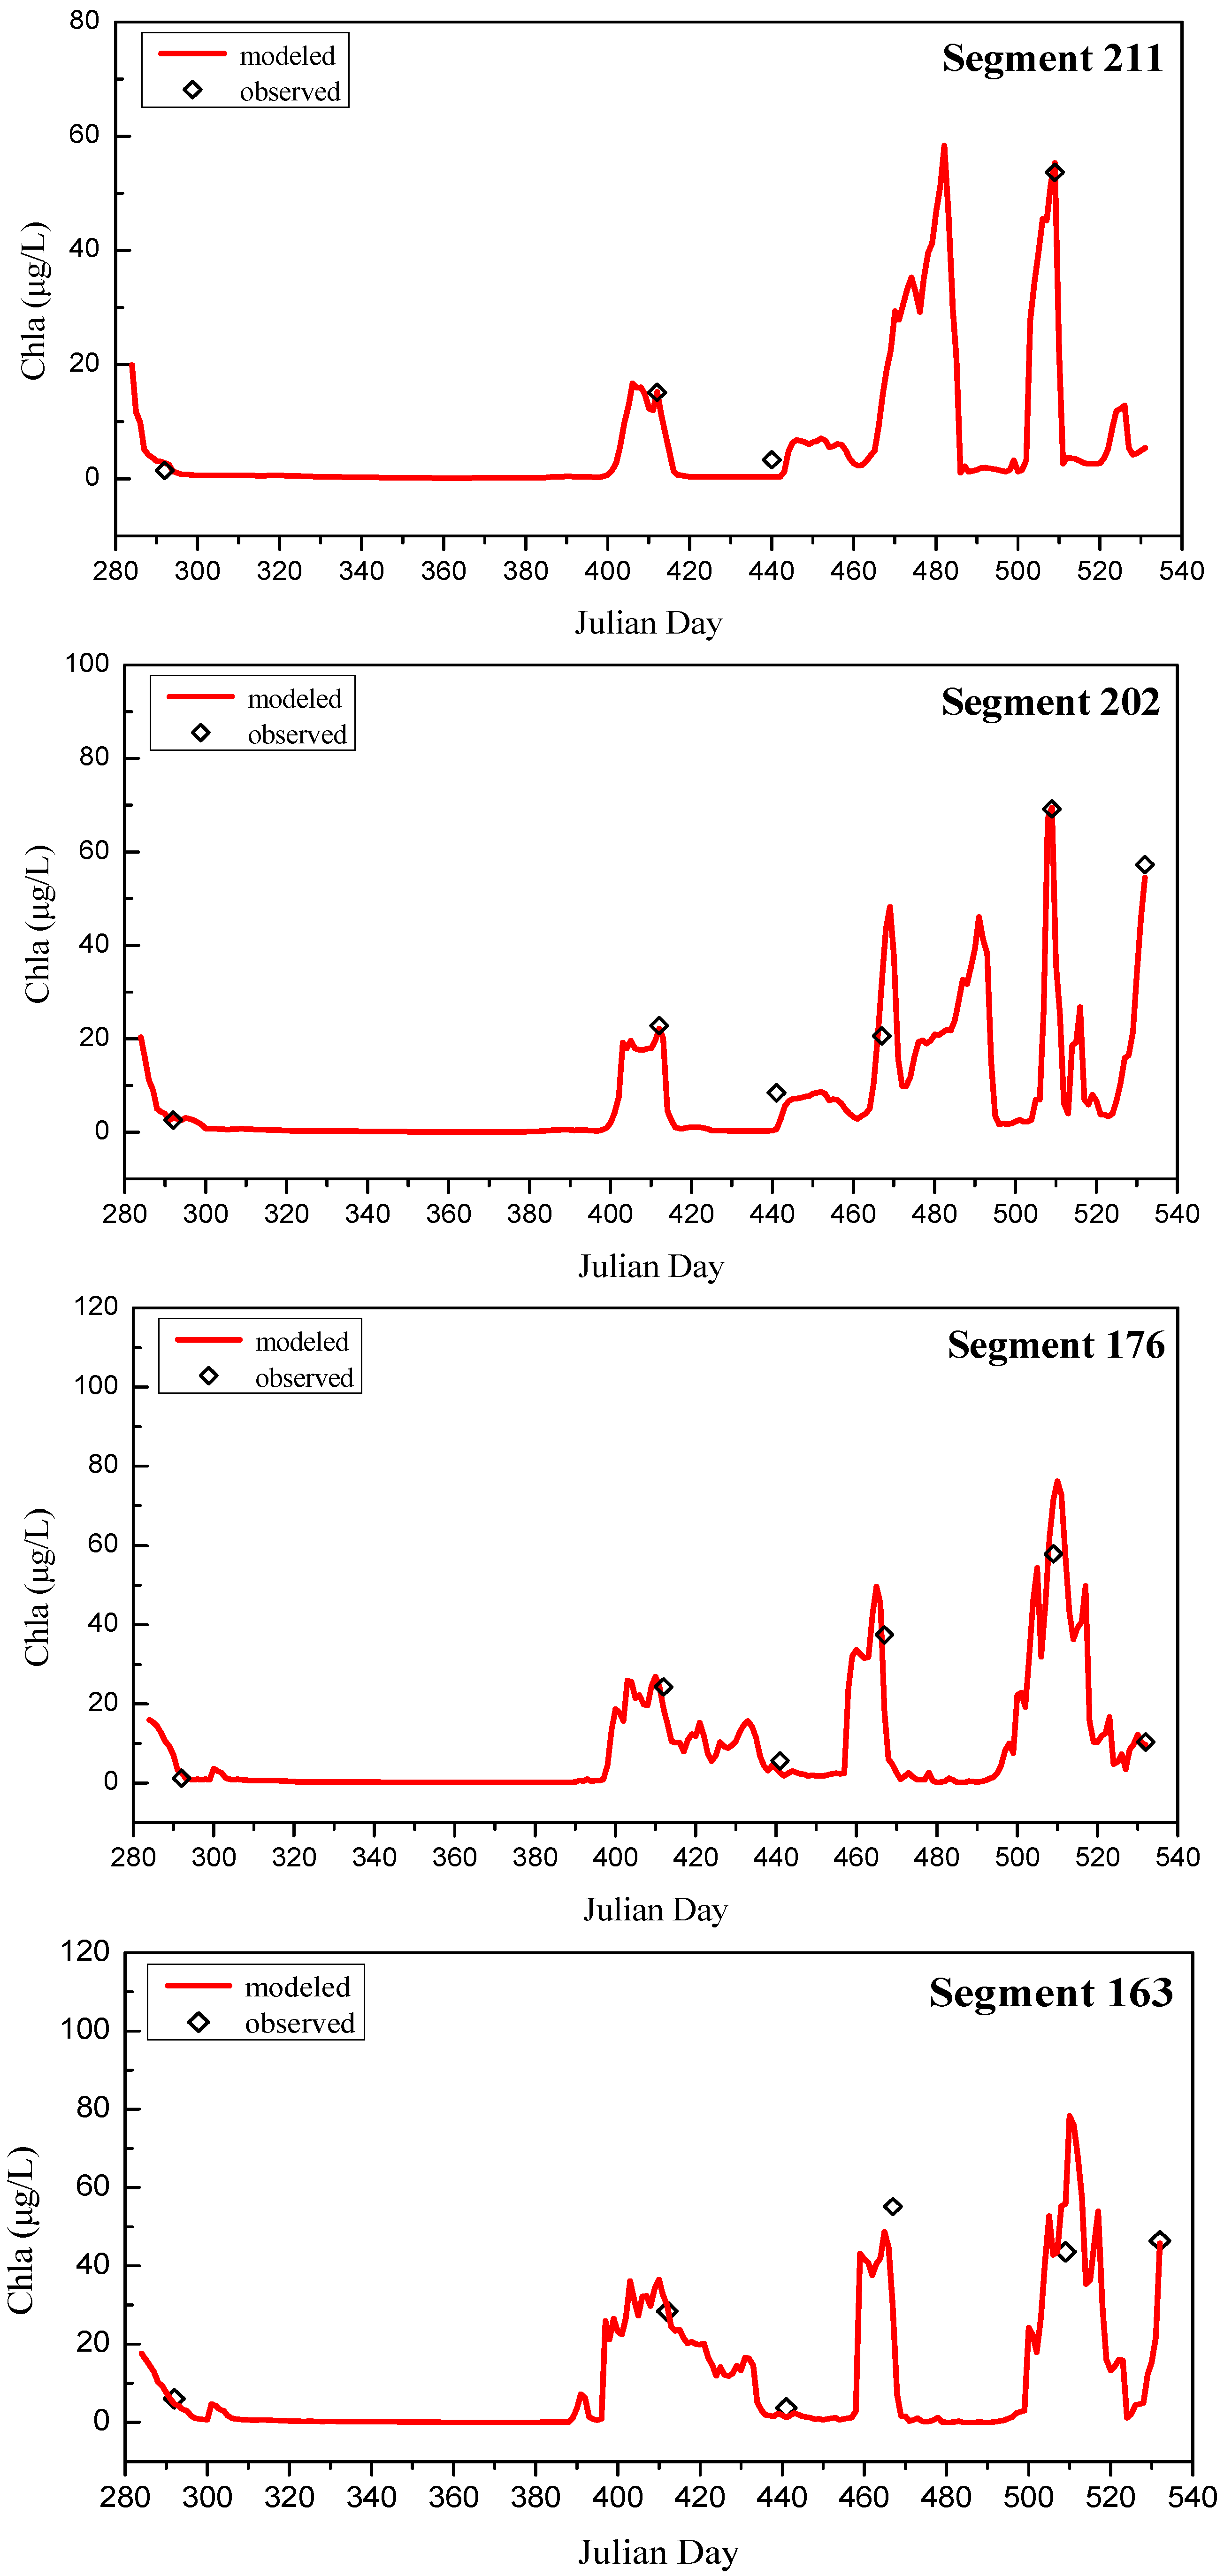
| MAE | 0.077 (m) | 0.416 (°C) | 0.014 (g/m3) | 0.108 (g/m3) | 0.064 (g/m3) | 0.849 (g/m3) | 5.531 (μg/L) |
| NSE | 0.999 | 0.977 | 0.521 | 0.751 | 0.910 | 0.983 | 0.718 |

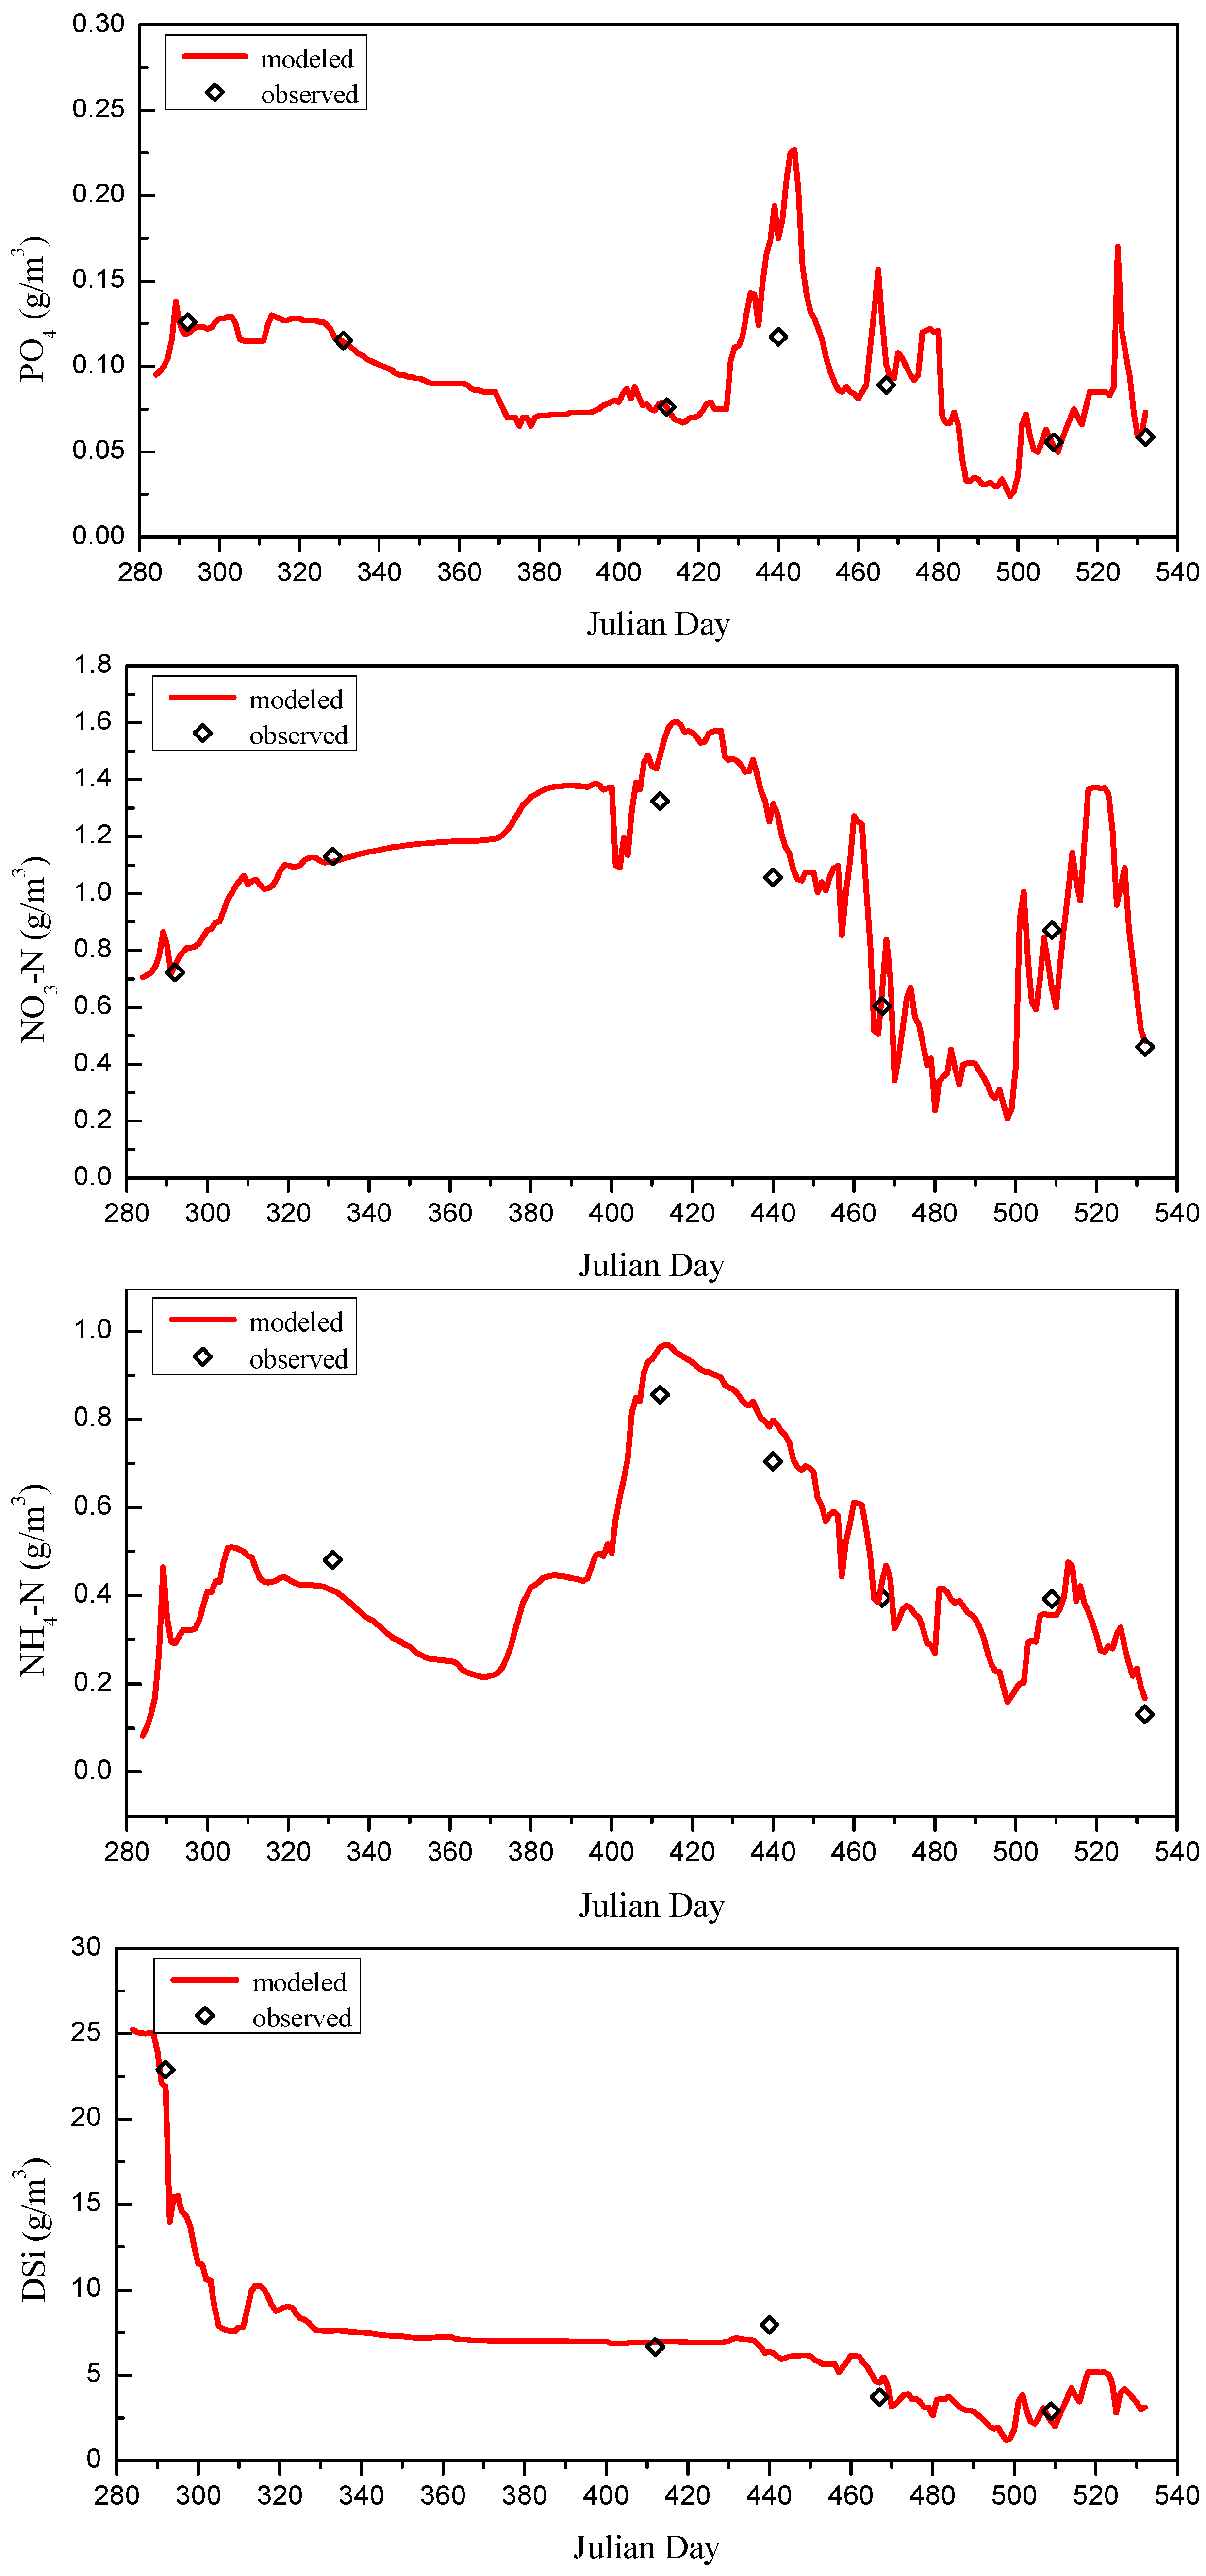
2.2.5. Water Quality Model Calibration

3. Reservoir Operation Rules for Controlling Algal Blooms
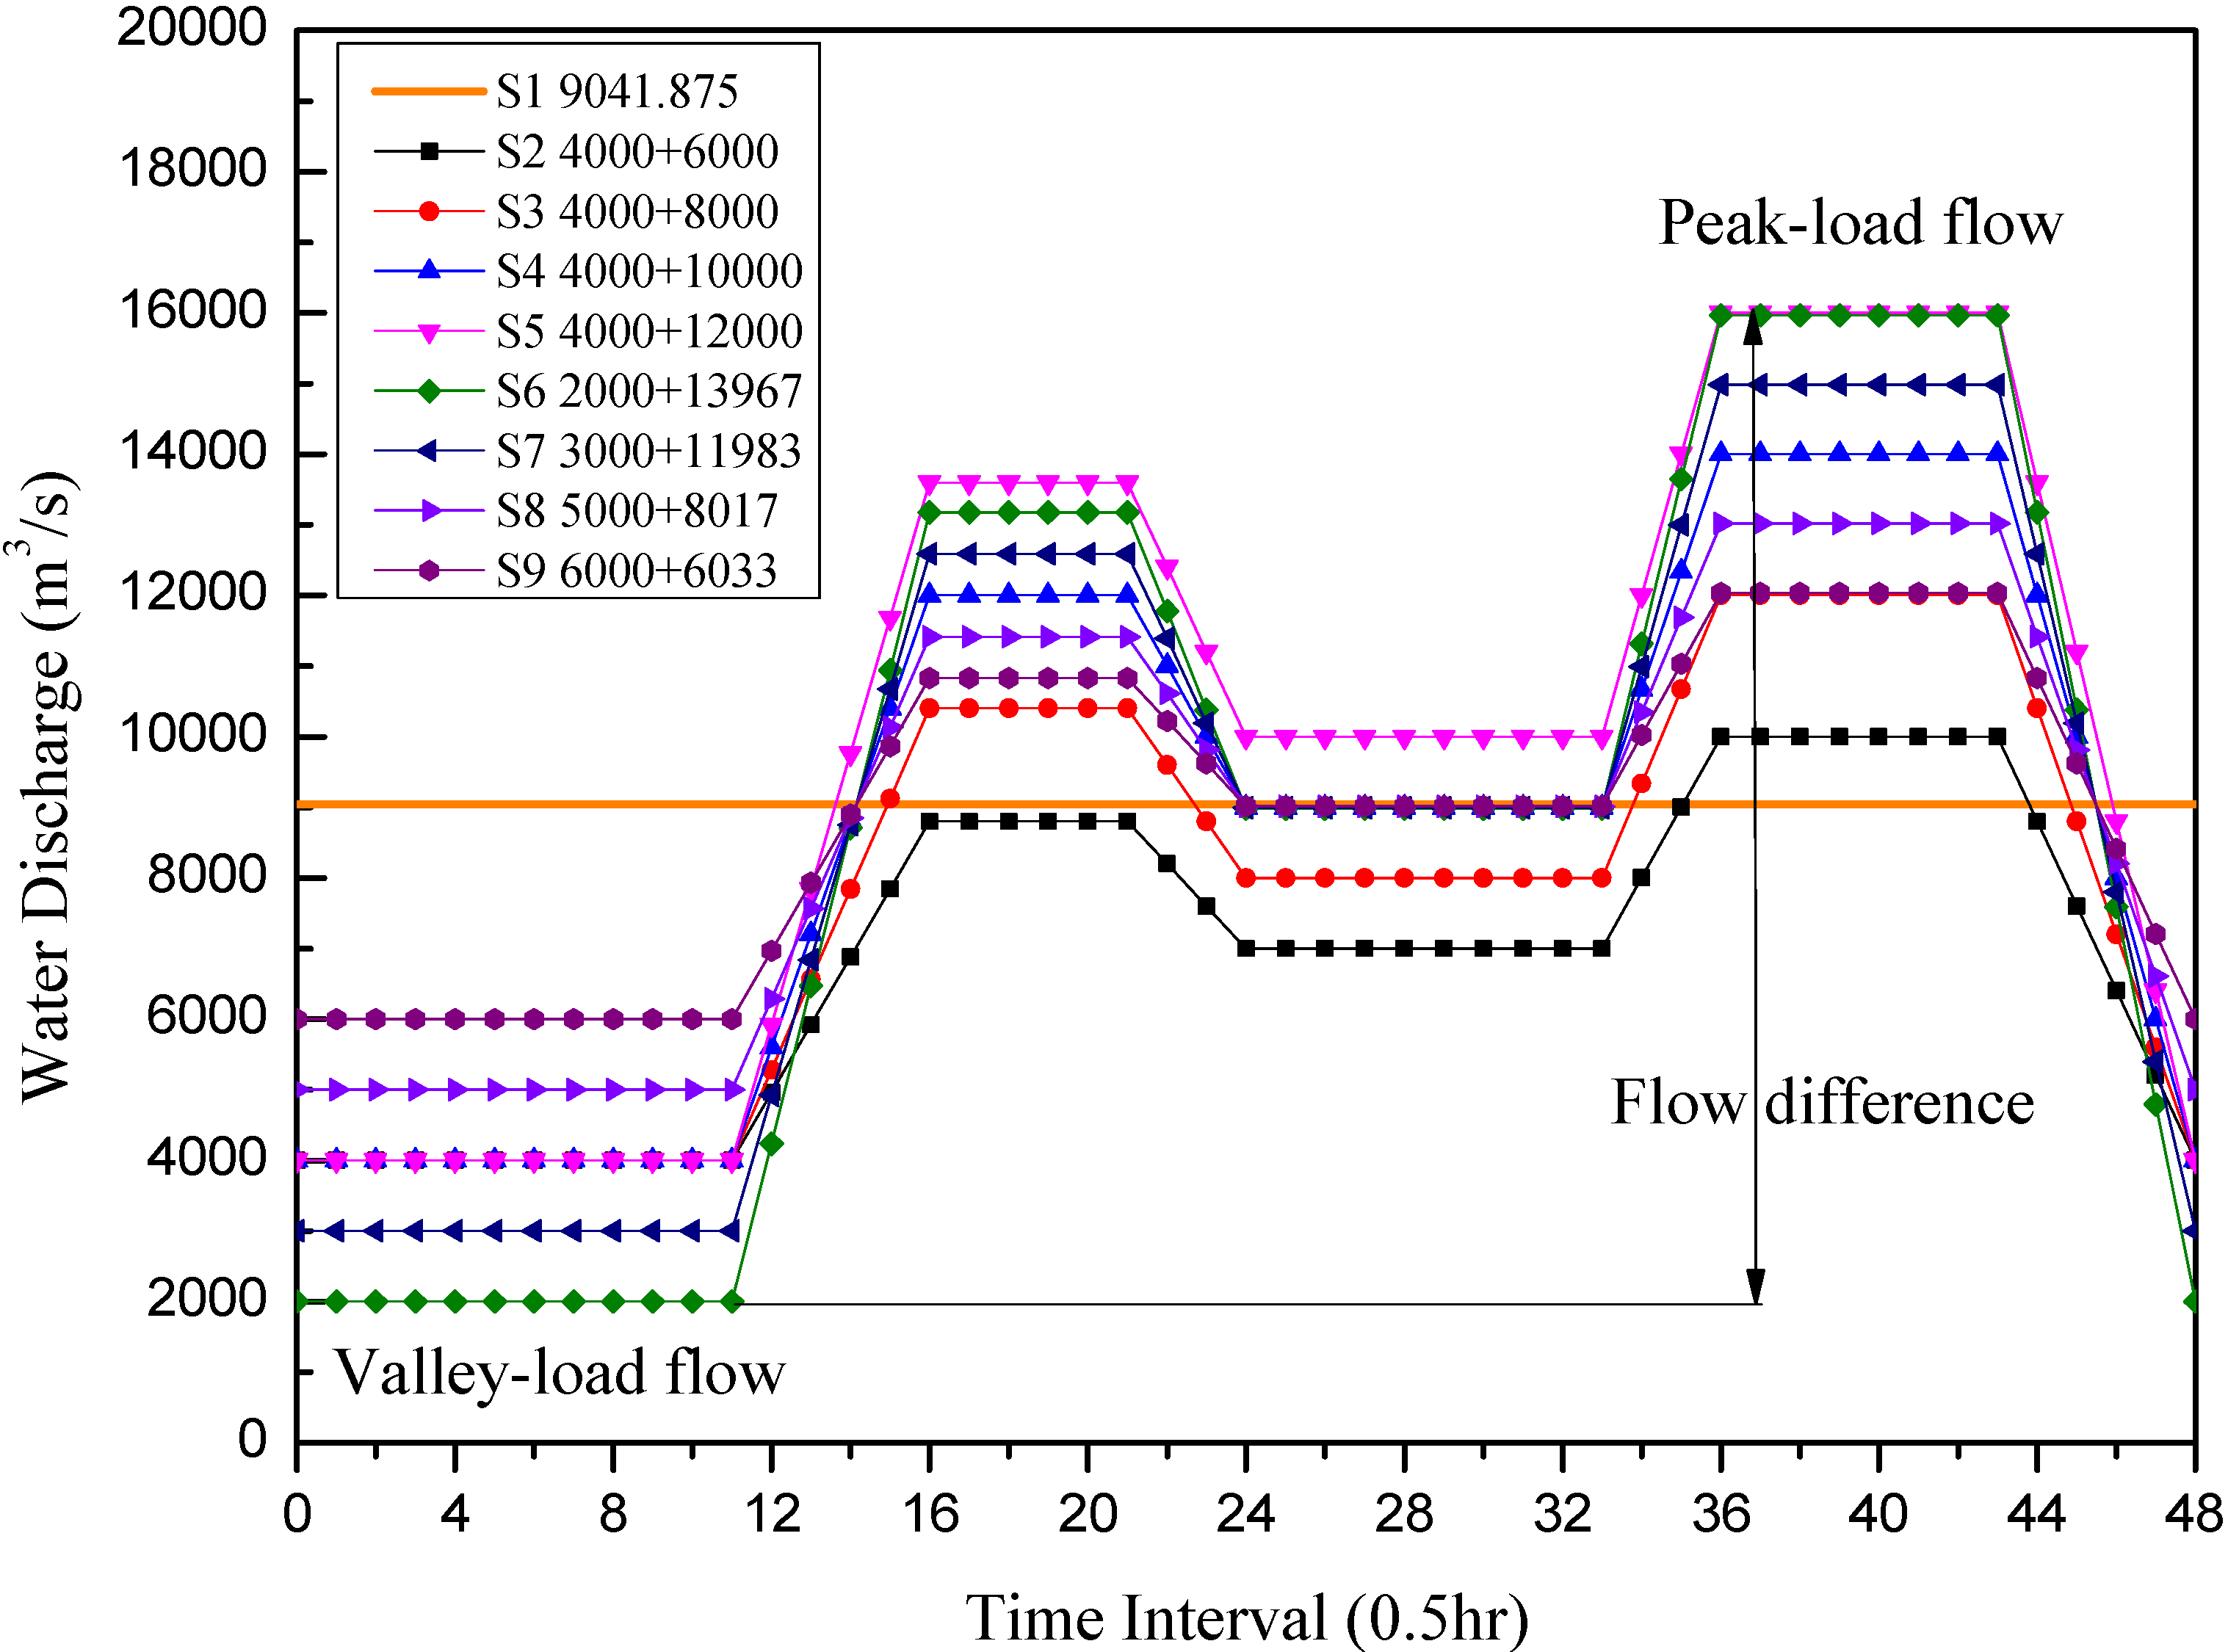
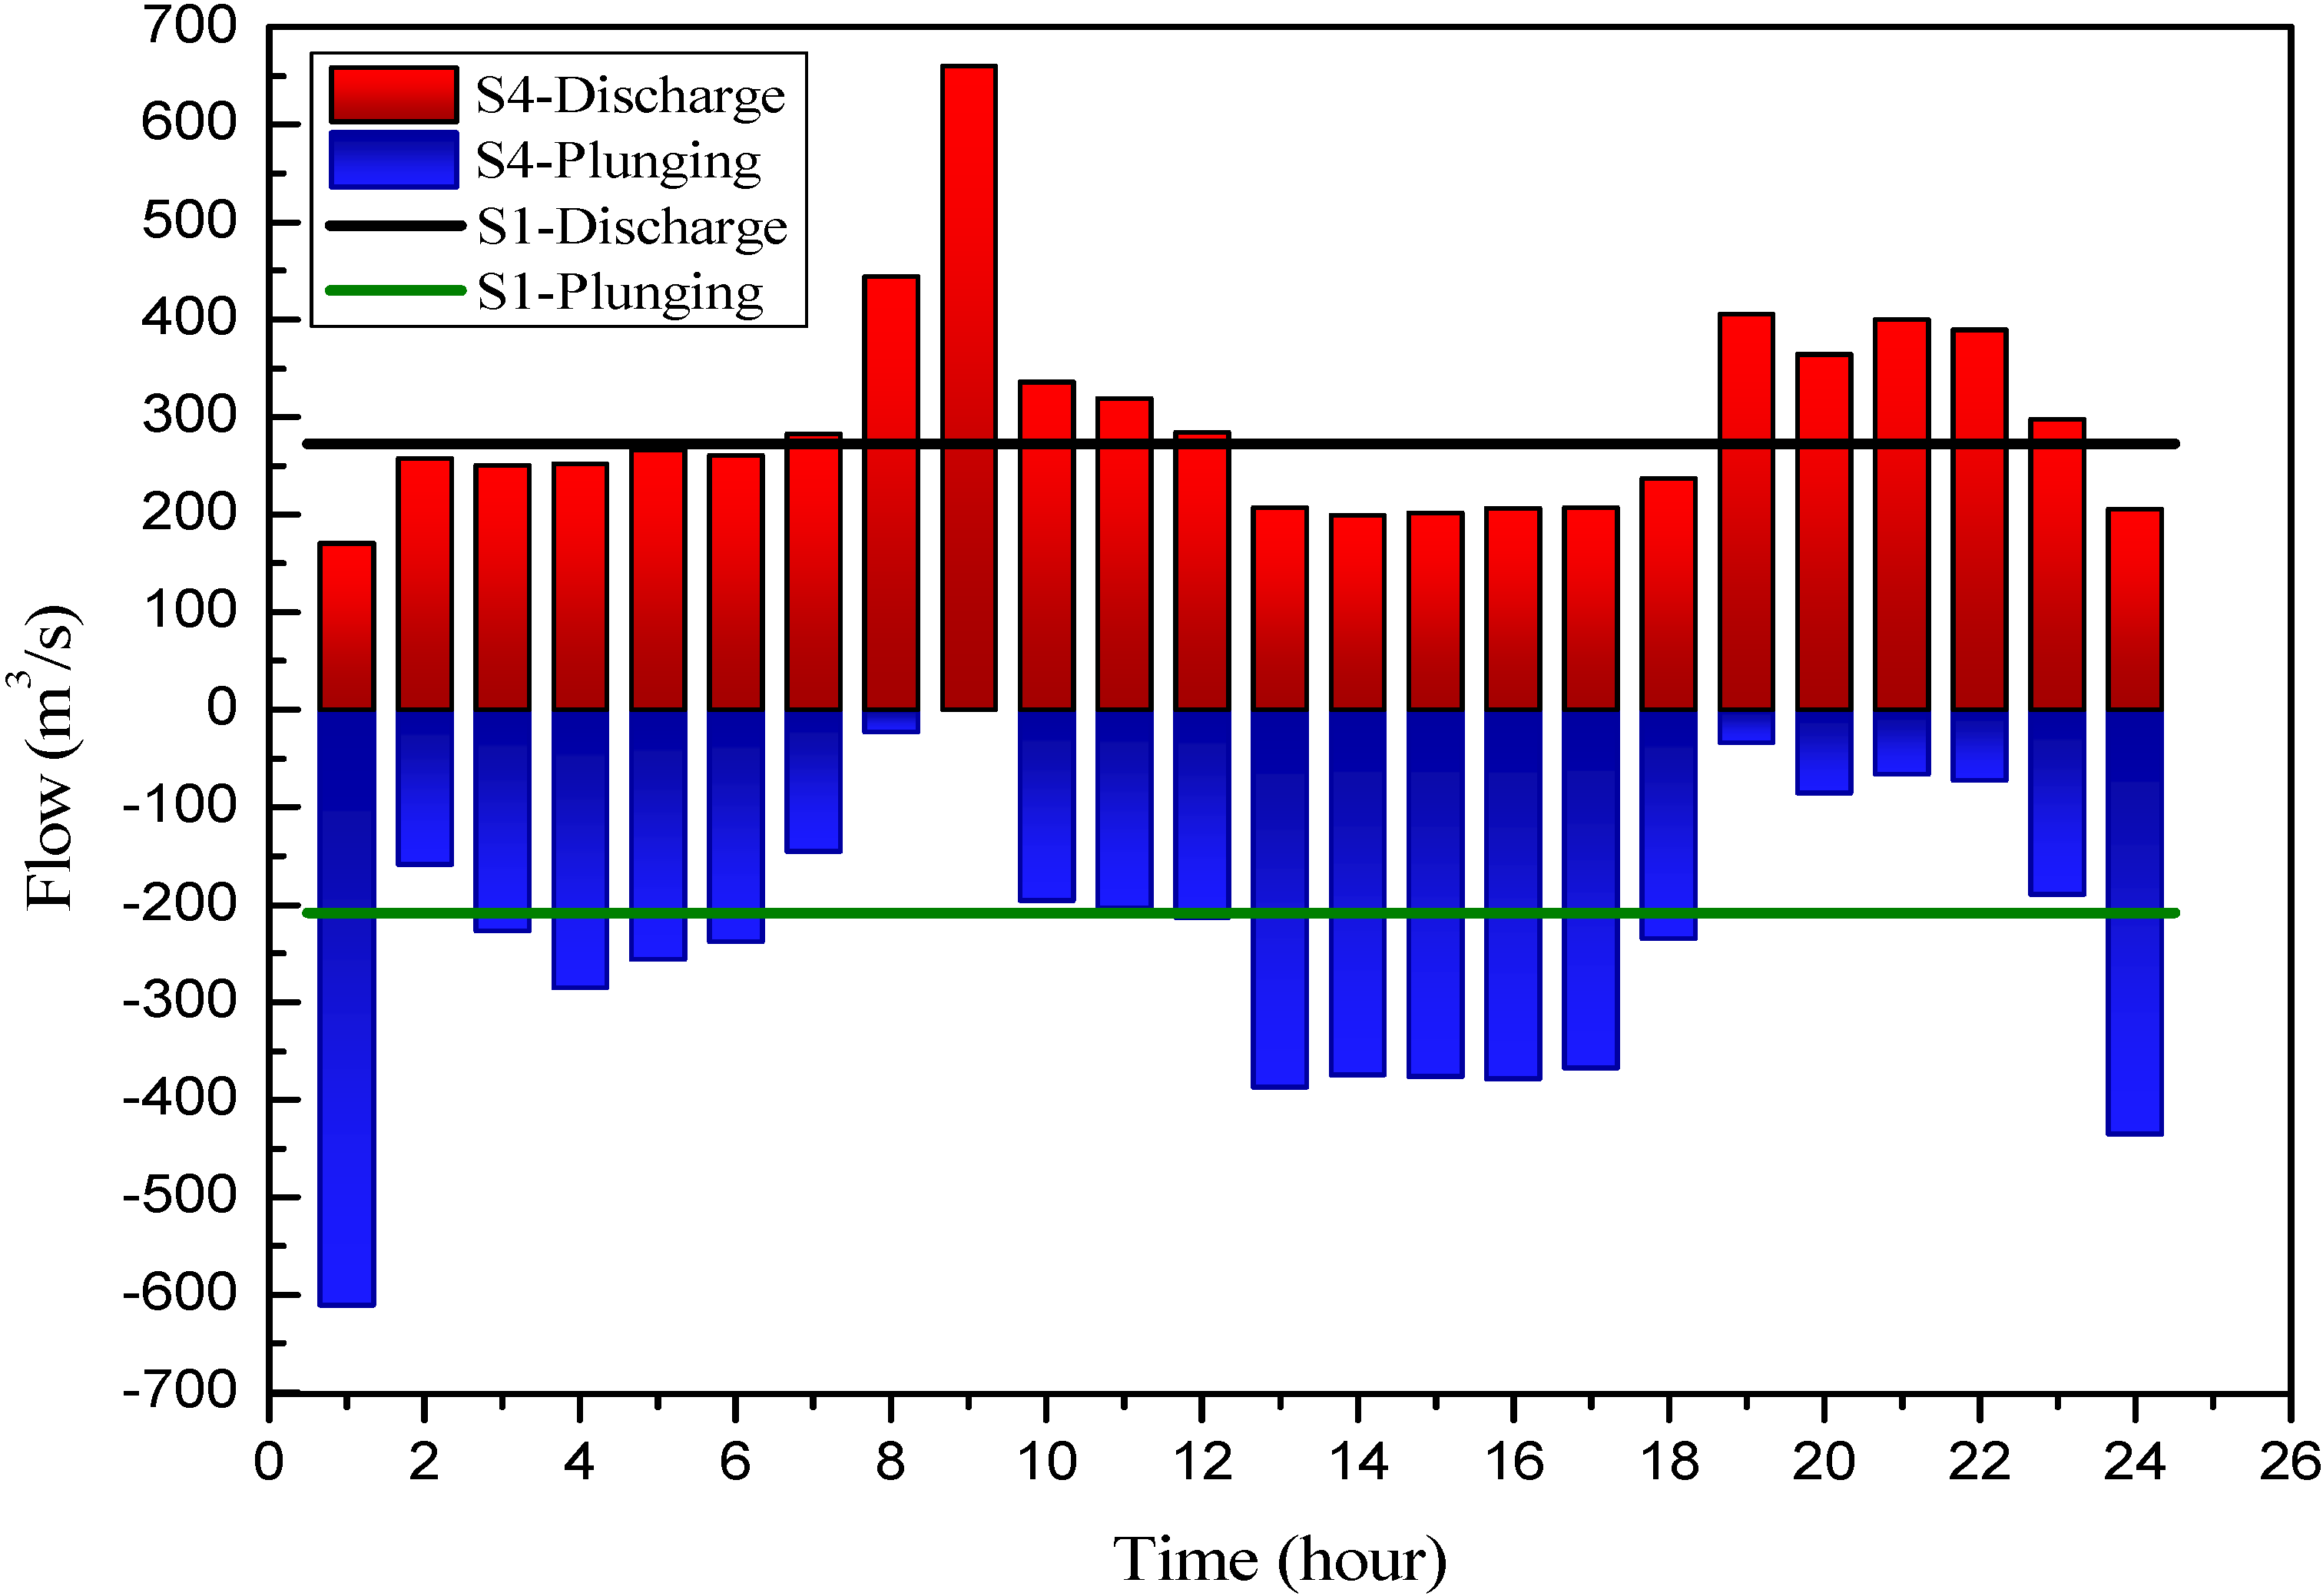
3.1. Generalization of Water Discharge Process of TGHS
3.2. Scenario Construction
| Constituent | Unit | Initial Condition | Boundary Condition | ||
|---|---|---|---|---|---|
| Mainstream | XXR | Mainstream | XXR | ||
| T | °C | 17 | 17.5~16.5 | 17 | 16 |
| Chla | μg/L | 0 | 10 | 0 | 10 |
| PO4 | g/m3 | 0.1 | 0.2 | 0.1 | 0.2 |
| NH4-N | g/m3 | 0.5 | 0.4 | 0.5 | 0.4 |
| NO3-N | g/m3 | 1.4 | 0.5 | 1.4 | 0.5 |
| DSi | g/m3 | 5.0 | 5.0 | 5.0 | 5.0 |
| Operation Type | Scenario | Operation Factor | Peak Moment (Julian Day) | Maximum Chla (μg/L) | Reduced Rate of Maximum Chla (%) | Coverage Length at the Peak Moment | Average Chla (μg/L) | Reduced Rate of Average Chla (%) | Outbreak Duration (day) | |||
|---|---|---|---|---|---|---|---|---|---|---|---|---|
| Boundary a (km) | Length (km) | (1) | (2) | (1)–(2) | ||||||||
| Short-term operation | S1 | 0 | 25.75 | 117.76 | 0.00 | 28.5–17.5 | 11.0 | 93.71 | 0.00 | 15 | 35 | 20 |
| S2 | 4000 + 6000 | 26.75 | 115.51 | 1.91 | 28.5–18.5 | 10.0 | 93.59 | 0.13 | 15 | 33 | 18 | |
| S3 | 4000 + 8000 | 25.75 | 108.31 | 8.02 | 28.5–19 | 9.5 | 90.17 | 3.78 | 15 | 33 | 18 | |
| S4 | 4000 + 10000 | 24.75 | 103.10 | 12.45 | 28.5–19 | 9.5 | 85.16 | 9.13 | 15 | 33 | 18 | |
| S5 | 4000 + 12000 | 23.75 | 94.31 | 19.92 | 28.5–19.5 | 9.0 | 80.90 | 13.67 | 15 | 31 | 16 | |
| S6 | 2000 + 13967 | 23.75 | 92.47 | 21.48 | 28.5–20.0 | 8.5 | 79.76 | 14.89 | 15 | 29 | 14 | |
| S7 | 3000 + 11983 | 23.75 | 97.68 | 17.05 | 28.5–19.0 | 9.5 | 81.74 | 12.78 | 15 | 30 | 15 | |
| S8 | 5000 + 8017 | 24.75 | 105.40 | 10.49 | 28.5–18.5 | 10.0 | 87.67 | 6.45 | 15 | 33 | 18 | |
| S9 | 6000 + 6033 | 24.75 | 107.89 | 8.38 | 28.5–18.0 | 10.5 | 88.53 | 5.53 | 15 | 34 | 19 | |
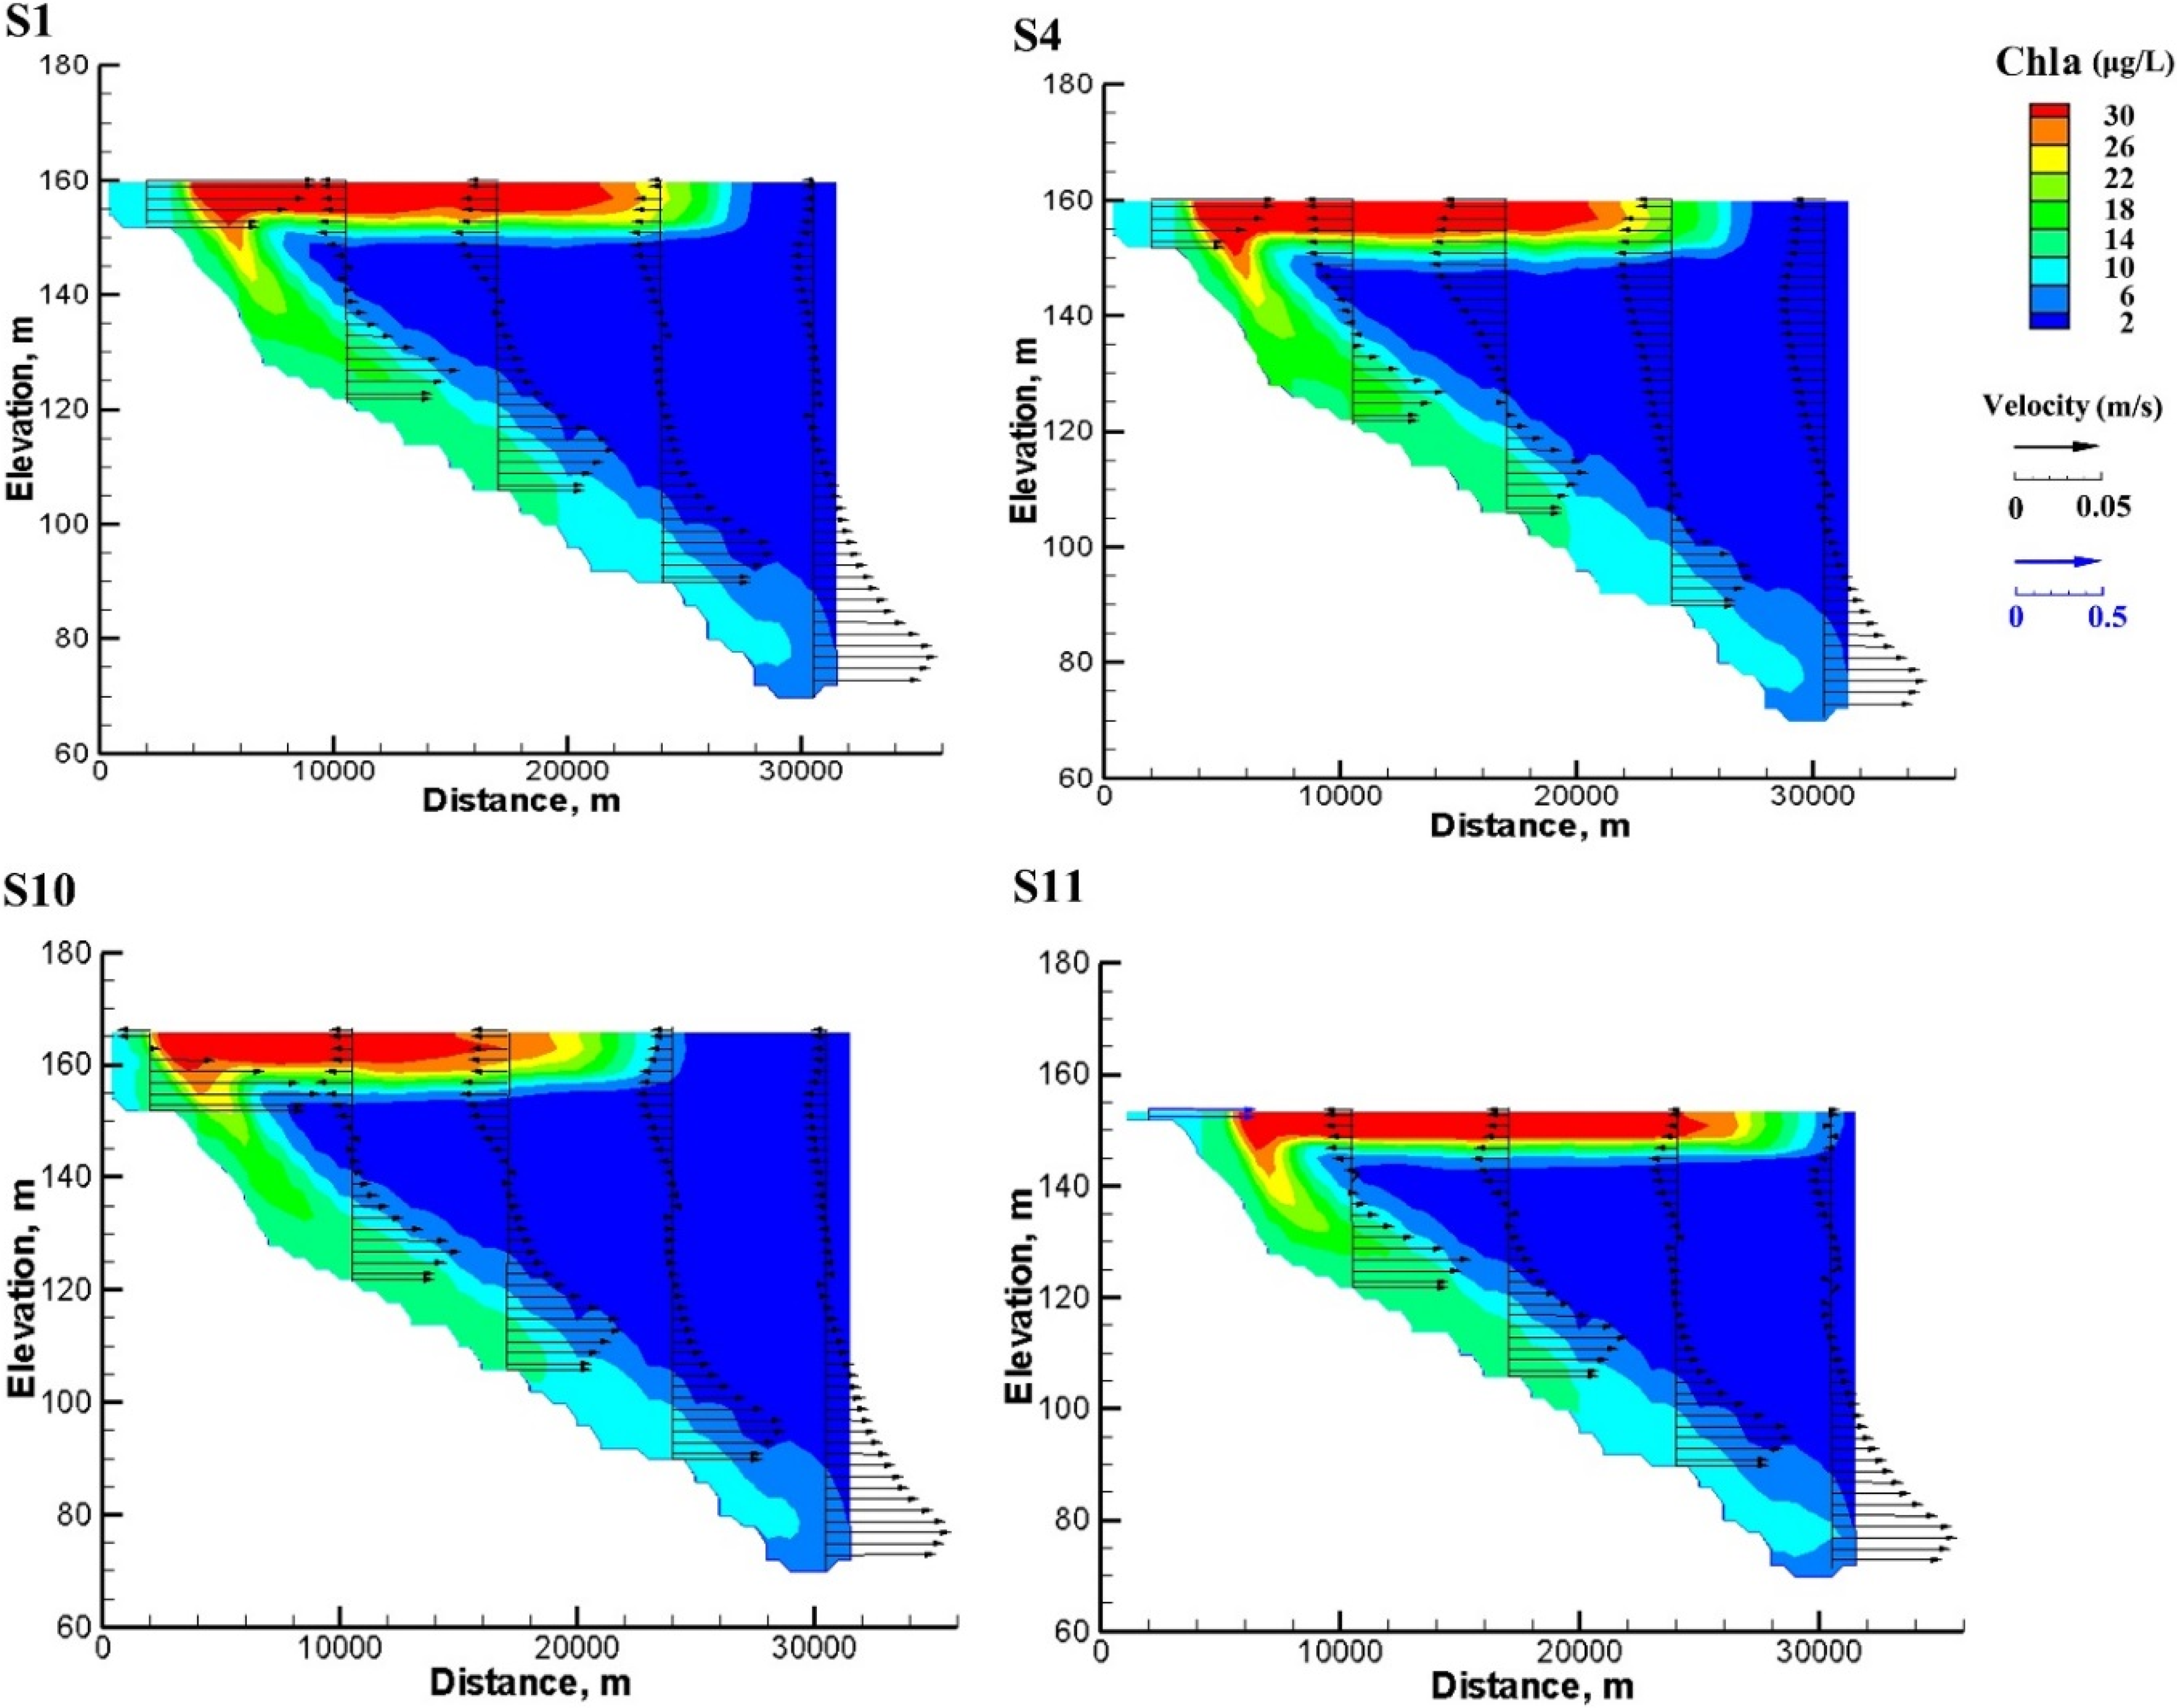
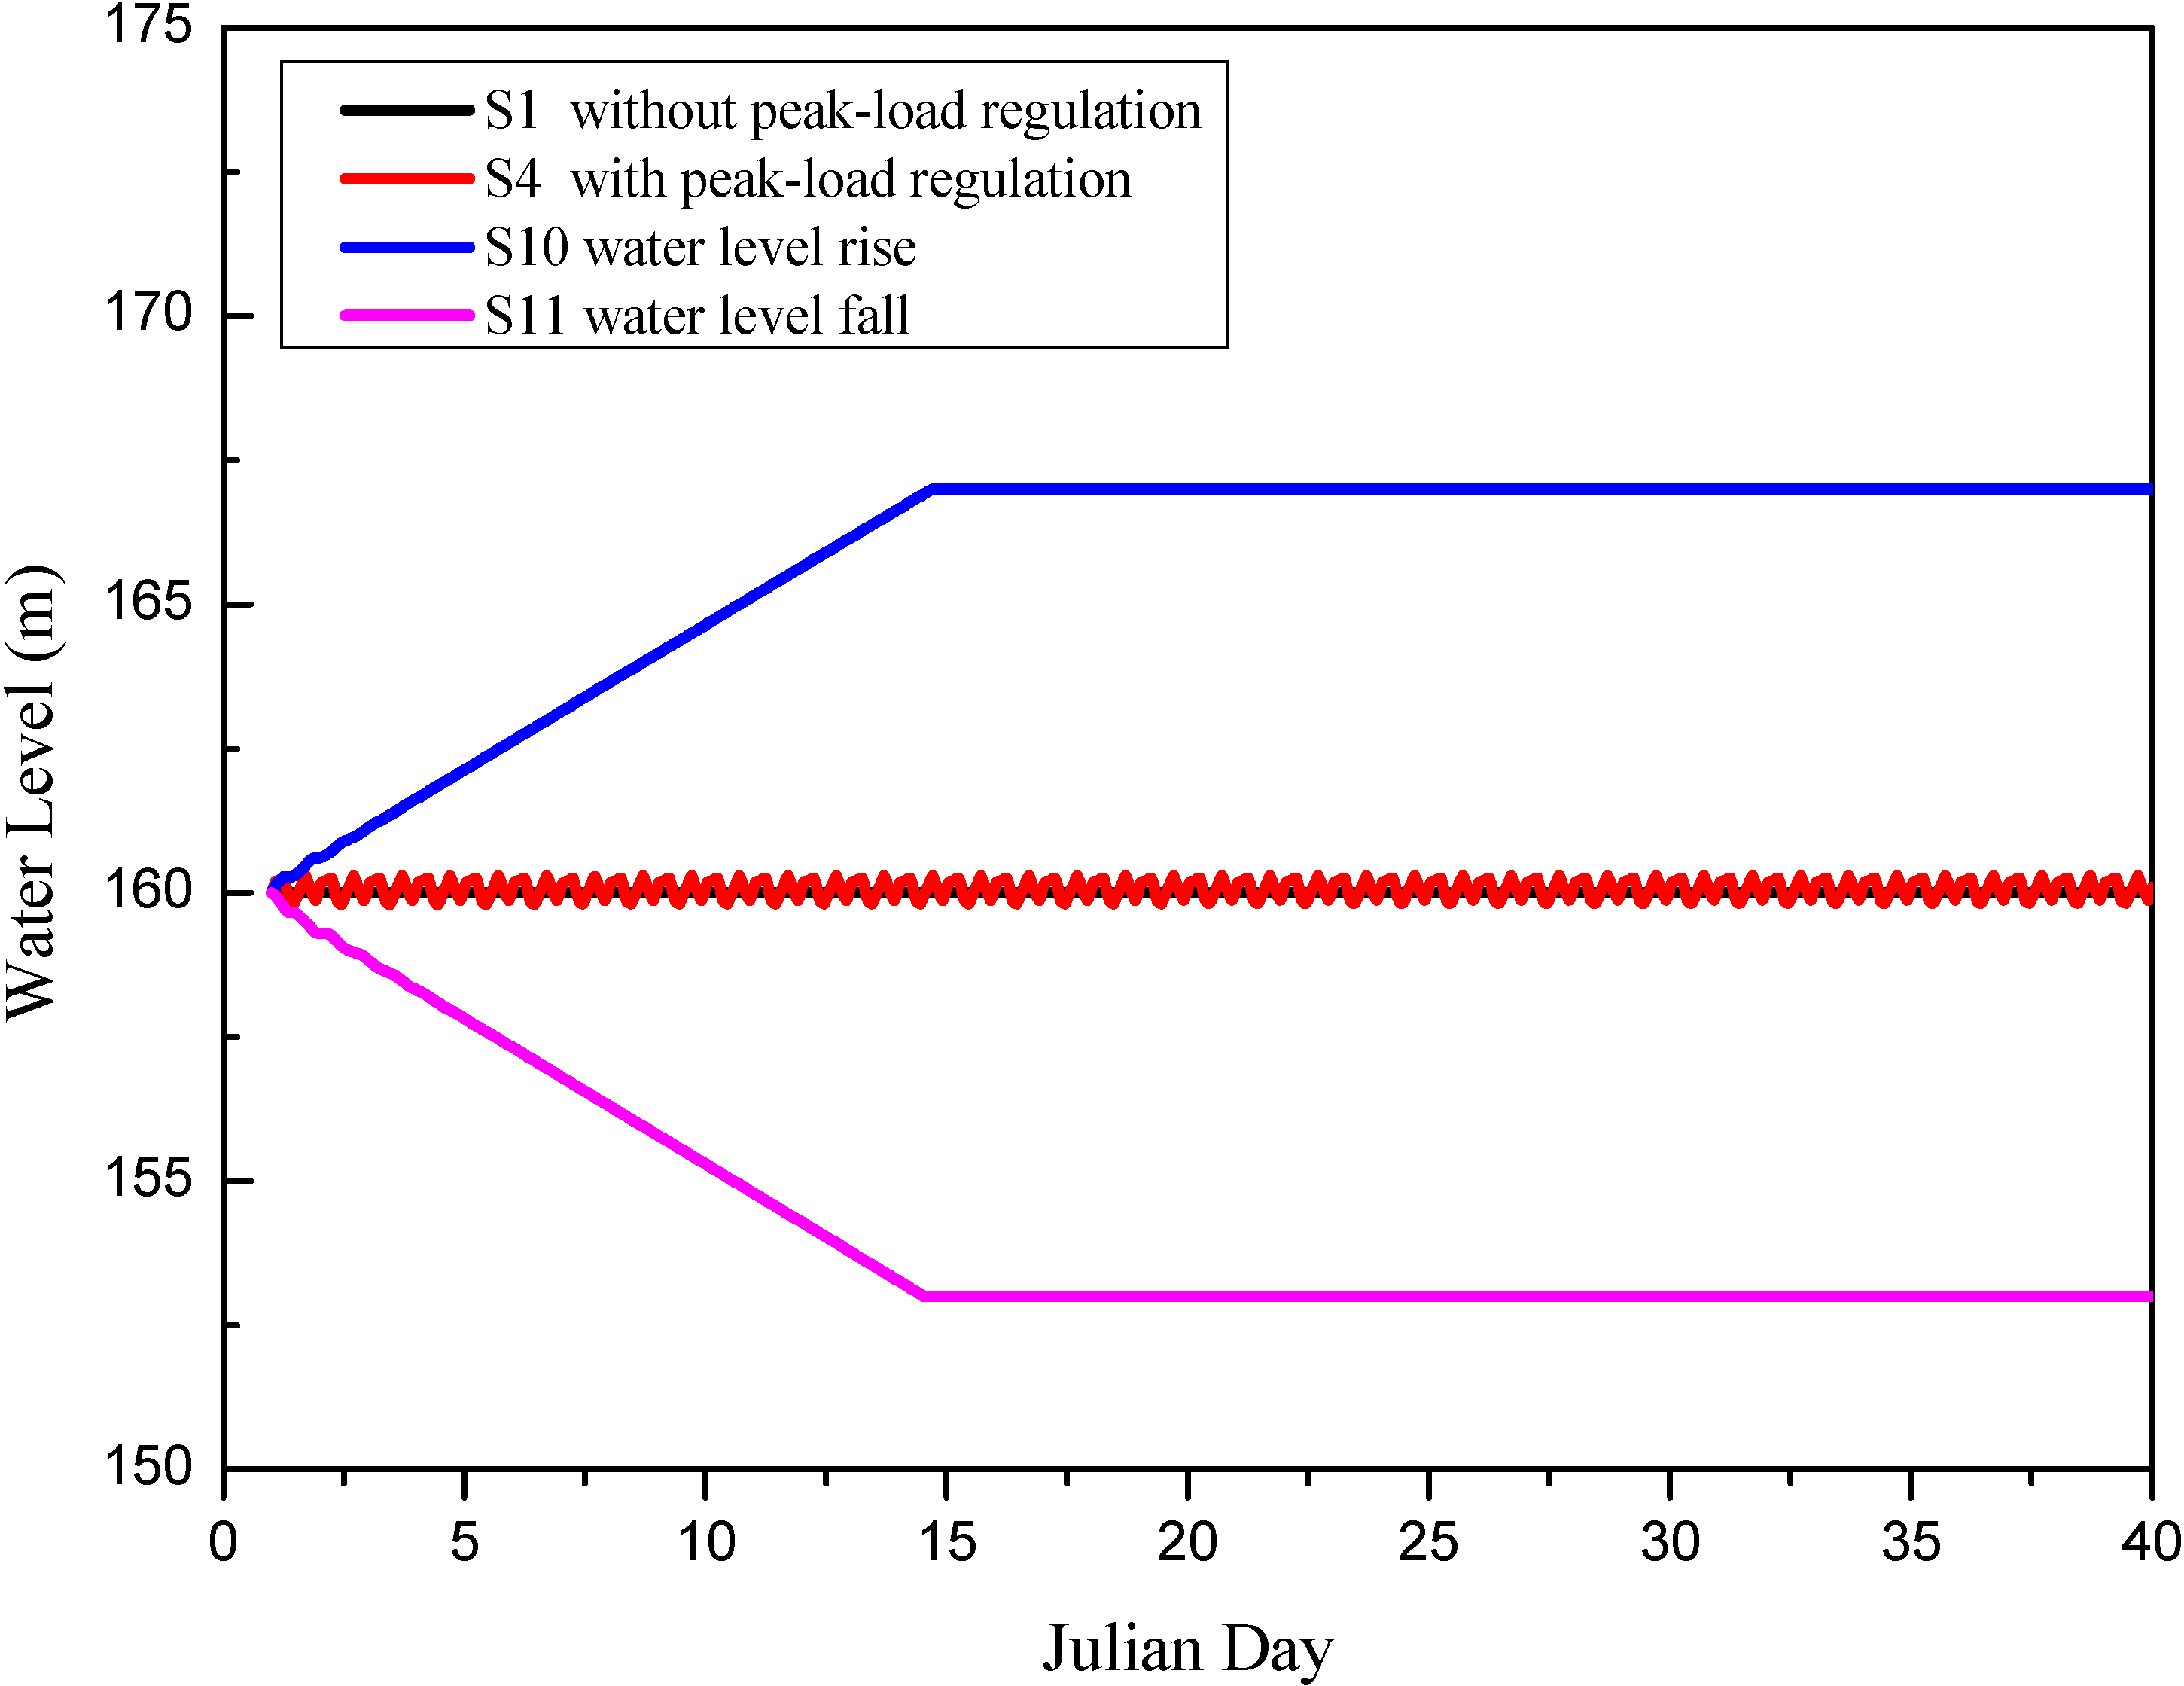
| Medium-term operation | S10 | 160–167 m (0.5 m/d) | 22.75 | 80.14 | 31.95 | 30.5–21.0 | 9.5 | 72.74 | 22.38 | 15 | 26 | 11 |
| S11 | 160–153 m (0.5 m/d) | 32.75 | 156.91 | −33.24 | 26.5–14.0 | 12.5 | 111.52 | -19.00 | 16 | 40 | 24+ b | |
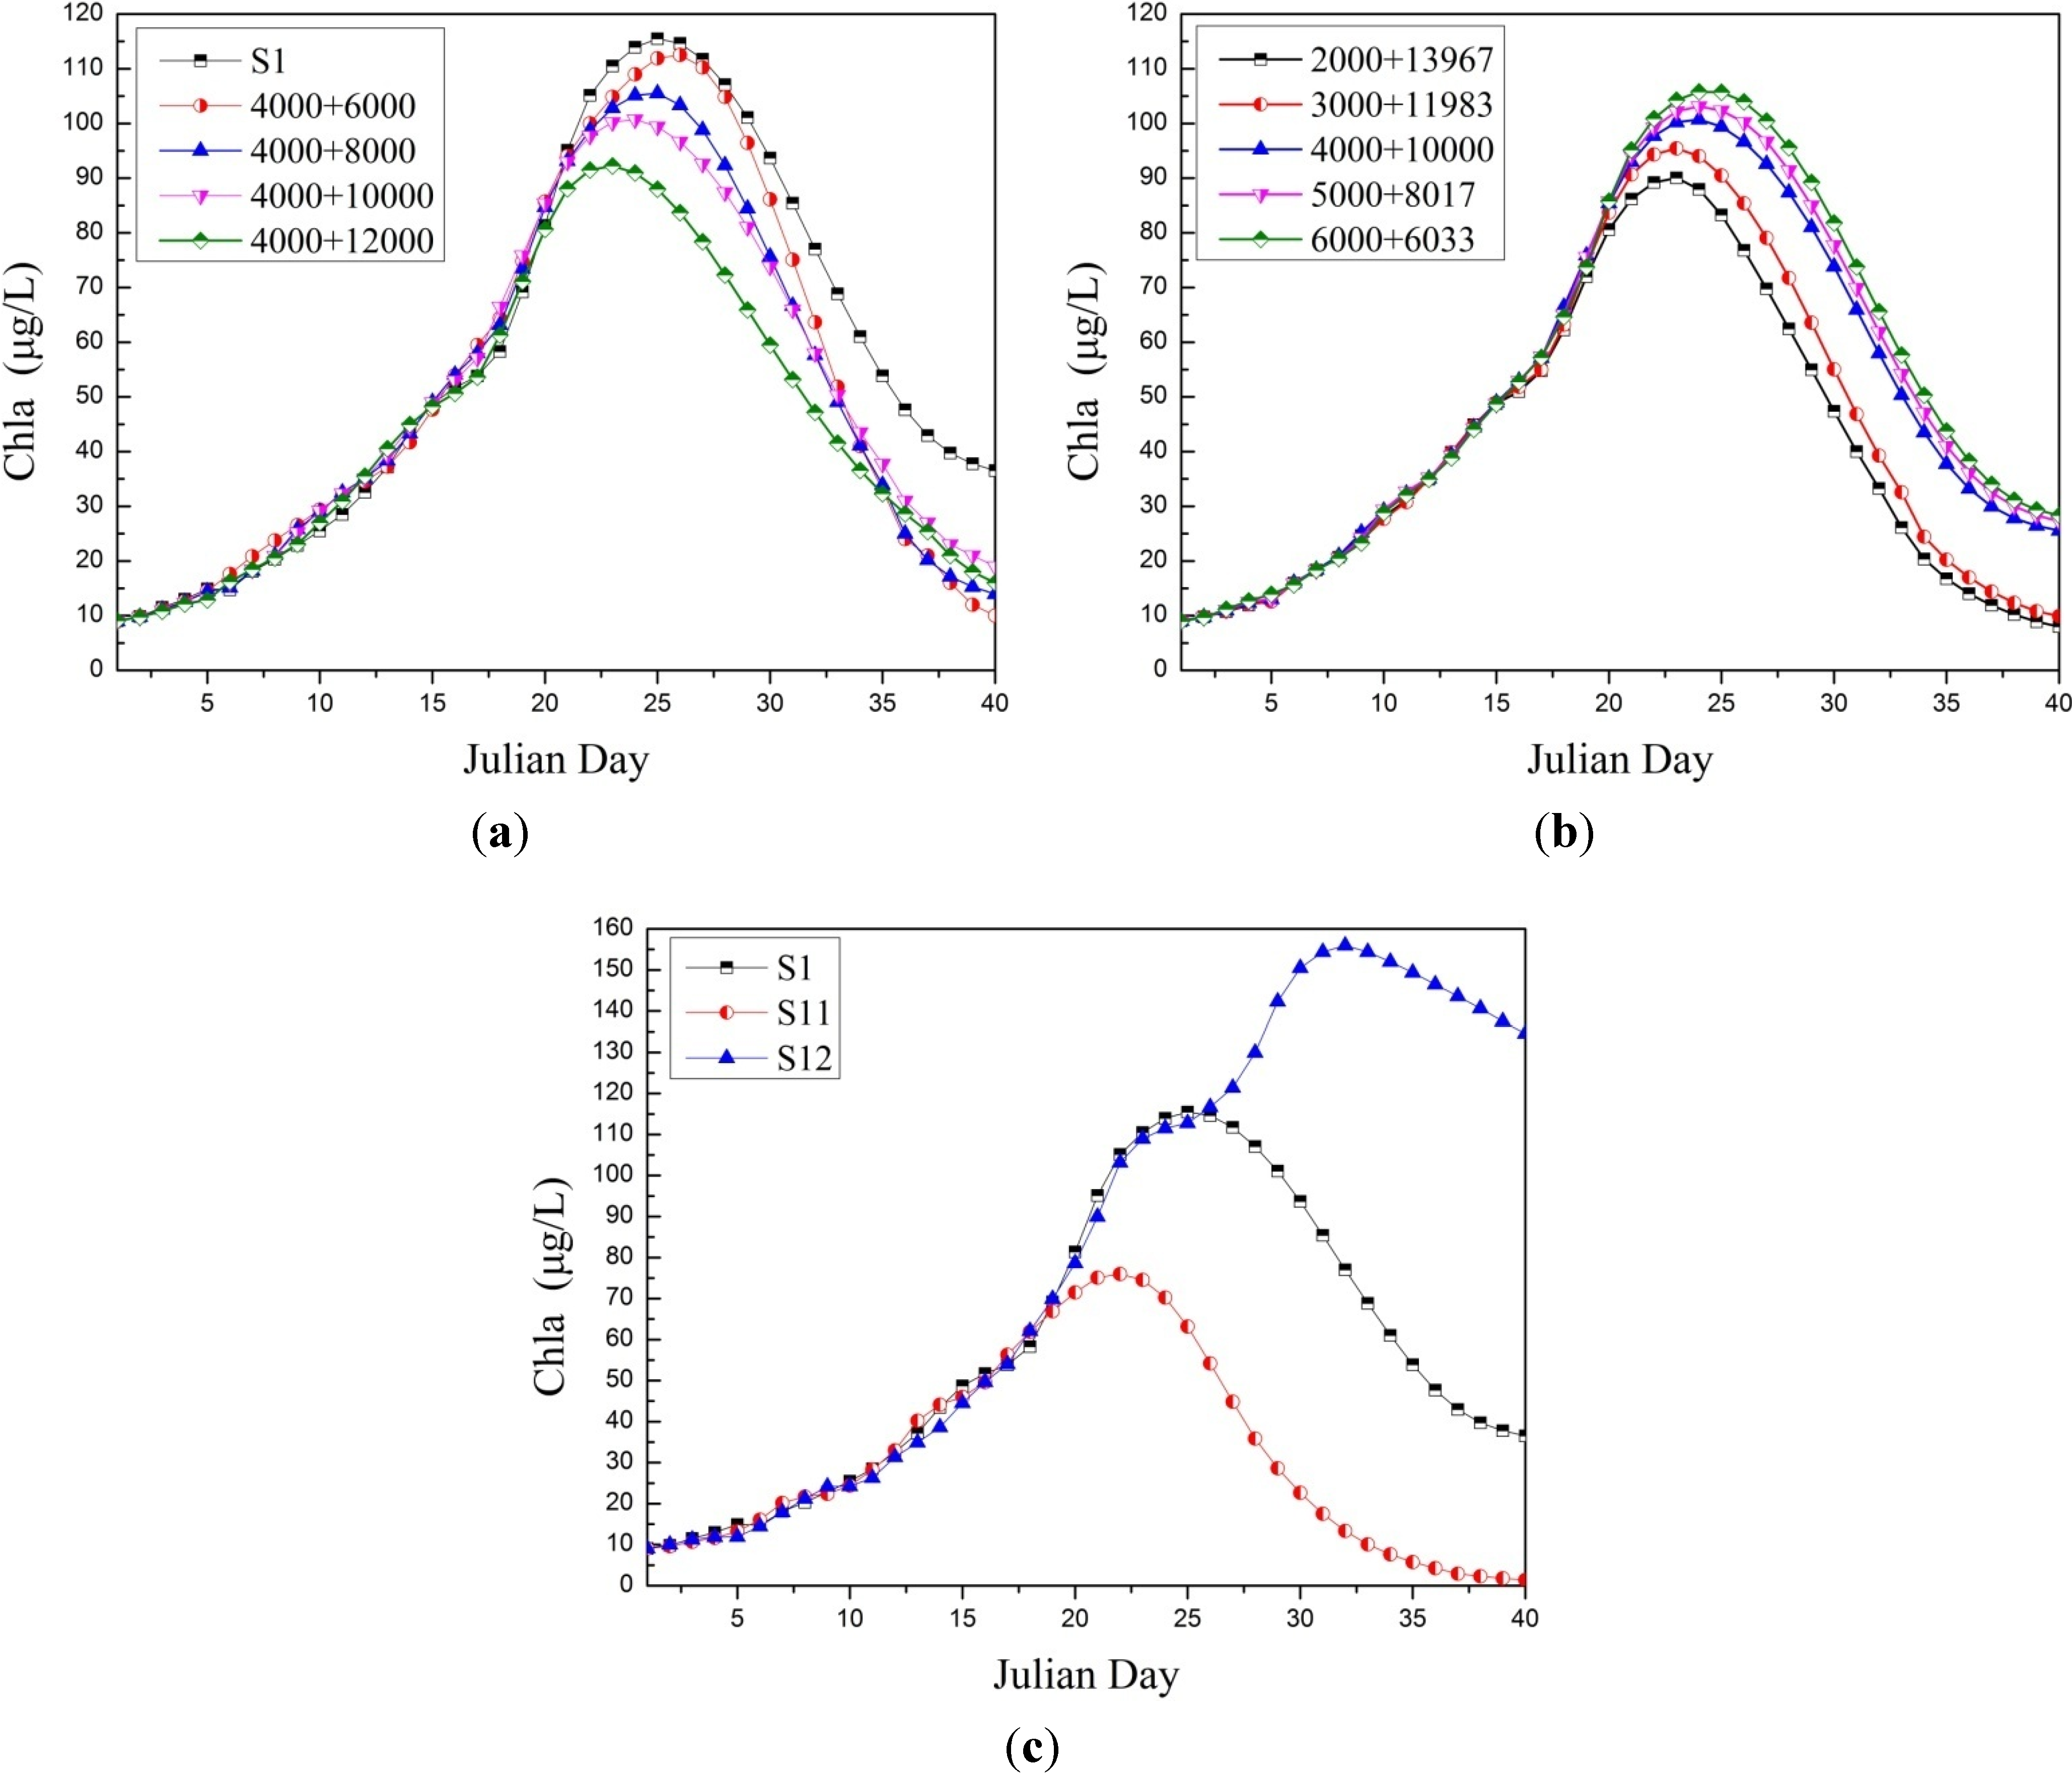
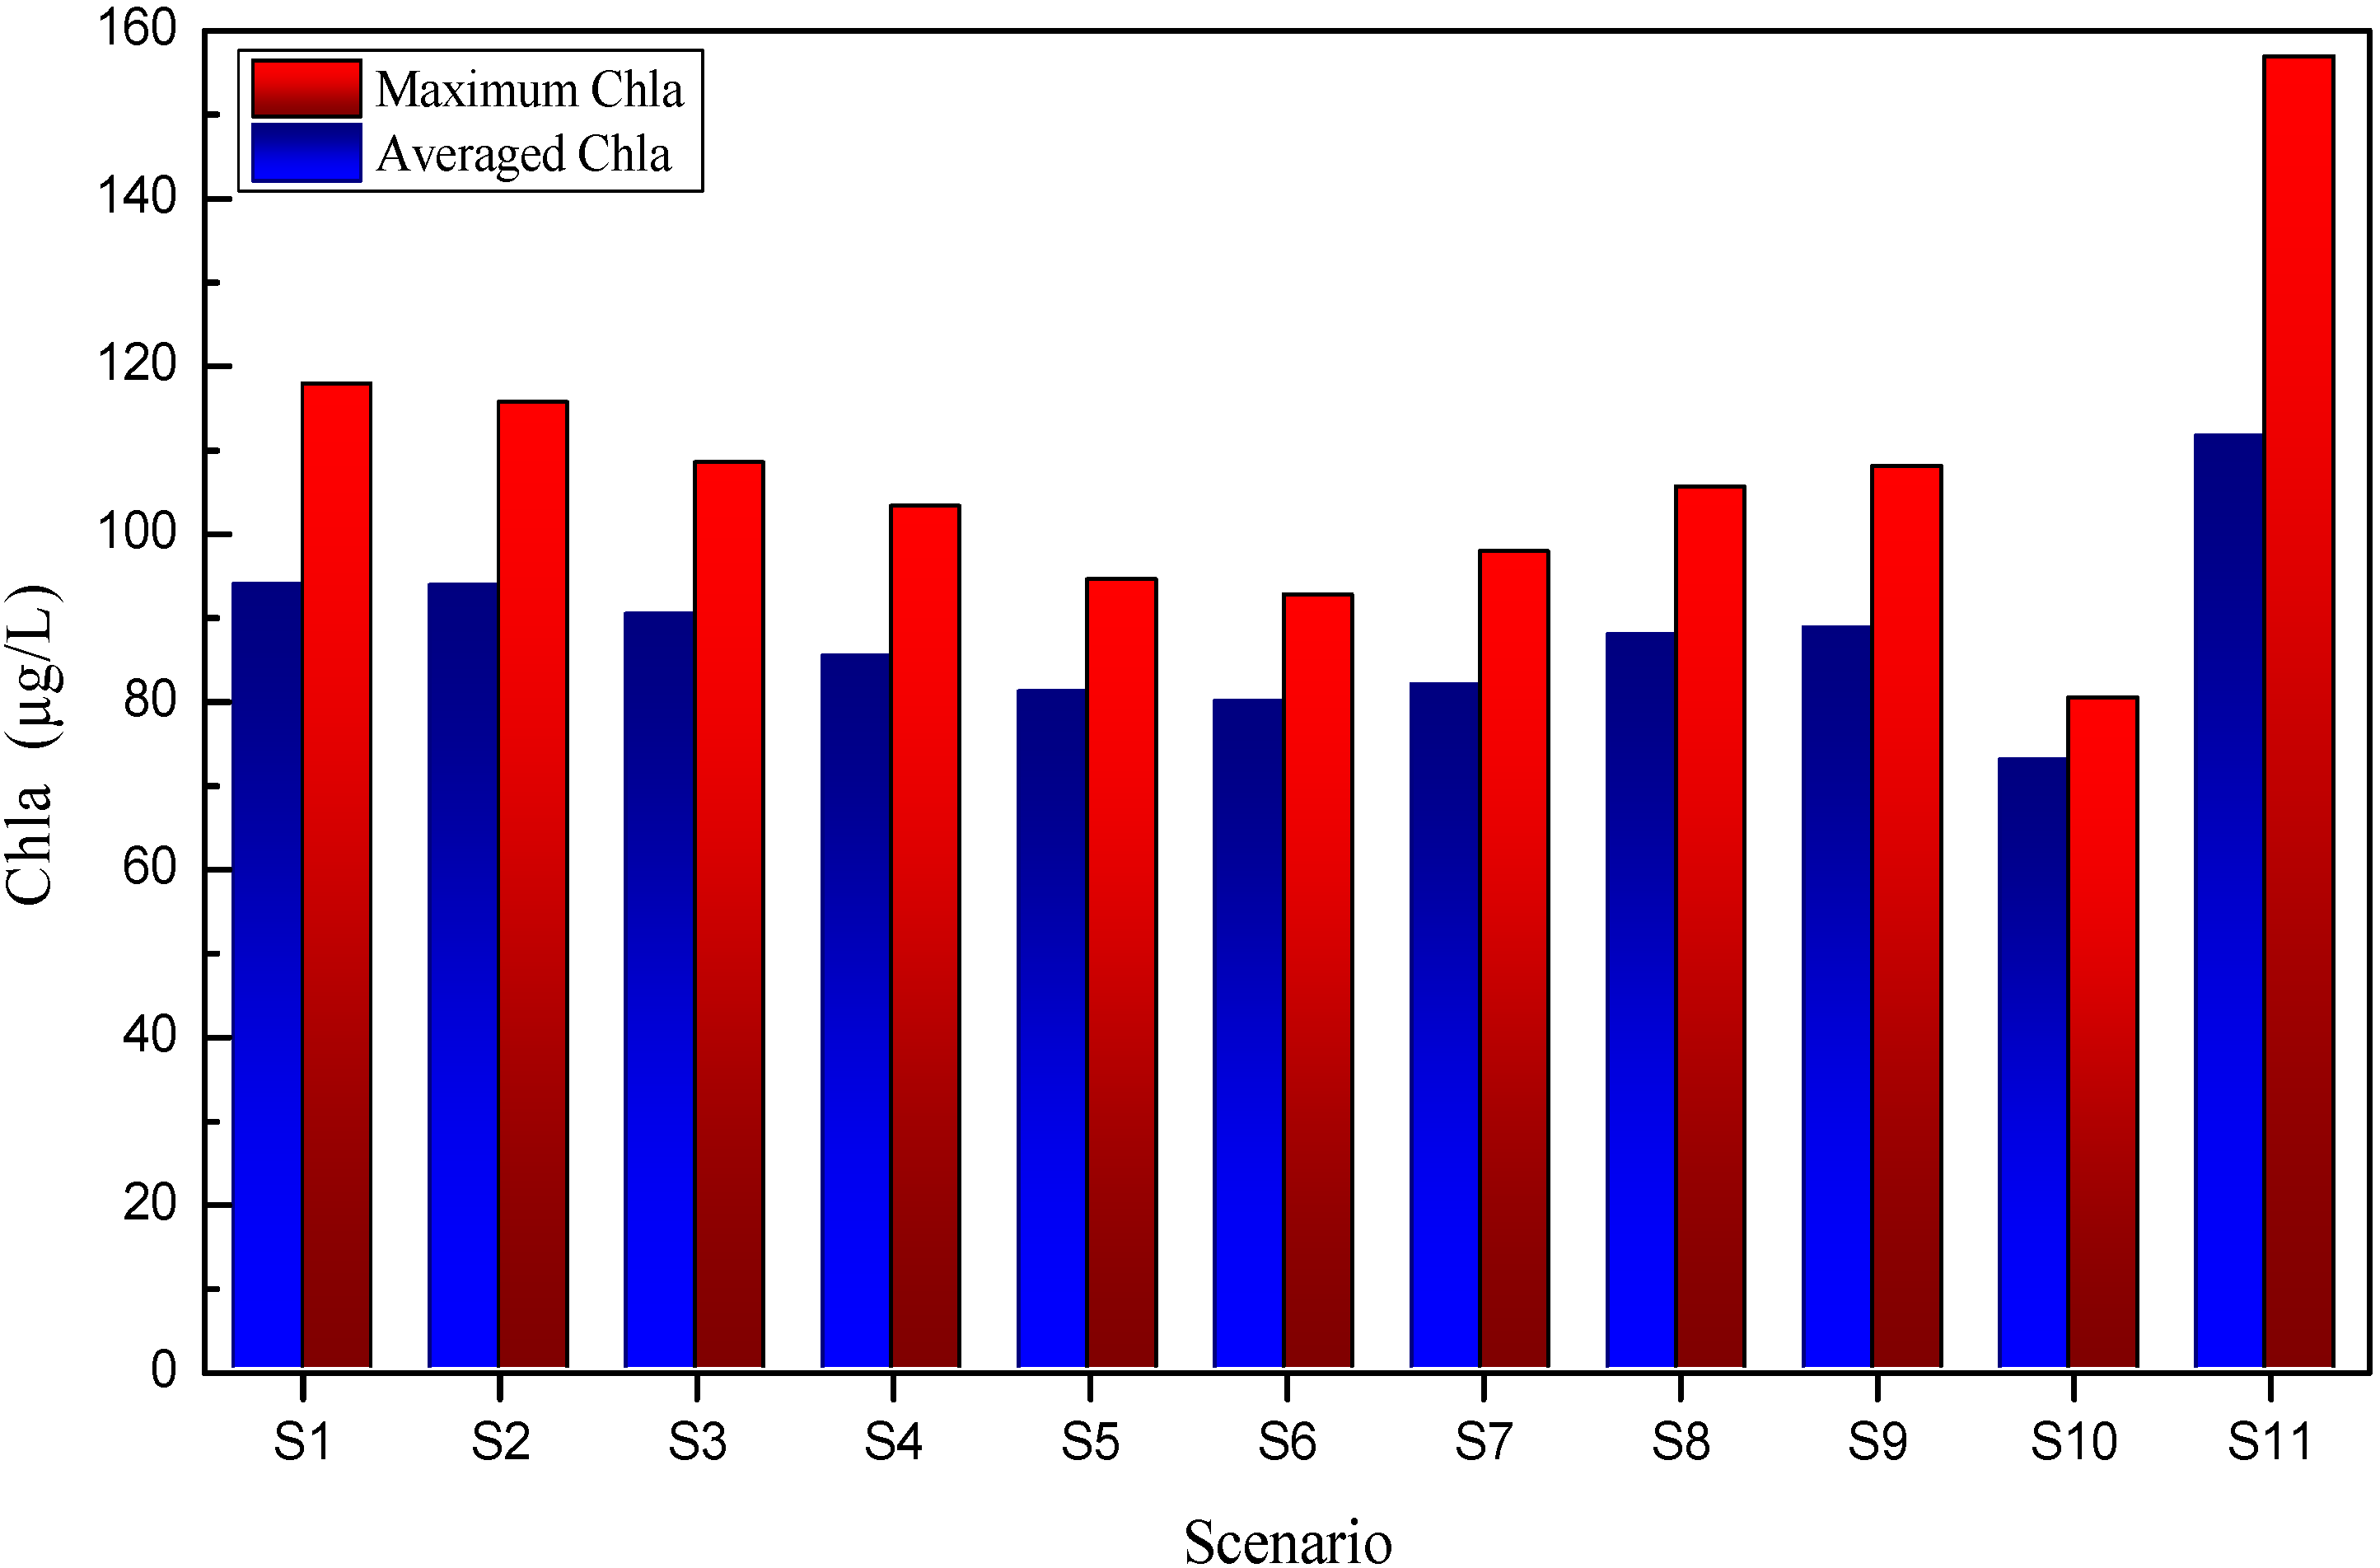
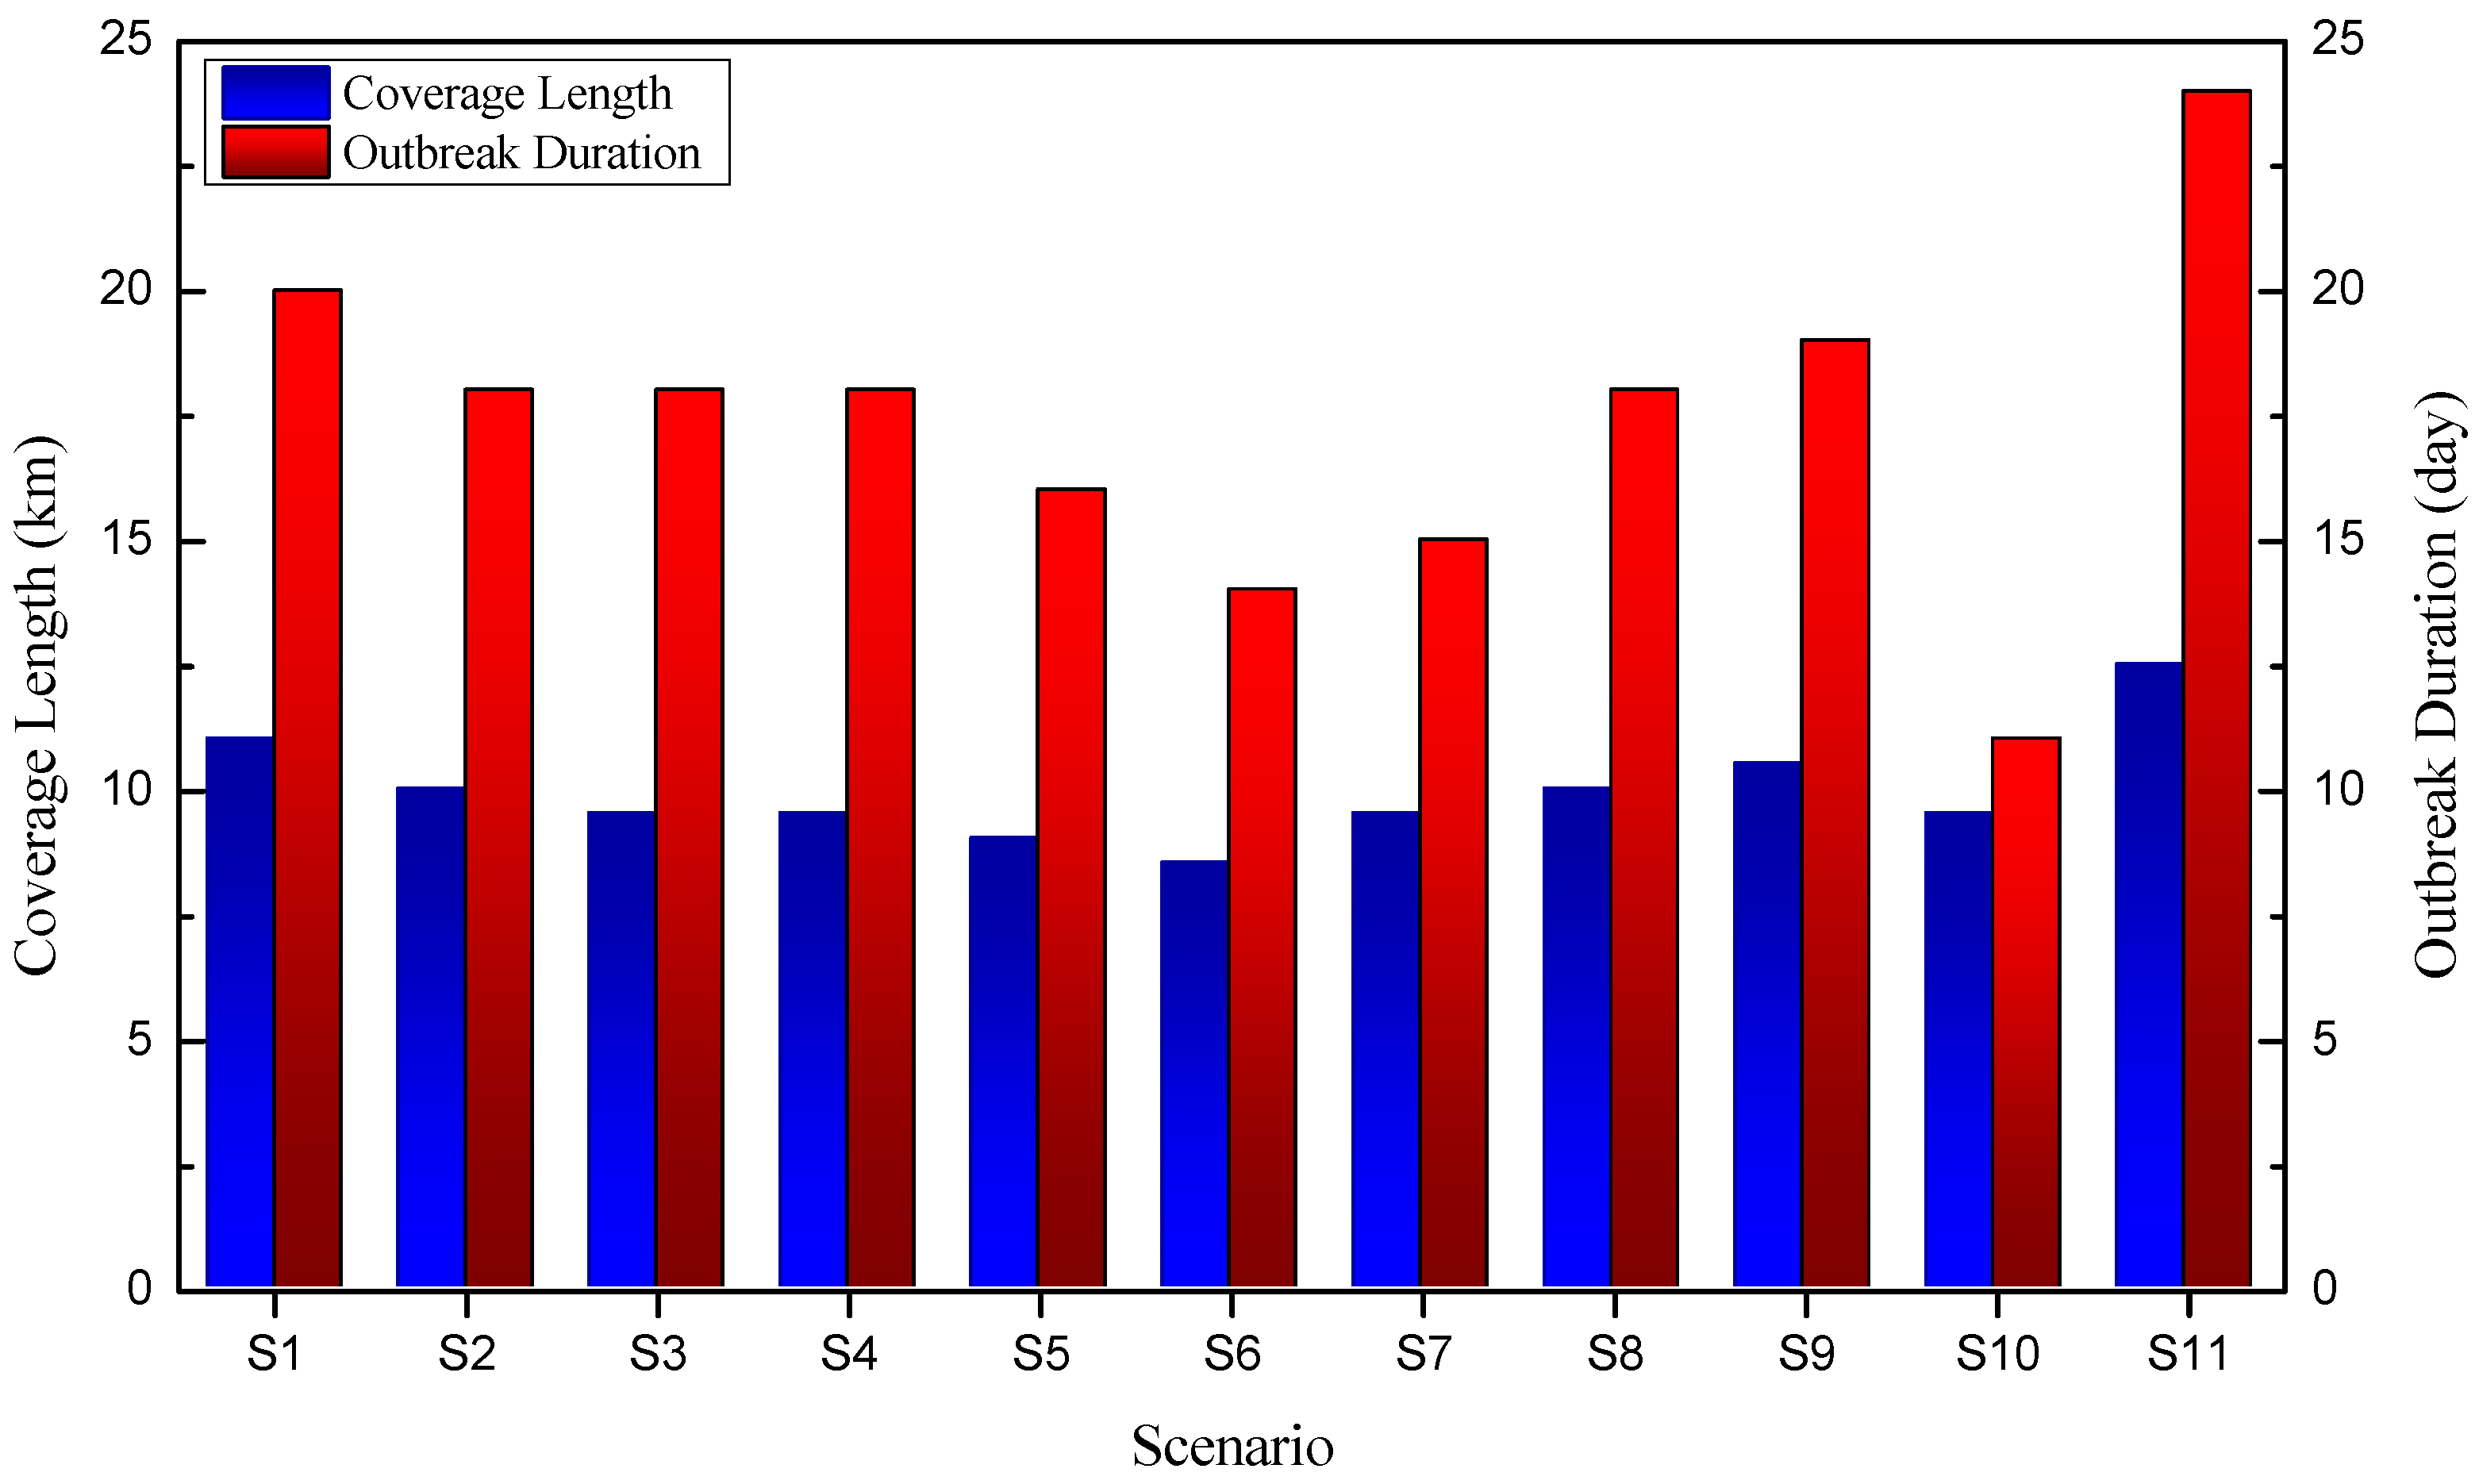
3.3. Results and Analysis

4. Conclusions
Acknowledgments
Author Contributions
Conflicts of Interest
References
- Dai, H.C.; Mao, J.Q.; Jiang, D.G.; Wang, L.L. Longitudinal hydrodynamic characteristics in reservoir tributary embayments and effects on algal blooms. PLoS One 2013, 8, 1–14. [Google Scholar]
- Yang, Z.J.; Liu, D.F.; Ji, D.B.; Xiao, S.B. Influence of the impounding process of the Three Gorges Reservoir up to water level 172.5 m on water eutrophication in the Xiangxi Bay. Sci. China Technol. Sci. 2010, 53, 358–369. [Google Scholar]
- Executive Office of State Council TGP Construction Committee, Yangtze Water Resources Commission. Annual Report of Eco-environmental Monitoring of TGP Reservoir; Executive Office of State Council TGP Construction Committee, Yangtze Water Resources Commission: Wuhan, China, 2004–2013. [Google Scholar]
- Wang, H.Y. Effects of the Three Gorges Reservoir on the water environment of the Xiangxi River with the proposal of countermeasures. Resour. Environ. Yangtze Basin 2005, 14, 233–237. (In Chinese) [Google Scholar]
- Qiu, G.S.; Hu, S.; Ye, D.; Yu, A.L.; Zang, X.P. Investigation on the present situation of eutrophication and water bloom in the branches of Three Gorges Reservoir. Resour. Environ. Yangtze Basin 2011, 20, 311–316. (In Chinese) [Google Scholar]
- Hans, W.P.; Rolland, S.F.; Pia, H.M.; Julianne, D. Harmful freshwater algal blooms, with an emphasis on cyanobacteria. ScientificWorld 2001, 1, 76–113. [Google Scholar]
- Donald, M.A.; Patricia, M.G.; Joann, M.B. Harmful algal blooms and eutrophication: Nutrient sources, composition, and consequences. Estuaries 2002, 25, 704–726. [Google Scholar] [CrossRef]
- Kevin, G.S.; Gregory, J.D.; Gary, J.K. Harmful algal blooms: Causes, impacts and detection. J. Ind. Microbiol. Biotechnol. 2003, 30, 384–406. [Google Scholar]
- Li, J.X.; Yu, X.Z.; Xing, Z.G. Eutrophication model for the branch of Three Gorges Reservoir. Adv. Water Sci. 2005, 16, 777–783. (In Chinese) [Google Scholar]
- Huang, C.; Zhong, C.H.; Deng, C.G.; Xing, Z.G.; Li, Y.J.; Wang, D.R.; Meng, W.L. Preliminary study on correlation between flow velocity and algae along Daning River’s backwater region at sluice initial stages in the Three Gorges Reservoir. J. Agro Environ. Sci. 2006, 25, 453–457. [Google Scholar]
- Huang, Y.L. Study on the Formation and Disappearance Mechanism of Algal Bloom in the Xiangxi River Bay at Three Gorges Reservoir. Ph.D. Thesis, College of Water Resources and Architectural Engineering, Northwest Agriculture & Forestry University, Xianyang, China, September 2007. [Google Scholar]
- Yang, Z.J.; Xu, Y.Y.; Ji, D.B.; Liu, D.F. On correlative factors influencing chlorophyll a in reservoir bay of Xiangxi river in spring. Yangtze River 2008, 39, 33–35. (In Chinese) [Google Scholar]
- Yi, Z.Q.; Liu, D.F.; Yang, Z.J.; Ma, J.; Ji, D.B. Water temperature structure and impact of which on the bloom in spring in Xiangxi Bay at Three Gorges Reservoir. J. Hydroecol. 2009, 2, 6–10. [Google Scholar]
- Wang, L.L.; Dai, H.C.; Cai, Q.H. Numerical predicting of velocity and Chla in Xiangxi River and correlativity research. J. Basic Sci. Eng. 2009, 17, 652–658. [Google Scholar]
- Zeng, H.; Song, L.R.; Yu, Z.G. Preliminary study on algal blooms within the Three Gorges Reservoir. Resour. Environ. Yangtze Basin 2007, 16, 336–339. (In Chinese) [Google Scholar]
- Holbach, A.; Wang, L.J.; Chen, H.; Hu, W.; Schleicher, N.; Zheng, B.H.; Norra, S. Water mass interaction in the confluence zone of the Daning River and the Yangtze River-a driving force for algal growth in the Three Gorges Reservoir. Environ. Sci. Pollut. Res. 2013, 20, 7027–7037. [Google Scholar] [CrossRef]
- Wu, T.F.; Qin, B.Q.; Zhu, G.W.; Luo, L.C.; Ding, Y.Q.; Bian, G.Y. Dynamics of cyanobacterial bloom formation during short-term hydrodynamic fluctuation in a large shallow, eutrophic, and wind-exposed Lake Taihu, China. Environ. Sci. Pollut. Res. 2013, 20, 8546–8556. [Google Scholar] [CrossRef]
- Ji, D.B.; Liu, D.F.; Yang, Z.J. Hydrodynamic characteristics of Xiangxi Bay in Three Gorges Reservoir. Sci. China 2010, 40, 101–112. [Google Scholar]
- Jiang, D.G.; Dai, H.C.; Liu, W. Influence of thermal density flow on hydrodynamics of Xiangxi Bay in Three Georges Reservoir, China. Procedia Environ. Sci. 2011, 10, 1637–1645. [Google Scholar] [CrossRef]
- Zheng, T.G.; Mao, J.Q.; Dai, H.C.; Liu, D.F. Impacts of water release operations on algal blooms in a tributary bay of Three Gorges Reservoir. Sci. China Technol. Sci. 2011, 54, 1588–1598. [Google Scholar] [CrossRef]
- Liu, L.; Liu, D.F.; Johnson, D.M.; Yi, Z.Q.; Huang, Y.L. Effects of vertical mixing on phytoplankton blooms in Xiangxi Bay of Three Gorges Reservoir: Implications for management. Water Res. 2012, 46, 2121–2130. [Google Scholar] [CrossRef] [PubMed]
- Cao, C.J.; Zheng, B.H.; Chen, Z.L.; Huang, M.S.; Zhang, J.L. Eutrophication and algal blooms in channel type reservoirs: A novel enclosure experiment by changing light intensity. J. Environ. Sci. China 2011, 23, 1660–1670. [Google Scholar] [CrossRef] [PubMed]
- Li, J.; Li, D.X.; Wang, X.K. Three-dimensional unstructured-mesh eutrophication model and its application to the Xiangxi River, China. J. Environ. Sci. China 2012, 24, 1569–1578. [Google Scholar] [CrossRef] [PubMed]
- Wang, L.P.; Zheng, B.H. Prediction of chlorophyll-a in the Daning River of Three Gorges Reservoir by principal component scores in multiple linear regression models. Water Sci. Technol. 2013, 67, 1150–1158. [Google Scholar] [CrossRef] [PubMed]
- Zhou, J.J. Discussion on Three Gorges Powerplant to modulate more net-peaks to improve water quality of tributaries of reservoir. Sci. Technol. Rev. 2005, 23, 8–11. (In Chinese) [Google Scholar]
- Zhou, J.J. Improvement of eco-environmental conditions of Three Gorges Reservoir by optimal operations. Perspective 2008, 26, 64–71. (In Chinese) [Google Scholar]
- Ma, C. Research on Multi-Scale and Multi-Objective Combined Optimal Dispatching of Cascaded Hydropower Junctions. Ph.D. Thesis, School of Civil Engineering, Tianjin University, Tianjin, China, June 2008. [Google Scholar]
- Ma, C.; Lian, J.J. Preliminary research on influence mechanism of human controlled dispatching solutions to hydrodynamics and water quality of tributaries of reservoir. J. Tianjin Univ. 2011, 44, 202–209. (In Chinese) [Google Scholar]
- Rajendra, G.K.; David, P.H.; Robert, L.P. Comparison of two 2-dimensional, laterally averaged hydrodynamic model applications to the Swan River Estuary. Math. Comput. Simul. 2000, 51, 627–638. [Google Scholar] [CrossRef]
- Bartholow, J.; Hanna, R.B.; Saito, L.; Lieberman, D.; Horn, M. Simulated limnological effects of the Shasta Lake temperature control device. Environ. Manag. 2001, 27, 609–626. [Google Scholar] [CrossRef]
- Sullivan, A.B.; Jager, H.I.; Myers, R. Modeling white sturgeon movement in a reservoir: The effect of water quality and sturgeon density. Ecol. Model. 2003, 167, 97–114. [Google Scholar] [CrossRef]
- Tim, K.; Robert, L.A.; Chris, B.; Scott, A.W. Green River CE-QUAL-W2 Project: A Hydrodynamic and Water Quality Study of the Green River King County, Washington; Technology Report; Portland State University: Portland, OR, USA, 2004. [Google Scholar]
- Gregory, E.N.; Andrea, B. Comparison of two stream temperature models and evaluation of potential management alternatives for the Speed River, Southern Ontario. J. Environ. Manag. 2009, 90, 866–878. [Google Scholar] [CrossRef]
- Afshar, A.; Kazemi, H.; Saadatpour, M. Particle swarm optimization for automatic calibration of large scale water quality model (CE-QUAL-W2): Application to Karkheh Reservoir, Iran. Water Resour. Manag. 2010, 25, 2613–2632. [Google Scholar] [CrossRef]
- Cole, T.M.; Wells, S.A. CE-QUAL-W2: A Two-Dimensional, Laterally Averaged, Hydrodynamic and Water Quality Model, Version 3.6; User Manual; Instruction Report EL-08-1; U.S. Army Corps of Engineers Waterways Experiment Station: Vicksburg, MS, Washington, DC, USA, 2008. [Google Scholar]
- Lian, J.J.; Yao, Y.; Ma, C. Emergency regulation strategy for sudden algal bloom accidents of Xiangxi River in Spring. J. Tianjin Univ. Sci. Technol. 2013, 4, 291–297. (In Chinese) [Google Scholar]
- Wang, L.L.; Dai, H.C.; Cai, Q.H. Simulation of eutrophication in branch of channel-type reservoirs. J. Sichuan Univ. 2009, 41, 18–23. [Google Scholar]
- Okubo, A. Oceanic diffusion diagrams. Deep Sea Res. 1971, 18, 789. [Google Scholar]
- Moriasi, D.N.; Arnold, J.G.; van Liew, M.W.; Bingner, R.L.; Harmel, R.D.; Veith, T.L. Model evaluation guidelines for systematic quantification of accuracy in watershed simulations. Am. Soc. Agric. Biol. Eng. 2007, 50, 885–900. [Google Scholar]
- Ma, C.; Lian, J.J.; Wang, J.N. Short-term optimal operation of Three Gorges and Gezhouba cascade hydropower stations in non-flood season with operation rules from data mining. Energy Convers. Manag. 2013, 65, 616–627. [Google Scholar] [CrossRef]
- Labaugh, J.W. Relation of algal biovolume to chl a in selected lakes and wetlands in north-central United States. Can. J. Fishe. Aquat. Sci. 1995, 52, 41–424. [Google Scholar]
- Cao, Q.L. Study on the Motion Characteristics of Reverse Density Currents in Xiangxi Bay of the Three-Gorge Reservoir. Master’s Thesis, College of Civil and Hydroelectric Engineering, China Three Gorges University, Yichang, China, May 2010. [Google Scholar]
- Zhang, Y.; Liu, D.F.; Ji, D.B.; Yang, Z.J.; Yang, Z.J. Effects of intrusions from Three Gorges Reservoir on nutrient supply to Xiangxi Bay. Environ. Sci. 2012, 33, 2621–2627. (In Chinese) [Google Scholar]
- Xu, Y.Y.; Cai, Q.H.; Han, X.Q.; Shao, M.L.; Liu, R.Q. Factors regulating trophic status in a large subtropical reservoir, China. Environ. Monit. Assess. 2010, 169, 237–248. [Google Scholar] [CrossRef] [PubMed]
- Zheng, B.H.; Zhang, Y.; Fu, G.; Liu, H.L. On the assessment standards for nutrition status in the Three Gorge Reservoir. Acta Sci. Circumstantiae 2006, 26, 1022–1030. (In Chinese) [Google Scholar]
© 2014 by the authors; licensee MDPI, Basel, Switzerland. This article is an open access article distributed under the terms and conditions of the Creative Commons Attribution license (http://creativecommons.org/licenses/by/4.0/).
Share and Cite
Lian, J.; Yao, Y.; Ma, C.; Guo, Q. Reservoir Operation Rules for Controlling Algal Blooms in a Tributary to the Impoundment of Three Gorges Dam. Water 2014, 6, 3200-3223. https://doi.org/10.3390/w6103200
Lian J, Yao Y, Ma C, Guo Q. Reservoir Operation Rules for Controlling Algal Blooms in a Tributary to the Impoundment of Three Gorges Dam. Water. 2014; 6(10):3200-3223. https://doi.org/10.3390/w6103200
Chicago/Turabian StyleLian, Jijian, Ye Yao, Chao Ma, and Qizhong Guo. 2014. "Reservoir Operation Rules for Controlling Algal Blooms in a Tributary to the Impoundment of Three Gorges Dam" Water 6, no. 10: 3200-3223. https://doi.org/10.3390/w6103200