Article

Pump as Turbine (PAT) Design in Water Distribution Network by System Effectiveness †

by
Armando Carravetta
1,
Giuseppe Del Giudice
1,
Oreste Fecarotta
1,* and
Helena M. Ramos
2
1
Department of Civil, Construction and Environmental Engineering, Universit'a di Napoli Federico II, via Claudio, 21, Napoli 80125, Italy
2
Department of Civil Engineering, Instituto Superior Técnico, Technical University of Lisbon, Avenida Rovisco Pais, 1, Lisboa 1049-01, Portugal
*
Author to whom correspondence should be addressed.
The work was supported by the funds of the research project MIUR PRIN 2010-2011 Energia idroelettrica da osmosi in ambiente costiero – Hydrocar (CUP E61J12000210001)
Water 2013, 5(3), 1211-1225; https://doi.org/10.3390/w5031211
Submission received: 31 May 2013 / Revised: 5 August 2013 / Accepted: 5 August 2013 / Published: 12 August 2013

Abstract

:
Water distribution networks face several problems related to leakages, where the pressure control strategy is a common practice for water loss management. Small-scale hydropower schemes, where pumps as turbines replace pressure reducing valves, can be considered an interesting technical solution, which ensures both economic convenience and system flexibility. Due to the water networks’ variable operating conditions, a new methodology to model the effectiveness of pumps as turbines was developed based on the efficiency and the mechanical reliability of the hydropower device and the flexibility of the plant. System effectiveness is proposed as the objective function in the optimization procedure and applied to a real system, enabling one to emphasize that the hydraulic regulation mode of the plant is better than the electric regulation mode for American Petroleum Industry (API) manufacturing standards of pumps.

1. Introduction

Among the different sources of hydropower, small-scale hydroelectric power systems can be considered very interesting [1,2], but in order to make them economically feasible, they require low cost hydraulic and electric equipment. The strategy of pressure containment for leakage reduction is a common practice management of water distribution networks, because water loss increases with pressure values [3,4,5]. The first strategy for pressure containment is the reduction of pipe diameters, which also leads to a cost reduction [6,7,8]. When high pressure variability occurs within a water distribution network, pressure reducing valves (PRV) can be inserted for lowering water pressure to target levels [9,10,11,12]. Different numerical methods have been proposed for PRV placement design according to valve possible regulations [13]. Water demand satisfaction is the main design constraint of the model proposed by Araujo et al [4]. In 2006 [4], such a constraint was obtained in a two-step procedure, by determining, firstly, the best PRV location, then the best time distribution of PRV opening. An entropy-based method was used by Liberatore and Sechi in 2009 [14] for the solution of an optimization processes for PRV placement based on the target pressure values at nodes with fixed PRV backpressure values. PRVs can be considered the cheapest and a simpler solution to reduce pressure, but in the framework of a virtuous energy strategy, any PRV regulation should be converted in order to produce energy [15,16,17]. Traditional turbines can be considered a solution in order to control pressure and produce energy with high efficiencies, but the limited power available in a water distribution network, together with the high cost of a miniaturized turbine, could excessively extend the payback period of the machine [18]. Among the different alternatives of special turbines that have been suggested to face small and variable power [19,20,21] pumps as turbines (PATs) can be considered a compromise, having lower efficiencies and lower costs, and presumably, their use can be a worthy choice [22,23,24,25].
The difficulty of energy recovery in water networks consists in the variability of the available power, which is dependent on the user demand pattern. Operating conditions with large variability are a widely diffused issue among different production systems of renewable energy, with different problems and solutions depending on the source, such as waves, tides and wind [26,27,28,29,30,31,32]. In the field of water distribution networks, a specific design procedure, named the Variable Operating Strategy (VOS), for variability in time conditions of both flow discharge and pressure drop, was recently developed for power plants using a PAT as a production device [33,34,35]. Two PAT regulation modes were considered in VOS, hydraulic or electrical regulation, to obtain an optimal flow/pressure modulation in the power plant, i.e., a suitable equivalence between PRV and PAT for pressure control management. The geometrical parameters of the PAT to be used in substitution of the PRV, plant efficiency and daily energy production are the main results of VOS application. Due to variable working conditions (e.g., flow and pressure), the electromechanical device could operate even far from the best efficiency point (BEP), thus resulting in a decrease of system reliability. Moreover, effective working condition could be slightly different from the design values, often based on network simulations. At the moment, there is no study in the literature on the effect of these factors on the lifecycle costs of a pump used as a turbine, and this aspect could prevent a large diffusion of PATs. To obtain an estimate of PAT maintenance costs, a methodology for the computation of PAT effectiveness was developed accounting for three different factors:
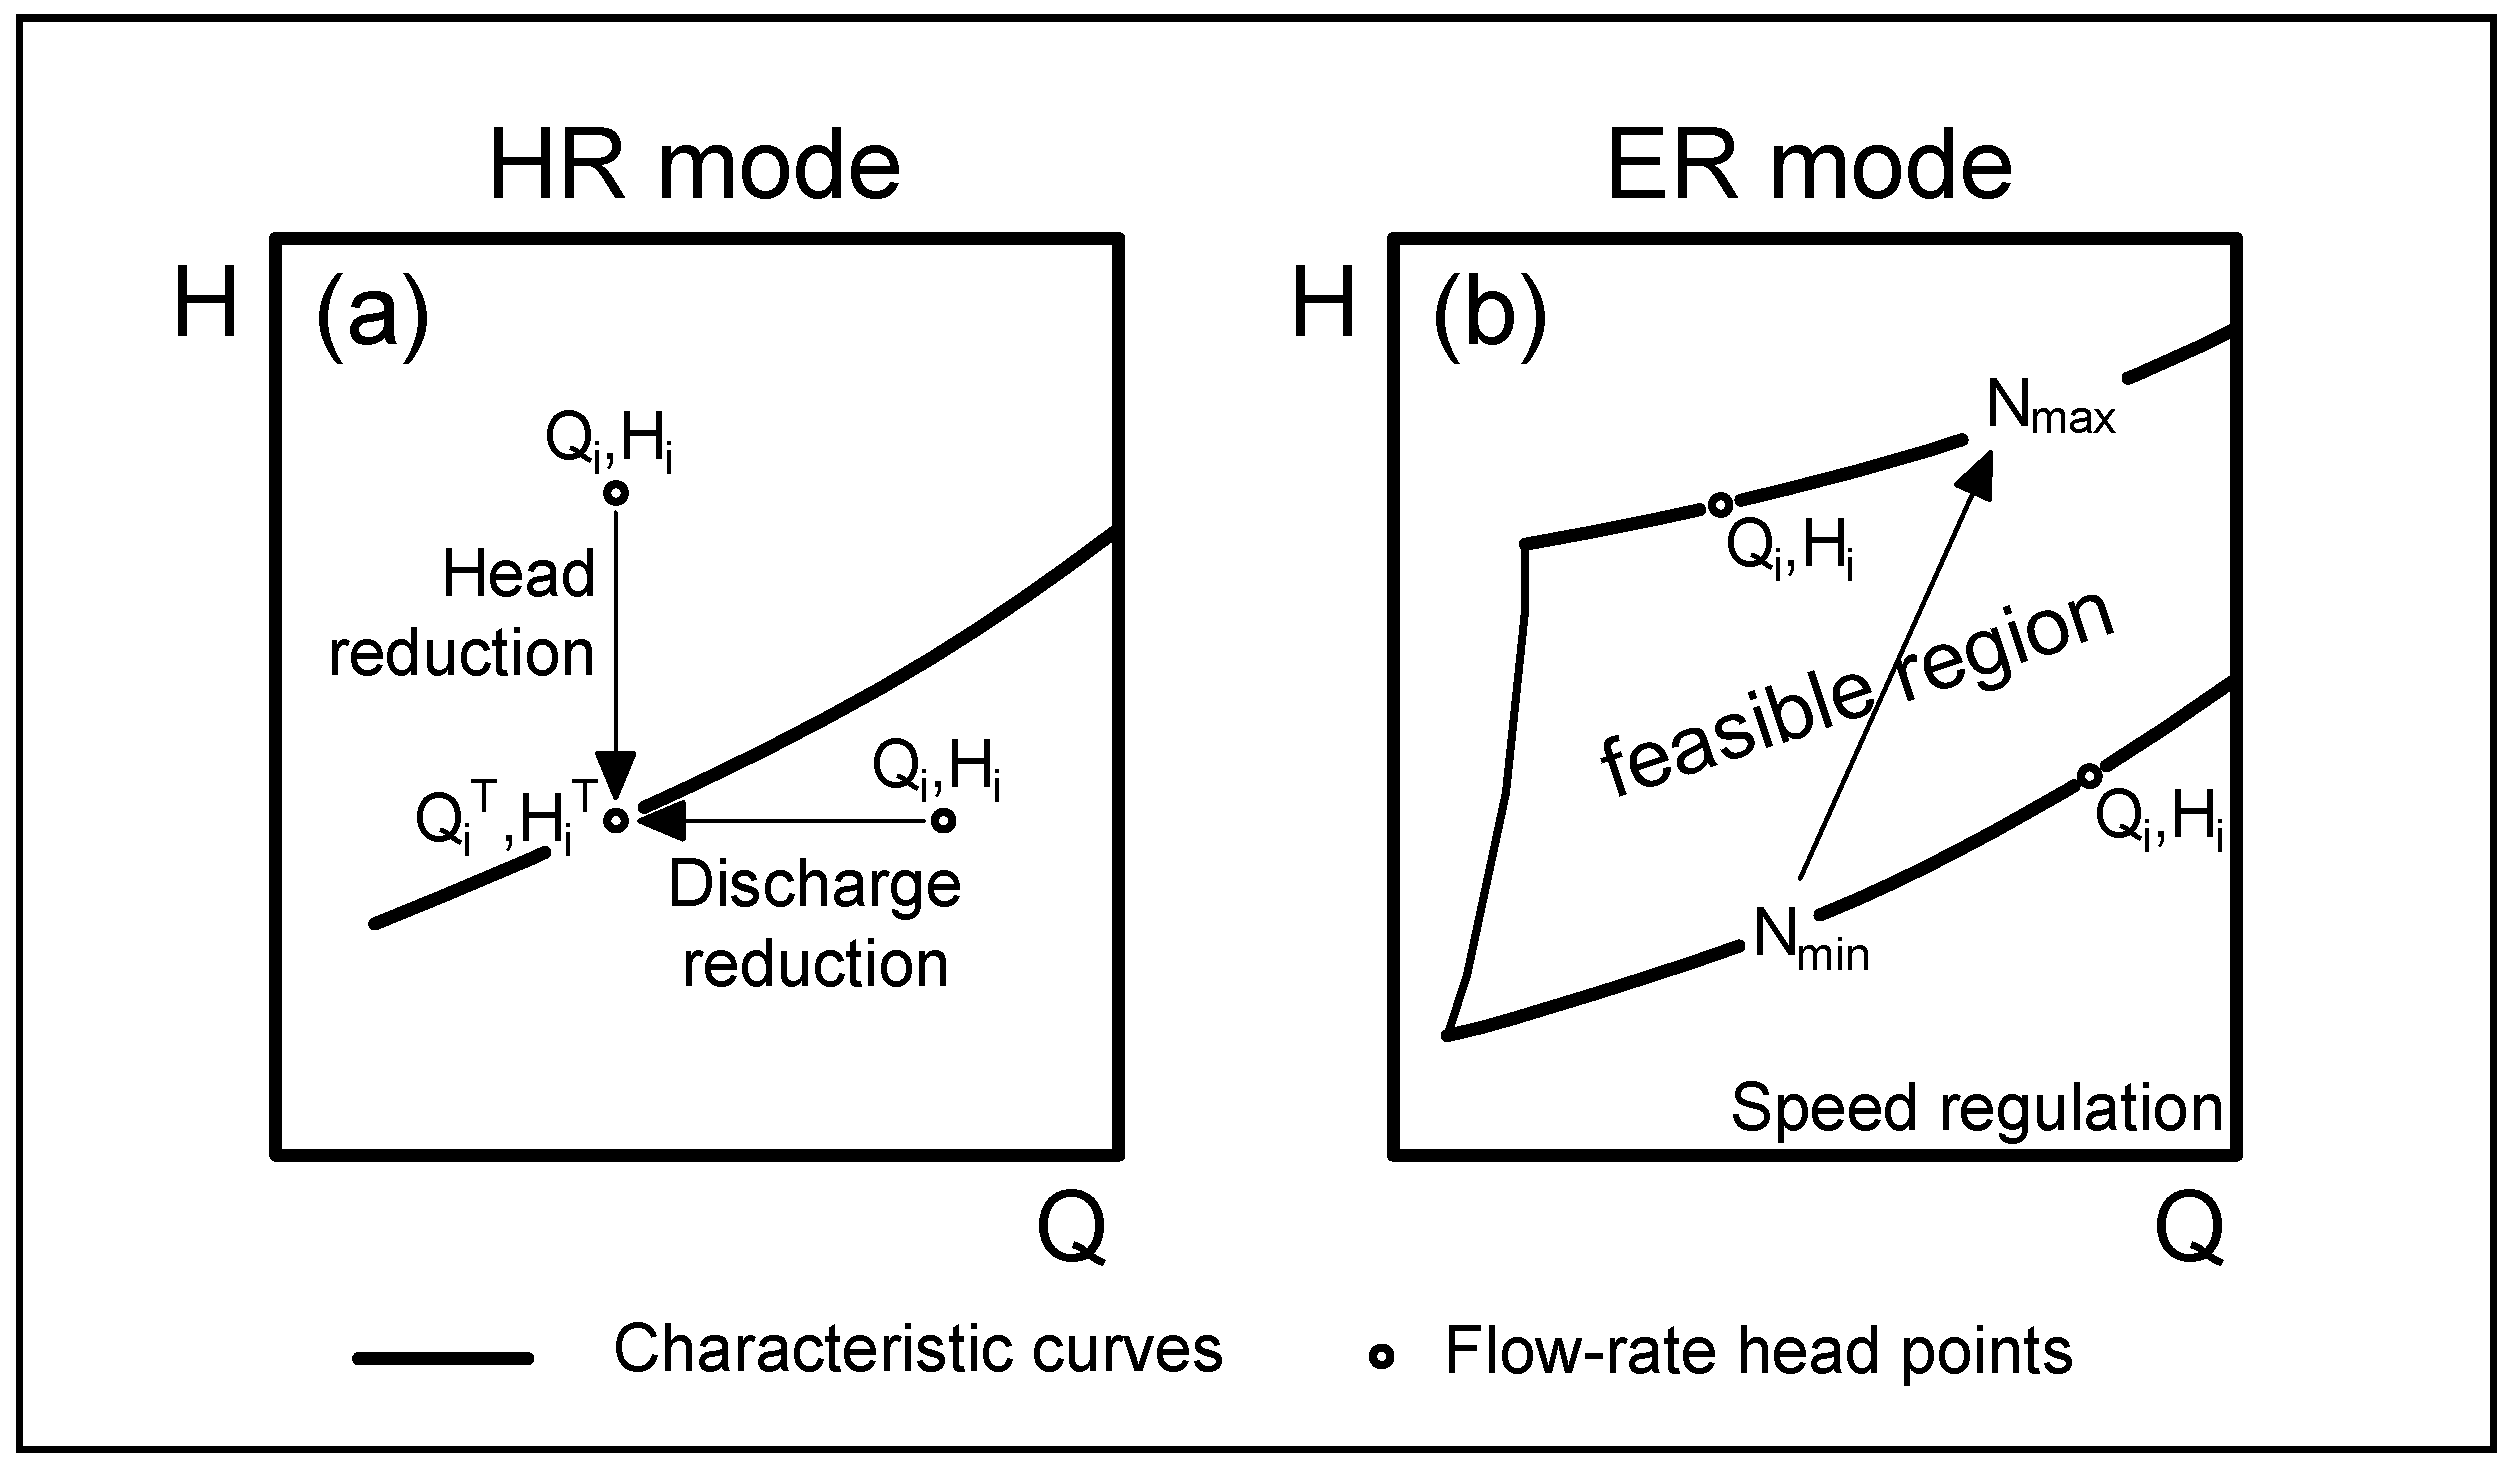
  • The capability of the PAT performance in hydraulic or electrical regulation;
  • The flexibility of the PAT under working conditions slightly different from the design values;
  • The reliability of the PAT based on the lifecycle of its components.
The introduction of the overall mechanical effectiveness increases VOS potentiality. Due to the lack of experimental data in the field of PATs, their behavior is modeled herein by one-dimensional methods: the performances curves of the PATs with different diameters and rotational speeds are calculated by the affinity law of turbomachinery and the Suter [36] parameters, and the methodology is deeply described by Carravetta et al. 2012 [33]. The lacks of this approach have been highlighted by several authors [37,38], but whereas extensive experimental data about PAT performances will be available, the procedure can be improved in order to obtain more precise results. Similarly, PAT reliability depends on several factors, i.e., the operating conditions, the manufacturing standards, the installation, the typology of water, etc. Unfortunately, due to the rarity of PAT installation, there is not a database of failures, and any statistical approach would be very difficult. In this paper, the authors refers to the Barringer reliability model [39,40], which only considers the hydraulic conditions and the manufacturing standards.

2. PAT Design Skills

A proper approach for the management of water distribution networks is the achievement of minimum standards of service. User satisfaction in terms of water quantity and quality requirements, as well as an active leakage control for reducing water loss, are among the primary management concerns, including cost savings. In absence of a direct action for physical leak reduction, namely, pipe replacement or rehabilitation, an appreciable reduction of water leakage can be obtained by means of an effective control of the head patterns in water distribution networks. The use of pressure control in systems is limited by the cost of the required valves.
In some cases, this strategy gives better results when used in combination with the division of the water distribution network into district meter areas [41], where a smaller number of valves occurs for pressure management. Unfortunately, this result is obtained with a reduction of system flexibility in the case of pipe failure. A new opportunity for pressure control can be given by the introduction of PAT in place of PRV. In this case, the costs of the electromechanical equipment are balanced in a small payback period by the income for energy production [34]. Additionally, system flexibility can be enhanced, because, in the case of pipe failure, the PAT working conditions can be changed. When the dissipation point locations are assigned within a water distribution network, flow rate (Q) and pressure head ( H u ) daily patterns are hydropower plant design constraints, together with the backpressure ( H d ) value, namely, the pressure head value downstream of the hydropower plant. The H d value is determined as the optimal pressure head value for the network management in order to ensure both water demand and water loss reduction. The difference between the H u pattern and H d constitutes the net-head ( H = H u - H d ) daily pattern. The values of H u and Q measured in an existing Italian PRV station located in Pompei (Campania), together with the daily pattern of Q, H and the available power, P, are plotted in Figure 1, with reference to a fixed H d = 30 m.
The proposed design procedure involves the evaluation of the best performing PAT geometry, given the characteristic and efficiency curve of a single pump type working in inverse mode. PAT selection can be obtained with different power plant regulation systems, in particular, either with a hydraulic (HR) or an electric regulation (ER). In HR mode, the pump is connected in a series parallel hydraulic circuit, composed of two branches; the first branch is a dissipation/production branch, where the PAT and a PRV are placed in series; the second branch is a bypass regulated by another PRV. In ER mode, the PAT is connected to an inverter, ensuring variable rotational speed to the pump shaft [33,34].
Figure 1. (a) Measured pressure head ( H u ) and flow rate (Q) values; and (b) daily patterns of net-head (H), flow rate (Q) and available power (P) with a given backpressure value ( H d = 30 m).
Water 05 01211 g001
In Figure 2, working conditions in ER and HR modes are plotted. In HR mode, for a net-head, H i , higher than the head-drop deliverable by the machine, H i T (pointing to the left of the PAT characteristic curve in Figure 2), the valve in series dissipates the excess pressure. Instead, when the discharge, Q i , is larger (pointing to the right of the PAT characteristic curve in Figure 2), the PAT would produce a head-drop higher than the available net-head: in this case, the bypass valve is opened to reduce the discharge flowing in the PAT from Q i to Q i T . Thus, for each working condition, the electric power is different from the maximum available hydraulic power, because of flow rate/head reduction in the series parallel circuit. Conversely, in ER mode, the operating speed (N ) of the generator is changed to match the load conditions determined by the instant flow discharge and head drop values; namely, the PAT characteristic curve is modified to match the available head. HR allows it to operate in all working conditions, due to the bypass regulation system. Conversely, ER does not ensure such a regulation, and therefore, PAT selection depends on the wideness of its feasible region to cover all the working condition points (PAT feasible region of Figure 2).
Each point of the characteristic curve, both in HR and ER mode, is related to a different value of machine efficiency ( η i ). The performances curves of the machine depend on its geometrical characteristics. Thus, for a given machine, which can be identified by the pump type (centrifugal, semi-axial, ...) and the diameter, D, of the impeller, a different power would be produced, depending on the pattern of hydraulic conditions and on the regulation mode (hydraulic or electric). The Variable Operating Strategy (VOS) allows one to identify the type and the diameter, D, of the PAT, which maximizes the energy production for a given hydraulic demand pattern, either in HR or in ER mode. The choice between HR and ER modes is not simple and case-dependent, and the final design decision cannot disregard an economic evaluation of capital costs and payback period. A deep economical analysis was performed by Carravetta et al. in 2012 [34] for the data set of Figure 1a, and the payback period of the electro-mechanical components in HR mode were shorter than in ER mode. The comparison referred to a centrifugal, single stage pump, having specified a speed of N s T = 44 . 0 (rpm, kW). Anyway, it is not a general result, and the manager choice can vary, depending on the hydraulic conditions. In this paper, ER and HR will be compared also in terms of flexibility and mechanical reliability.
Figure 2. Pump as turbine (PAT) operating conditions in (a) hydraulic; or (b) electrical regulation.
Water 05 01211 g002

3. System Effectiveness

In the framework of a more complete method for PAT selection, including not only the electro-mechanical efficiency, but also reliability, the effectiveness equation can be taken into account [42,43,44]. In 1991, Clements [45] describes effectiveness as telling how well the product/process satisfies end user demands. System effectiveness, ranging between zero and one, accounts for the influence of the different performance criteria of the system. The effectiveness equation can be written as follows:
E = A 1 · · A i · · A n = i = 1 n A i
where A 1 , . . . , A i , . . . , A n are the n performance indicators of the system influencing its overall effectiveness. For PAT design, three indicators have been considered in evaluating E ( n = 3 ): capability ( η p ), flexibility ( ϕ p ), reliability ( μ p ). They represent, respectively, how the system:
  • performs its intended production activity according to expectation;
  • performs for a H d variation around the design value;
  • operates for a given time without failure.
Thus, Equation (1) specifies:
E = A 1 · A 2 · A 3 = η p · ϕ p · μ p

3.1. System Capability

The capability is a direct result of VOS, since it can be defined as the ratio between produced electrical energy and hydraulically available energy for a given demand pattern. It can be differently calculated for HR mode or ER mode. In HR mode [33]:
η p = i = 1 n H i T Q i T η i T Δ t i i = 1 n H i Q i Δ t i with Q i T Q i and H i T H i
while in ER mode [34]:
η p = i = 1 n H i Q i η i ( N ) Δ t i i = 1 n H i Q i Δ t i
Δ t i being the time interval with constant hydraulic characteristics ( Q i , H i ).
It is interesting to stress that, in ER mode, the system capability corresponds to the average machine efficiency. In ER mode, the efficiency of the machines with a feasible region that does not include all the operating points is considered equal to zero.
Some previous studies [33,34] showed that the capability of a hydropower system with hydraulic regulation is higher than the capability of an electric regulated system, with maximum values of about 0 . 6 for HR and 0 . 55 for ER. Obviously, such values are strongly case-sensitive, because they depend on the variability of the hydraulic conditions.
In Figure 3, the calculated capabilities, η p , of both ER and HR modes are plotted versus the diameter, D, of the machine and the backpressure, H d . In HR mode, capability values larger than 0 . 4 are obtained in a wide range and for the smaller diameter values; this means that PAT of different diameters can be used with high capability. Conversely, in ER mode, such values are attained in a smaller area of the plot. Furthermore, it is important to observe that, in HR mode, the range of feasible backpressure values is wider than in ER mode.
Figure 3. η p values resulting from the Variable Operating Strategy (VOS): (a) HR mode; and (b) ER mode.
Water 05 01211 g003

3.2. System Flexibility

Network conditions in the power plant node, in terms of flow rates and pressures, cannot be always assumed as true values. During operations, real H d values can be different from the design ones. Other times, flow rate and H d may vary in time for changes in the water demand pattern. Even in the presence of measured design parameters, the introduction of a PRV or of a PAT may induce a substantial change in the water distribution network working conditions. In all these cases, PAT efficiency will vary during the power plant life, and system productivity could be lower than expected [34]. System flexibility ( ϕ p ) gives an estimate of the power plant capability. Considering a 10 % of H d , system flexibility will be defined as the minimum of the ratio between plant efficiency at 10 % H d , namely, η p 10 % and design plant efficiency:
ϕ p = m i n η p + 10 % η p , η p - 10 % η p
System flexibility is, therefore, an important design parameter: the closer ϕ p is to one, the less the global efficiency will vary around the design efficiency in the presence of unexpected H d variations.
In Figure 4, the calculated capabilities, ϕ p , of both ER and HR modes are plotted versus the diameter, D, of the machine and the backpressure, H d . As a consequence of the capability plots of Figure 3, the system flexibility plot is very flat in the HR mode, but not in the ER mode, where larger gradients are observed.
Figure 4. ϕ p values resulting from VOS: (a) HR mode; and (b) ER mode.
Water 05 01211 g004

3.3. System Reliability

Reliability is the probability that a component, system or process will work without failure for a specified length of time when operated correctly under specified conditions [46]. Failure of an engineering system happens when the load, L (external forces or demand), exceeds the resistance, r, of the system for a specified duration, Δ t . Thus, the reliability, R, of the system can be defined as the probability, p, that, during Δ t , the load does not exceed the resistance:
R = p ( L < r ) | Δ t
Alternatively, if the load, L, can be considered constant for specified conditions during Δ t , reliability can be defined as the probability that the time to failure, T T F , is smaller than Δ t :
R ( t ) = p ( T T F > Δ t ) | L
The reliability of an engineering system is often represented by an exponential probability distribution [47]:
R ( t ) = e - λ t
where λ is the failure rate, equal to 1 / M T T F , namely, the mean time to failure [48].
Barringer [39,40] showed how the flow rate has a marked impact on pump reliability. When a pump is operating away from its BEP, its reliability is lower than at BEP. Because M T T F is a simple precursor of reliability, the latter is estimated by deriving a M T T F curve showing it as a function of dimensionless flow discharge, M T T F ( Q / Q B ) , where Q B is the flow rate at BEP. M T T F at a flow discharge away from the BEP is a fraction of the M T T F at BEP, M T T F B .
μ = M T T F ( Q / Q B ) M T T F B
Pump reliability and, consequently, μ values, depend on the quality standard of pump components. In Table 1, μ values for three industrial standards and for six different values of flow discharge around the BEP, respectively, - 10 % and + 5 % of BEP, - 20 % and + 10 % of BEP and - 30 % and + 15 % of BEP, are reported, based on the maintenance data of Barringer [39,40]. Barringer values are based on single pump component (impeller, housing, pump bearings, seals, shafts, coupling, motor bearings, motor windings, motor rotor and motor starter) reliability and are expected to be the same in inverse use of the pump as a PAT. In Figure 5, the μ ( Q / Q B ) curve is plotted together with the dimensionless characteristic curves of a pump in direct and inverse mode, h ( Q / Q B ) , h being equal to the ratio between the head drop at a given discharge and the head drop at BEP, ( h = H T / H B T ) .
The authors propose herein a procedure in order to evaluate the reliability of the PAT in variable operating conditions, based on the pump reliability data of Table 1: let us consider a cycle of operations whose period is T and with constant conditions for each Δ t i time interval, as shown in Figure 6.
Table 1. μ values for different manufacturing standards at different flow rates.
Q / Q B American NationalEnhanced ANSIAmerican Petroleum
Standards Institute (ANSI)Industry (API)
0 . 7 0.700.730.75
0 . 8 0.880.890.90
0 . 9 0.970.970.98
1 . 05 0.970.970.98
1 . 10 0.880.890.90
1 . 15 0.700.730.75
Figure 5. Plot of μ ( Q / Q B ) and h ( Q / Q B ) .
Water 05 01211 g005
Figure 6. Load L variation during the period, T.
Water 05 01211 g006
The reliability or the probability that the machine works without failure for the whole period, T, R ( T ) , equals the probability that the machine does not fail in any of the Δ t i intervals:
R ( T ) = p ( T T F 1 Δ t 1 ) | L 1 p ( T T F i Δ t i ) | L i p ( T T F n Δ t n ) | L n
If the reliability is time-independent, i.e., the effect of the aging of the machine is neglected or is the same, a correct maintenance program is carried out; Equation (10) equals to:
R ( T ) = R ( Δ t 1 ) | L 1 · · R ( Δ t i ) | L i · · R ( Δ t n ) | L n = i = 1 n R ( Δ t i ) | L i
If Equation (8) is considered in order to express the reliability, then:
R ( T ) = i = 1 n R ( Δ t i ) | L i = i = 1 n e - λ i Δ t i = e - Σ i = 1 n λ i Δ t i
Being:
λ a v = i = 1 n λ i Δ t i T
Yields:
R ( T ) = e - λ a v T
Such an equation shows that the reliability of the machine in variable conditions is still described by an exponential distribution, with an average failure rate equal to λ a v . Thus, the average mean time to failure, M T T F a v , can be calculated as 1 / λ a v . In 1994, Carderock Division [49] showed the dependency of failure rate on load, namely λ = λ ( L ) . In the case of a PAT, the average failure rate can be derived from Equation (13) and a polynomial curve, λ = λ ( Q / Q B ) , fitted to the values of Table 1, given the manufacturing standards. Thus, for an assigned pattern of flow characteristics, VOS application allows one to calculate:
M T T F a v = 1 λ a v
Finally, the third term of E can be calculated:
μ p = M T T F a v M T T F B
where μ p is a measure of the reliability reduction, due to the life-cycle.
Reliability plots of Figure 7 show that the reliability of HR mode is higher for the smaller diameter values, while in ER mode, high values can be attained only in a small region.
Figure 8 shows the contour plots of effectiveness, E, both for the HR and ER modes. The effectiveness of the HR mode is higher, and its feasible region is wider than ER mode.
Figure 7. μ p values resulting from VOS: (a) HR mode and (b) ER mode.
Water 05 01211 g007
Figure 8. E values resulting from VOS: (a) HR mode and (b) ER mode.
Water 05 01211 g008

4. PAT Design by System Effectiveness

The Variable Operating Strategy is a machine selection procedure. The last steps of the procedure consist in an optimization, in order to find the optimal PAT machine. Carravetta et al. [34] proposed the overall efficiency as maximizing objective function (VOS η ), while, herein, the system effectiveness (E) is proposed as maximizing objective function (VOS E ). The VOS E procedure has been applied to the design conditions of Figure 1, both in HR and ER mode for a centrifugal, single stage pump, having specific speed of N s T = 44 . 0 [ r p m , k W ] and for API pumps standards (Table 1). In Table 2 and Table 3, the best design solution (namely, the impeller diameter, D) of VOS E is compared with the design solution of VOS η . For a complete overview, all the parameters that influence the effectiveness are presented in Table 2 and Table 3, respectively, for the optimal machines. As a first comment, it is important to stress that VOS η , in ER mode (Table 3), indicates a machine that is not flexible at all; this is due to the particular position of the maximum efficiency (Figure 3b), which lies on the edge of the feasible region for ER. Such behavior was already emphasized by Carravetta et al. [34], who also modified VOS η results in order to increase the system flexibility.
Table 2. VOS results in hydraulic (HR) mode.
VOS H d ( m ) 10203035
VOS η D ( m m ) 186191181176
η p = A 1 0.5900.5950.5320.483
ϕ p = A 2 0.9970.9840.9520.893
μ p = A 3 0.8780.6660.8680.603
E0.5170.3900.4400.260
VOS E D ( m m ) 179178171163
η p = A 1 0.5670.5490.4990.439
ϕ p = A 2 0.9990.9900.9560.923
μ p = A 3 0.9330.9760.98 50.971
E0.5290.5310.4710.394
Table 3. VOS results in electric regulation (ER) mode.
VOS H d ( m ) 10203035
VOS η D ( m m ) 237216222234
η p = A 1 0.3130.5270.5490.513
ϕ p = A 2 0.0000.0000.0000.000
μ p = A 3 0.7040.9140.9170.899
E0.0000.0000.0000.000
VOS E D ( m m ) 239221231250
η p = A 1 0.2980.4950.4950.410
ϕ p = A 2 0.9770.9760.9570.924
μ p = A 3 0.6860.8940.8910.809
E0.1990.4320.4220.306
Furthermore, it is interesting to observe that the system capability decreases only slightly if VOS E is adopted instead of VOS η , while a sensible increase of E is realized. It is also important to emphasize that, with the new procedure (VOS E ), the E in HR mode is better than in ER mode for all considered H d values. This is due to the smaller values of both efficiency and reliability in ER mode, while the flexibilities are quite comparable. Another important result consists in the diameters of the optimal machines: in HR mode, the optimal machines have diameters much smaller than in ER mode, and this obviously influences the cost of the machines, with a sensible reduction for the smaller diameter PATs.
The results of Table 2 and Table 3 can be explained by means of contour plots of Figure 3, Figure 4, Figure 7 and Figure 8, where system efficiency, flexibility, reliability and the resulting effectiveness are plotted for each H d value and PAT diameter, both for HR and ER modes. System capability plot is very flat in HR mode, but not in ER mode, where larger gradients are observed. The same trend is also visible in both the flexibility and the reliability plot. This is a very important result, because at the end of VOS, the network manager must choose a near-optimal machine from the pump market, and a small variation of the system effectiveness of the real plant from the design conditions is desirable.
From the peculiar form of the terms combining in system effectiveness (Figure 3, Figure 4, Figure 5, Figure 6, Figure 7 and Figure 8), it comes out that by an accurate design of the power systems, a strong benefit can be obtained in terms of system reliability and, consequently, in terms of system lifecycle costs. The maintenance benefit can be obtained without an appreciable decay in electromechanical efficiency. The reliability analysis proposed herein seems very case-sensitive, depending both on system regulation and pump manufacturing standards.

5. Conclusions

The Variable Operating Strategy (VOS), first presented by [33], is an optimization procedure, which allows one to select the optimal PAT (pump as turbine) to be used both for pressure control and for energy recovery in water distribution networks. The variable operating conditions can be faced by either a hydraulic (HR) or electrical regulation (ER) of the PAT.
The new concept of system effectiveness (E), based on the capability, flexibility and reliability of a PAT system, has been presented, and it has been used as an objective function of the VOS procedure. This innovative objective function adds mechanical reliability and system flexibility in the design procedure of a hydropower plant in a water network.
The Variable Operating Strategy was therefore developed for an assigned demand pattern, measured in a pressure reducing station located in southern Italy. It is interesting to observe that the overall design capability of the plant is not affected by the use of the new objective function, while a sensible increase of E is realized. It is also important to emphasize that, with this new methodology, the E in HR mode is always better than in ER mode for the case study situation. In the HR mode, system capability values are high in a wide range and for smaller diameter values. Hence, different diameters of PATs can be used with high capabilities. Conversely, in ER mode, such values are hardly attained. System flexibility is very flat in HR mode, but not in ER mode, where larger gradients are observed. The same trend is also visible in the reliability contour. These results are quite important, since they can help the near-optimal PAT choice from the pump market, with a desirable small variation of the system effectiveness from the design conditions. Another important result consists in the diameters of the optimal machines: in HR mode, the optimal machines have diameters much smaller than in ER mode, with obvious consequences in terms of costs.

Acknowledgments

The authors would like to thank Caprari spa and Lauro Antipodi for having provided the technical data of the machine.

Conflict of Interest

The authors declare no conflict of interest.

References

  1. Punys, P.; Dumbrauskas, A.; Kvaraciejus, A.; Vyciene, G. Tools for small hydropower plant resource planning and development: A review of technology and applications. Energies 2011, 4, 1258–1277. [Google Scholar] [CrossRef]
  2. Koch, F.; Prasch, M.; Bach, H.; Mauser, W.; Appel, F.; Weber, M. How will hydroelectric power generation develop under climate change scenarios? A case study in the upper danube basin. Energies 2011, 4, 1508–1541. [Google Scholar]
  3. Nazif, S.; Karamouz, M.; Tabesh, M.; Moridi, A. Pressure management model for urban water distribution networks. Water Resour. Manag. 2010, 24, 437–458. [Google Scholar] [CrossRef]
  4. Araujo, L.; Ramos, H.; Coelho, S. Pressure control for leakage minimisation in water distribution systems management. Water Resour. Manag. 2006, 20, 133–149. [Google Scholar] [CrossRef]
  5. Vairavamoorthy, K.; Lumbers, J. Leakage reduction in water distribution systems: Optimal valve control. J. Hydraul. Eng. 1998, 124, 1146–1154. [Google Scholar] [CrossRef]
  6. Da Conceicao Cunha, M.; Ribeiro, L. Tabu search algorithms for water network optimization. Eur. J. Oper. Res. 2004, 157, 746–758. [Google Scholar] [CrossRef]
  7. Prasad, T.; Park, N. Multiobjective genetic algorithms for design of water distribution networks. J. Water Resour. Plan. Manag. 2004, 130, 73–82. [Google Scholar] [CrossRef]
  8. Vasan, A.; Simonovic, S. Optimization of water distribution network design using differential evolution. J. Water Resour. Plan. Manag. 2010, 136, 279–287. [Google Scholar] [CrossRef]
  9. Almandoz, J.; Cabrera, E.; Arregui, F.; Cabrera, E.; Cobacho, R. Leakage assessment through water distribution network simulation. J. Water Resour. Plan. Manag. 2005, 131, 458–466. [Google Scholar] [CrossRef]
  10. Tucciarelli, T.; Criminisi, A.; Termini, D. Leak analysis in pipeline systems by means of optimal valve regulation. J. Hydraul. Eng. 1999, 125, 277–285. [Google Scholar] [CrossRef]
  11. Walsky, T.; Bezts, W.; Posluzny, E.; Weir, M.; Withman, B. Modeling leakage reduction through pressure control. J. Am. Water Works Assoc. 2006, 98, 148–155. [Google Scholar]
  12. Prescott, S.; Ulanicki, B. Improved control of pressure reducing valves in water distribution networks. J. Hydraul. Eng. 2008, 134, 56–65. [Google Scholar] [CrossRef]
  13. Del Giudice, G.; Di Cristo, C. Sampling design for water distribution networks. Prog. Water Resour. 2003, 8, 181–190. [Google Scholar]
  14. Liberatore, S.; Sechi, G. Location and calibration of valves in water distribution networks using a scatter-search meta-heuristic approach. Water Resour. Manag. 2009, 23, 1479–1495. [Google Scholar] [CrossRef]
  15. McNabola, A.; Coughlan, P.; Williams, A. The Technical and Economic Feasibility of Energy Recovery in Water Supply Networks. In Proceedings of International Conference on Renewable Energy and Power Quality, Las Palmas de Gran Canaria, Spain, 13–15 April 2011.
  16. Corcoran, L.; McNabola, A.; Coughlan, P. Energy Recovery Potential of the Dublin Region Water Supply Network; Water Congress on Water, Climate and Energy: Dublin, Ireland, 2012. [Google Scholar]
  17. Filion, Y.; MacLean, H.; Karney, B. Life cycle energy analysis of a water distribution system. J. Infrastruct. Syst. 2004, 10, 120–130. [Google Scholar] [CrossRef]
  18. Paish, O. Small hydro power: Technology and current status. Renew. Sustain. Energy Rev. 2002, 6, 537–556. [Google Scholar] [CrossRef]
  19. Sammartano, V.; Aricò, C.; Carravetta, A.; Fecarotta, O.; Tucciarelli, T. Banki-michell optimal design by computational fluid dynamics testing and hydrodynamic analysis. Energies 2013, 6, 2362–2385. [Google Scholar] [CrossRef] [Green Version]
  20. Carravetta, A.; Giugni, M. Functionality Factors in the Management and Rehabilitation of Water Networks. In Management of Water Networks, Proceedings of Conference Efficient Management of Water Networks, Design and Rehabilitation Techniquesa, Ferrara, Italy, May 2006; Franco Angeli Editore: Milano, Italy, 2006. [Google Scholar]
  21. Yassi, Y.; Hashemloo, S. Improvement of the efficiency of the Agnew micro hydro turbine at part loads due to installing guide vanes mechanism. Energy Convers. Manag. 2010, 51, 1970–1975. [Google Scholar] [CrossRef]
  22. Zakkour, P.; Gatarell, M.; Gochin, R.; Lester, J. Developing a sustainable energy strategy for a water utility. Part II: A review of potential technologies and approaches. J. Environ. Manag. 2002, 66, 115–125. [Google Scholar]
  23. Arriaga, M. Pump as turbine a pico-hydro alternative in lao peoples democratic republic. Renew. Energy 2010, 35, 1109–1115. [Google Scholar] [CrossRef]
  24. Nautiyal, H.; Varun; Kumar, A. Reverse running pumps analytical, experimental and computational study: A review. Renew. Sustain. Energy Rev. 2010, 14, 2059–2067. [Google Scholar] [CrossRef]
  25. Carravetta, A.; Fecarotta, O.; Ramos, H. Numerical Simulation on Pump as Turbine: Mesh Reliability and Performance Concerns. In Proceedings of the IEEE International Conference on Clean Electrical Power, Ischia, Italy, 14–16 June 2011; Franco Angeli Editore: Milano, Italy, 2011. [Google Scholar]
  26. Vicinanza, D.; Ciardulli, F.; Buccino, M.; Calabrese, M.; Koefed, J. Wave loadings acting on an innovative breakwater for energy production. J. Coast. Res. 2011, 64, 608–612. [Google Scholar]
  27. Vicinanza, D.; Margheritini, L.; Kofoed, J.; Buccino, M. The SSG wave energy converter: Performance, status and recent developments. Energies 2012, 5, 193–226. [Google Scholar] [CrossRef]
  28. Buccino, M.; Banfi, D.; Vicinanza, D.; Calabrese, M.; Del Giudice, G.; Carravetta, A. Non breaking wave forces at the front face of seawave slotcone generators. Energies 2012, 5, 4779–4803. [Google Scholar] [CrossRef]
  29. Bryden, G.; Couch, S. ME1-marine energy extraction: Tidal resource analysis. Renew. Energy 2006, 31, 133–139. [Google Scholar] [CrossRef]
  30. Carcangiu, S.; Montisci, A. A Building-Integrated Eolic System for the Exploitation of Wind Energy in Urban Areas. In Proceedings of the 2012 IEEE International Energy Conference and Exhibition (ENERGYCON), Florence, Italy, 9–12 September 2012; pp. 172–177.
  31. Vieira, F.; Ramos, H.M. Hybrid solution and pump-storage optimization in water supply system efficiency: A case study. Energy Policy 2008, 36, 4142–4148. [Google Scholar] [CrossRef]
  32. Vieira, F.; Ramos, H.M. Optimization of operational planning for wind/hydro hybrid water supply systems. Renew. Energy 2009, 34, 928–936. [Google Scholar] [CrossRef]
  33. Carravetta, A.; Del Giudice, G.; Fecarotta, O.; Ramos, H. Energy production in water distribution networks: A PAT design strategy. Water Resour. Manag. 2012, 26, 3947–3959. [Google Scholar] [CrossRef]
  34. Carravetta, A.; Del Giudice, G.; Fecarotta, O.; Ramos, H. PAT design strategy for energy recovery in water distribution networks by electrical regulation. Energies 2013, 6, 411–424. [Google Scholar] [CrossRef]
  35. Carravetta, A.; Fecarotta, O.; Sinagra, M.; Tucciarelli, T. A cost benefit analisys for hydropower production in water distribution networks by pump as turbine (PAT). J. Water Resour. Plan. Manag. 2013. [Google Scholar] [CrossRef]
  36. Suter, P. Representation of pump characteristics for calculation of water hammer. Sulzer Tech. Rev. 1966, 4, 45–48. [Google Scholar]
  37. Fecarotta, O.; Carravetta, A.; Ramos, H. CFD and comparisons for a pump as turbine: Mesh reliability and performance concerns. Int. J. Energy Environ. 2011, 2, 39–48. [Google Scholar]
  38. Dörfler, P. “Neo-Suterian” Pump-Turbine Characteristics and Their Benefits. In Proceedings of the 4th International Conference on Earth and Environmental Science, Timisoara, Romania, 20–24 September 2010; IOP Publishing: Bristol, UK, 2010; Volume 12. [Google Scholar]
  39. Barringer, H.P. Life Cycle Cost and Good Practices. In Proceedings of the NPRA Maintenance Conference, San Antonio, TX, USA, 19–22 May 1998; Barringer & Associates, Inc.: Humble, TX, USA, 1998. [Google Scholar]
  40. Barringer, H.P. A Life Cycle Cost Summary. In Proceedings of the International Conference of Maintenance Societies, Perth, Australia, 20–23 May 2003.
  41. Cheong, L. International Report on Unaccounted for Water and Economics of Leak Detection. In Proceedings of the IWA World Conference, Budapest, Hungary, October 1993.
  42. Kececioglu, D.; Tian, X. Reliability education: A historical perspective. IEEE Trans. Reliab. 1998, 47, SP390–SP398. [Google Scholar] [CrossRef]
  43. Pecht, M. Product Reliability, Maintainability, and Supportability Handbook; CRC: Boca Raton, FL, USA, 2009. [Google Scholar]
  44. Raheja, D.; Lindsley, M. Defect-Free Manufacturing in the Nineties. In Proceedings of the 1991 IEEE National Conference on Aerospace and Electronics, Dayton, OH, USA, 20–24 May 1991; pp. 1019–1022.
  45. Clements, R. Handbook of Statistical Methods in Manufacturing; Prentice-Hall: Upper Saddle River, NJ, USA, 1991. [Google Scholar]
  46. Tung, Y.; Yen, B.; Melching, C. Hydrosystems Engineering Reliability Assessment and Risk Analysis; McGraw-Hill Professional: New York, NY, USA, 2006. [Google Scholar]
  47. Kapur, K.; Lamberson, L. Reliability in Engineering Design; John Wiley and Sons: New York, NY, USA, 1977; Volume 1. [Google Scholar]
  48. Trivedi, K. Probability and Statistics with Reliability, Queuing, and Computer Science Applications; John Wiley and Sons: New York, NY, USA, 2002. [Google Scholar]
  49. Carderock, D. Handbook of Reliability Prediction Procedures for Mechanical Equipment; Naval Surface Warfare Center: West Bethesda, MD, USA, 1992. [Google Scholar]

