Delineating Chromosomal Breakpoints in Radiation-Induced Papillary Thyroid Cancer

Abstract
: Recurrent translocations are well known hallmarks of many human solid tumors and hematological disorders, where patient- and breakpoint-specific information may facilitate prognostication and individualized therapy. In thyroid carcinomas, the proto-oncogenes RET and NTRK1 are often found to be activated through chromosomal rearrangements. However, many sporadic tumors and papillary thyroid carcinomas (PTCs) arising in patients with a history of exposure to elevated levels of ionizing irradiation do not carry these known abnormalities. We developed a rapid scheme to screen tumor cell metaphase spreads and identify candidate genes of tumorigenesis and neoplastic progression for subsequent functional studies. Using a series of overnight fluorescence in situ hybridization (FISH) experiments with pools comprised of bacterial artificial chromosome (BAC) clones, it now becomes possible to rapidly refine breakpoint maps and, within one week, progress from the low resolution Spectral Karyotyping (SKY) maps or Giemsa-banding (G-banding) karyotypes to fully integrated, high resolution physical maps including a list of candiate genes in the critical regions.1. Introduction
It is becoming increasingly clear that the pathogenesis of radiation-induced tumors is often distinctly different from that of spontaneous, non-radiation-induced tumors. Our research focuses on the physical mapping of proto-oncogenes related to tumorigenesis such as the neurothrophic growth factor receptor 1, NTRK1 (also known as trk-A) [1], the development of assays to detect chromosomal rearrangements leading to activation of oncogenes [2–5], and the mapping of translocation breakpoints in spontaneous cases of PTC as well as tumors in patients with a known history of either therapeutic or accidental exposure to ionizing radiation [6–8].
While chromosomal rearrangements activating NTRK1 are relatively rare and not a marker of exposure to ionizing radiation [9–12], the situation is different in cases with mutations involving the cadherin-family associated cell surface receptor, RET, another receptor-type tyrosine kinase (rtk) gene, found on Chromosome 10 [2–5,13–16].
Numerous studies could demonstrate a correlation between exposures to ionizing radiation and particular RET/PTC rearrangements in vivo leading to the expression of chimaeric proteins [17–22].
Fluorescence in situ hybridization is one of the most powerful tools to detect these genetic aberrations underlying the expression of chimaeric proteins [23–25]. Such proteins alter the signaling pathways in cells that have undergone neoplastic transformation [26–28].
Table 1 gives an overview of the most relevant RET/PTC rearrangements analyzed and described to date.

| RET type | Partner Gene | Chromosomal positions | Reference |
|---|---|---|---|
| RET/PTC 1 | H4 (CCDC6, D10S170) | inv10(q11.2;q21) | [29] |
| RET/PTC 2 | PRKAR1A | t(10;17)(q11.2;q23) | [30] |
| RET/PTC3; RET/PTC4 | NCOA4 | inv10(q11.2;q10) | [18,31] |
| RET/PTC5 | GOLGA5 (RFG5) | t(10;14)(q11.2;q32) | [32] |
| RET/PTC6 | TRIM24 (HTIF1) | t(7;10)(q32–34;q11.2) | [20] |
| RET/PTC7 | TIF1G (RFG7,TRIM33) | t(1;10)(p13;q11.2) | [20] |
| ELKS-RET | ELKS (RAB6IP2) | t(10;12)(q11.2;p13.3) | [33] |
| RET/PTC8 | KTN1 | t(10;14)(q11.2;q22.1) | [34] |
| RET/RFG9 | RFG9 | t(10;18)(q11.2;q21–22) | [35] |
| PCM1-RET | PCM1 | t(8;10)(p21-22;q11.2) | [36] |
| RFP-RET | RFP (TRIM27) | t(6;10)(p21;q11.2) | [37] |
| HOOK3-RET | HOOK3 | t(8;10)(p11.21;q11.2) | [38] |
More recent studies have shown that the most common RET/PTC1 and RET/PTC3 rearrangements map to the known fragile site FRA10G [39] and can be created in vitro with fragile site-inducing chemicals such as aphidicolin [40].
Despite a high prevalence of mutations or rearrangements activating the rtks NTRK1 or RET, many phenotypically similar tumors do not show this abnormality. Adding a further level of complexity, in our studies of post-Chernobyl cases of PTC, only few tumors showed clonal abnormalities in 100% of metaphase spreads like the case S96T (Figure 1) [7,8,25].
We hypothesize that these normal-looking metaphase spreads carry small submicroscopic lesions also known as cryptic translocations that are missed by the conventional methods of metaphase cell analysis, i.e., G-banding, whole chromosome painting (WCP) or SKY [8,41–43].
Therefore, we feel that it is necessary to combine a variety of cytogenetic techniques to comprehensively describe all relevant aberrations. To further explore this, we utilized cell lines established from three cases of radiation-induced childhood thyroid cancer: S96T, as mentioned above, and S47T and S48T, as analyzed further in this publication.
Table 2 gives an overview over clinical details and findings from G-banding and FISH studies in these cell lines.
| Case | Gender | Age at Surgery | Age at Accident | G-Banded Metaphase Cells | Result | SKY Results | Activated tk Gene | Reference |
|---|---|---|---|---|---|---|---|---|
| S47T | female | 13 years | 6 years | 10 | t(5;7)(q23;p15) | t(5;7) | RET/PTC3 | [17] |
| S48T | male | 14 years | 7 years | 6 | Multiple (see text) | der(1;4),der(1;6),der(1;6;11),der(2;17),der(2;6;11),der(2;7;11),der(2;11;17),der(3;8),der(3;9),der(6;11),der(7;9;15),der(9;13) | NTRK1 | [8,44] |
| S96T | female | 14 years | 6 years | 10 | t(10;22)(q11;q11) | Not determined | -- | [8] |
The RET/NTRK1 status of the cell lines used in this study has been published previously [17,34,45].
Now, if these oncogenic events arise from balanced intra- or interchromosomal rearrangements, gene copy numbers remain unchanged compared to normal diploid cells, and comparative genomic hybridization assays using either metaphase spreads [46], oligonucleotide (Nimblegen; Affymetrix) or bacterial artificial chromosome arrays [47,48] will fail to detect the abnormalities.
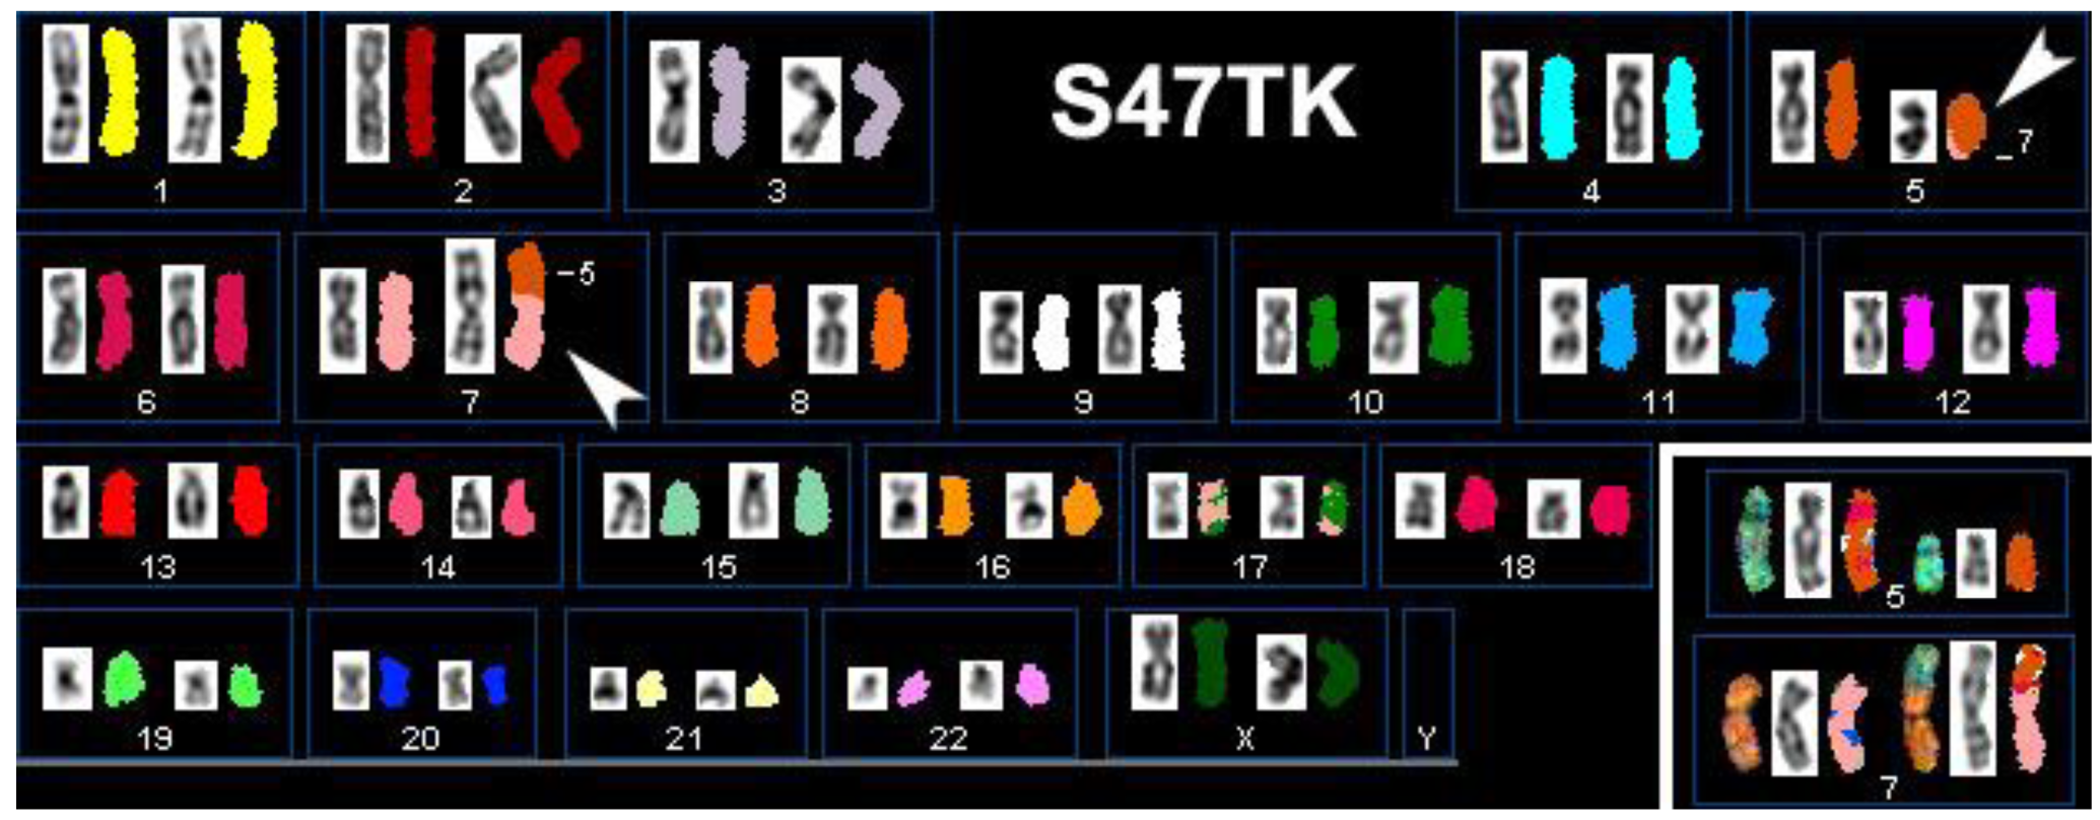
An additional complication in the definition of candidate genes for thyroid tumorigenesis is the great variety in levels of heterogeneity found in primary cell cultures and even established cell lines. Figure 2 illustrates this by presenting the results of our SKY analysis of case S47T, a childhood case of post-Chernobyl PTC [8]. Roughly half of the S47T metaphase spreads that we analyzed by SKY showed a balanced, reciprocal translocation t(5;7)(q23;p15). The other spreads did not show chromosome 7 material translocated to the der(5) (Figure 2, insert).
Similar challenges have been identified in previous publications analyzing PTC-associated rearrangements with and without exposure to ionizing radiation.
Thus, we have to accept that no single cytogenetic technique will reliably detect all potential aberrations found in the pathogenesis of radiation-induced (or indeed spontaneous) tumors.
In this communication we propose an algorithm utilizing a combination of cytogenetic techniques of increasing resolution to comprehensively, expeditiously and cost-effectively delineate chromosomal breakpoints in radiation-induced papillary thyroid carcinomas. By utilizing publicly available resources, our aim was the development of a replicable, targeted approach to breakpoint analysis which can be used by non-specialist laboratories worldwide.

2. Results and Discussion
Where significant heterogeneity is observed in cultured cell lines, such as in the case of S47T, the possibility of contamination has to be considered. However, we exclude the possibility of a contamination of these 2 cell lines (S47T and S96T) based on the fact that all 10 out of 10 G-banded metaphases showed the identical translocation (Table 2). Therefore, the fact that individual metaphase spreads prepared from S47T showed two different der(7) chromosomes in subsequent passages of S47T must be due to a deletion event that followed the reciprocal t(5;7) translocation.
Instead of immunofluorescence characterization of cell lines, we performed comprehensive cDNA hybridization experiments. This elucidated DNA changes not visible by SKY or G-banding techniques. Results from these studies have been published [7,17,45].
To develop and validate our algorithm, we focused our attention on cell line S48T.
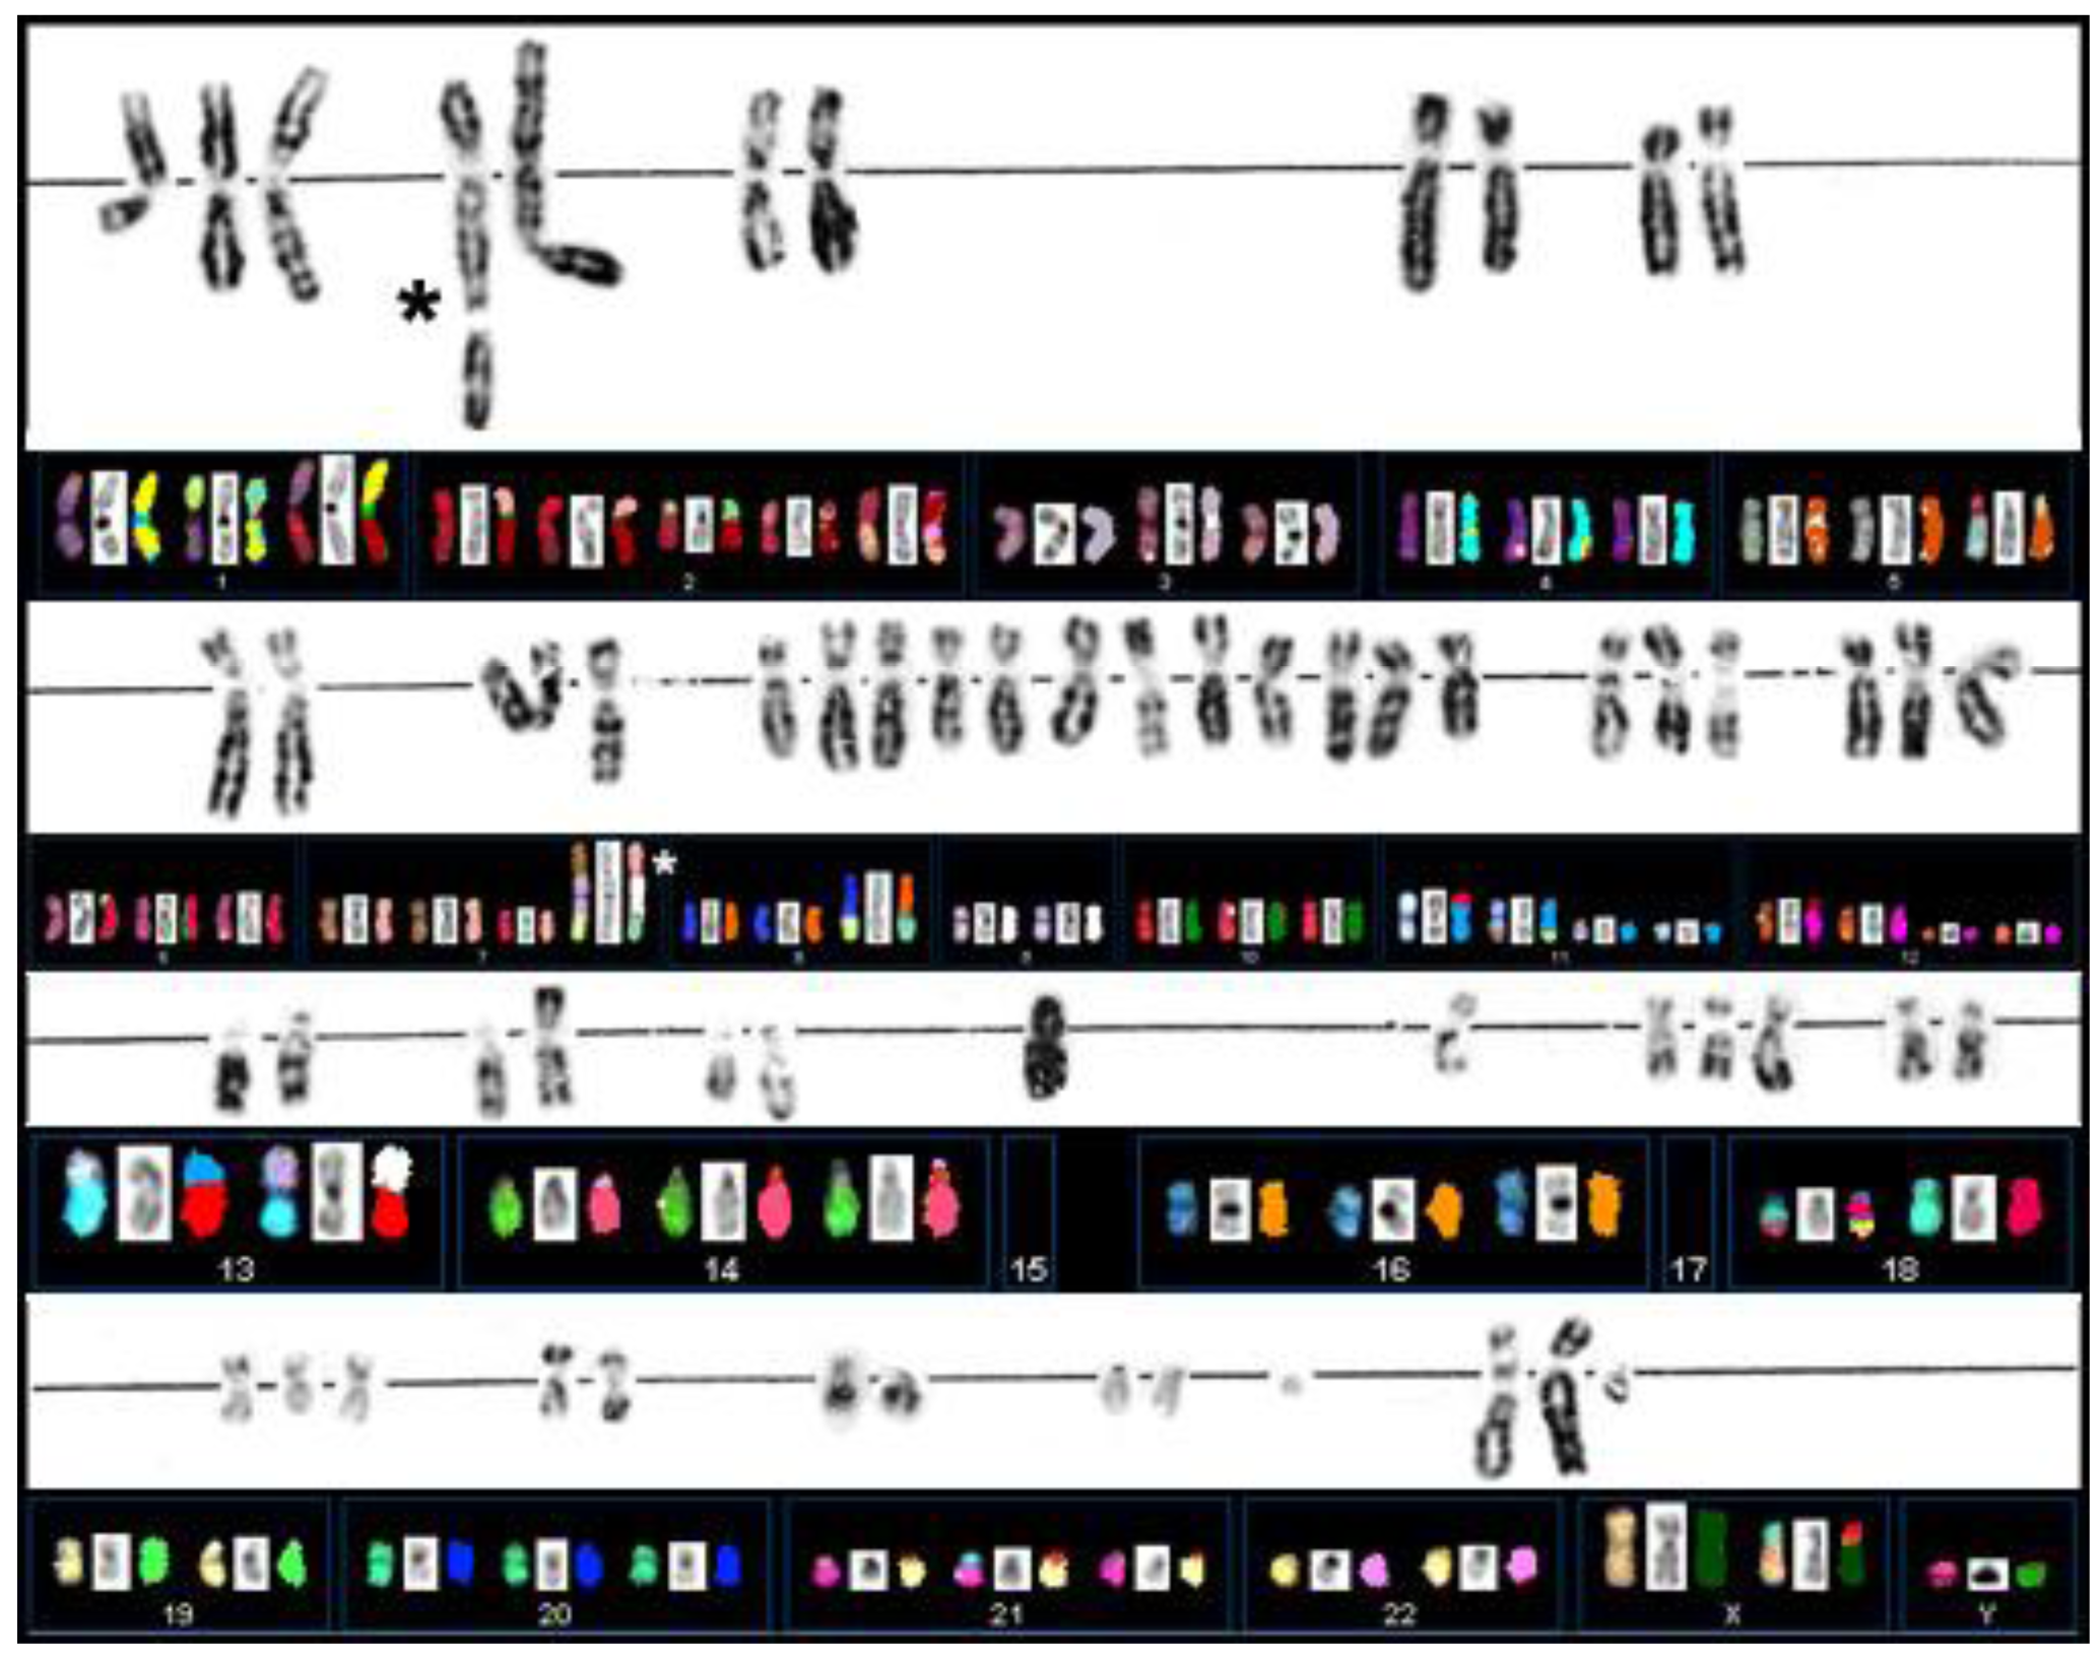
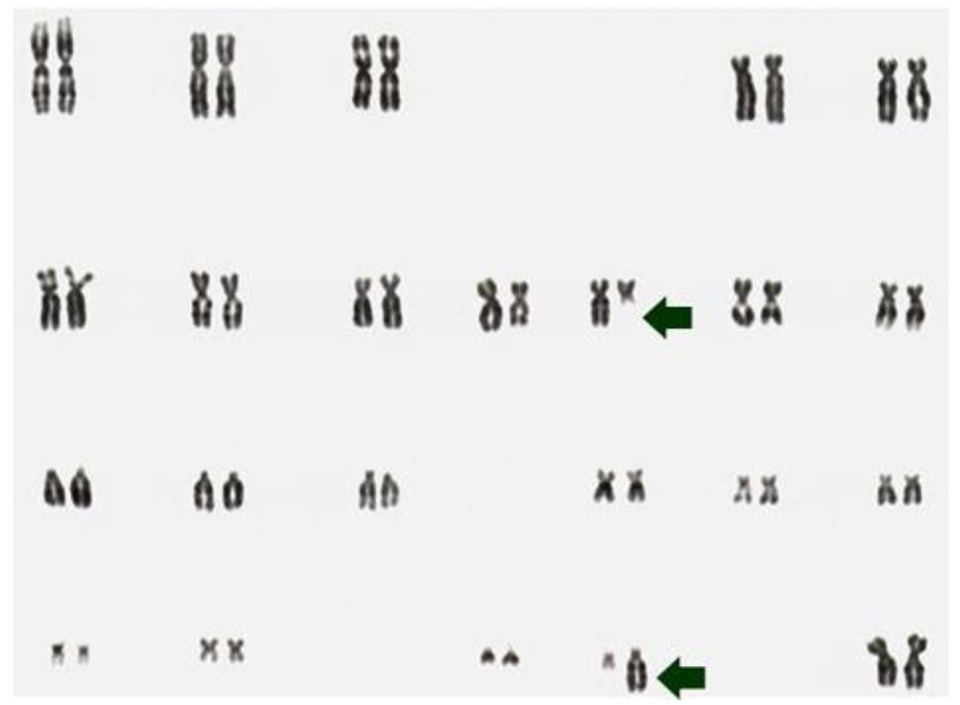
Extensive G-banding analysis performed in the laboratories in Munich had indicated that primary cultures derived from case S48T carried multiple chromosomal abnormalities. The rearrangements were large in number and mostly unbalanced, which greatly complicated conventional karyotyping based on G-banding analysis (Figure 3) [49]. The cloning of cell line S48T has been described previously [42].
Our Spectral Karyotyping analysis (SKY), shown in Figure 3 below the G-banding results, provided some additional clues to the origin of marker chromosomes.
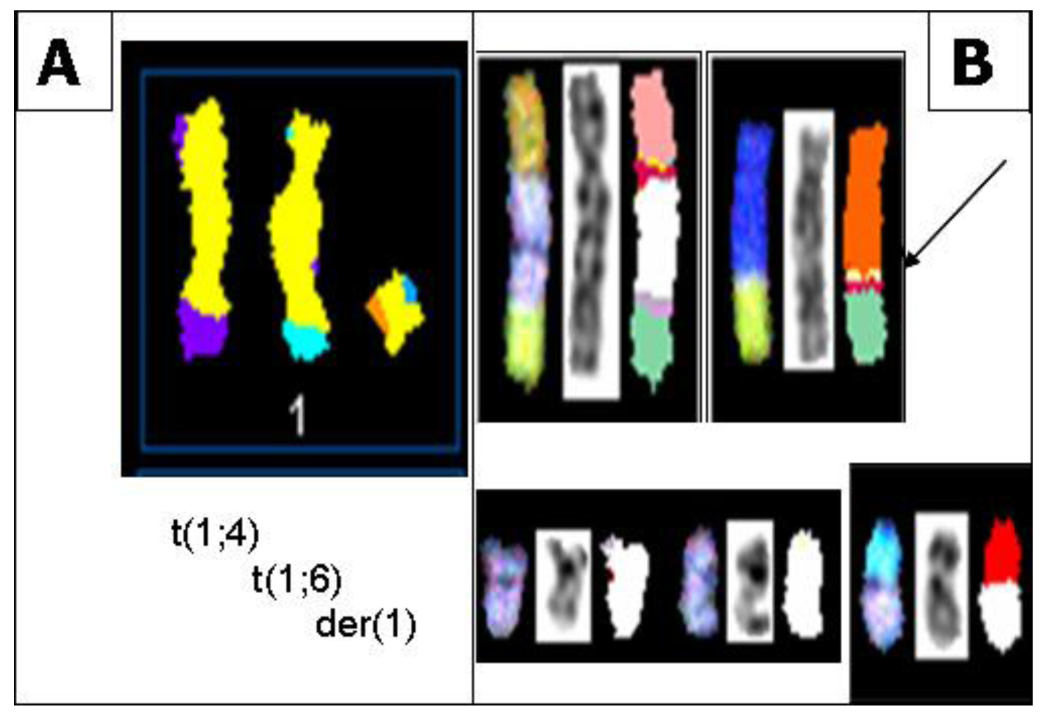
Cell line S48T did not display signs of rearranged chromosomes 10, but a number of marker chromosomes carrying material from either chromosome 1 or 9 caught our attention. The long arm of chromosome 1 harbors the neurotrophic growth factor receptor kinase-1 (NTRK1) gene [1], which has been reported to be aberrantly expressed in various solid tumors among them post-Chernobyl PTC [9,50].

In all S48T metaphase spreads, we found several marker chromosomes containing genetic material from either chromosome 1 or 9. These common markers, three of which are derived from chromosome 1 (Figure 4A) and four types derived from chromosome 9 (Figure 4B), are shown in Figure 4.
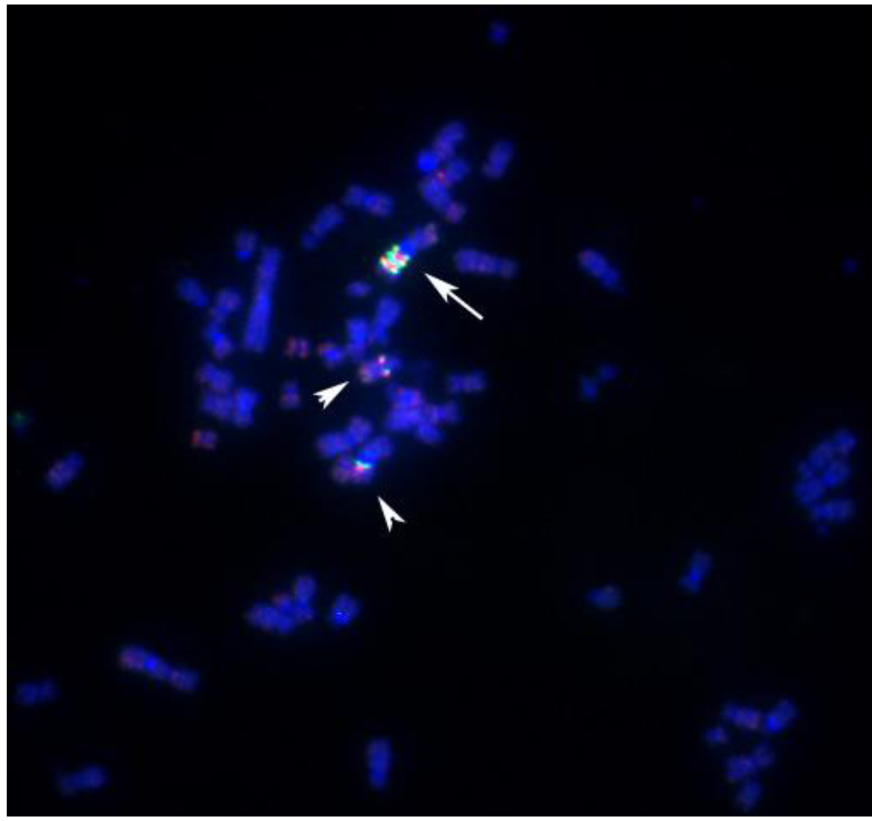
Protein tyrosine kinases have been implicated in tumor initiation and progression [51–53]. In gene expression studies reported elsewhere, we were able to demonstrate that cell line S48T expresses the tyrosine kinase domain of NTRK-1 [44], which is normally located on the long arm of chromosome 1, band q12-21 [1] at position 156,830,671–156,851,642 bp in the UC Santa Cruz (UCSC) genome browser. For the analysis of chromosome 1 rearrangements, we pooled three individual BAC probes, since this has resulted in more reliable FISH signals [45,54,55]. Hybridization of a combination of a biotinylated probe DNA pool that maps close to NTRK1 at chromosome 1q12-21 (clones RP11-37N10, RP11-71P2 and RP11-315I20) and a digoxigenin–labeled probe pool comprised of probes RP11-262A11, RP11-299D6 and RP11-243J18 that bind close to non-muscle tropomyosin 3 (TMP3) (UCSC position 1: 154,127,780–154,155,725), a known translocation partner of NTRK1 in solid tumor cell lines [50,56], revealed complex translocation and genome amplification in line S48T (Figure 5). Two derivative chromosomes each carried 1 copy of the ∼10 Mbp region flanked by our probe pools (arrowheads in Figure 5), while a large marker chromosome contained about 2.5 copies (arrow in Figure 5).
The results shown in Figure 5 confirm comparative genomic hybridization results that indicated genomic amplification of the proximal long arms of chromosome 1 and chromosome 9 in S48T [42].

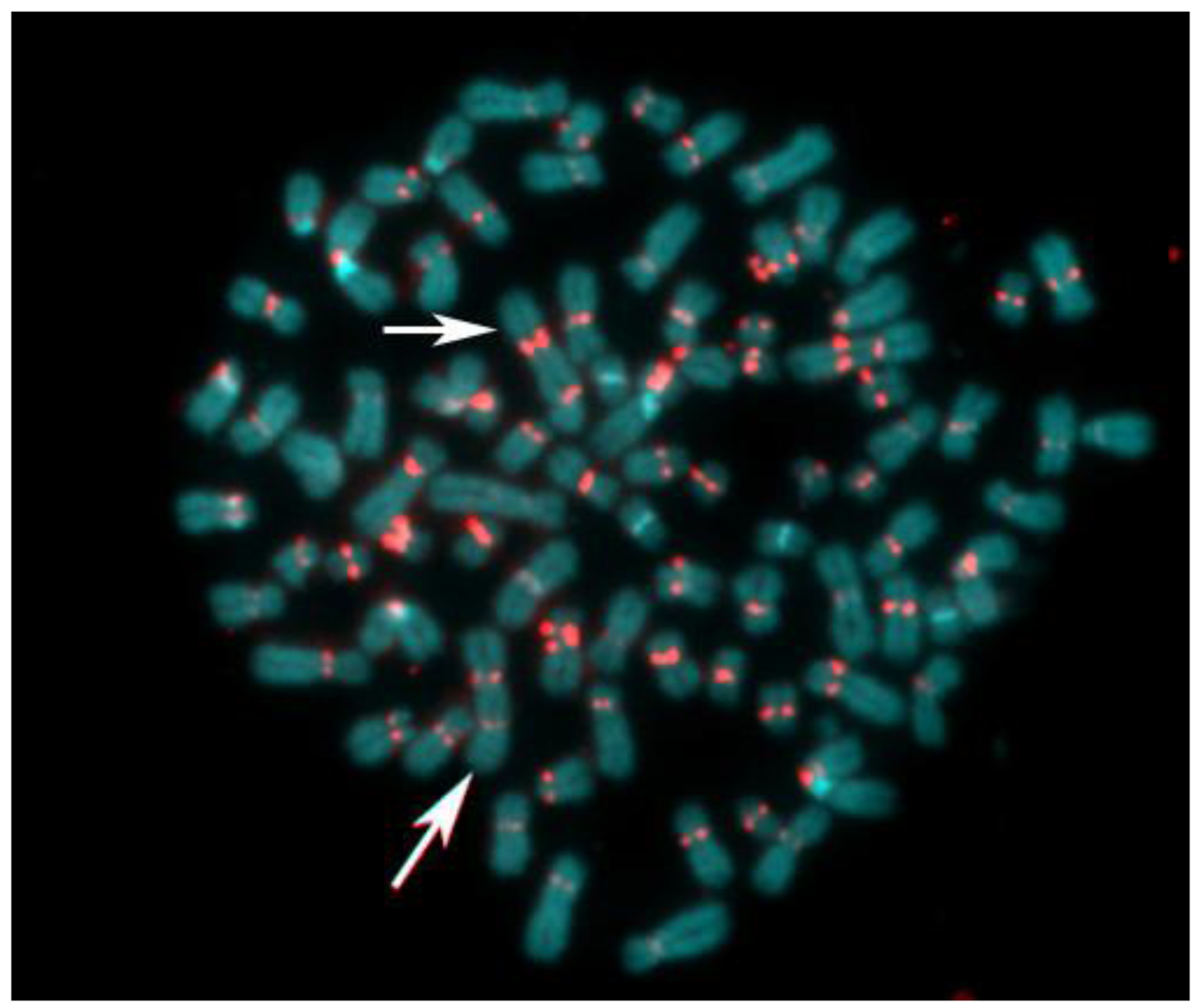
The abnormal staining pattern of the large marker chromosome (arrows in Figure 6 A,B) prompted us to investigate the distribution of centromeric heterochromatin in this cell line. Considered a rather rare event, some of the S48T metaphase spreads hybridized with the alpha satellite DNA probe showed not just one, but two large dicentric chromosomes (Figure 7, arrows).

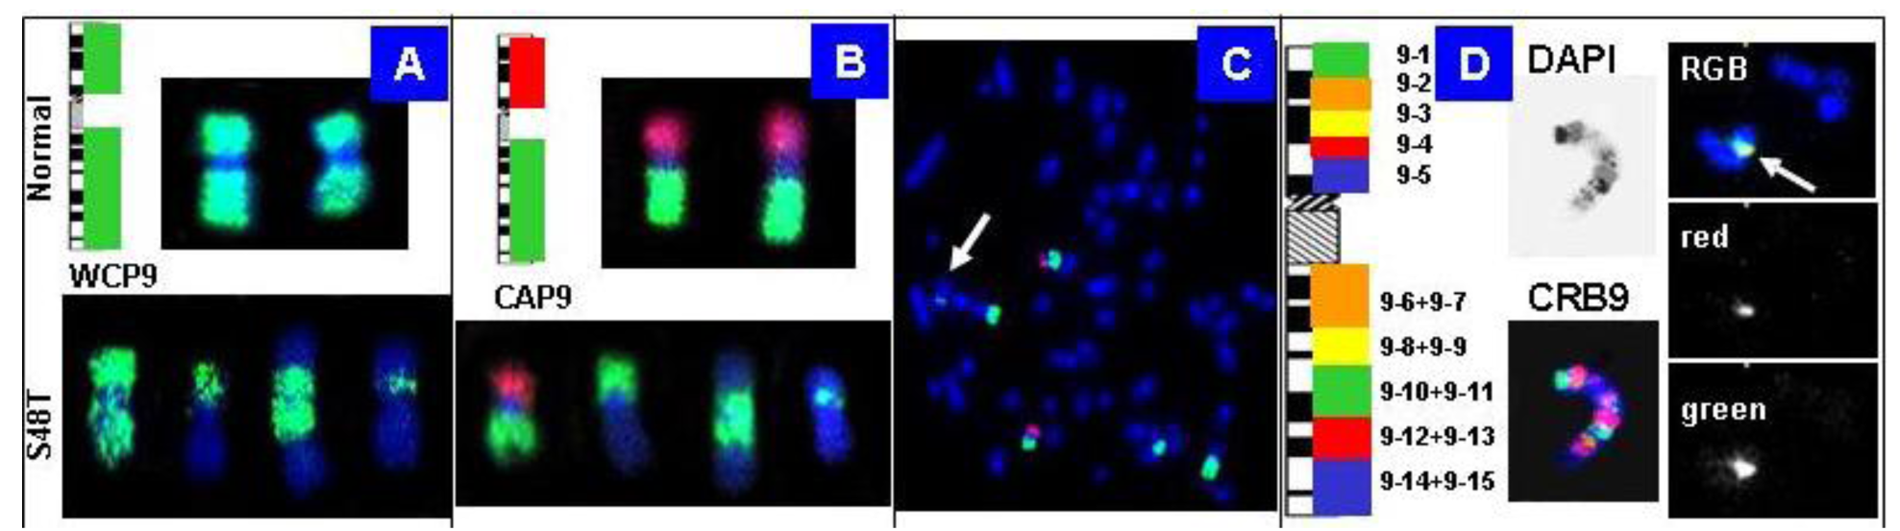
Our strategy to rapidly map chromosomal breakpoints in metaphase spreads is based on hybridization of increasingly smaller BAC-derived DNA probe pools. Figure 8 shows chromosome 9-specific examples: the top in (Figure 8A, B) shows the results obtained with normal metaphase chromosomes, whereas the bottom shows chromosomes in S48T.

It should be noted that BAC-FISH is a very sensitive approach to detect translocations [57].
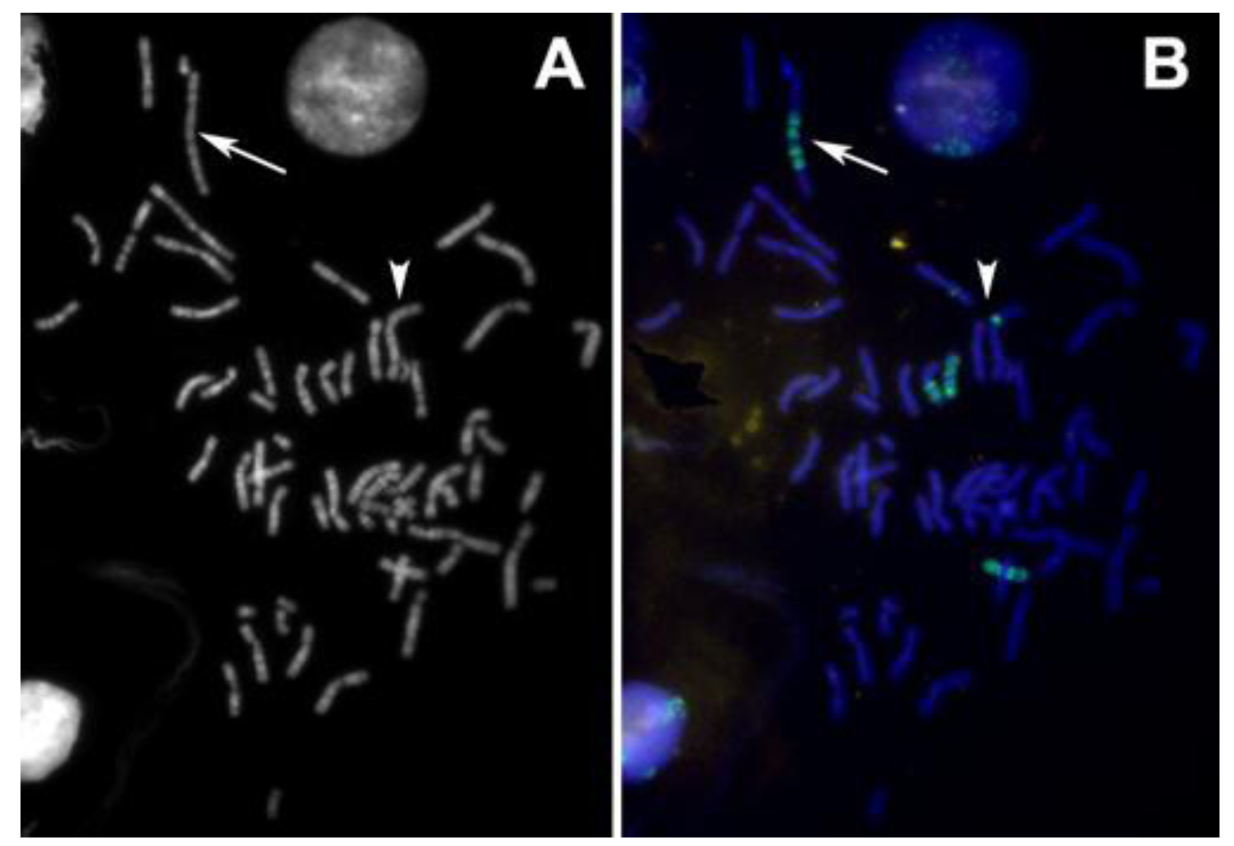
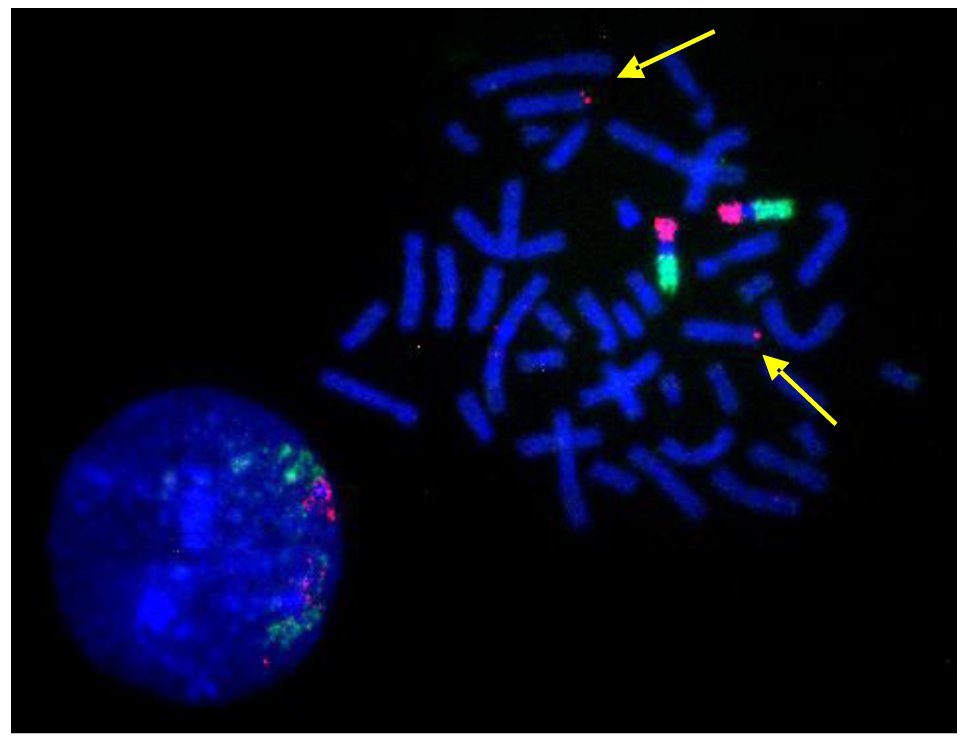
A single BAC clone is sufficient to highlight a small translocation as shown in the example in Figure 9. Here, the BAC clone set contained one sub-telomeric clone that had been assigned by mistake to chromosome 9ptel in one of the databases. As the hybridization experiments showed, this clone maps to the telomere on the short arm of chromosome 8 instead (Figure 9).
Once a minimal breakpoint interval defined by a single BAC clone or a contig of 2–3 clones is defined, genome databases can be consulted to search for candidate tumor-related genes. For the small insertion into the t(8;9;15) chromosome in S48T this approach is illustrated in Figure 10. This screen dump from the Genome browser web page at the University of California, Santa Cruz (UCSC), shows a region of roughly 1.5 Mbp, which was found inserted into the marker chromosome. Clones that were used in our hybridization experiments are included in the set of FISH mapped clones shown in this Figure (i.e., RP11-92C4, RP11-91D7)
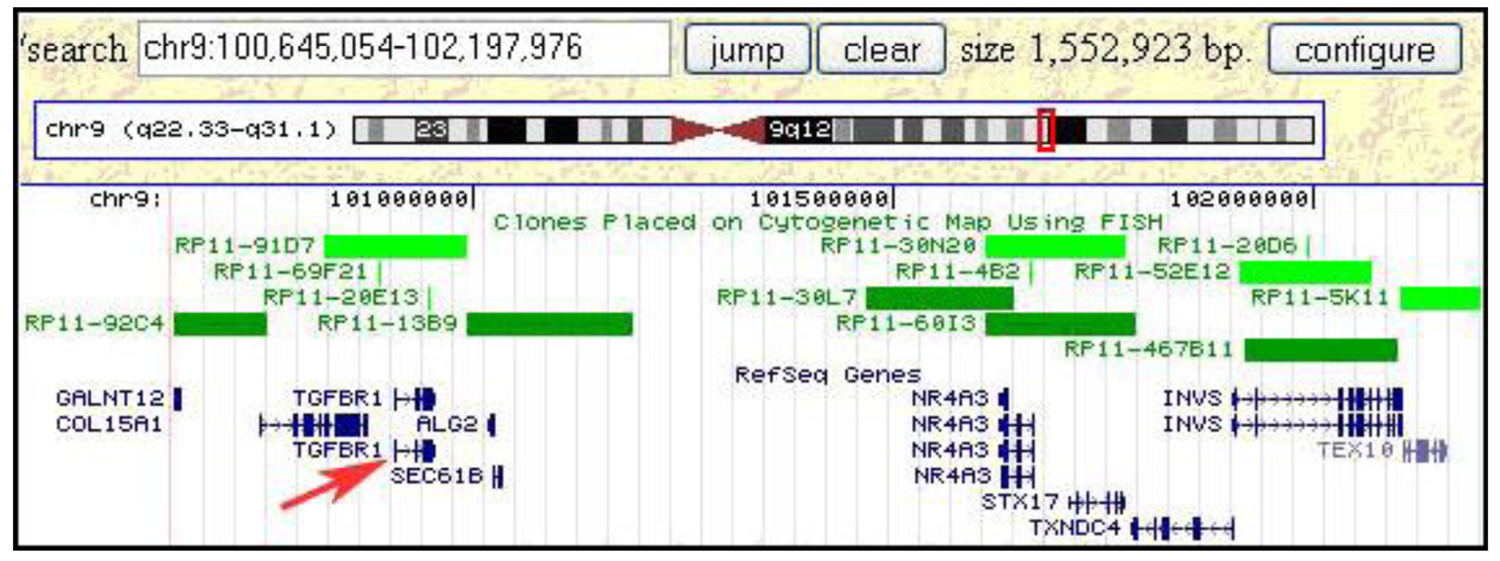
Interestingly, this region from the long arm of chromosome 9 contains the tumor growth factor (TGF) beta receptor 1 (TGFBR1) gene, which when mutated or duplicated, alters the transmission of the subcellular TGF beta signal and has been reported to cause a dominant disease phenotype [48,58]. While these findings do not support a notion that TGF beta duplications have a causal relationship to post-Chernobyl PTC, the observed gain might very well alter the cells' phenotype increasing their chances of survival and increased proliferation in the tumor microenvironment. Conversely, this metabolomic change might become a tumor's Achilles heel in efforts to devise more efficient anti-tumor therapies.
3. Experimental Section
3.1. Cell Cultures and Preparation of Metaphase Spreads
Normal human control metaphase spreads were made from phytohemagglutinin-stimulated short-term lymphocyte cultures of blood obtained from a healthy male according to the procedure described by Harper and Saunders [59]. Acetic acid-methanol fixed lymphocytes were dropped on ethanol-cleaned slides in a CDS-5 Cytogenetic Drying Chamber (Thermatron Industries, Inc, Holland, MI) at 25 °C and 45–50% relative humidity.
The PTC cultures were established as described by Lehmann et al. and Zitzelsberger et al. [7,8]. All procedures followed protocols approved by the LBNL/UC Berkeley Institutional Review Board (IRB) Committee on protection of Human Subjects in Research regarding use of surplus surgical tissues for research. S48T lines were obtained from the tumor tissue of a 14 year old patient (7 years at time of exposure to elevated levels of radiation) undergoing surgery at the Center for Thyroid Tumors in Minsk, Belarus, following the diagnosis of Hashimoto's thyroiditis and PTC. Initial chromosome preparations were carried out after an in vitro culture of S48T cells for 8–21 days. Later, clones were isolated by limiting dilution and cultured for more than 20 passages. After G-banding with Wright's staining solution, karyotypes were recorded according to the International System for Human Cytogenetic Nomenclature [60].
3.2. Comparative Genomic Hybridization (CGH)
Comparative genomic hybridization [46] with DNA isolated from the primary culture as well as cell lines established from case S48T was performed following standard procedures as described for a case S42T [6]. In brief, genomic DNA was isolated from the primary culture as well as from cell lines and labeled with biotin-16-dUTP (Roche Applied Science, Indianapolis, IN, USA). Normal female reference DNA was isolated from peripheral lymphocytes of a healthy donor and labeled with dig-11-dUTP. After hybridization to normal metaphase spreads of a healthy donor, labeled DNA probes were detected with streptavidin-Cy2 or avidin DCS-FITC (Vector Inc., Burlingame, CA, USA) and anti-digoxigenin-Cy3/rhodamine conjugates. Slides were counterstained with 4′,6-diamidino-2-phenyl-indole (DAPI, Calbiochem, La Jolla, CA, USA) for chromosome identification. For CGH analysis, eight or more metaphases were analyzed. Averaged profiles were generated by CGH analysis software (Vysis, Downers Grove, IL, USA) from 10–15 homologous chromosomes and interpreted according to published criteria [61,62].
3.3. Spectral Karyotyping Analysis (SKY)
Spectral Karyotyping is a molecular cytogenetic procedure to screen the entire human genome for interchromosomal translocations by hybridization of 24 different WCP probes mixtures to metaphase spreads. We applied SKY to case S48T and identified complex aberration patterns [8]. The SKY analyses followed essentially the recommendations of the manufacturer of the reagents and the SKY imaging instrumentation (Applied Spectral Imaging (ASI), Carlsbad, CA). Briefly, fixed cells on slides were pretreated with 50 μg/mL pepsin (Amresco, Solon, OH) in 0.01N HCl for 10 min at 37 °C before immersion in phosphate buffered saline (PBS) for 5 min. The slides were then incubated in paraformaldehyde (PFA) solution (1% in PBS) for 5 min, then in PBS for 5 min. After immersion in a 70%, 80%, 100% ethanol series for 3–5 min each step, the slides were air dried. Cells on slides were denatured for 5 min at 76 °C in 70% formamide (FA)(Invitrogen, Carlsbad, CA, USA)/2 × SSC and then dehydrated in 70%, 80%, and 100% ethanol (2 min per step) before air drying.
Meanwhile, the hybridization mixture (ASI) containing 24 painting probes, each specific for one human chromosome type and labeled with combinations of five different reporter molecules was denatured for 5–6 min at 76 °C, and pre-annealed/-blocked for 30–90 min at 37 °C. The pre-blocked hybridization mixture was then applied to each slide, cover slips were place on top and sealed with rubber cement. The hybridization reaction proceeded for 18-42 h at 37 °C, before the slides were washed three times for 10 min each at 43 °C in 50% FA/2 × SSC, then twice in 2 × SSC (10 min each at 43 °C). The slides were mounted with 8 μL of 4,6-diamino-2-phenylindole (DAPI) (0.1 μg/mL) in antifade solution (0.1% p-phenylenediamine dihydrochloride (Sigma, St. Louis, MO, USA), 0.1× phosphate buffered saline (Invitrogen), 45 mM NaHCO3, 82% glycerol (Sigma), pH 8.0) and coverslipped. Metaphases images were acquired with the Spectracube system (ASI) and analyzed with SKYVIEW software [41,63].
3.4. Preparation of Locus-Specific DNA Probes (LSPs)
Our procedures for preparation of DNA probes from BAC/PAC clones [64,65] have been described in detail before [1,66,67]. Prior to the chromosome 9-specific FISH studies, 151 BAC clones from the Sanger Center 1 Mbp set [47] were re-arrayed on two 96-well microtiter plates (Table 3). Using information in publicly available databases ( http://genome.ucsc.edu/ and http://www.ncbi.nlm.nih.gov/gquery/gquery.fcgi), we selected additional BAC clones for the long arm of chromosome 1 from the Roswell Park Cancer Institute (RPCI) library RP11 [68] and for chromosome 9. A subtelomeric clone placed in position A1 on Plate 1, GS1-41L13, is not shown in Table 3. This BAC maps to the short arm of chromosome 8 (Figure 9).
| Pool | Region | Clone | Start (bp) | End (bp) | BAC Insert Size (bp) |
|---|---|---|---|---|---|
| 9-1 | 9p24.3 | GS1-77L23 | 222308 | 336203 | 113895 |
| 9-1 | 9p24.3 | RP11-147I11 | 991152 | 1101150 | 109998 |
| 9-1 | 9p24.3 | RP11-66M18 | 1340595 | 1488472 | 147877 |
| 9-1 | 9p24.3-p24.2 | RP11-48M17 | 2136364 | 2296360 | 159996 |
| 9-1 | 9p24.2 | RP11-320E16 | 2521111 | 2521805 | 694 |
| 9-1 | 9p24.2 | RP11-509J21 | 3533199 | 3696631 | 163432 |
| 9-1 | 9p24.1 | RP11-125K10 | 4819733 | 4991796 | 172063 |
| 9-1 | 9p24.1 | RP11-509D8 | 4911574 | 5121406 | 209832 |
| 9-1 | 9p24.1 | RP11-218I7 | 5993718 | 6146499 | 152781 |
| 9-1 | 9p24.1 | RP11-106A1 | 6566990 | 6567805 | 815 |
| 9-1 | 9p24.1 | RP11-283F6 | 7267032 | 7418276 | 151244 |
| 9-2 | 9p24.1 | RP11-283F6 | 7267081 | 7418295 | 151214 |
| 9-2 | 9p24.1 | RP11-29B9 | 7904520 | 8056890 | 152370 |
| 9-2 | 9p24.1 | RP11-175E13 | 8398615 | 8557610 | 158995 |
| 9-2 | 9p23 | RP11-527D15 | 9657611 | 9823754 | 166143 |
| 9-2 | 9p23 | RP11-19G1 | 9932073 | 10130653 | 198580 |
| 9-2 | 9p23 | RP11-23D5 | 11170428 | 11341967 | 171539 |
| 9-2 | 9p23 | RP11-352F21 | 11389658 | 11588107 | 198449 |
| 9-2 | 9p23 | RP11-446F13 | 12225005 | 12396287 | 171282 |
| 9-2 | 9p23 | RP11-187K14 | 12819715 | 13004078 | 184363 |
| 9-2 | 9p23 | RP11-413D24 | 13729630 | 13912935 | 183305 |
| 9-2 | 9p22.3 | RP11-408A13 | 14419816 | 14586697 | 166881 |
| 9-3 | 9p22.3 | RP11-490C5 | 15219945 | 15401987 | 182042 |
| 9-3 | 9p22.3 | RP11-109M15 | 16141186 | 16325481 | 184295 |
| 9-3 | 9p22.2 | RP11-132E11 | 16987010 | 17148443 | 161433 |
| 9-3 | 9p22.2 | RP11-123J20 | 17839221 | 18013839 | 174618 |
| 9-3 | 9p22.1 | RP11-503K16 | 18579957 | 18743091 | 163134 |
| 9-3 | 9p22.1 | RP11-513M16 | 19310518 | 19506748 | 196230 |
| 9-3 | 9p21.3 | RP11-15P13 | 20172465 | 20351121 | 178656 |
| 9-3 | 9p21.3 | RP11-113D19 | 21157685 | 21158452 | 767 |
| 9-3 | 9p21.3 | RP11-149I2 | 21851433 | 22046818 | 195385 |
| 9-3 | 9p21.3 | RP11-11J1 | 22479595 | 22579721 | 100126 |
| 9-4 | 9p21.3 | RP11-495L19 | 23376562 | 23557443 | 180881 |
| 9-4 | 9p21.3 | RP11-33K8 | 24090721 | 24243438 | 152717 |
| 9-4 | 9p21.3 | RP11-468C2 | 24877888 | 25069382 | 191494 |
| 9-4 | 9p21.2 | RP11-33G16 | 25690187 | 25853227 | 163040 |
| 9-4 | 9p21.2 | RP11-5P15 | 26681234 | 26681720 | 486 |
| 9-4 | 9p21.2 | RP11-27J8 | 27417088 | 27590261 | 173173 |
| 9-4 | 9p21.1 | RP11-20P5 | 28027075 | 28204449 | 177374 |
| 9-4 | 9p21.1 | RP11-264J11 | 28840514 | 28840768 | 254 |
| 9-4 | 9p21.1 | RP11-383F6 | 29089125 | 29250390 | 161265 |
| 9-4 | 9p21.1 | RP11-48L13 | 29493271 | 29639053 | 145782 |
| 9-5 | 9p21.1 | RP11-2G13 | 30199650 | 30364698 | 165048 |
| 9-5 | 9p13.3 | RP11-573M23 | 34323596 | 34407345 | 83749 |
| 9-5 | 9p13.3 | RP11-395N21 | 35284076 | 35428177 | 144101 |
| 9-5 | 9p13.3 | RP11-421H8 | 36088495 | 36279930 | 191435 |
| 9-5 | 9p13.2 | RP11-220I1 | 37065972 | 37242474 | 176502 |
| 9-5 | 9p13.2 | RP11-113O24 | 38261089 | 38427295 | 166206 |
| 9-5 | 9p13.1 | RP11-138L21 | 39175643 | 39294206 | 118563 |
| 9-5 | 9p12 | RP11-38P6 | 42614658 | 42703483 | 88825 |
| 9-5 | 9p12 | RP11-111G23 | 42933608 | 43076412 | 142804 |
| 9-6 | 9q13 | RP11-274B18 | 68358409 | 68528389 | 169980 |
| 9-6 | 9q21.11 | RP11-265B8 | 68778953 | 68779698 | 745 |
| 9-6 | 9q21.11 | RP11-109D9 | 69487306 | 69676572 | 189266 |
| 9-6 | 9q21.11 | RP11-141J10 | 70528528 | 70677340 | 148812 |
| 9-6 | 9q21.11 | RP11-563H8 | 71314567 | 71465298 | 150731 |
| 9-6 | 9q21.12 | RP11-429L21 | 72321408 | 72481088 | 159680 |
| 9-6 | 9q21.12 | RP11-71A24 | 72848317 | 73017346 | 169029 |
| 9-6 | 9q21.12 | RP11-401G5 | 73624112 | 73796829 | 172717 |
| 9-6 | 9q21.13 | RP11-66O21 | 75439414 | 75440255 | 841 |
| 9-6 | 9q21.13 | RP11-422N19 | 76090213 | 76253493 | 163280 |
| 9-7 | 9q21.13 | RP11-490H9 | 76861448 | 77031282 | 169834 |
| 9-7 | 9q21.13 | RP11-336N8 | 77969998 | 77970521 | 523 |
| 9-7 | 9q21.13 | RP11-174K23 | 78534808 | 78716286 | 181478 |
| 9-7 | 9q21.2 | RP11-362L2 | 79355248 | 79356032 | 784 |
| 9-7 | 9q21.2 | RP11-280K20 | 80042734 | 80187829 | 145095 |
| 9-7 | 9q21.2 | RP11-384P5 | 80182461 | 80364063 | 181602 |
| 9-7 | 9q21.2-q21.3 | 1 RP11-66D1 | 80991481 | 81138354 | 146873 |
| 9-7 | 9q21.31 | RP11-432M2 | 82008792 | 82208346 | 199554 |
| 9-7 | 9q21.31 | RP11-541F16 | 82662629 | 82822736 | 160107 |
| 9-7 | 9q21.31 | RP11-439A18 | 83330646 | 83525574 | 194928 |
| 9-8 | 9q21.31 | RP1-292F10 | 83899162 | 83988222 | 89060 |
| 9-8 | 9q21.32 | RP11-59M22 | 84220295 | 84377175 | 156880 |
| 9-8 | 9q21.32 | RP11-172F7 | 85287618 | 85288314 | 696 |
| 9-8 | 9q21.32 | RP11-280P22 | 85960413 | 86094507 | 134094 |
| 9-8 | 9q21.32-q21.33 | RP11-276H19 | 86827154 | 86980390 | 153236 |
| 9-8 | 9q21.33 | RP11-423O13 | 86923188 | 87098245 | 175057 |
| 9-8 | 9q21.33 | RP11-40C6 | 87248292 | 87415074 | 166782 |
| 9-8 | 9q21.33 | RP11-249H20 | 87325937 | 87486007 | 160070 |
| 9-8 | 9q21.33 | RP11-65B23 | 87486049 | 87654534 | 168485 |
| 9-8 | 9q21.33 | RP11-345K9 | 87869665 | 88066130 | 196465 |
| 9-9 | 9q21.33 | RP11-176L21 | 88644066 | 88799441 | 155375 |
| 9-9 | 9q21.33 | RP11-8B23 | 89927165 | 89927994 | 829 |
| 9-9 | 9q21.33-q22.1 | RP11-555F9 | 90225650 | 90402024 | 176374 |
| 9-9 | 9q22.1 | RP11-440G5 | 91210454 | 91381302 | 170848 |
| 9-9 | 9q22.2 | RP11-19J3 | 92321634 | 92489352 | 167718 |
| 9-9 | 9q22.2 | RP11-30L4 | 93288305 | 93459139 | 170834 |
| 9-9 | 9q22.31 | RP11-333I7 | 94415600 | 94590889 | 175289 |
| 9-9 | 9q22.31 | RP11-279I21 | 94473904 | 94655715 | 181811 |
| 9-9 | 9q22.31 | RP11-435O5 | 95213051 | 95402627 | 189576 |
| 9-9 | 9q22.31 | RP11-160D19 | 95433765 | 95598231 | 164466 |
| 9-10 | 9q22.31 | RP11-240L7 | 96060259 | 96229878 | 169619 |
| 9-10 | 9q22.32 | RP11-23J9 | 97120587 | 97286003 | 165416 |
| 9-10 | 9q22.32 | RP11-23B15 | 97623563 | 97784334 | 160771 |
| 9-10 | 9q22.32 | RP11-92C4 | 98644256 | 98794171 | 149915 |
| 9-10 | 9q22.32 | RP11-192E23 | 98744783 | 98745226 | 443 |
| 9-10 | 9q22.32 | RP11-96L7 | 98922778 | 99098674 | 175896 |
| 9-10 | 9q22.32-q22.33 | RP11-547C13 | 99270898 | 99449952 | 179054 |
| 9-10 | 9q22.33 | RP11-463M14 | 99548194 | 99709828 | 161634 |
| 9-10 | 9q22.33 | RP11-463M14 | 99548222 | 99709762 | 161540 |
| 9-10 | 9q22.33 | RP11-208F1 | 100050139 | 100197864 | 147725 |
| 9-11 | 9q22.33 | RP11-80H12 | 100788649 | 100957646 | 168997 |
| 9-11 | 9q22.33 | RP11-75J9 | 101521451 | 101680519 | 159068 |
| 9-11 | 9q22.33 | RP11-318L4 | 103254007 | 103418980 | 164973 |
| 9-11 | 9q31.1 | RP11-185E13 | 103623573 | 103794095 | 170522 |
| 9-11 | 9q31.1 | RP11-31J20 | 104568352 | 104754723 | 186371 |
| 9-11 | 9q31.1 | RP11-287A8 | 105223738 | 105396654 | 172916 |
| 9-11 | 9q31.1 | RP11-540H22 | 106247901 | 106435604 | 187703 |
| 9-11 | 9q31.1 | RP11-438P9 | 107357324 | 107357981 | 657 |
| 9-11 | 9q31.2 | RP11-400A24 | 108279653 | 108468171 | 188518 |
| 9-11 | 9q31.2 | RP11-388N6 | 109146376 | 109360971 | 214595 |
| 9-12 | 9q31.2 | RP11-470J20 | 109953950 | 110131864 | 177914 |
| 9-12 | 9q31.2 | RP11-202G18 | 110955506 | 111132187 | 176681 |
| 9-12 | 9q31.3 | RP11-570D4 | 111731038 | 111917067 | 186029 |
| 9-12 | 9q31.3 | RP11-88M9 | 112540764 | 112727061 | 186297 |
| 9-12 | 9q31.3 | RP11-534I8 | 113659179 | 113845753 | 186574 |
| 9-12 | 9q31.3 | RP11-78H18 | 114647112 | 114805811 | 158699 |
| 9-12 | 9q32 | RP11-279J9 | 114917908 | 115093107 | 175199 |
| 9-12 | 9q32 | RP11-445L6 | 114960260 | 115162581 | 202321 |
| 9-12 | 9q32 | RP11-445L6 | 114981548 | 115162653 | 181105 |
| 9-12 | 9q32 | RP11-382H18 | 115128372 | 115297394 | 169022 |
| 9-13 | 9q32 | RP11-404K23 | 115288454 | 115472575 | 184121 |
| 9-13 | 9q32 | RP11-58C3 | 115951715 | 116121055 | 169340 |
| 9-13 | 9q32 | RP11-67K19 | 116408159 | 116563591 | 155432 |
| 9-13 | 9q32 | RP11-388N2 | 117294858 | 117470365 | 175507 |
| 9-13 | 9q33.1 | RP11-451E16 | 118116160 | 118310814 | 194654 |
| 9-13 | 9q33.1 | RP11-574M5 | 118953289 | 119134969 | 181680 |
| 9-13 | 9q33.1 | RP11-28O4 | 119071486 | 119072140 | 654 |
| 9-13 | 9q33.1 | RP11-360A18 | 119775925 | 119958173 | 182248 |
| 9-13 | 9q33.1 | RP11-165P4 | 120891105 | 121069469 | 178364 |
| 9-13 | 9q33.1 | RP11-477J21 | 120973024 | 121178266 | 205242 |
| 9-14 | 9q33.1 | RP11-429D3 | 121691418 | 121864392 | 172974 |
| 9-14 | 9q33.2 | RP11-137O6 | 122808959 | 122994424 | 185465 |
| 9-14 | 9q33.2 | RP11-417B4 | 123491878 | 123688856 | 196978 |
| 9-14 | 9q33.2 | RP11-101K10 | 124167663 | 124330481 | 162818 |
| 9-14 | 9q33.2 | RP11-269P11 | 125271849 | 125447742 | 175893 |
| 9-14 | 9q33.3 | RP11-205K6 | 126296031 | 126460599 | 164568 |
| 9-14 | 9q33.3 | RP11-373J8 | 127282486 | 127499995 | 217509 |
| 9-14 | 9q33.3 | RP11-545E17 | 128541257 | 128707904 | 166647 |
| 9-14 | 9q33.3 | RP11-202H3 | 129858645 | 130045763 | 187118 |
| 9-15 | 9q34.11 | RP11-57C19 | 130510169 | 130683466 | 173297 |
| 9-15 | 9q34.11 | RP11-83J21 | 130670998 | 130857947 | 186949 |
| 9-15 | 9q34.11 | RP11-143H20 | 130881497 | 131058128 | 176631 |
| 9-15 | 9q34.11 | RP11-5N16 | 132007228 | 132007771 | 543 |
| 9-15 | 9q34.11 | RP11-295G24 | 132650995 | 132860166 | 209171 |
| 9-15 | 9q34.12 | RP11-153P4 | 133571331 | 133750415 | 179084 |
| 9-15 | 9q34.13 | RP11-399H11 | 135198232 | 135419560 | 221328 |
| 9-15 | 9q34.2 | RP11-83N9 | 136207935 | 136362829 | 154894 |
| 9-15 | 9q34.3 | RP11-417A4 | 137679200 | 137871989 | 192789 |
| 9-15 | 9q34.3 | GS1-135I17 | 138168343 | 138274031 | 105688 |
Individual clones were arranged so that the entire chromosome 9-specific clone set was contained on two 96-well plates in 15 rows termed “pools” with 9-12 clones per pool in individual wells (Figure 11). This created pools “9-1” to “9-15”, each of which covers a few megabase pairs (Mbp) of DNA on chromosome 9 roughly equivalent to chromosomal bands. Pools 9-1 to 9-5 (a total of 51 clones) and pools 9-6 to 9-15 (a total of 99 clones) map to the short and long arm of chromosome 9, respectively. The pool coverage ranges from 3.85 Mbp for pool 9-8 to 12.88 Mbp for pool 9-5. When large numbers of clones were grown, overnight cultures were done individually in 2 mL of Luria broth (LB) medium in 96 deep well plates (Beckman, City of Hope, CA). Fewer individual clones were grown overnight in up to 20 mL of Luria broth (LB) medium [69] containing 12.5 μg/mL chloramphenicol (Sigma) and the DNA was extracted using an alkaline lysis protocol as described [70,71]. For preparation of DNA pools or “super-pools”, i.e., combination of two or more pools, clones were grown individually and pooled prior to DNA extraction. Quality control and quantification of the DNA was typically done by agarose gel electrophoresis and fluorometry, respectively.

All DNA probes were prepared by random priming (BioPrime kit, Invitrogen, Carlsbad, CA, USA) incorporating biotin-14-dCTP (part of the BioPrime kit), digoxigenin-11-dUTP (dig-11-dUTP, Roche Applied Science), fluorescein-12-dUTP (Roche Applied Science), Cy5-dUTP (Amersham, Arlington Heights, IN, USA) or Cy5.5-dCTP (Perkin Elmer, Wellesley, MA, USA) [3,72,73]. Between 0.5 μL and 3 μL of each probe along with of 4 μL human COT1™ DNA (1 mg/mL, Invitrogen) and 1 μL salmon sperm DNA (20 mg/mL, 3′-5′, Boulder, CO, USA) were precipitated with 1 μL glycogen (Roche Applied Science, 1 mg/mL) and 1/10 volume of 3 M sodium acetate in 2 volumes of 2-propanol, air dried and resuspended in 3 μL water, before 7 μL of hybridization master mix (78.6% formamide (FA), 14.3% dextran sulfate in 2.9× SSC, pH 7.0) were added. Thus, the total volume of the hybridization mixture reached 10 μL. Hybridization and detection of bound probes followed our published procedures [1–8,43]. Biotinylated and digoxigenin-labeled probes were detected with avidin-FITC (Vector, Burlingame, CA, USA; green fluorescence) and rhodamine-conjugated antibodies to digoxigenin (Roche Applied Science; red fluorescence).
In this communication, we will refer to the combination of all 150 BAC-derived DNA probes as whole chromosome painting (WCP) probe and call combinations of pools 9.1–9.5 and 9.6–9.15 “chromosome arm probes (CAP)” for chromosome 9p and 9q, respectively. To investigate chromosome 9 rearrangements in S48T with higher resolution, we labeled DNA extracted from 9p-specific clone pools and chromosome 9q-specific, adjacent pairs of pools with 5 different fluorochromes, and refer to these probes as “chromosomal rainbow probes (CRP)”.
4. Conclusions
In many known instances, recurrent chromosomal rearrangements are not just random events in solid tumors, but become apparent once cells carrying these abnormalities gain growth advantages over other clones. Thus, knowledge regarding the physical location of translocation breakpoints, activation of proto-oncogenes or inactivation of tumor suppressor genes may provide crucial information for a better staging of tumors and/or the definition of treatment regimens for individualized anti-tumor therapy.
Technical approaches described in this communication outline rapid and thus cost-efficient ways to analyze a patient's karyotype and reveal abnormalities within a matter of days. Utilizing resources that have been generated in the course of the International Human Genome Project, such as BAC libraries providing multi-fold coverage of the human genome, and avoiding the need for costly equipment, an average lab with basic instrumentation will now be able to perform and rapidly conclude high resolution physical mapping experiments of cancer genomes.
Acknowledgments
The skillful assistance of guests and staff of the Weier laboratory, LBNL, is gratefully acknowledged. This work was supported in parts by a grant from the Leonard Rosenman Fund (BOB) and NIH grants HD45736, CA123370, CA132815 and CA136685 (HUW) carried out at the Lawrence Berkeley National Laboratory under contract DE-AC02-05CH11231. JLF was supported in part by NIH grant HD41425. We would like to thank the Mapping Core and Map Finishing groups of the Wellcome Trust Sanger Institute for initial clone supply and verification [47,74].
Disclaimer
This document was prepared as an account of work sponsored by the United States Government. While this document is believed to contain correct information, neither the United States Government nor any agency thereof, nor The Regents of the University of California, nor any of their employees, makes any warranty, express or implied, or assumes any legal responsibility for the accuracy, completeness, or usefulness of any information, apparatus, product, or process disclosed, or represents that its use would not infringe privately owned rights. Reference herein to any specific commercial product, process, or service by its trade name, trademark, manufacturer, or otherwise, does not necessarily constitute or imply its endorsement, recommendation, or favoring by the United States Government or any agency thereof, or The Regents of the University of California. The views and opinions of authors expressed herein do not necessarily state or reflect those of the United States Government or any agency thereof, or The Regents of the University of California.
References
- Weier, H.U.; Rhein, A.P.; Shadravan, F.; Collins, C.; Polikoff, D. Rapid physical mapping of the human trk protooncogene (NTRK1) to human chromosome 1q21-q22 by P1 clone selection, fluorescence in situ hybridization (FISH), and computer-assisted microscopy. Genomics 1995, 26, 390–393. [Google Scholar]
- Jossart, G.H.; Greulich, K.M.; Siperstein, A.E.; Duh, Q.; Clark, O.H.; Weier, H.U. Molecular and cytogenetic characterization of a t(1;10;21) translocation in the human papillary thyroid cancer cell line TPC-1 expressing the ret/H4 chimeric transcript. Surgery 1995, 118, 1018–1023. [Google Scholar]
- Jossart, G.H.; O'Brien, B.; Cheng, J.F.; Tong, Q.; Jhiang, S.M.; Duh, Q.; Clark, O.H.; Weier, H.U. A novel multicolor hybridization scheme applied to localization of a transcribed sequence (D10S170/H4) and deletion mapping in the thyroid cancer cell line TPC-1. Cytogenet. Cell Genet. 1996, 75, 254–257. [Google Scholar]
- Zitzelsberger, H.F.; O'Brien, B.; Weier, H.-U.G. Multicolor FISH techniques for the detection of inter- and intrachromosomal rearrangements. In FISH Technology; Rautenstrauss, B., Liehr, T., Eds.; Springer Verlag: Berlin, Germany, 2002; pp. 408–424. [Google Scholar]
- O'Brien, B.; Jossart, G.H.; Ito, Y.; Greulich-Bode, K.M.; Weier, J.F.; Munne, S.; Clark, O.H.; Weier, H.U.G. ‘Chromosomal Rainbows’ detect oncogenic rearrangements of signaling molecules in thyroid tumors. Open Cell Signaling J. 2010, 2, 13–21. [Google Scholar]
- Lehmann, L.; Greulich, K.M.; Zitzelsberger, H.; Negele, T.; Spelsberg, F.; Bauchinger, M.; Weier, H.U. Cytogenetic and molecular genetic characterization of a chromosome 2 rearrangement in a case of human papillary thyroid carcinoma with radiation history. Cancer Genet. Cytogenet. 1997, 96, 30–36. [Google Scholar]
- Lehmann, L.; Zitzelsberger, H.; Kellerer, A.M.; Braselmann, H.; Kulka, U.; Georgiadou-Schumacher, V.; Negele, T.; Spelsberg, F.; Demidchik, E.; Lengfelder, E.; et al. Chromosome translocations in thyroid tissues from Belarussian children exposed to radioiodine from the Chernobyl accident, measured by FISH-painting. Int. J. Radiat. Biol. 1996, 70, 513–516. [Google Scholar]
- Zitzelsberger, H.; Lehmann, L.; Hieber, L.; Weier, H.U.; Janish, C.; Fung, J.; Negele, T.; Spelsberg, F.; Lengfelder, E.; Demidchik, E.P.; et al. Cytogenetic changes in radiation-induced tumors of the thyroid. Cancer Res. 1999, 59, 135–140. [Google Scholar]
- Beimfohr, C.; Klugbauer, S.; Demidchik, E.P.; Lengfelder, E.; Rabes, H.M. NTRK1 re-arrangement in papillary thyroid carcinomas of children after the Chernobyl reactor accident. Int. J. Cancer 1999, 80, 842–847. [Google Scholar]
- Bounacer, A.; Schlumberger, M.; Wicker, R.; Du-Villard, J.A.; Caillou, B.; Sarasin, A.; Suarez, H.G. Search for NTRK1 proto-oncogene rearrangements in human thyroid tumours originated after therapeutic radiation. Br. J. Cancer 2000, 82, 308–314. [Google Scholar]
- Rabes, H.M.; Demidchik, E.P.; Sidorow, J.D.; Lengfelder, E.; Beimfohr, C.; Hoelzel, D.; Klugbauer, S. Pattern of radiation-induced RET and NTRK1 rearrangements in 191 post-chernobyl papillary thyroid carcinomas: biological, phenotypic, and clinical implications. Clin. Cancer Res. 2000, 6, 1093–1103. [Google Scholar]
- Brzezianska, E.; Pastuszak-Lewandoska, D.; Lewinski, A. Rearrangements of NTRK1 oncogene in papillary thyroid carcinoma. Neuro. Endocrinol. Lett. 2007, 28, 221–229. [Google Scholar]
- Arif, S.; Blanes, A.; Diaz-Cano, S.J. Hashimoto's thyroiditis shares features with early papillary thyroid carcinoma. Histopathology 2002, 41, 357–362. [Google Scholar]
- Ishizaka, Y.; Itoh, F.; Tahira, T.; Ikeda, I.; Ogura, T.; Sugimura, T.; Nagao, M. Presence of aberrant transcripts of ret proto-oncogene in a human papillary thyroid carcinoma cell line. Jpn. J. Cancer Res. 1989, 80, 1149–1152. [Google Scholar]
- Lahr, G.; Stich, M.; Schutze, K.; Blumel, P.; Posl, H.; Nathrath, W.B. Diagnosis of papillary thyroid carcinoma is facilitated by using an RT-PCR approach on laser-microdissected archival material to detect RET oncogene activation. Pathobiology 2000, 68, 218–226. [Google Scholar]
- Tallini, G.; Asa, S.L. RET oncogene activation in papillary thyroid carcinoma. Adv. Anat. Pathol. 2001, 8, 345–354. [Google Scholar]
- Smida, J.; Salassidis, K.; Hieber, L.; Zitzelsberger, H.; Kellerer, A.M.; Demidchik, E.P.; Negele, T.; Spelsberg, F.; Lengfelder, E.; Werner, M.; et al. Distinct frequency of ret rearrangements in papillary thyroid carcinomas of children and adults from Belarus. Int. J. Cancer 1999, 80, 32–38. [Google Scholar]
- Fugazzola, L.; Pilotti, S.; Pinchera, A.; Vorontsova, T.V.; Mondellini, P.; Bongarzone, I.; Greco, A.; Astakhova, L.; Butti, M.G.; Demidchik, E.P.; et al. Oncogenic rearrangements of the RET proto-oncogene in papillary thyroid carcinomas from children exposed to the Chernobyl nuclear accident. Cancer Res. 1995, 55, 5617–5620. [Google Scholar]
- Klugbauer, S.; Lengfelder, E.; Demidchik, E.P.; Rabes, H.M. High prevalence of RET rearrangement in thyroid tumors of children from Belarus after the Chernobyl reactor accident. Oncogene 1995, 11, 2459–2467. [Google Scholar]
- Klugbauer, S.; Rabes, H.M. The transcription coactivator HTIF1 and a related protein are fused to the RET receptor tyrosine kinase in childhood papillary thyroid carcinomas. Oncogene 1999, 18, 4388–4393. [Google Scholar]
- Nikiforov, Y.E. Radiation-induced thyroid cancer: What we have learned from Chernobyl. Endocr. Pathol. 2006, 17, 307–317. [Google Scholar]
- Unger, K.; Malisch, E.; Thomas, G.; Braselmann, H.; Walch, A.; Jackl, G.; Lewis, P.; Lengfelder, E.; Bogdanova, T.; Wienberg, J.; et al. Array CGH demonstrates characteristic aberration signatures in human papillary thyroid carcinomas governed by RET/PTC. Oncogene 2008, 27, 4592–4602. [Google Scholar]
- Cinti, R.; Yin, L.; Ilc, K.; Berger, N.; Basolo, F.; Cuccato, S.; Giannini, R.; Torre, G.; Miccoli, P.; Amati, P.; et al. RET rearrangements in papillary thyroid carcinomas and adenomas detected by interphase FISH. Cytogenet. Cell Genet. 2000, 88, 56–61. [Google Scholar]
- Chen, F.; Clark, D.P.; Hawkins, A.L.; Morsberger, L.A.; Griffin, C.A. A break-apart fluorescence in situ hybridization assay for detecting RET translocations in papillary thyroid carcinoma. Cancer Genet. Cytogenet. 2007, 178, 128–134. [Google Scholar]
- Zitzelsberger, H.; Thomas, G.; Unger, K. Chromosomal aberrations in thyroid follicular-cell neoplasia: in the search of novel oncogenes and tumour suppressor genes. Mol. Cell. Endocrinol. 2010, 321, 57–66. [Google Scholar]
- Brzezianska, E.; Pastuszak-Lewandoska, D. A minireview: The role of MAPK/ERK and PI3K/Akt pathways in thyroid follicular cell-derived neoplasm. Front. Biosci. 2011, 16, 422–439. [Google Scholar]
- Rhoden, K.J.; Johnson, C.; Brandao, G.; Howe, J.G.; Smith, B.R.; Tallini, G. Real-time quantitative RT-PCR identifies distinct c-RET, RET/PTC1 and RET/PTC3 expression patterns in papillary thyroid carcinoma. Lab. Invest. 2004, 84, 1557–1570. [Google Scholar]
- Nikiforov, Y.E. Thyroid carcinoma: molecular pathways and therapeutic targets. Mod. Pathol. 2008, 21 (Suppl 2), S37–S43. [Google Scholar]
- Grieco, M.; Santoro, M.; Berlingieri, M.T.; Melillo, R.M.; Donghi, R.; Bongarzone, I.; Pierotti, M.A.; Della Porta, G.; Fusco, A.; Vecchio, G. PTC is a novel rearranged form of the ret proto-oncogene and is frequently detected in vivo in human thyroid papillary carcinomas. Cell 1990, 60, 557–563. [Google Scholar]
- Bongarzone, I.; Monzini, N.; Borrello, M.G.; Carcano, C.; Ferraresi, G.; Arighi, E.; Mondellini, P.; Della Porta, G.; Pierotti, M.A. Molecular characterization of a thyroid tumor-specific transforming sequence formed by the fusion of ret tyrosine kinase and the regulatory subunit RI alpha of cyclic AMP-dependent protein kinase A. Mol. Cell. Biol. 1993, 13, 358–366. [Google Scholar]
- Bongarzone, I.; Butti, M.G.; Coronelli, S.; Borrello, M.G.; Santoro, M.; Mondellini, P.; Pilotti, S.; Fusco, A.; Della Porta, G.; Pierotti, M.A. Frequent activation of ret protooncogene by fusion with a new activating gene in papillary thyroid carcinomas. Cancer Res. 1994, 54, 2979–2985. [Google Scholar]
- Klugbauer, S.; Demidchik, E.P.; Lengfelder, E.; Rabes, H.M. Detection of a novel type of RET rearrangement (PTC5) in thyroid carcinomas after Chernobyl and analysis of the involved RET-fused gene RFG5. Cancer Res. 1998, 58, 198–203. [Google Scholar]
- Nakata, T.; Kitamura, Y.; Shimizu, K.; Tanaka, S.; Fujimori, M.; Yokoyama, S.; Ito, K.; Emi, M. Fusion of a novel gene, ELKS, to RET due to translocation t(10;12)(q11;p13) in a papillary thyroid carcinoma. Genes Chromosomes Cancer 1999, 25, 97–103. [Google Scholar]
- Salassidis, K.; Bruch, J.; Zitzelsberger, H.; Lengfelder, E.; Kellerer, A.M.; Bauchinger, M. Translocation t(10;14)(q11.2:q22.1) fusing the kinetin to the RET gene creates a novel rearranged form (PTC8) of the RET proto-oncogene in radiation-induced childhood papillary thyroid carcinoma. Cancer Res. 2000, 60, 2786–2789. [Google Scholar]
- Klugbauer, S.; Jauch, A.; Lengfelder, E.; Demidchik, E.; Rabes, H.M. A novel type of RET rearrangement (PTC8) in childhood papillary thyroid carcinomas and characterization of the involved gene (RFG8). Cancer Res. 2000, 60, 7028–7032. [Google Scholar]
- Corvi, R.; Berger, N.; Balczon, R.; Romeo, G. RET/PCM-1: A novel fusion gene in papillary thyroid carcinoma. Oncogene 2000, 19, 4236–4242. [Google Scholar]
- Saenko, V.; Rogounovitch, T.; Shimizu-Yoshida, Y.; Abrosimov, A.; Lushnikov, E.; Roumiantsev, P.; Matsumoto, N.; Nakashima, M.; Meirmanov, S.; Ohtsuru, A.; et al. Novel tumorigenic rearrangement, Delta rfp/ret, in a papillary thyroid carcinoma from externally irradiated patient. Mutat Res. 2003, 527, 81–90. [Google Scholar]
- Ciampi, R.; Giordano, T.J.; Wikenheiser-Brokamp, K.; Koenig, R.J.; Nikiforov, Y.E. HOOK3-RET: A novel type of RET/PTC rearrangement in papillary thyroid carcinoma. Endocr. Relat. Cancer 2007, 14, 445–452. [Google Scholar]
- Burrow, A.A.; Williams, L.E.; Pierce, L.C.; Wang, Y.H. Over half of breakpoints in gene pairs involved in cancer-specific recurrent translocations are mapped to human chromosomal fragile sites. BMC Genomics 2009, 10, 59. [Google Scholar]
- Gandhi, M.; Dillon, L.W.; Pramanik, S.; Nikiforov, Y.E.; Wang, Y.H. DNA breaks at fragile sites generate oncogenic RET/PTC rearrangements in human thyroid cells. Oncogene 2010, 29, 2272–2280. [Google Scholar]
- Schroeck, E.; du Manoir, S.; Veldman, T.; Schoell, B.; Wienberg, J.; Ferguson-Smith, M.A.; Ning, Y.; Ledbetter, D.H.; Bar-Am, I.; Soenksen, D.; et al. Multicolor spectral karyotyping of human chromosomes. Science 1996, 273, 494–497. [Google Scholar]
- Weier, H.U.; Tuton, T.B.; Ito, Y.; Chu, L.W.; Lu, C.M.; Baumgartner, A.; Zitzelsberger, H.F.; Weier, J.F. Molecular cytogenetic characterization of chromosome 9-derived material in a human thyroid cancer cell line. Cytogenet. Genome Res. 2006, 114, 284–291. [Google Scholar]
- Bauer, V.L.; Hieber, L.; Schaeffner, Q.; Weber, J.; Braselmann, H.; Huber, R.; Walch, A.; Zitzelsberger, H. Establishment and molecular cytogenetic characterization of a cell culture model of head and neck squamous cell carcinoma (HNSCC). Genes 2010, 1, 388–412. [Google Scholar]
- Weier, H.U.; Kwan, J.; Lu, C.M.; Ito, Y.; Wang, M.; Baumgartner, A.; Hayward, S.W.; Weier, J.F.; Zitzelsberger, H.F. Kinase expression and chromosomal rearrangements in papillary thyroid cancer tissues: investigations at the molecular and microscopic levels. J. Physiol. Pharmacol. 2009, 60 (Suppl 4), 47–55. [Google Scholar]
- Kwan, J.; Baumgartner, A.; Lu, C.M.; Wang, M.; Weier, J.F.; Zitzelsberger, H.F.; Weier, H.U. BAC-FISH assays delineate complex chromosomal rearrangements in a case of post-Chernobyl childhood thyroid cancer. Folia Histochem. Cytobiol. 2009, 47, 135–142. [Google Scholar]
- Kallioniemi, A.; Kallioniemi, O.P.; Sudar, D.; Rutovitz, D.; Gray, J.W.; Waldman, F.; Pinkel, D. Comparative genomic hybridization for molecular cytogenetic analysis of solid tumors. Science 1992, 258, 818–821. [Google Scholar]
- Fiegler, H.; Carr, P.; Douglas, E.J.; Burford, D.C.; Hunt, S.; Scott, C.E.; Smith, J.; Vetrie, D.; Gorman, P.; Tomlinson, I.P.; et al. DNA microarrays for comparative genomic hybridization based on DOP-PCR amplification of BAC and PAC clones. Genes Chromosomes Cancer 2003, 36, 361–374. [Google Scholar]
- Breckpot, J.; Budts, W.; De Zegher, F.; Vermeesch, J.R.; Devriendt, K. Duplication of the TGFBR1 gene causes features of Loeys-Dietz syndrome. Eur. J. Med. Genet. 2010, 53, 408–410. [Google Scholar]
- Zitzelsberger, H.; Bruch, J.; Smida, J.; Hieber, L.; Peddie, C.M.; Bryant, P.E.; Riches, A.C.; Fung, J.; Weier, H.U.; Bauchinger, M. Clonal chromosomal aberrations in simian virus 40-transfected human thyroid cells and in derived tumors developed after in vitro irradiation. Int. J. Cancer 2001, 96, 166–177. [Google Scholar]
- Coulier, F.; Martin-Zanca, D.; Ernst, M.; Barbacid, M. Mechanism of activation of the human trk oncogene. Mol. Cell. Biol. 1989, 9, 15–23. [Google Scholar]
- Hanks, S.K.; Quinn, A.M.; Hunter, T. The protein kinase family: conserved features and deduced phylogeny of the catalytic domains. Science 1988, 241, 42–52. [Google Scholar]
- Easty, D.J.; Ganz, S.E.; Farr, C.J.; Lai, C.; Herlyn, M.; Bennett, D.C. Novel and known protein tyrosine kinases and their abnormal expression in human melanoma. J. Invest. Dermatol. 1993, 101, 679–684. [Google Scholar]
- Easty, D.J.; Herlyn, M.; Bennett, D.C. Abnormal protein tyrosine kinase gene expression during melanoma progression and metastasis. Int. J. Cancer 1995, 60, 129–136. [Google Scholar]
- Lu, C.M.; Kwan, J.; Baumgartner, A.; Weier, J.F.; Wang, M.; Escudero, T.; Munne, S.; Zitzelsberger, H.F.; Weier, H.U. DNA probe pooling for rapid delineation of chromosomal breakpoints. J. Histochem. Cytochem. 2009, 57, 587–597. [Google Scholar]
- Lu, C.M.; Kwan, J.; Weier, J.F.; Baumgartner, A.; Wang, M.; Escudero, T.; Munne, S.; Weier, H.U. Rapid mapping of chromosomal breakpoints: from blood to BAC in 20 days. Folia Histochem. Cytobiol. 2009, 47, 367–375. [Google Scholar]
- Martin-Zanca, D.; Hughes, S.H.; Barbacid, M. A human oncogene formed by the fusion of truncated tropomyosin and protein tyrosine kinase sequences. Nature 1986, 319, 743–748. [Google Scholar]
- Unger, K.; Wienberg, J.; Riches, A.; Hieber, L.; Walch, A.; Brown, A.; O'Brien, P.C.; Briscoe, C.; Gray, L.; Rodriguez, E.; et al. Novel gene rearrangements in transformed breast cells identified by high-resolution breakpoint analysis of chromosomal aberrations. Endocr. Relat. Cancer 2010, 17, 87–98. [Google Scholar]
- Loeys, B.L.; Schwarze, U.; Holm, T.; Callewaert, B.L.; Thomas, G.H.; Pannu, H.; De Backer, J.F.; Oswald, G.L.; Symoens, S.; Manouvrier, S.; et al. Aneurysm syndromes caused by mutations in the TGF-beta receptor. N. Engl. J. Med. 2006, 355, 788–798. [Google Scholar]
- Harper, M.E.; Saunders, G.F. Localization of single copy DNA sequences of G-banded human chromosomes by in situ hybridization. Chromosoma 1981, 83, 431–439. [Google Scholar]
- Shaffer, L.; Tommerup, N. An International System for Human Cytogenetic Nomenclature; S. Karger: Basel, Switzerland, 2005. [Google Scholar]
- Kallioniemi, O.P.; Kallioniemi, A.; Piper, J.; Isola, J.; Waldman, F.M.; Gray, J.W.; Pinkel, D. Optimizing comparative genomic hybridization for analysis of DNA sequence copy number changes in solid tumors. Genes Chromosomes Cancer 1994, 10, 231–243. [Google Scholar]
- Isola, J.J.; Kallioniemi, O.P.; Chu, L.W.; Fuqua, S.A.; Hilsenbeck, S.G.; Osborne, C.K.; Waldman, F.M. Genetic aberrations detected by comparative genomic hybridization predict outcome in node-negative breast cancer. Am. J. Pathol. 1995, 147, 905–911. [Google Scholar]
- Veldman, T.; Vignon, C.; Schrock, E.; Rowley, J.D.; Ried, T. Hidden chromosome abnormalities in haematological malignancies detected by multicolour spectral karyotyping. Nat. Genet. 1997, 15, 406–410. [Google Scholar]
- Shizuya, H.; Birren, B.; Kim, U.J.; Mancino, V.; Slepak, T.; Tachiiri, Y.; Simon, M. Cloning and stable maintenance of 300-kilobase-pair fragments of human DNA in Escherichia coli using an F-factor-based vector. Proc. Natl. Acad. Sci. USA 1992, 89, 8794–8797. [Google Scholar]
- Ioannou, P.A.; Amemiya, C.T.; Garnes, J.; Kroisel, P.M.; Shizuya, H.; Chen, C.; Batzer, M.A.; de Jong, P.J. A new bacteriophage P1-derived vector for the propagation of large human DNA fragments. Nat. Genet. 1994, 6, 84–89. [Google Scholar]
- Weier, H.U.; Kleine, H.D.; Gray, J.W. Labeling of the centromeric region on human chromosome 8 by in situ hybridization. Hum. Genet. 1991, 87, 489–494. [Google Scholar]
- Weier, H.U.; Fung, J.; Lersch, R.A. Assignment of protooncogene MERTK (a.k.a. c-mer) to human chromosome 2q14.1 by in situ hybridization. Cytogenet. Cell Genet. 1999, 84, 91–92. [Google Scholar]
- Osoegawa, K.; Mammoser, A.G.; Wu, C.; Frengen, E.; Zeng, C.; Catanese, J.J.; de Jong, P.J. A bacterial artificial chromosome library for sequencing the complete human genome. Genome Res. 2001, 11, 483–496. [Google Scholar]
- Maniatis, T.; Fritsch, E.F.; Sambrook, J. Molecular Cloning: A Laboratory Handbook; Cold Spring Harbor Laboratory: Cold Spring Harbor, NY, USA, 1986. [Google Scholar]
- Birnboim, H.C.; Doly, J. A rapid alkaline extraction procedure for screening recombinant plasmid DNA. Nucleic Acids Res. 1979, 7, 1513–1523. [Google Scholar]
- Weier, H.U.; George, C.X.; Greulich, K.M.; Samuel, C.E. The interferon-inducible, double-stranded RNA-specific adenosine deaminase gene (DSRAD) maps to human chromosome 1q21.1-21.2. Genomics 1995, 30, 372–375. [Google Scholar]
- Fung, J.; Weier, H.U.; Goldberg, J.D.; Pedersen, R.A. Multilocus genetic analysis of single interphase cells by spectral imaging. Hum. Genet. 2000, 107, 615–622. [Google Scholar]
- Fung, J.; Munne, S.; Weier, H.U. Detection of chromosome translocation products in single interphase cell nuclei. In Methods in Cell Biology (Part B, Cytometry), 3rd ed.; Darzynkiewicz, Z., Chrissman, H.A., Robinson, J.P., Eds.; Academic Press: San Diego, CA, USA, 2001; Volume 64, pp. 98–117. [Google Scholar]
- Knight, S.J.; Lese, C.M.; Precht, K.S.; Kuc, J.; Ning, Y.; Lucas, S.; Regan, R.; Brenan, M.; Nicod, A.; Lawrie, N.M.; et al. An optimized set of human telomere clones for studying telomere integrity and architecture. Am. J. Hum. Genet. 2000, 67, 320–332. [Google Scholar]
© 2011 by the authors; licensee MDPI, Basel, Switzerland. This article is an open access article distributed under the terms and conditions of the Creative Commons Attribution license (http://creativecommons.org/licenses/by/3.0/).
Share and Cite
Weier, H.-U.G.; Ito, Y.; Kwan, J.; Smida, J.; Weier, J.F.; Hieber, L.; Lu, C.-M.; Lehmann, L.; Wang, M.; Kassabian, H.J.; et al. Delineating Chromosomal Breakpoints in Radiation-Induced Papillary Thyroid Cancer. Genes 2011, 2, 397-419. https://doi.org/10.3390/genes2030397
Weier H-UG, Ito Y, Kwan J, Smida J, Weier JF, Hieber L, Lu C-M, Lehmann L, Wang M, Kassabian HJ, et al. Delineating Chromosomal Breakpoints in Radiation-Induced Papillary Thyroid Cancer. Genes. 2011; 2(3):397-419. https://doi.org/10.3390/genes2030397
Chicago/Turabian StyleWeier, Heinz-Ulrich G., Yuko Ito, Johnson Kwan, Jan Smida, Jingly F. Weier, Ludwig Hieber, Chun-Mei Lu, Lars Lehmann, Mei Wang, Haig J. Kassabian, and et al. 2011. "Delineating Chromosomal Breakpoints in Radiation-Induced Papillary Thyroid Cancer" Genes 2, no. 3: 397-419. https://doi.org/10.3390/genes2030397