1. Introduction
Multiple emulsions, first described by Seifritz [
1], consist of droplets, which are dispersed in a continuous phase and contain smaller dispersed droplets themselves. One of the most common types of multiple emulsions are water-in-oil-in-water (w/o/w) double emulsions, which have received considerable attention as they are promising systems for drug delivery [
2,
3,
4], and industrial applications in the areas of cosmetics [
5] and food products [
6].
Based on the historical invention of Dittrich and Göhde [
7], modern flow cytometers enable the analysis of scattering, multi-color fluorescence signals of analytes (cells, but also man-made entities such as droplets and microspheres). For example, determination of both the size of oil droplets (based on forward and side scattering intensities) and the amount of fluorophore present therein was achieved by flow cytometry [
8]. In fluorescence-activated cell sorting (FACS) instruments several thousand microscopic objects per second can be screened and “hits” selected and isolated. Furthermore, the groups of Tawfik and Griffiths [
9,
10,
11,
12,
13] have used w/o/w double emulsions as compartments creating a genotype-phenotype linkage in directed protein evolution where identification of catalyst “hits” is based on emergence of product fluorescence and library members exhibiting activity are selected by flow cytometry [
14,
15].
In contrast to simple water-in-oil (w/o) emulsions, w/o/w double emulsions do not only provide aqueous compartments but also an aqueous carrier fluid, rendering the emulsion non-viscous and compatible with most flow cytometry set-ups. Encapsulation of to-be-analyzed entities in w/o/w droplet containers has further advantages: (i) shielding of sensitive biological structures from forces exerted by the sheath fluid; (ii) preservation of the linkage between an individual microorganism and the substances it secretes allowing for a screening of metabolites; and (iii) the opportunity to perform in vitro analyses of biomolecules detached from the respective microorganisms.
However, so far only w/o/w samples, prepared by simple bulk emulsification techniques, have been used for flow cytometry [
9,
10,
11,
12]. The resulting droplets are heterogeneous in terms of size and internal structure, which has several negative implications regarding analysis and sorting. The unselective emulsification of the primary w/o emulsion in the second aqueous phase leads to a high number of empty oil droplets, which need to be separated from “active” double emulsion droplets. As a result, the sorting stringency is compromised and very few examples of actual selections in this format exist. Alternatively, directed evolution experiments in monodisperse single emulsion droplets have been accomplished [
16,
17] on-chip by microfluidic fluorescence-activated droplet sorting [
18]. Clones with slightly improved activities could be selected that would have not been detectable in polydisperse double emulsion sorts.
Furthermore, when multiple aqueous droplets are encapsulated into one oil droplet, they cannot be individually sorted, which lowers the purity of the separated sample fractions. Multiple core droplets can also cause problems when they pass the laser spot of the flow cytometer at the same time. In this case, their scattering and fluorescence signals would overlay and distort the sorting. Moreover, the emission of fluorescence signals depends on the concentration of the fluorophore inside the respective core droplet. However, size variations of the inner droplets in a polydisperse sample have a strong influence on fluorophore concentrations. These problems can be addressed by using monodisperse and structurally uniform w/o/w droplets.
2. Experimental Section
2.1. Materials
Unless otherwise stated, all chemicals were obtained from Sigma-Aldrich (St. Luis, MO, USA) and used as received without further purification. Milli-Q water (Millipore, Billerica, MA, USA) was used throughout all experiments.
2.2. Microfluidic Device Design
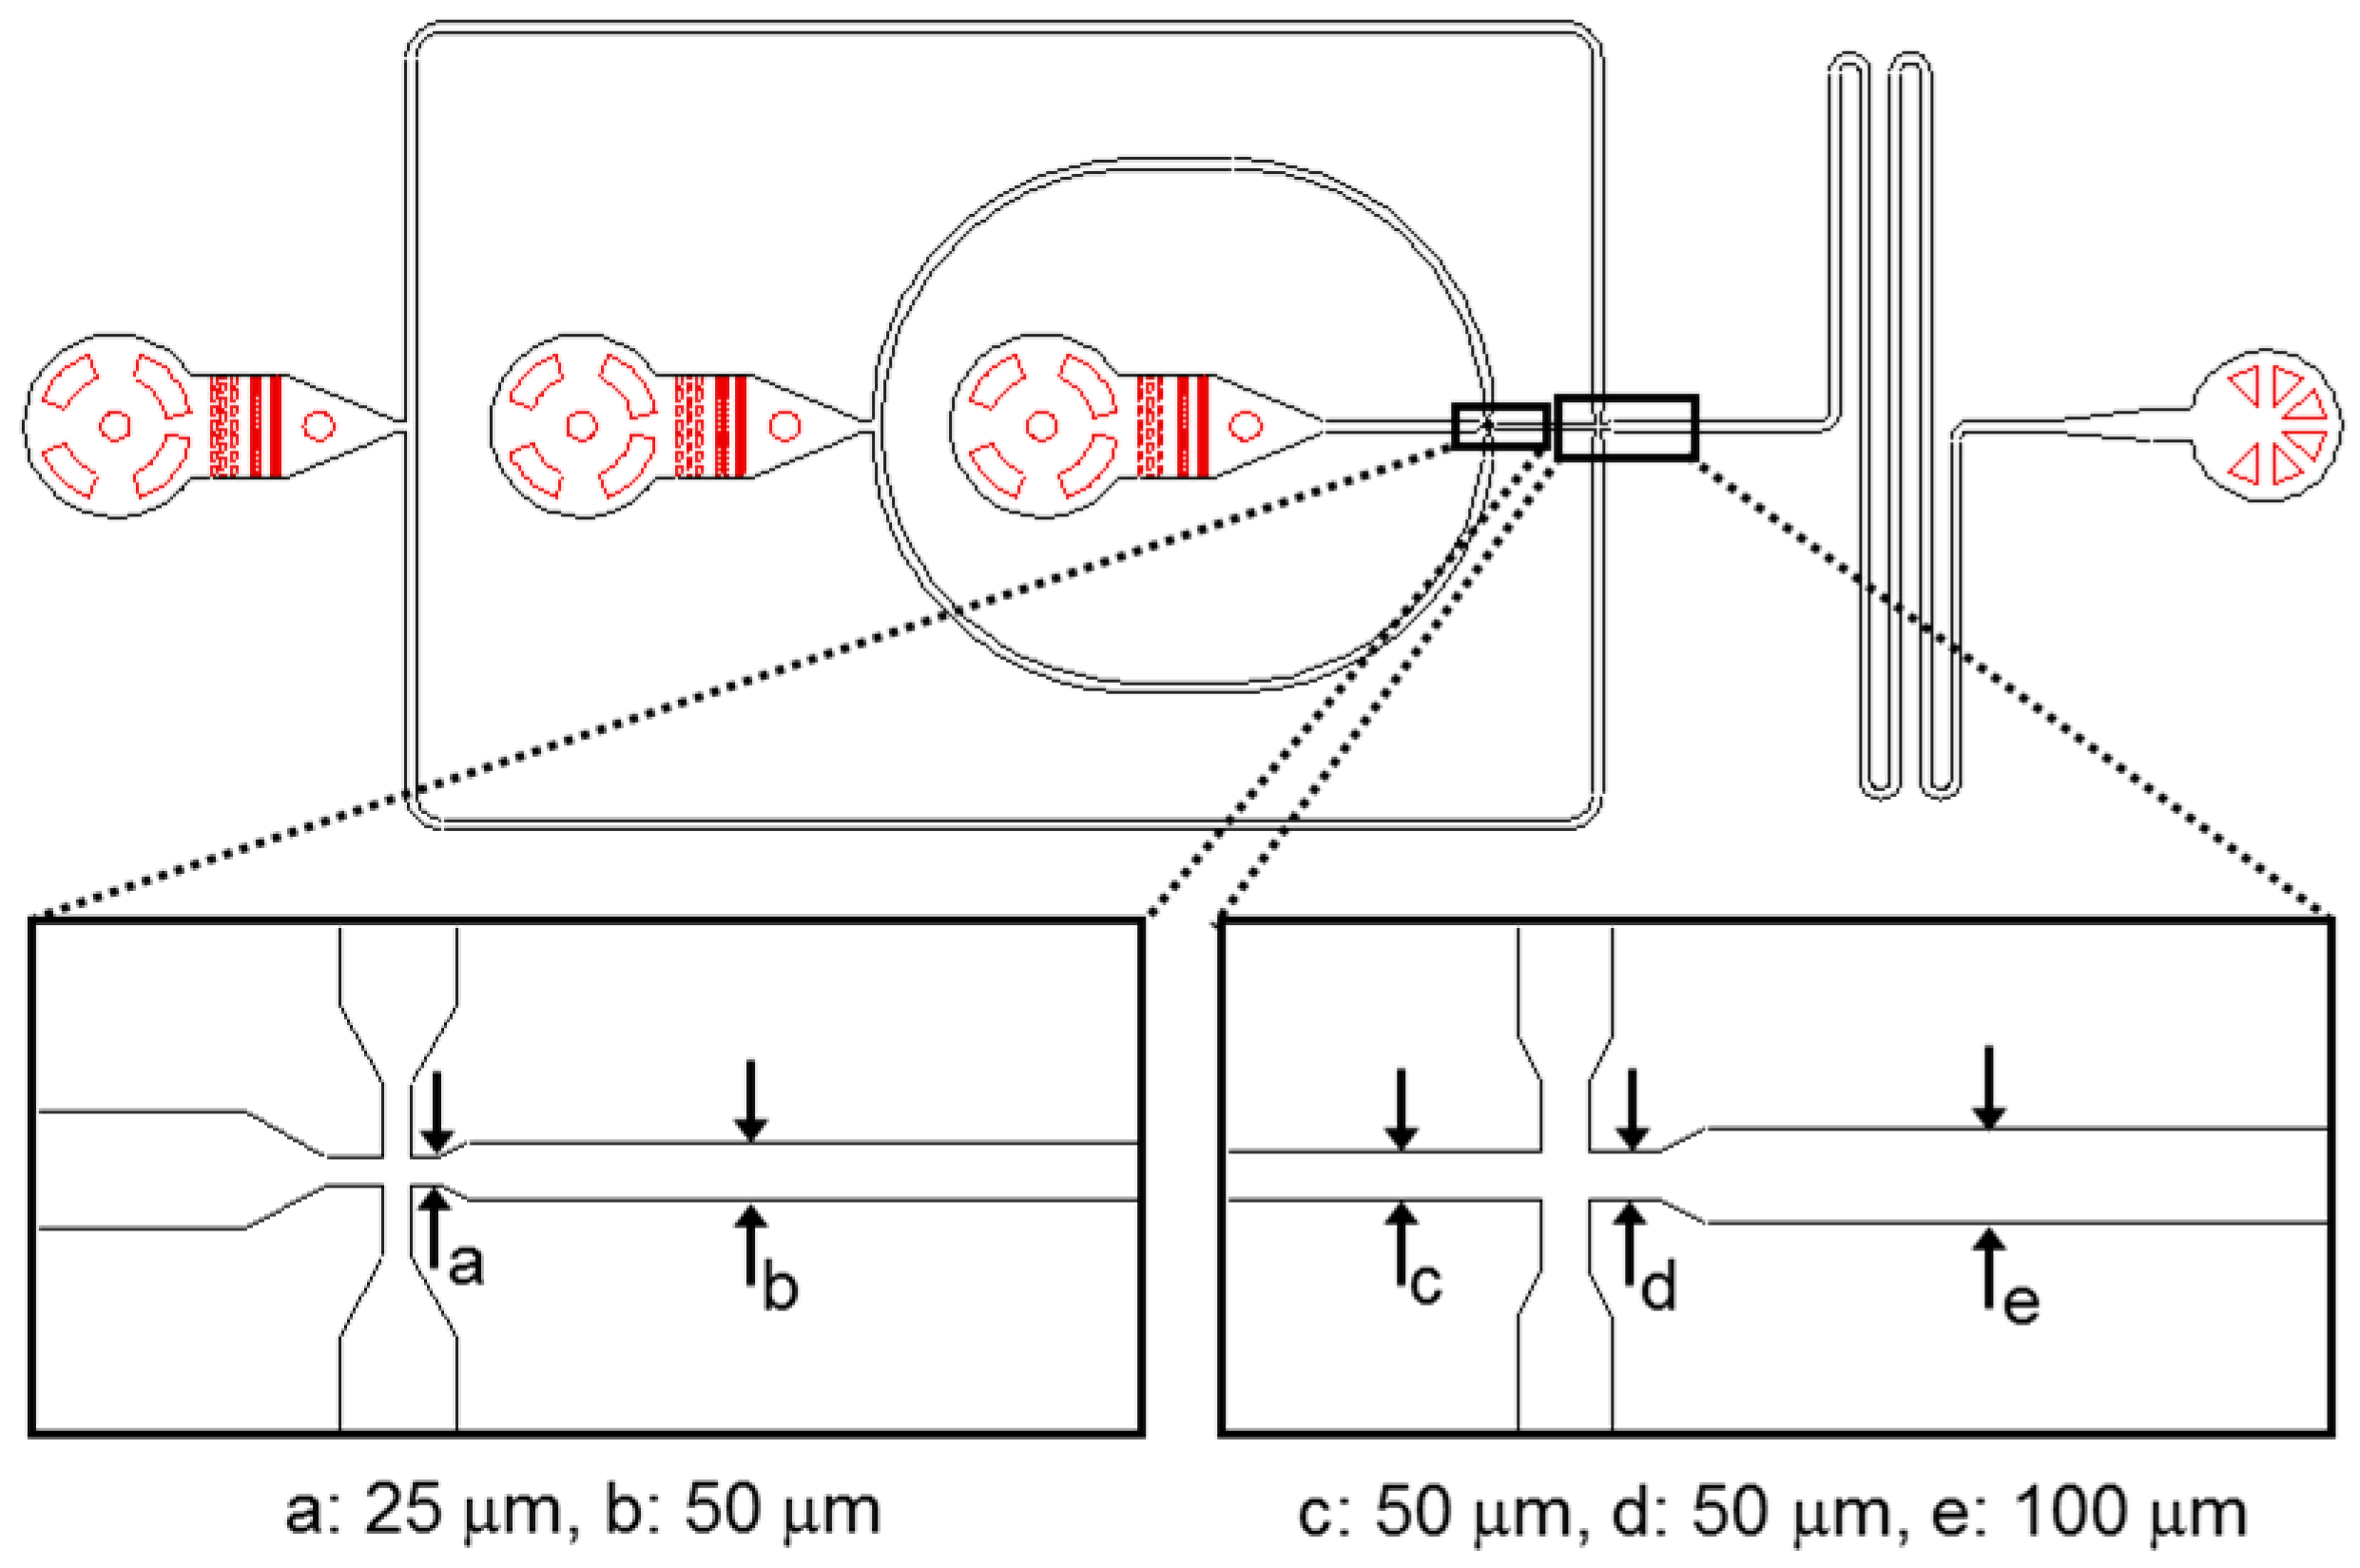
For the generation of w/o/w double emulsion samples microfluidic devices with a channel height of 25 μm were used. The corresponding device design is shown in
Figure 1.
Figure 1.
Design of the microfluidic device used for the production of water-in-oil-in-water (w/o/w) double emulsion samples.
Figure 1.
Design of the microfluidic device used for the production of water-in-oil-in-water (w/o/w) double emulsion samples.
2.3. Microfluidic Device Fabrication
Microfluidic devices were fabricated via conventional soft lithographic techniques [
19,
20]. Microchannel architectures were designed with AutoCAD (Autodesk, San Rafael, CA, USA) and transferred to high resolution photomasks fabricated on transparencies (Micro Lithography Services, South Woodham Ferrers, UK). The negative photoresist SU-8 2025 (MicroChem, Newton, MA, USA) was spin-coated onto 3 inch silicon wafers (Compart Technology, Tamworth, UK) and patterned using a MJB4 mask aligner (Süss MicroTec, Garching, Germany). Development was accomplished by immersion into 1-methoxy-2-propyl acetate.
A commercially available Sylgard 184 PDMS kit (Dow Corning, Midland, MI, USA), containing the poly(dimethylsiloxane) (PDMS) pre-polymer and a cross-linker, was used in the recommended ratio of 10:1 (w/w). The mixture was poured on top of the patterned silicon wafers and degassed. After curing at 80 °C for 10 h the PDMS replica was cut out and peeled off the wafers. Inlets and outlets were stamped out using a biopsy punch (Kai Industries, Tokyo, Japan) with an outer diameter of 1 mm. The microfluidic devices were assembled by joining the PDMS replica and a microscope glass slide. Bonding strength was provided by pre-treating both contact surfaces with oxygen plasma for 8 s in a Femto plasma cleaner (Diener electronic, Ebhausen, Germany).
Storage devices were fabricated following the same process. Instead of patterned wafers, microscope cover slips with a thickness of ca. 150 μm were glued onto glass slides and used as casting molds.
2.4. Channel Surface Modification
In order to produce partially hydrophilic and partially hydrophobic microfluidic devices, we followed a two-step procedure that has been described elsewhere [
21]. At first, hydrophilic channel coatings in the downstream part of a device were produced via layer-by-layer (LbL) deposition of a polyelectrolyte multilayer onto the microchannel surface directly after device assembly [
22,
23]. To this end, we injected a polyelectrolyte sequence into one inlet of the device (rightmost inlet in
Figure 1) and flushed it through the downstream part of the chip at a constant flow rate of 50 μL h
−1. Simultaneously we blocked the upstream part of the device by streaming de-ionized water (DIW) through another inlet (second inlet from left in
Figure 1) at a flow rate of 100 μL h
−1.
In the second step, we applied a localized hydrophobic surface treatment by flushing the commercially available water repellent agent Aquapel (PPG Industries, Pittsburgh, PA, USA) through the upstream part of the device (using the second inlet from left in
Figure 1) at 20 μL h
−1. The hydrophilic coating of the downstream channel regions was protected by co-injecting FC-40 fluorous oil (3M, St. Paul, MN, USA) at 100 μL h
−1 into the device (using the rightmost inlet in
Figure 1).
2.5. Microfluidic Experiments
For w/o/w double emulsion formation four inner phases were used: (i) phosphate buffered saline (PBS) buffer; (ii) 0.025 μM fluorescein isothiocyanate (FITC) in PBS; (iii) 0.25 μM FITC in PBS; and (iv) 2.5 μM FITC in PBS. HFE-7500 (3M, St. Paul, MN, USA) containing 2% (w/w) of the surfactant Pico-Surf (Sphere Fluidics, Cambridge, UK) was applied as the fluorous intermediate phase. As the external phase DIW containing 1% (w/w) sodium dodecyl sulfate (SDS) was used. Aqueous and oil phases were injected into microfluidic devices via PE tubes (Becton Dickinson, Franklin Lakes, NJ, USA). In all microfluidic experiments PHD 2000 syringe pumps (Harvard Apparatus, Holliston, MA, USA) were used to inject liquids at constant flow rates between 200 μL h−1 and 350 μL h−1. Droplet formation on-chip as well as emulsion samples inside storage devices were imaged using a monochrome Phantom v7.2 camera (Vision Research, Wayne, NJ, USA), attached to an IX71 inverted microscope (Olympus, Tokyo, Japan).
2.6. Fluorescence Microscopy Analysis
Droplet samples of ca. 2 μL were transferred via polyethylene (PE) tubes (Becton Dickinson, Franklin Lakes, NJ, USA) into storage devices with a reservoir height of 150 μm. Fluorescence micrographs were obtained using a blue LED (Thorlabs, Newton, NJ, USA), emitting at a wavelength of 470 nm, as a light source and an EMCCD iXonEM+ DU 897 camera (Andor Technology, Belfast, UK), coupled with an IX71 inverted optical microscope (Olympus), for detection.
2.7. Flow Cytometeric Analysis
Double emulsion samples were analyzed with a FACScan (Becton Dickinson, Franklin Lakes, NJ, USA) flow cytometer, equipped with a 488 nm laser as illumination source and five detectors-forward scatter (FSC), side scatter (SSC) and three fluorescence channels FL1 to FL3. FL1 with the corresponding 515–545 nm band pass filter was used to detect fluorescence signals of double emulsion droplets, containing different concentrations of FITC fluorescence dye. In FSC vs. SSC measurements a gate R1, capturing the main population, was set and applied for fluorescence measurements. Measurements were stopped after measuring >10,000 events inside R1.
3. Results and Discussion
Here we use state-of-the-art microfluidics technology for the well-controlled production of monodisperse w/o/w double emulsion droplets, comprising an aqueous core and a fluorocarbon oil shell. Being both hydrophobic and lipophobic, the fluorocarbon layer is an efficient diffusion barrier preventing cross-contamination between individual w/o/w double emulsion droplets, which would distort flow cytometry analysis [
24]. We manufactured PDMS/glass hybrid devices, exhibiting double flow-focusing geometry [
25], via standard soft lithography [
19,
20]. The integration of two consecutive droplet generators in a single microfluidic chip is better suited for the synchronization of the two droplet formation processes,
i.e., the generation of the primary w/o emulsion and the w/o/w double emulsion, than two-chip systems [
26]. However, for double flow-focusing chips surface modification becomes more challenging as it has to be applied in a spatially defined manner. We solved this problem by following a simple and straightforward two-step process, which we have described in detail elsewhere [
21]. In contrast to other approaches reported in literature [
27,
28], our technique does not require lithographic masks and employs only commercially available reagents without further preparation.
As shown in
Figure 2, we used our microfluidic platform to generate a series of w/o/w double emulsion samples, differing from each other in terms of concentration of the fluorescent dye FITC in the inner aqueous droplets. The emission of fluorescence of FITC is strongly dependent on the pH value of the surrounding solution [
29]. Therefore, FITC solutions were prepared with PBS (pH ~7.5). Four solutions were used as inner aqueous phases and subsequently injected into the device at flow rates of 200 μL h
−1: (i) pure PBS buffer; (ii) 0.025 μM solution of FITC in PBS; (iii) 0.25 μM FITC in PBS; and (iv) 2.5 μM FITC in PBS. The hydrofluoroether HFE-7500, containing 2% (w/w) of the commercially available surfactant Pico-Surf, was injected at 300 μL h
−1 as the intermediate phase. As the outer aqueous phase we used a 1% (w/w) solution of SDS in DIW. Injection of this solution into the device occurred at a flow rate of 350 μL h
−1.
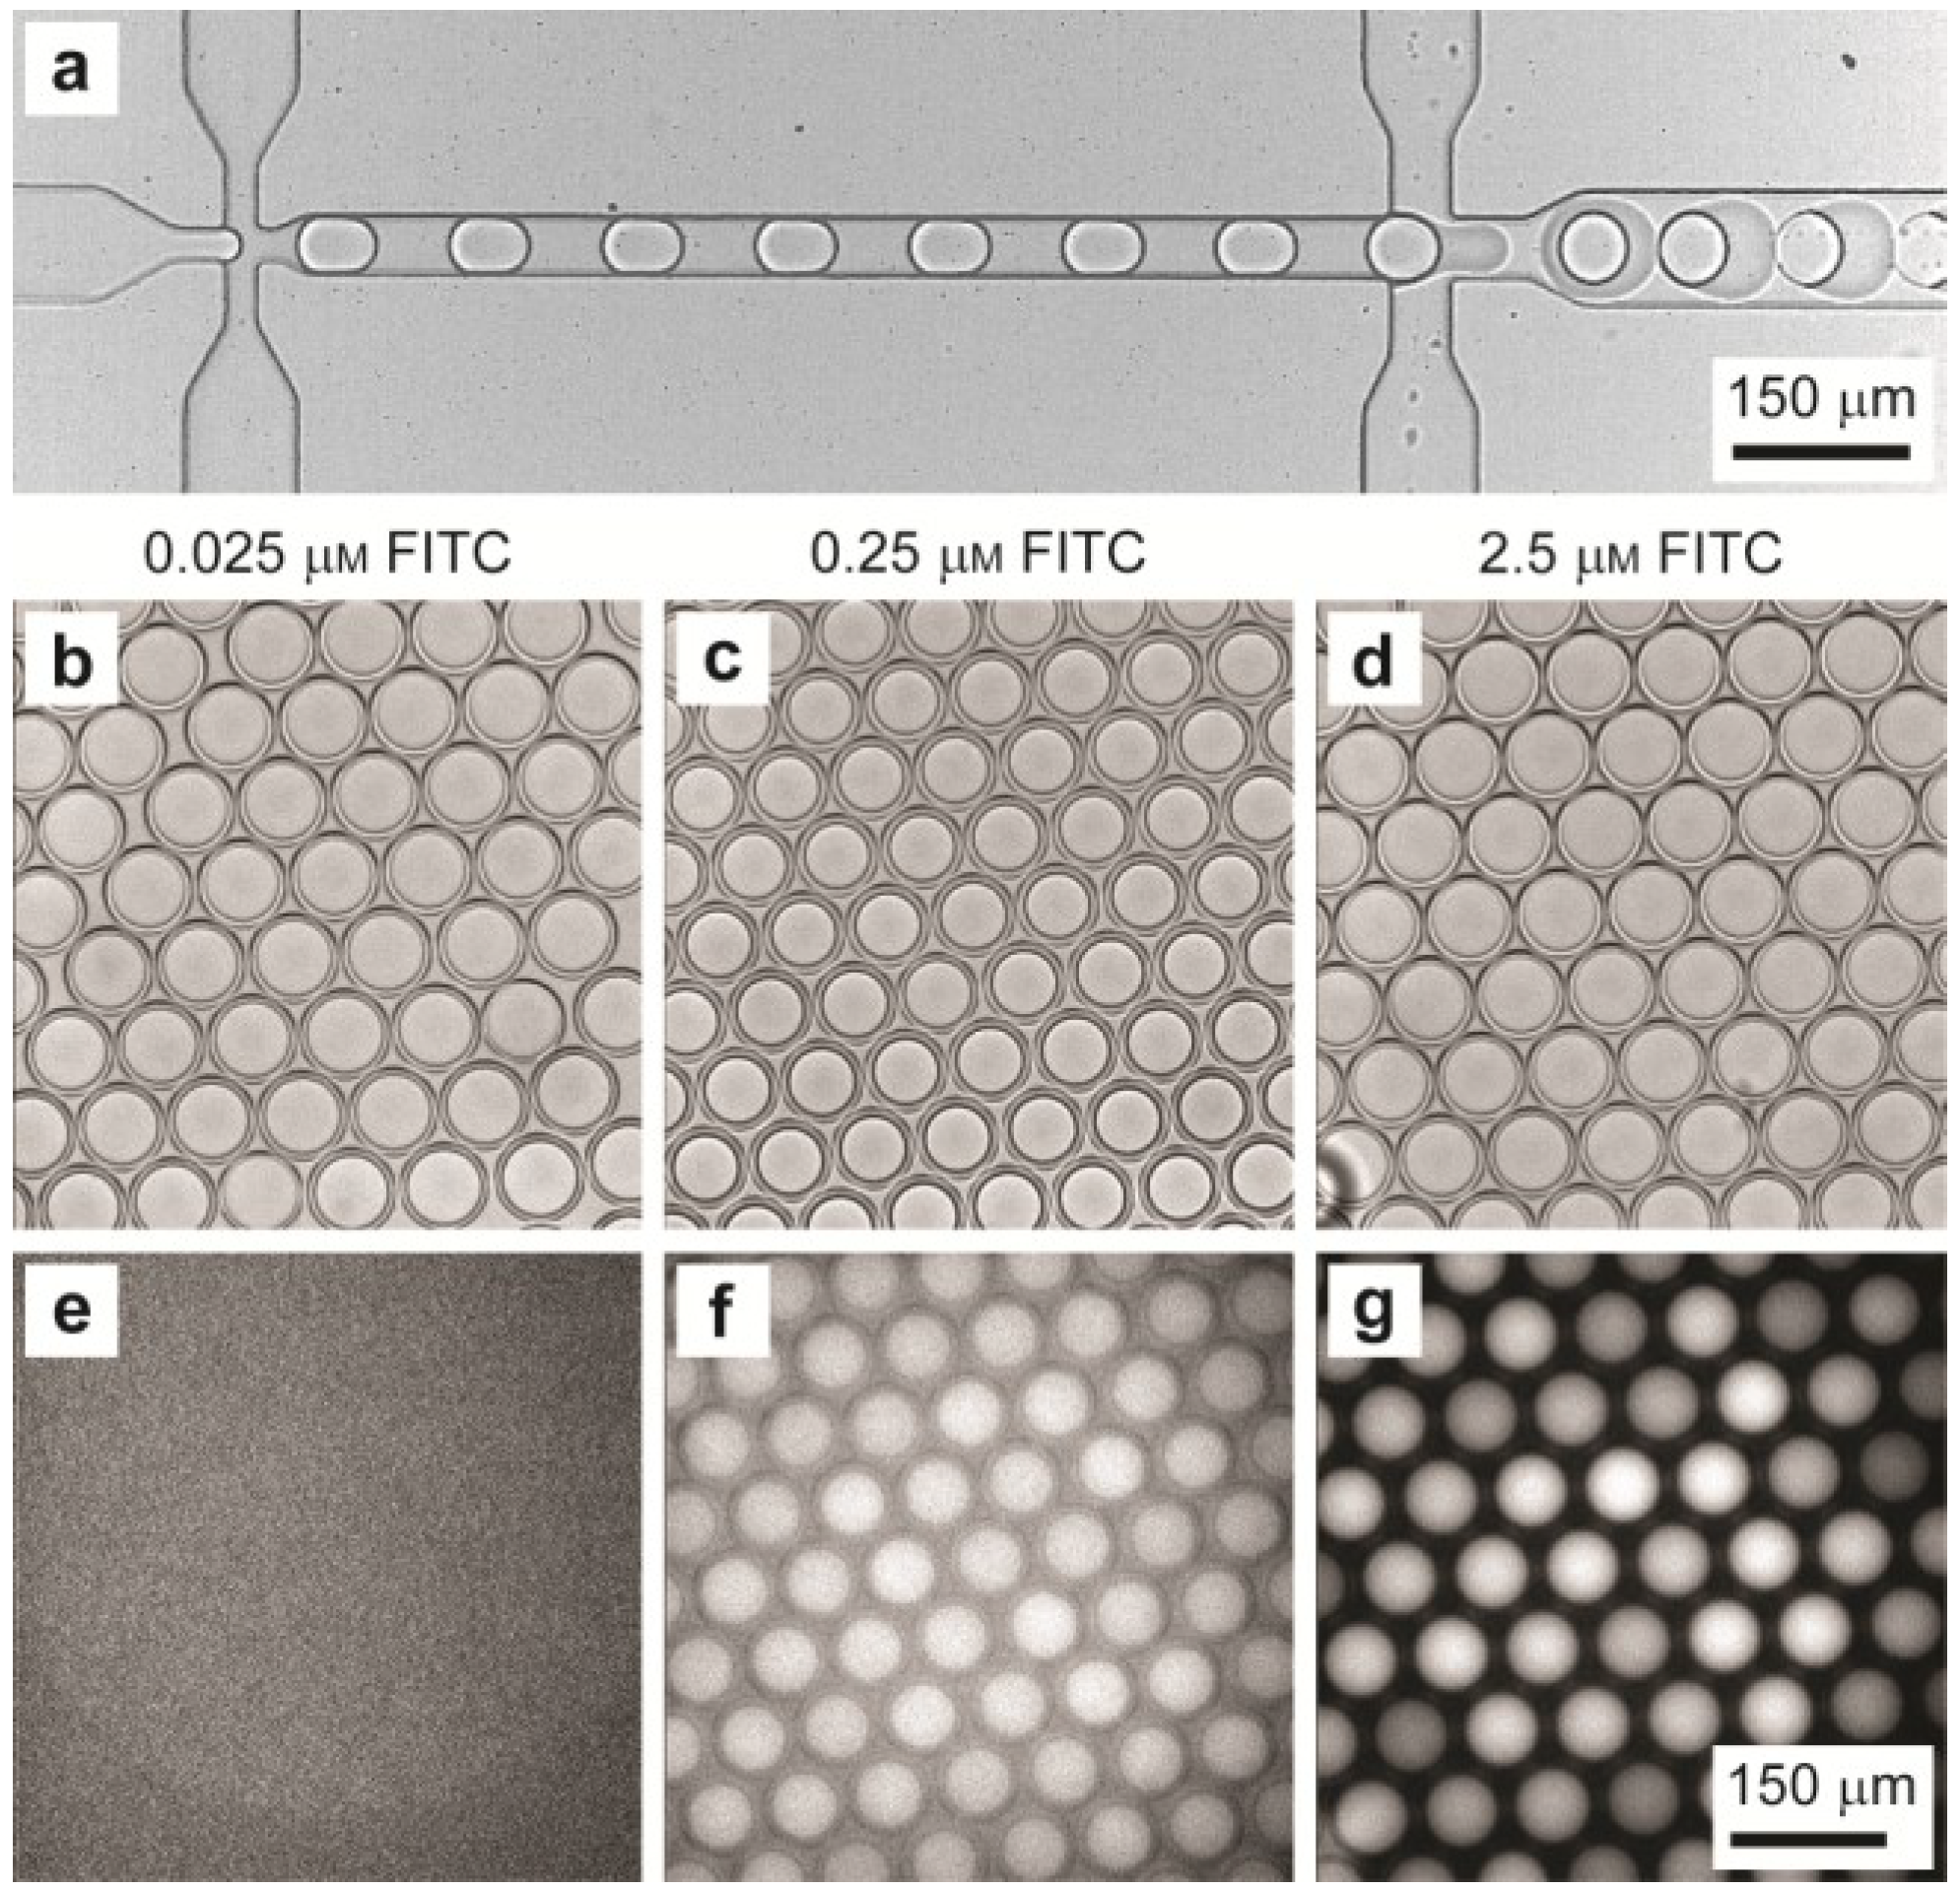
Figure 2a refers to the production of the un-dyed sample, but the observations are in perfect agreement with the other microfluidic experiments. At the first flow-focusing junction primary o/w droplets were formed at 600 Hz, which were encapsulated further downstream at the second flow-focusing region into w/o/w double emulsion droplets with the same frequency. Please refer to the Supplementary Material in the Electronic Supporting Information. The Supplementary Material shows the on-chip production of the un-dyed w/o/w double emulsion. As the inner phase pure PBS buffer is injected at a flow rate of 200 μL h
−1. HFE-7500 containing 2
wt% Picosurf surfactant is applied as the middle phase at 300 μL h
−1. As the outer phase DIW containing 1
wt% SDS is streamed through the device at 350 μL h
−1. Monodisperse w/o/w double emulsion droplets are formed at a frequency of 600 Hz.
Figure 2.
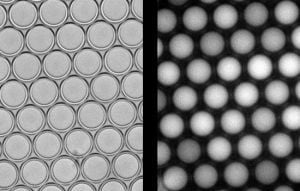
Production and analysis of w/o/w double emulsion samples with varying fluorescein isothiocyanate (FITC) contents. (a) Formation of w/o/w droplets in a microfluidic device with double flow-focusing geometry; (b–d) Brightfield micrographs of w/o/w emulsion samples inside storage devices. The inner droplets contain 0.025 μM, 0.25 μM or 2.5 μM FITC in PBS, respectively; and (e–g) Corresponding fluorescence micrographs. Fluorescence signals above background are present for 0.25 μM FITC droplets and, even stronger, for 2.5 μM FITC droplets.
Figure 2.
Production and analysis of w/o/w double emulsion samples with varying fluorescein isothiocyanate (FITC) contents. (a) Formation of w/o/w droplets in a microfluidic device with double flow-focusing geometry; (b–d) Brightfield micrographs of w/o/w emulsion samples inside storage devices. The inner droplets contain 0.025 μM, 0.25 μM or 2.5 μM FITC in PBS, respectively; and (e–g) Corresponding fluorescence micrographs. Fluorescence signals above background are present for 0.25 μM FITC droplets and, even stronger, for 2.5 μM FITC droplets.
For qualitative comparison we injected the three FITC-containing samples into separate storage devices and compared brightfield images (
Figure 2b–d) and corresponding fluorescence micrographs (
Figure 2e–g). The brightfield micrographs show that double emulsion droplets of all samples formed hexagonal close-packed monolayers inside the respective reservoir, which is an indicator for droplet monodispersity. Concerning the emission of fluorescence, no signal above background was detected for the 0.025 μM sample, indicating that this FITC concentration was below the detection limit of the fluorescence microscope setup used in this study. In contrast, a weak signal was obtained from the 0.25 μM FITC droplets, and at the highest FITC concentration of 2.5 μM strong fluorescence emission from the inner aqueous phase was detected. These results show a correlation between the dye content in the inner aqueous phase and the intensity of fluorescence emission, along with its localization in the core droplets. The absence of fluorescence emission from the outer aqueous phase suggests that leakage,
i.e., diffusion of the fluorophore from the inner droplets into the external carrier phase, was efficiently prevented by the fluorous intermediate phase. This is a crucial prerequisite for the application of double emulsion droplets as discrete micro-compartments.
In order to obtain a quantitative measure for the quality of the four w/o/w double emulsion samples, a droplet size-analysis was performed in each case. To this end, a small amount (
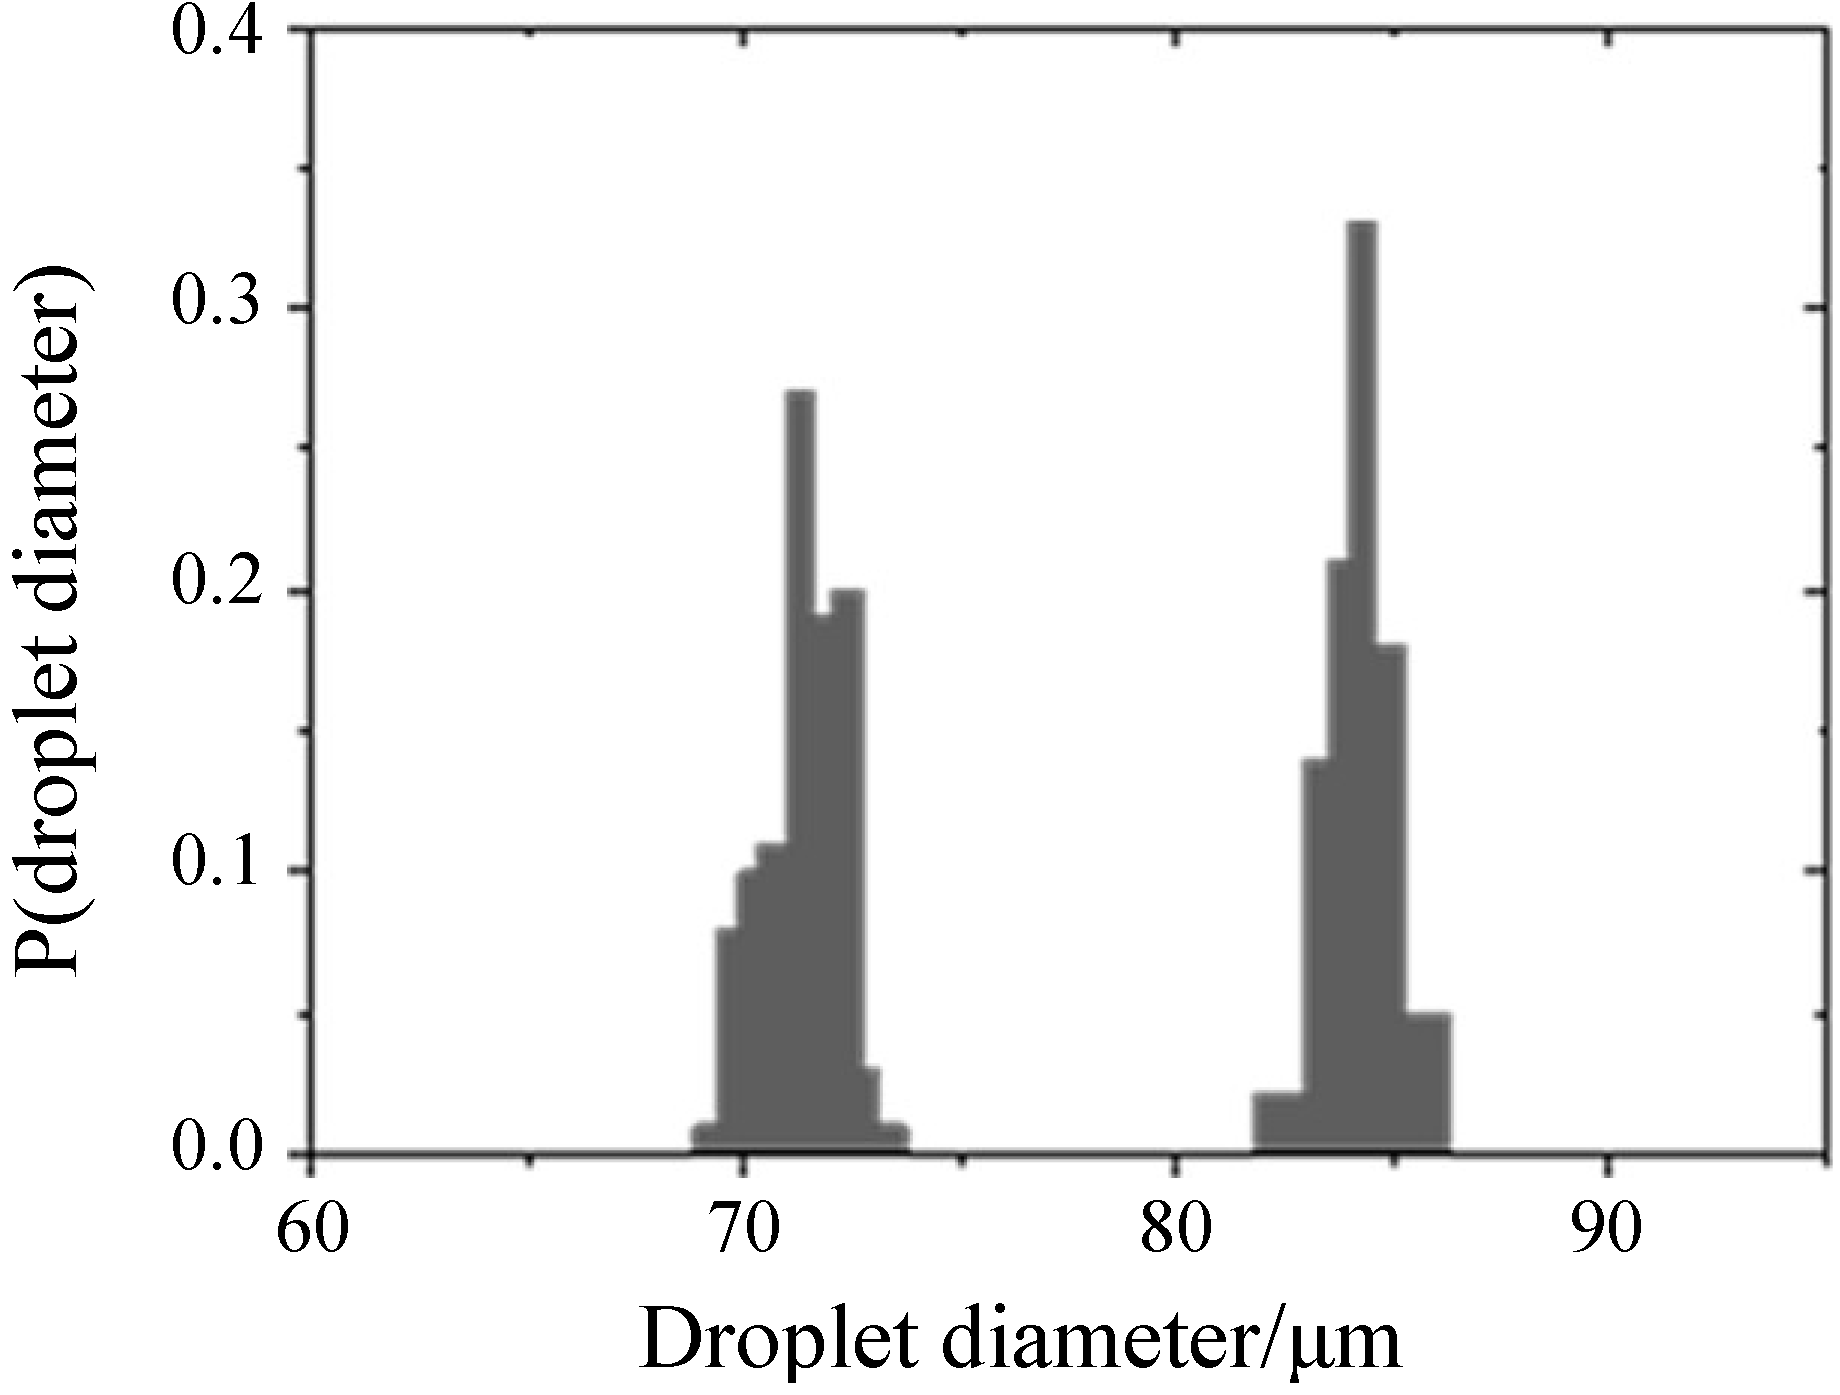
ca. 5 μL) of the respective emulsion was loaded into a piece of PE tubing and subsequently injected into a storage device. The histogram in
Figure 3 refers to the un-dyed sample, but the observations are in good agreement with the other microfluidic experiments. The droplet diameter distribution, determined for 100 double emulsion droplets, is extremely narrow for both the inner water and the outer oil droplets and exhibits mean values of 71.4 μm and 84.2 μm, respectively. As the standard deviations—0.9 μm for the inner and 0.8 μm for the outer droplets—are only 1.3% and 1.0% of the corresponding mean diameters, the double emulsion sample is considered monodisperse regarding both the inner and the outer droplets.
Figure 3.
Droplet diameter distribution of the un-dyed w/o/w double emulsion, revealing the monodispersity of the sample both for the inner water and the outer oil droplets.
Figure 3.
Droplet diameter distribution of the un-dyed w/o/w double emulsion, revealing the monodispersity of the sample both for the inner water and the outer oil droplets.
As shown in
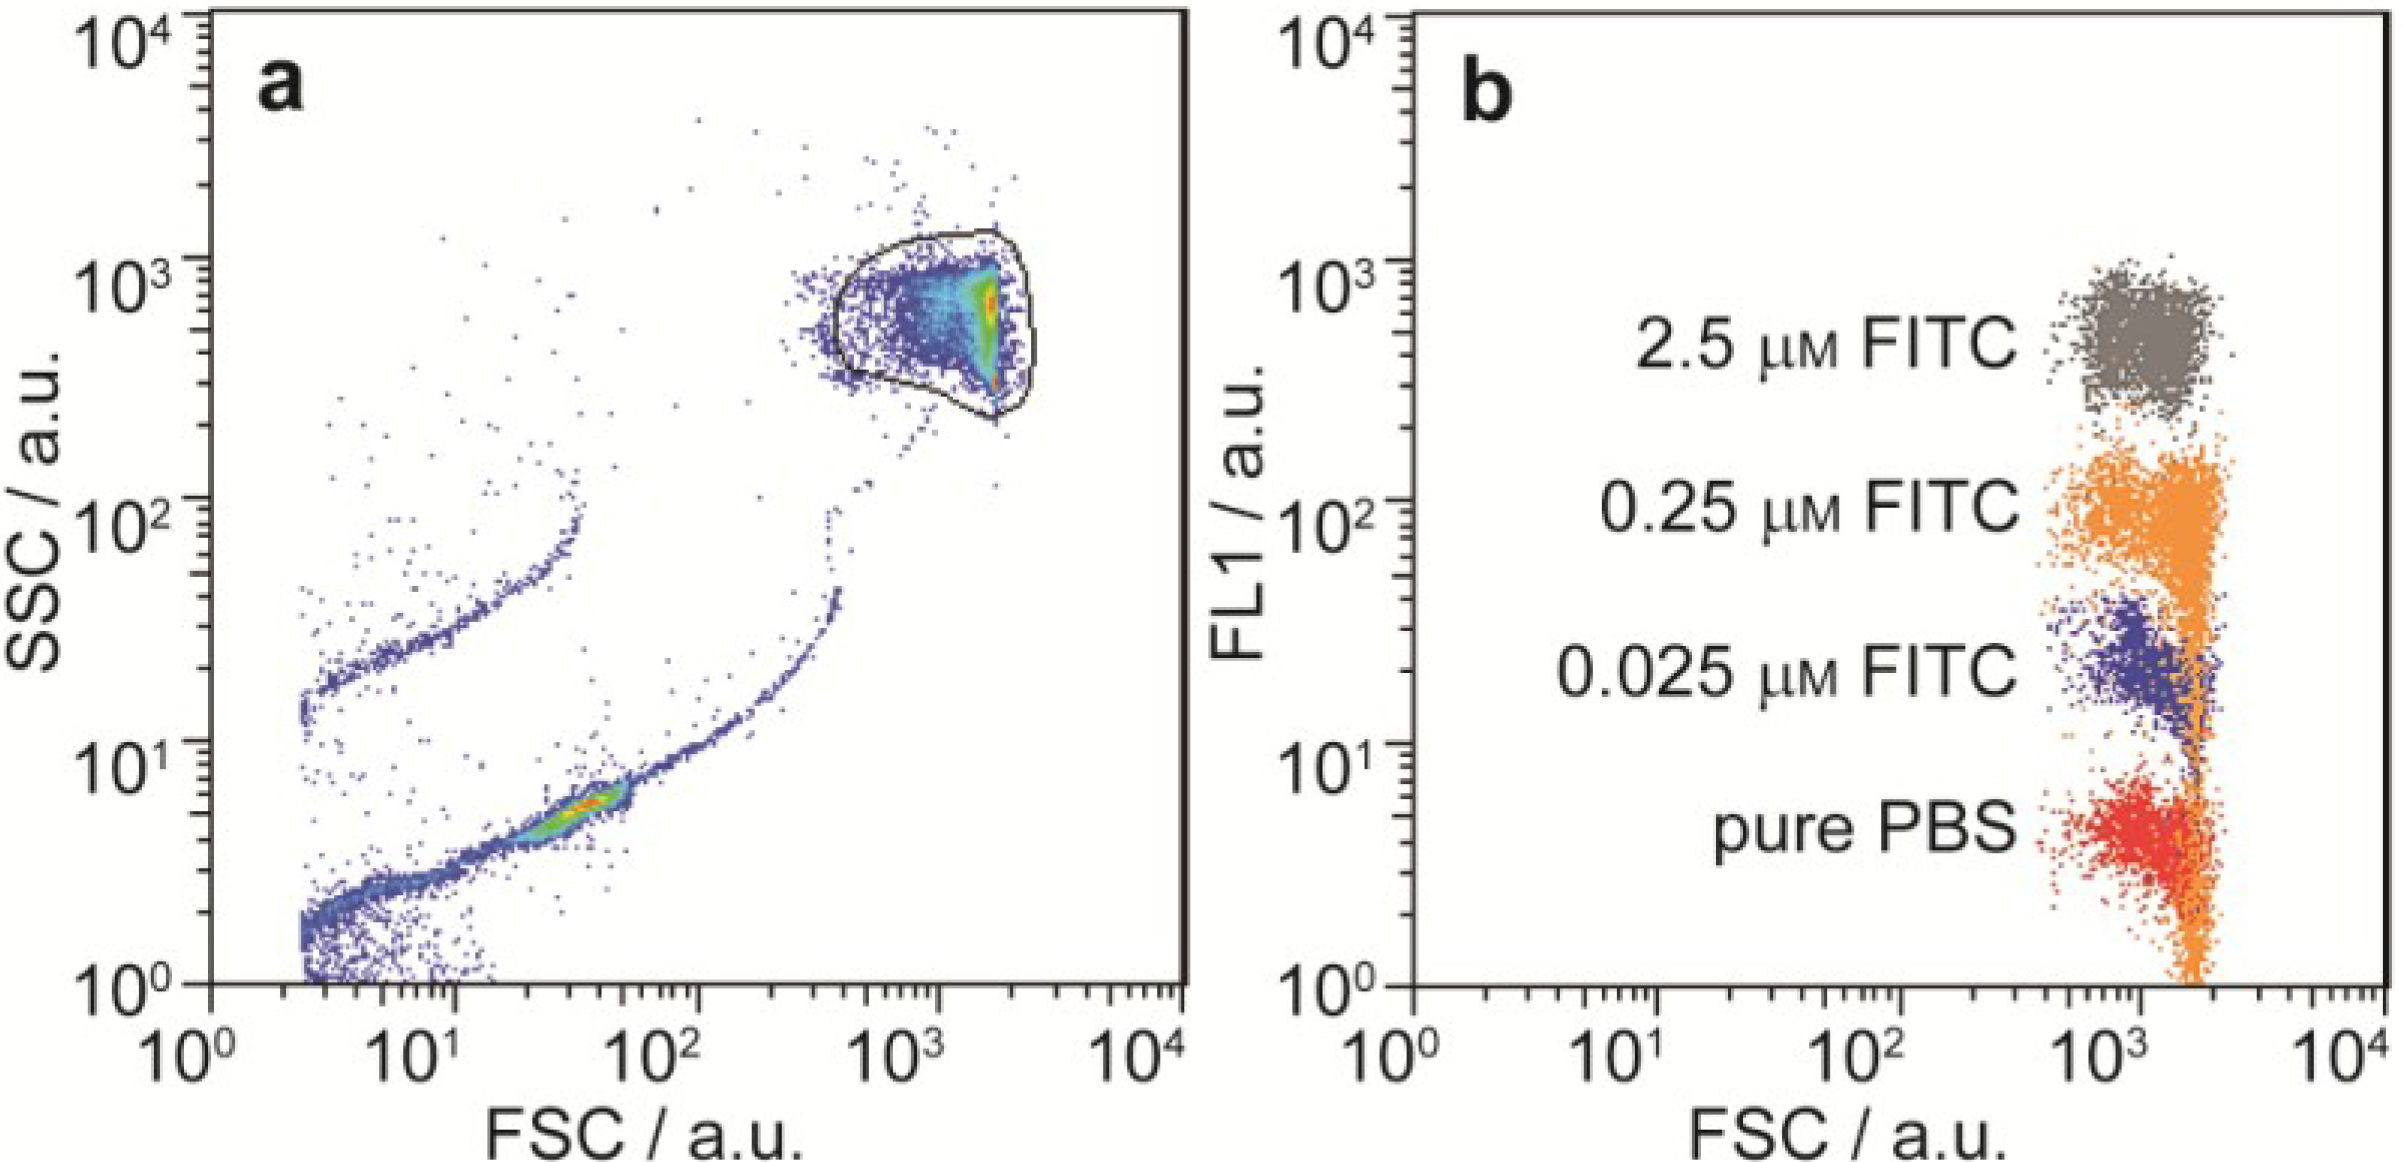
Figure 4, the four w/o/w double emulsion samples were analyzed with a flow cytometer (excitation 448 nm, with 530/30 filter).
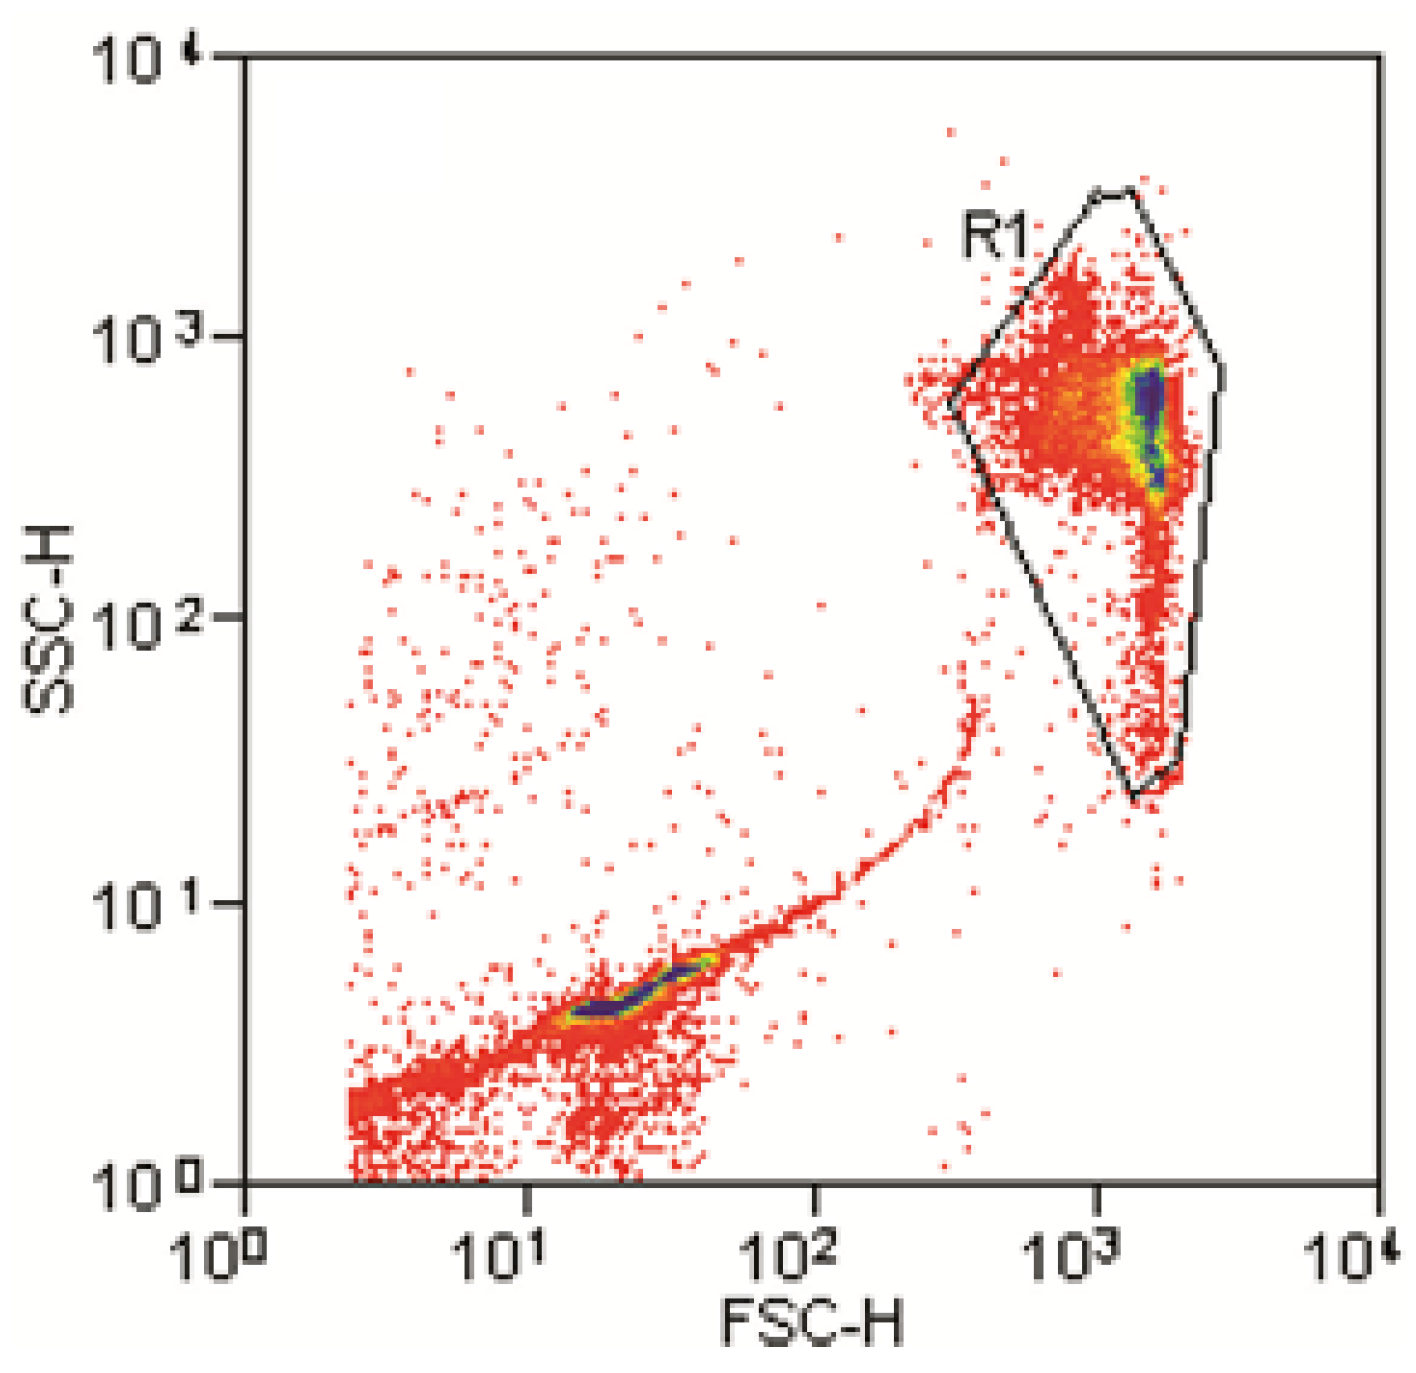
Figure 4a shows FSC
vs. SSC log-log dot-plot of the un-dyed sample. Very similar diagrams were obtained for the three FITC-containing samples. All samples exhibit one distinct main population, representing the w/o/w double emulsion droplets, which appears at the same position (
i.e., FSC and SSC values) in every plot. This result indicates that w/o/w droplets in all samples are highly uniform in terms of size and internal structure, respectively. Outside the main population, shifted towards lower FSC values, additional data points are present, which originate from smaller objects in the sample, most likely dust particles or small satellite droplets.
A gate (black line in
Figure 4a), capturing the main population, was set for all samples and used for subsequent fluorescence analysis.
Figure 4b shows an overlay of the FSC
vs. FL1 log-log dot-plots of the four samples. The FL1 values of these populations reflect the FITC contents in the inner droplets. Within the series of dye-loaded samples each tenfold increase in FITC concentration yields an approximate tenfold increase in the FL1 value, from ~11 for the 0.025 μM FITC sample, to ~100 for the 0.25 μM FITC sample and ~800 for the 2.5 μM FITC sample. The decreasing intensity at the highest concentration is due to inner filter effects [
30].
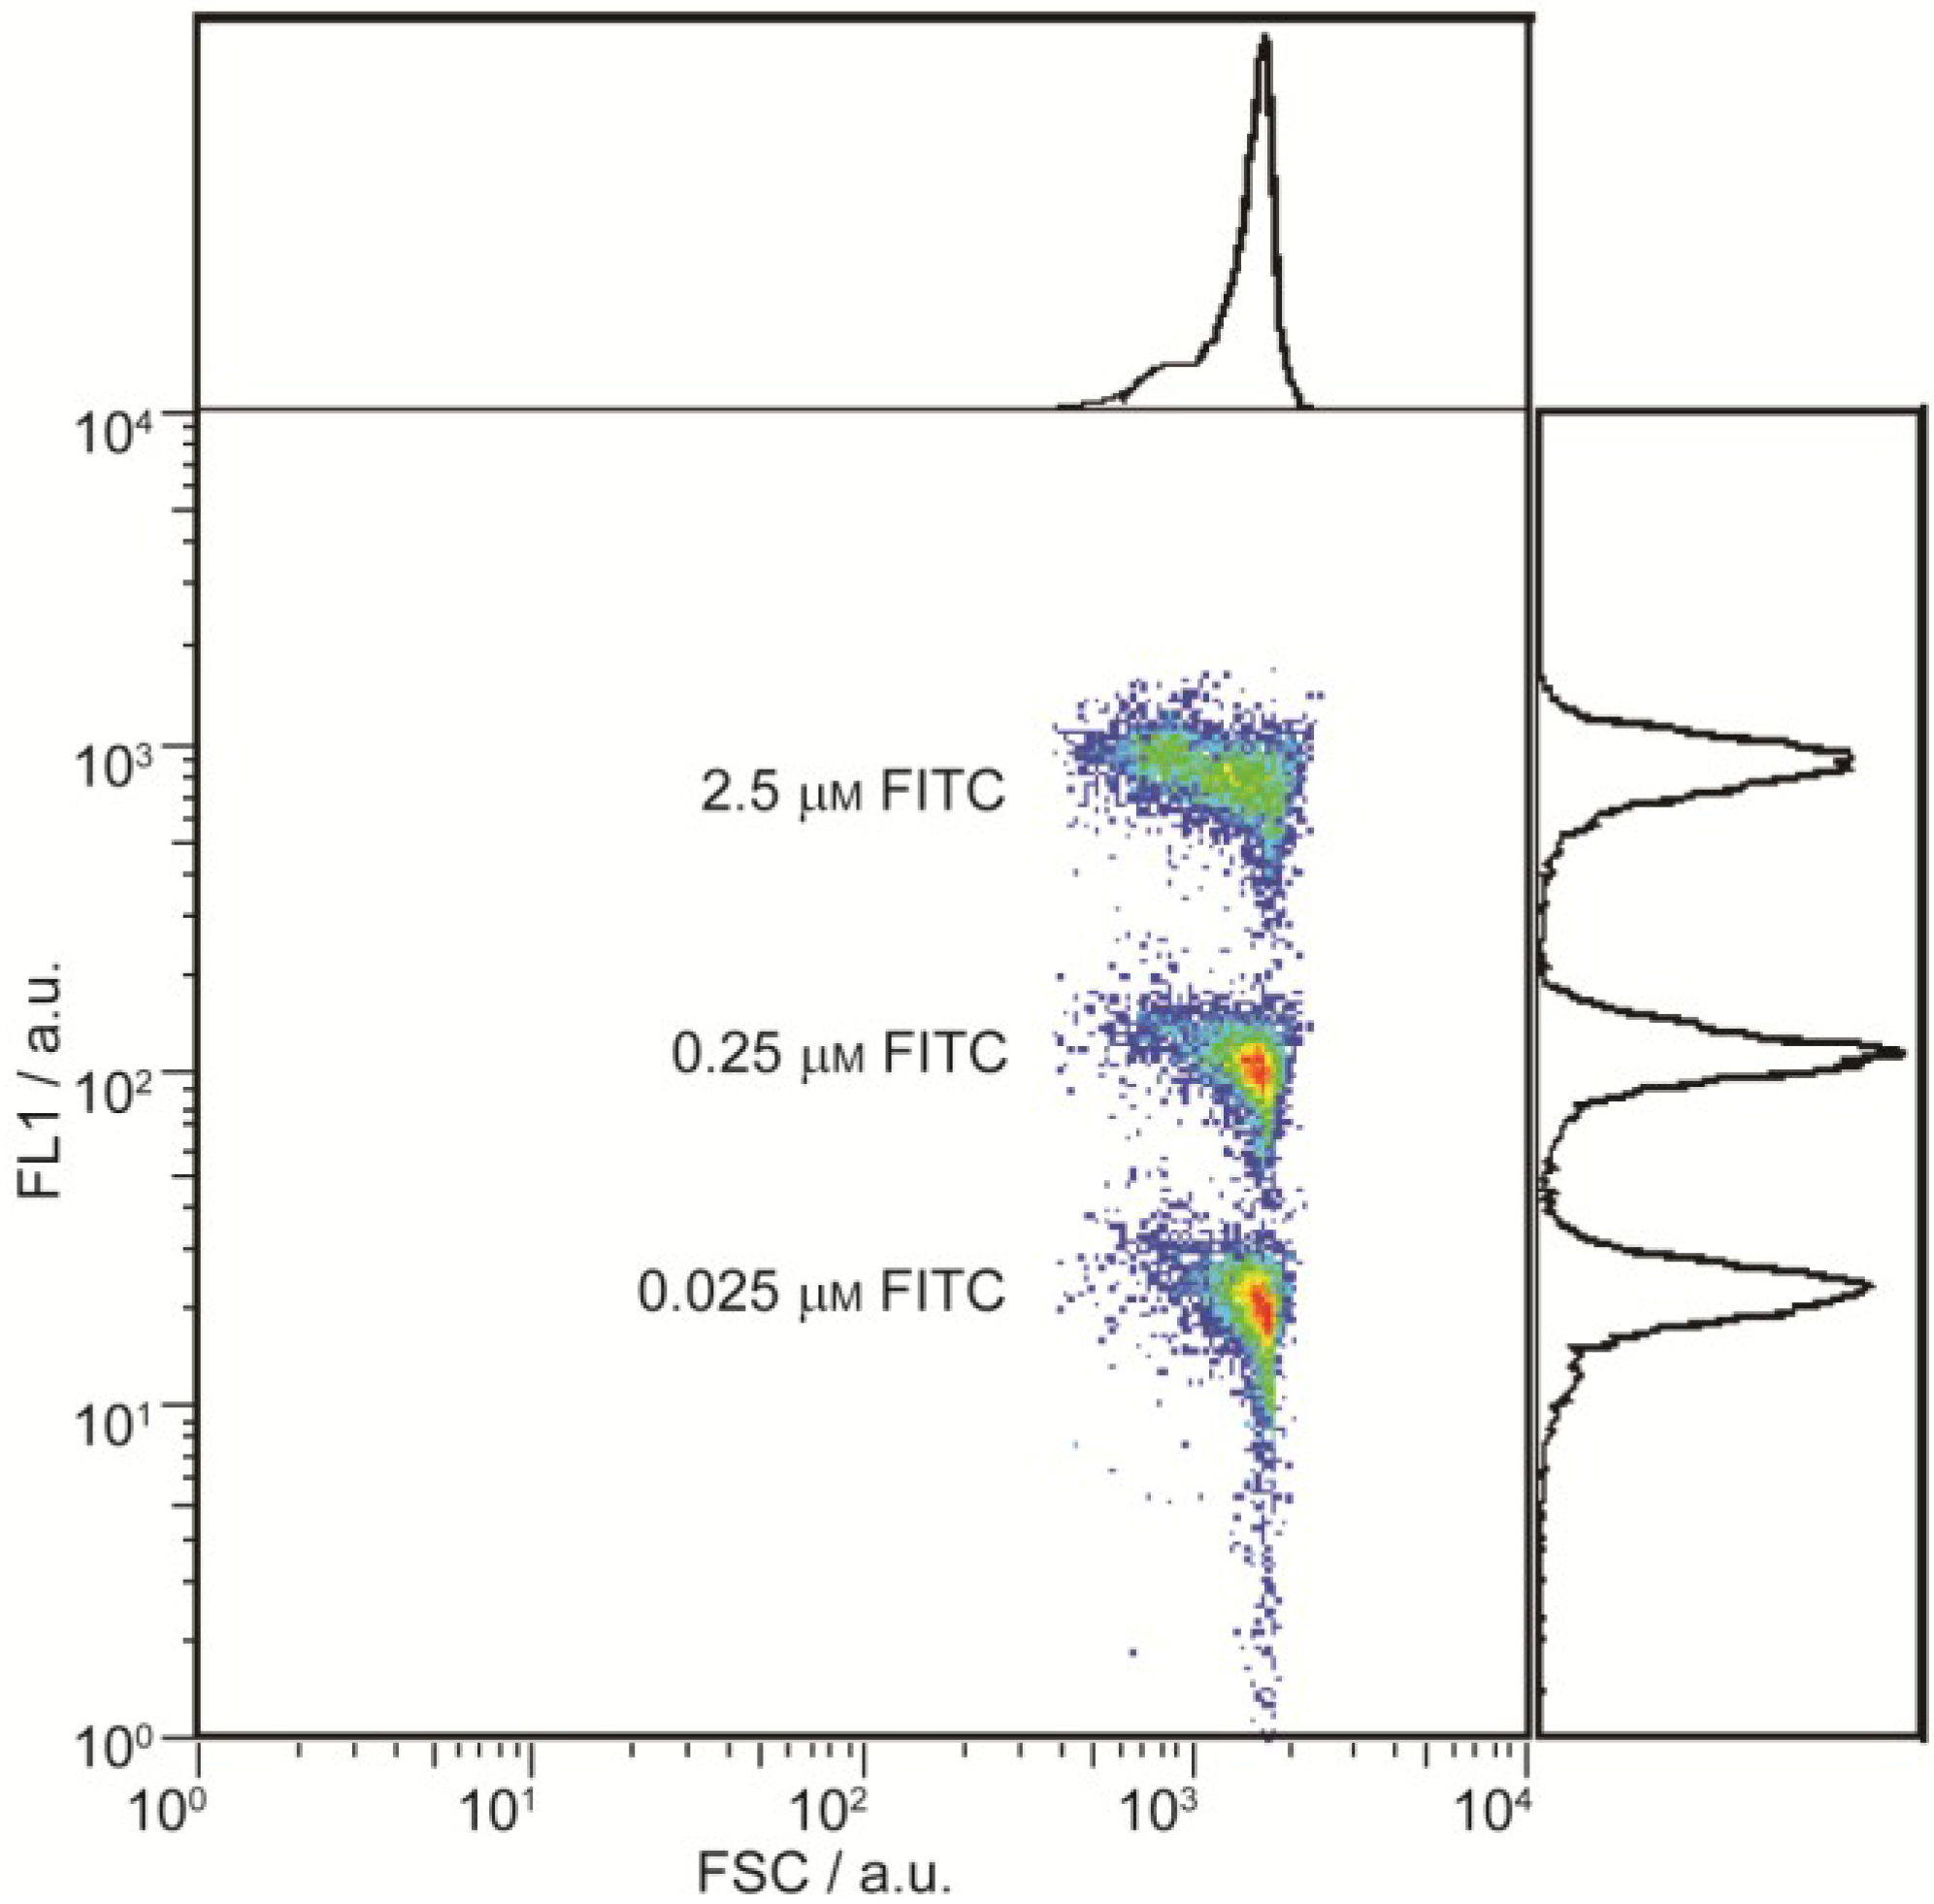
Eventually, we conducted the parallel analysis of multiple w/o/w double emulsion species, present in one sample. To this end, we mixed equal volumes of the three dye-loaded droplet samples and analyzed the joint sample in a flow cytometer one day later. The FSC
vs. SSC log-log dot-plot (
Figure A1) contains only one main population. Since all double emulsion droplets in the sample had the same size and internal structure they exhibited the same FSC and SSC values, respectively. In contrast, three distinct populations appear in the gated FSC
vs. FL1 log-log dot-plot (
Figure 5). They correspond to the three different droplet species, differing from each other in terms of FITC concentration in the inner droplets. The semi-log histograms attached to each axis exhibit one distinct SSC peak and three sharp and well-separated FL1 peaks, corresponding to the three droplet populations. The well-defined nature of the populations demonstrates that no cross-contamination between the droplets occurred within the 24 h period between the sample mixing and analysis steps, another crucial requirement that compartmentalization systems need to meet.
Figure 4.
Flow cytometric analysis of w/o/w double emulsion droplets with varying FITC contents. (a) Five detectors-forward scatter (FSC) vs. side scatter (SSC) log-log dot-plot of the un-dyed sample, exhibiting a distinct main population of double emulsion droplets; and (b) Overlay of gated FSC vs. FL1 log-log dot-plots, showing defined populations whose FL1 values correspond to the FITC concentrations in the inner droplets.
Figure 5.
Flow cytometry analysis of a w/o/w double emulsion droplet mixture, containing three droplet species with different FITC contents. The three populations with varying FL1 values, present in the gated FSC vs. FL1 log-log dot-plot, refer to these species. Semi-log histograms attached to both axes exhibit one distinct SSC peak and three sharp and well-separated FL1 peaks.
