The Century Ahead: Searching for Sustainability

Tellus Institute, 11 Arlington Street, Boston, MA 02116, USA
*
Author to whom correspondence should be addressed.
Sustainability 2010, 2(8), 2626-2651; https://doi.org/10.3390/su2082626
Submission received: 10 July 2010
/
Revised: 12 August 2010
/
Accepted: 17 August 2010
/
Published: 20 August 2010
(This article belongs to the Special Issue Sustainable Futures)
Abstract
:The global future lies before us as a highly uncertain and contested landscape with numerous perils along the way. This study explores possible pathways to sustainability by considering in quantitative detail four contrasting scenarios for the twenty-first century. The analysis reveals vividly the risks of conventional development approaches and the real danger of socio-ecological descent. Nonetheless, the paper underscores that a Great Transition scenario—turning toward a civilization of enhanced human well-being and environmental resilience—remains an option, and identifies a suite of strategic and value changes for getting there. A fundamental shift in the development paradigm is found to be an urgent necessity for assuring a sustainable future and, as well, a hopeful opportunity for creating a world of enriched lives, human amity, and a healthy ecosphere.
Keywords:
sustainability; scenarios; global; simulation; development; climate; energy; water; hunger; agriculture
1. Introduction
Concern about the sustainability of nature and society is rising, and with good reason. Scientists report with ever-greater urgency the need for action to avoid destabilizing climate change and widespread destruction of the world’s ecosystems [1,2]. Parallel efforts are required to ease looming shortages of critical resources such as oil, water, and food. Meanwhile development specialists call for mitigating poverty, strengthening social justice, and enhancing human well-being. Other observers appeal for more effective transnational governance to regulate the growth and impact of globalizing capital, finance, and product markets that threaten the long-term stability and fairness of the world economy.
These concerns are central to the broad challenge of sustainable development, an international commitment assumed, at least rhetorically, nearly two decades ago at the 1992 Earth Summit in Rio de Janeiro. At the core of the concept of sustainability lies a moral imperative to pass on an undiminished world to future generations. This clarion call to take responsibility for the welfare of the unborn requires that, in making choices today, we weigh the consequences for the long-term tomorrow.
This paper explores the implications of this challenge by considering four contrasting global scenarios representing alternative worlds that might emerge from the turbulence and uncertainty of the present. Market Forces and Policy Reform are evolutionary futures that, despite episodic setbacks, emerge gradually from the dominant forces governing world development today. The other two envision a fundamental restructuring of the global order: fragmentation in Fortress World and positive transformation in Great Transition. Each scenario tells a different story of the twenty-first century with varying patterns of resource use, environmental impacts, and social conditions.
It is important to note the distinction between scenarios and forecasts. The interactions among co-evolving human and environmental systems are highly complex and inherently uncertain, rendering predictive forecasts impossible in any rigorous statistical sense [3,4]. Instead, scenarios are intended as renderings of plausible possibilities, designed to stretch the imagination, stimulate debate, and, by warning of pitfalls ahead, prompt corrective action. Of course, the plausibility, and even the internal consistency, of different visions is itself uncertain. How will the climate system respond to increased greenhouse gas concentrations from human activity? What geo-political formations will emerge? How will human values adjust? Indeed, limiting the ways surprises and feedback might knock a scenario off course is an illuminating and underappreciated aspect of scenario analysis.
We have examined our scenarios in great quantitative detail to the year 2100 for eleven world regions. The summary presented here focuses on selected global-scale results, painting broad-brush pictures of these contrasting futures, and revealing the fundamental forces driving development away from or toward sustainability. Cross-scenario comparisons offers lessons for policy strategies, institutional change, and, ultimately, for human values.
This research updates and enhances an earlier series of scenario assessments conducted by the Tellus Institute on behalf of the Global Scenario Group [5,6,7]. The base year has been advanced from 1995 to 2005, adding ten additional years to the massive database on which the analysis rests. That data feeds the PoleStar System, a computational framework originally developed in the early 1990s by the Tellus Institute and the Stockholm Environment Institute. PoleStar is designed to explore a full spectrum of integrated long-range scenarios in quantitative detail, including unconventional pathways of structural discontinuity [8].
The global simulations are disaggregated by region, major sectors and subsectors of the economy, key social variables, and numerous aspects of the environment and natural resources (see Table 1). Assumptions and computations are documented in [9], with regional results reported online at http://www.tellus.org/result_tables/results.cgi.

| Sector | Issue |
|---|---|
| Social |
|
| Household |
|
| Service |
|
| Transportation |
|
| Agriculture |
|
| Industry |
|
| Forestry |
|
| Land-Use |
|
| Energy Conversion |
|
| Water |
|
| Solid Waste |
|
2. The Scenarios: An Overview
The four scenarios are listed in Table 2. Conventional Worlds scenarios assume the persistence of many of the dominant forces driving development and globalization in recent decades. GDP growth remains the primary measure of successful economies and poor countries gradually converge toward the consumption and production patterns of rich nations. The degree of plausibility of these evolutionary scenarios rests with the validity of a basic premise: Conventional Worlds strategies will have the resilience to tolerate and recover from socio-ecological crises as they appear and succeed in maintaining rapid economic expansion.
| Type | Name | Description |
|---|---|---|
| Conventional Worlds | Market Forces (MF) | Market-centered growth-oriented globalization |
| Policy Reform (PR) | Government-led redirection of growth toward sustainability goals | |
| Alternative Visions | Fortress World (FW) | An authoritarian path in response to mounting crises |
| Great Transition (GT) | A fundamental transformation |
2.1. Market Forces: Market-centered Development
Market Forces is constructed as a future in which free market optimism remains dominant and proves well-founded. As population expands by 40 percent by 2050 [10] and free trade and deregulation drive growth, the global economy expands over three-fold by 2050, eightfold by 2100. All economic figures in this paper are expressed in purchasing power parity (PPP) dollars, which takes account of national differences in the cost of living when converting to a common currency. The availability of sufficient resources—raw materials, land, water, energy—and the means of maintaining ecological resilience in such a huge economy are critical uncertainties. The challenge of satisfying bio-physical sustainability constraints would be compounded by the challenge of maintaining social and economic sustainability in a world of profound inequalities between rich and poor countries, and within each country. Instability and conflict could undercut the evolutionary dynamics of the scenario, triggering a descent of civilization toward a Fortress World or more chaotic outcomes.
2.2. Policy Reform: Directing Growth
Policy Reform assumes the emergence of a massive government-led effort achieves sustainability without major changes in the state-centric international order, modern institutional structures, and consumerist values. Strong and harmonized policies are implemented that, by redirecting the world economy and promoting technological innovation, are able to achieve internationally recognized goals for poverty reduction, climate change stabilization, ecosystem preservation, freshwater protection, and pollution control. The scenario meets tough stabilization targets for carbon dioxide emissions and, in rough compatibility with United Nations Millennium Development Goals [11], halves world hunger between 2005 and 2025 (then halves it again by 2050).
Policy Reform is designed as a backcast constrained to meet the objectives shown in Table 5. As total greenhouse emissions decline, growth continues in developing countries for two decades as redistribution policies raise incomes of the poorest regions and most impoverished people. Although such transfers have been debated at climate negotiations, with little success to date, our analysis indicates that a Policy Reform approach will require a deep and widespread commitment to economic equity. As poorer countries converge toward the living standards of richer countries, they accelerate investment in environmentally sustainable practices.
Implementing this grand policy program in the context of Conventional Worlds values and institutions would not be easy: intergovernmental efforts to address sustainability challenges over the past two decades have not succeeded. The Policy Reform path would require unprecedented political will for establishing the necessary regulatory, economic, social, technological, and legal mechanisms.
2.3. Fortress World: An Authoritarian Path
If the market adaptations and policy reforms of Conventional Worlds were to prove insufficient for redirecting development away from destabilization, the global trajectory could veer in an unwelcome direction. Fortress World explores the possibility that powerful world forces, faced with a dire systemic crisis, impose an authoritarian order where elites retreat to protected enclaves, leaving impoverished masses outside. In our troubled times, Fortress World seems the true “business-as-usual” scenario to many. In this dark vision, the global archipelago of connected fortresses seeks to control a damaged environment and restive population. Authorities employ geo-engineering techniques to stabilize the global climate, while dispatching “peace-keeping” militia to multiple hotspots in an attempt to quell social conflict and mass migration. But the results are mixed: emergency measures and spotty infrastructure investment cannot keep pace with habitat loss and climate change, nor provide adequate food and water to desperate billions. In this kind of future, sustainable development is not in the cards, a half-remembered dream of a more hopeful time.
2.4. Great Transition: A Sustainable Civilization
In dramatic contrast, Great Transition envisions a values-led change in the guiding paradigm of global development. The transformation is catalyzed by the “push” of deepening crises and the “pull” of desire for a just, sustainable, and planetary civilization. A pluralistic transnational world order coalesces as a growing cultural and political movement of global citizens spurs the establishment of effective governance institutions [12]. The new paradigm is rooted in a triad of ascendant values: human solidarity, ecological resilience, and quality of life. Less consumerist lifestyles moderate the growth thrust of Conventional Worlds scenarios, as notions of the “good life” turn toward qualitative dimensions of well-being: creativity, leisure, relationships, and community engagement.
Population stabilizes more rapidly than in other scenarios as more equal gender roles and universal access to education and health care services lower birth rates in developing countries. The world approaches a steady-state economy with incomes reaching about $30,000 per person by 2100, three times the current average. Although this figure is well below the $50,000 of Conventional Worlds, the egalitarian income distributions of Great Transition leave most people far better off, while the improved social cohesion reduces conflict. In this deeply sustainable vision, crises still linger, but the world is able to confront them with enhanced institutions for reconciliation and cooperation.
3. Guidelines for Sustainability
The notion of sustainable development, though evocative, lacks precision. We operationalize the concept with a set of environmental and social goals that, if realized, would correlate to a resilient, just, and desirable form of global development in the coming decades. These indicators serve as a lens through which we evaluate the compatibility of each scenario with sustainability broadly construed. The broad aim is to consider the quality of development—the degree of well-being in human lives, the strength of communities, and the resilience of the biosphere—rather than gross domestic product, the misleading conventional measure of “development”.
The primary economic and social objectives of sustainability are, in a strict sense, the resilience and persistence of existing institutions. However, such structural stasis would fail to reflect the full normative content of sustainable development, the desire to reduce poverty and disparity, and enhance social cohesion. Proximate goals advancing these desiderata include universal access to clean water, adequate nutrition, stabilized populations, high quality of work, guaranteed basic rights, and adequate leisure for individual fulfillment. Prominent social dimensions of sustainability are listed in Table 3.
Enhance social stability and resilience
|
Reduce poverty and hunger
|
De-materialize lifestyles
|
Environmental sustainability objectives include mitigating anthropogenic climate change, reducing pollution, preserving natural resources, and protecting ecosystems and habitats. Actions that would contribute to these ends are summarized in Table 4. Reducing human impacts will depend on the scale and composition of consumption and production, the technologies deployed, the degree of social equity and stability, and, ultimately, on the human values and institutions that underpin development.
Selected sustainability objectives, broadly compatible with social and environmental goals widely discussed in the international discourse, are shown in Table 5. The Policy Reform scenario is constrained to meet these targets, which set the scale and timing for strategic interventions to decarbonize the energy system, conserve resources, and reduce poverty. The diminished environmental pressures and heightened equity embodied in the Great Transition scenario allow for transcending these minimal objectives.
Mitigate greenhouse gas emissions
|
Protect natural resources
|
Preserve habitats
|
| Dimension | Indicator | 2005 | 2025 | 2050 | 2100 |
|---|---|---|---|---|---|
| Poverty | Chronic hunger (millions of people) | 893 | 446 | 223 | 56 |
| % of 2005 value | - | 50% | 25% | 6% | |
| Climate | CO2 concentration | 380 ppm | Stabilize at ≤350 ppm by 2100 | ||
| Warming | - | <2.0 °C | |||
| Cumulative CO2 emissions since 2005 | - | ≤265 GtC | |||
| Freshwater | Use-to-resource ratio | Varies by basin | Decrease in areas of water stress | ||
| People in water stress (billions) | 1.73 | <2.0 | |||
| Ecosystem Pressure | Deforestation | Varies by region | Slow and reverse | ||
| Land degradation | Varies by region | Slow and reverse | |||
| Marine over-fishing | Pervasive | Slow and restore stocks | |||
4. Views of the Future
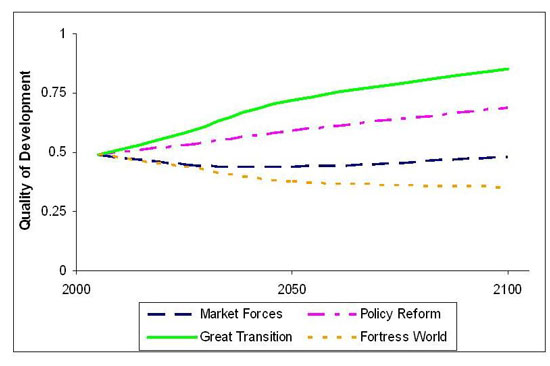
This section offers a bird’s eye view of the quantitative patterns of the scenarios. We begin with the Quality of Development Index (QDI) that we created to provide an overarching measure of sustainability performance. The QDI combines sub-indices representing three key aspects of sustainable development: human well-being, community cohesion, and environmental protection. The material Well-being sub-index includes indicators for Time Affluence (essentially leisure time) and Prosperity (a logarithmic function of income to account for well-documented diminishing returns to well-being); the Community sub-index includes indicators for Poverty Reduction and Social Cohesion (correlated to income disparity); the Environment sub-index includes indicators for Climate and Habitat. For details, see pp. 321-329 of the technical documentation for these scenarios [9].
Global trends for each scenario are shown in Figure 1. Despite rapid and continuous economic growth, Market Forces shows no discernible improvement in QDI (similar results are found at the regional scale where the QDI falls in OECD regions and rises only modestly in non-OECD regions.) By contrast, Policy Reform, with its commitments to meeting environmental and poverty reduction targets, shows steady and significant improvement. The QDI rises still higher in Great Transition, where a strong emphasis on quality-of-life and social cohesion contributes additional human well-being and community cohesion. Not surprisingly, Fortress World experiences a decline in all dimensions of development.
Figure 1.
Global Quality of Development Index (QDI).
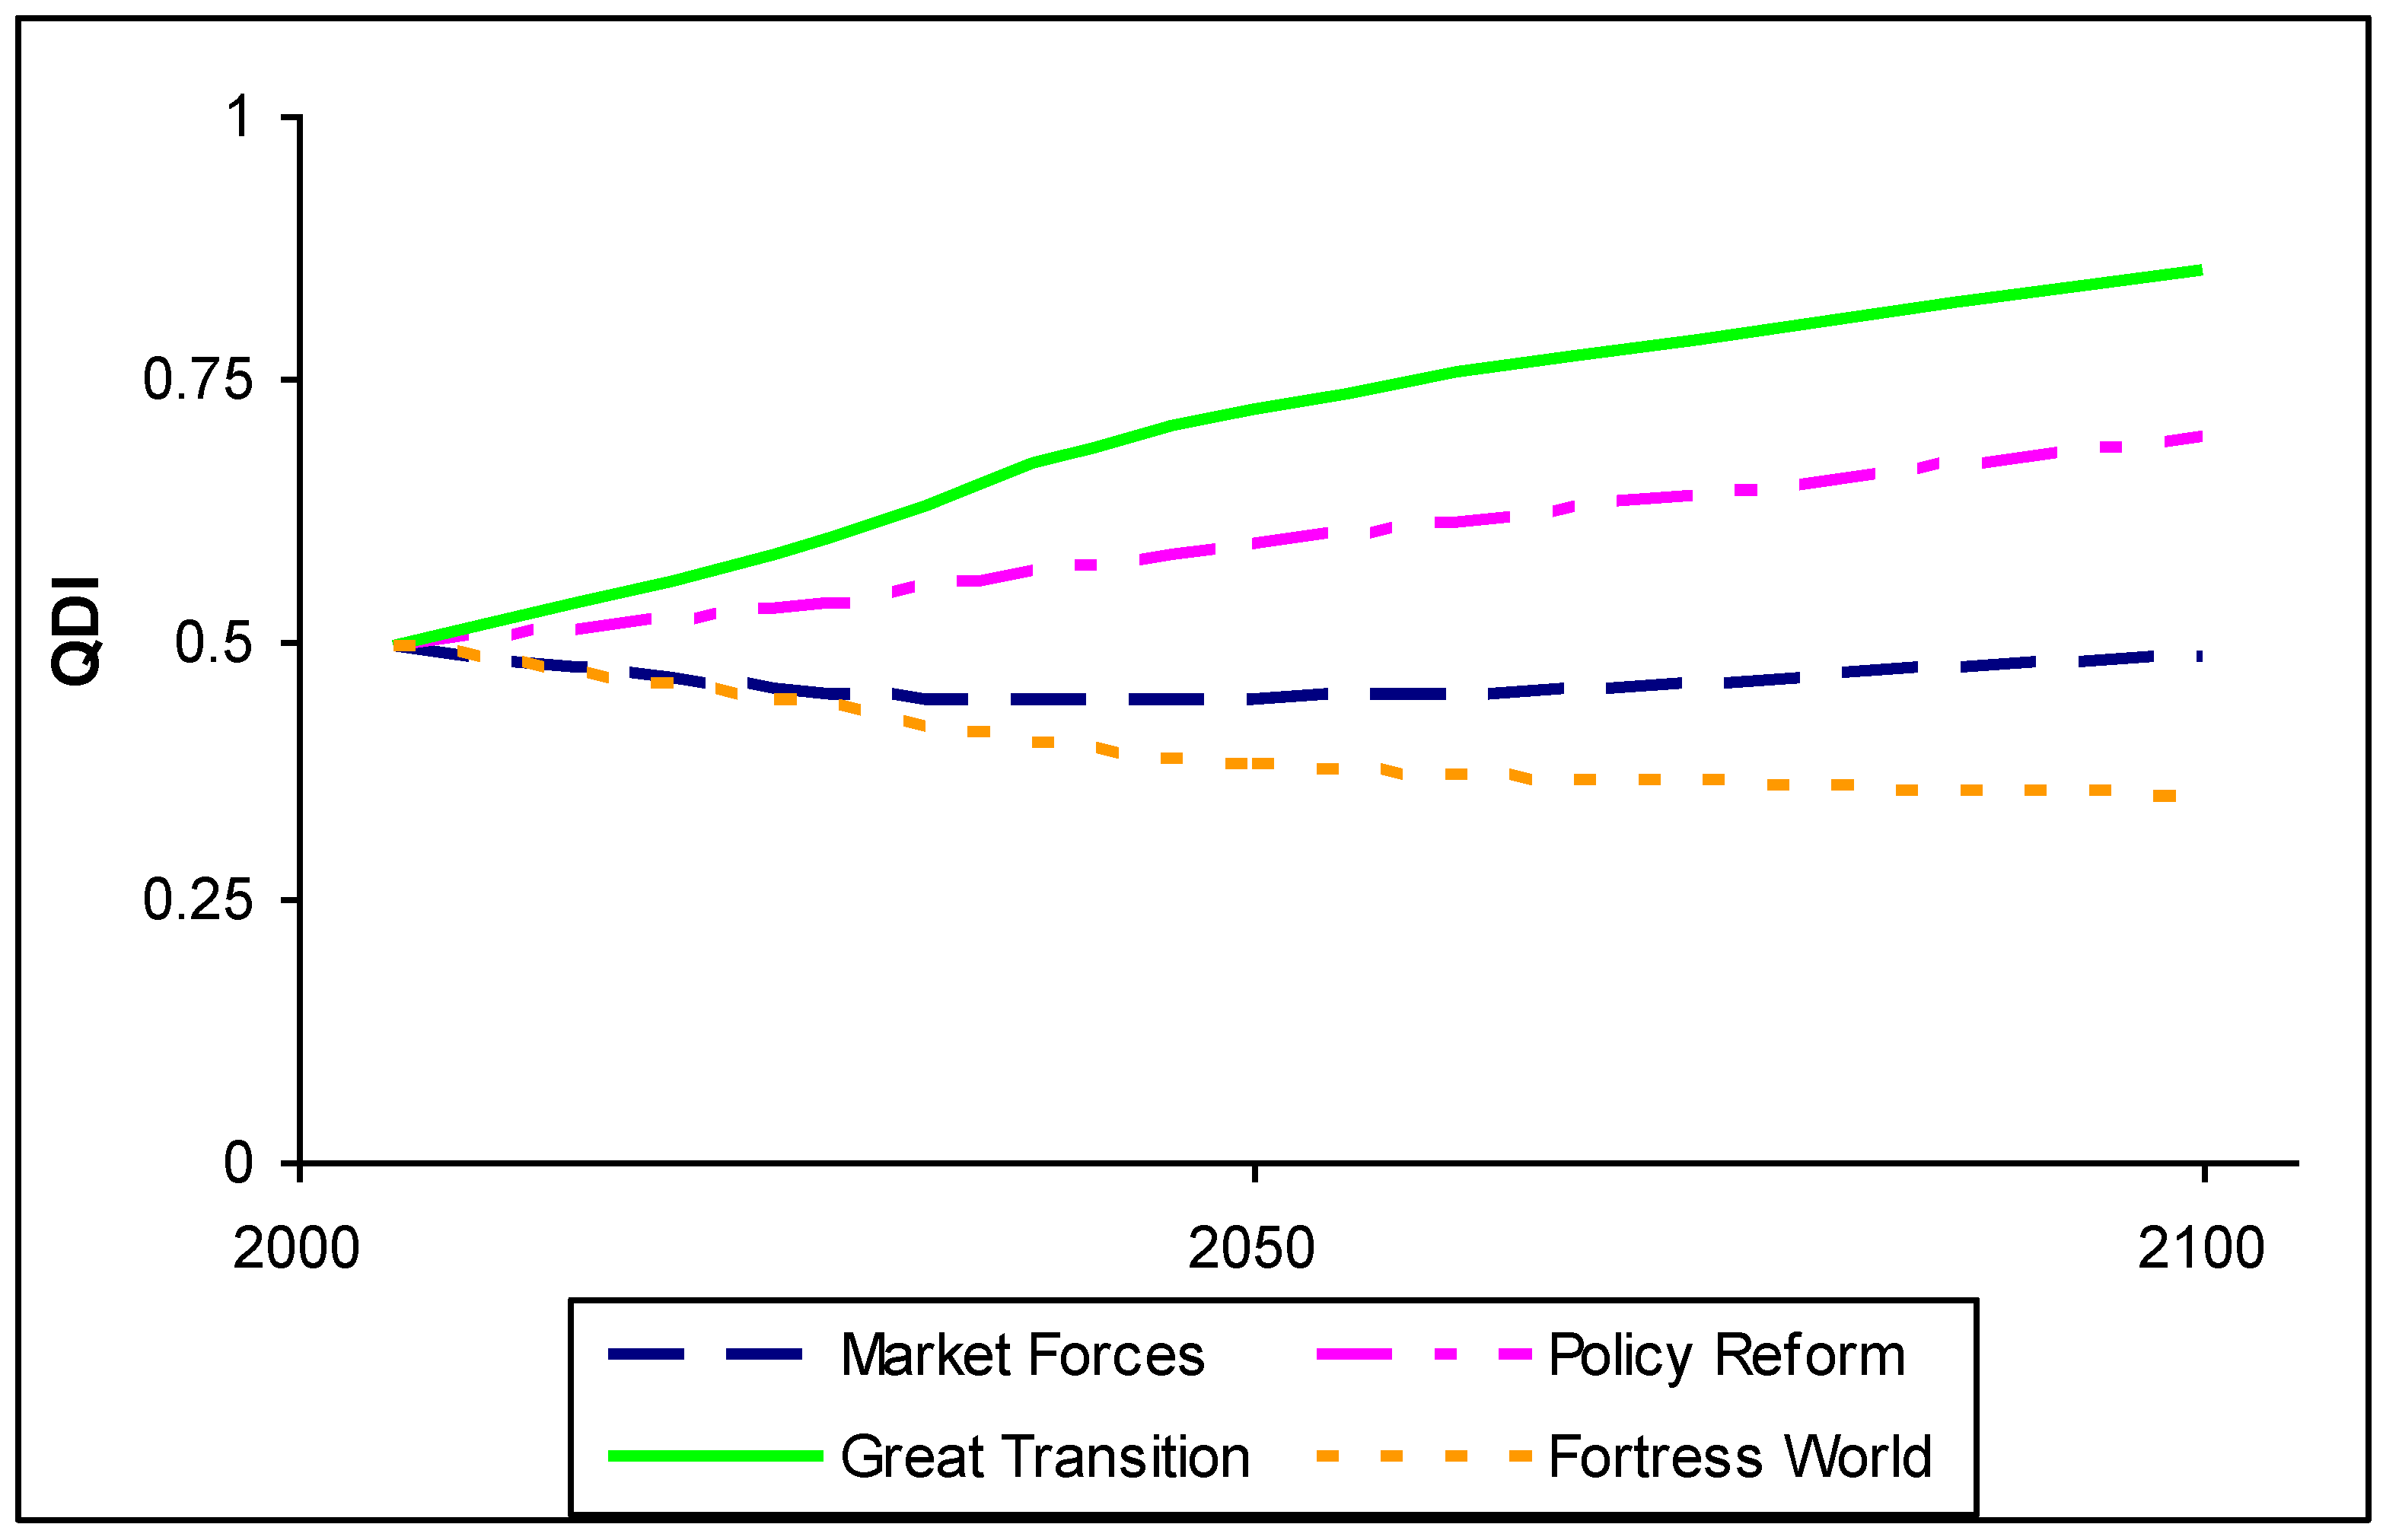
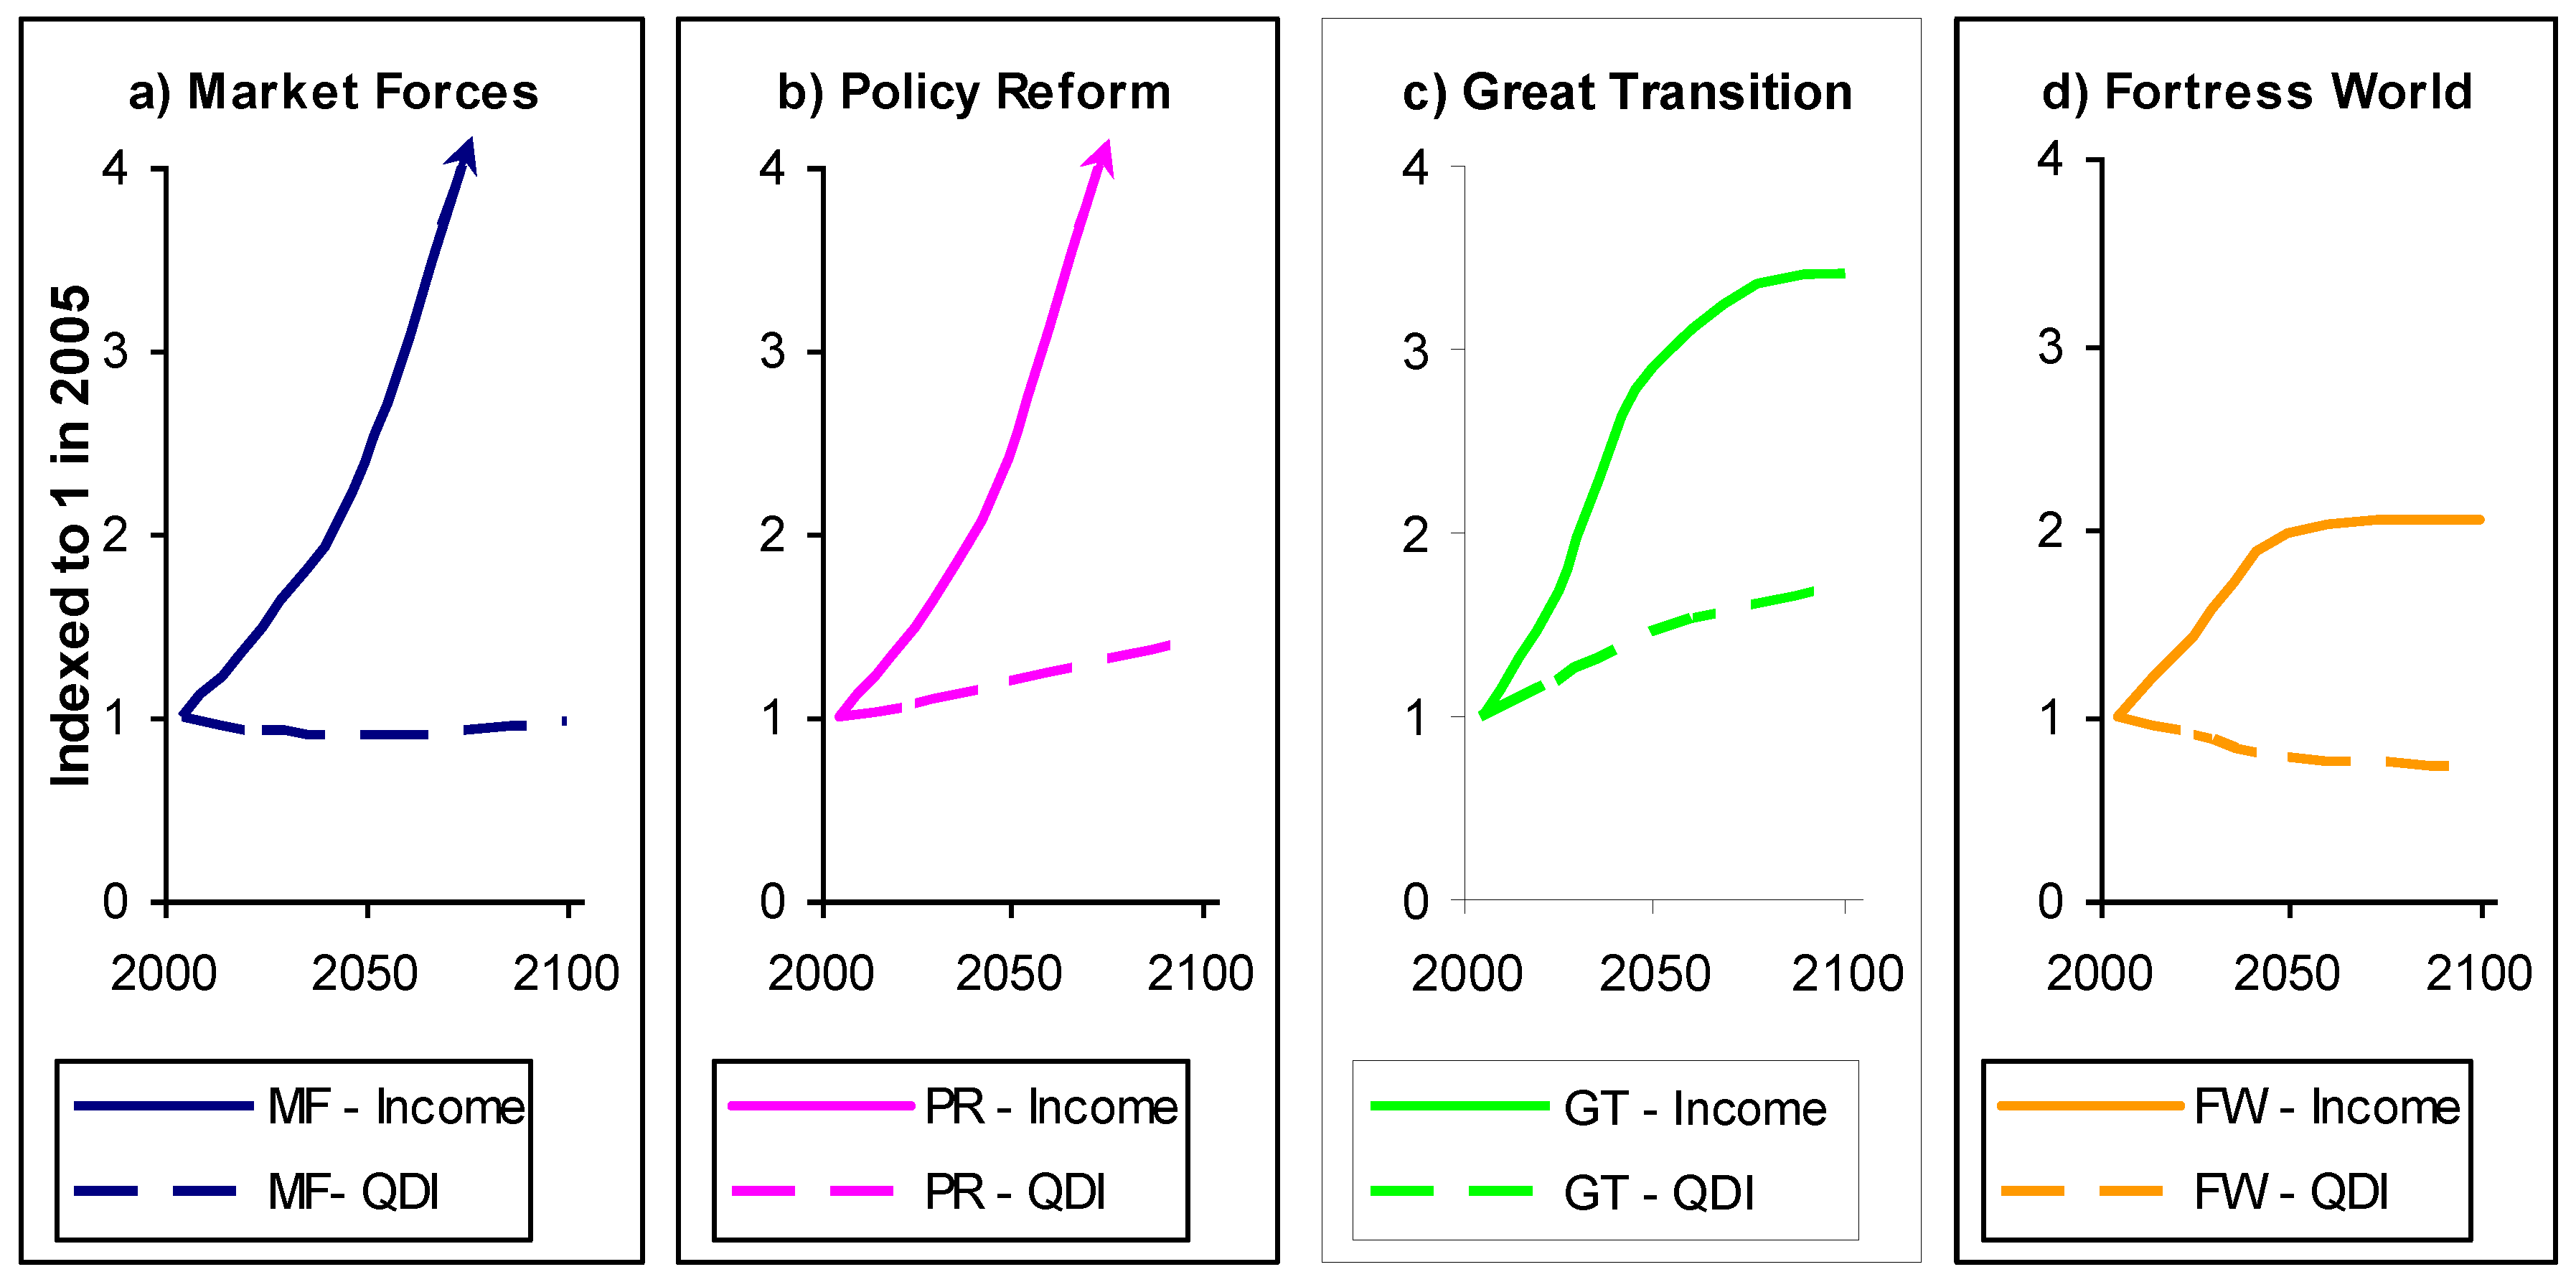
Figure 2 contrasts trends in QDI with GDP/capita (“income”), the more conventional measure of development. In Conventional Worlds scenarios, GDP growth has pride of place, but we can see by comparing Figures 2 (a)–(d), rising income alone is a poor predictor of the quality of development: QDI languishes in Market Forces, but shows significant increase in Policy Reform. The quality of development is still higher in Great Transition despite its more modest average incomes in the long run. Not surprisingly, the Fortress World QDI falls continuously as all dimensions deteriorate: incomes are lower, communities are less cohesive, and the environment degrades.
Figure 2.
Global QDI versus Income.
4.1. Economic and Social Patterns
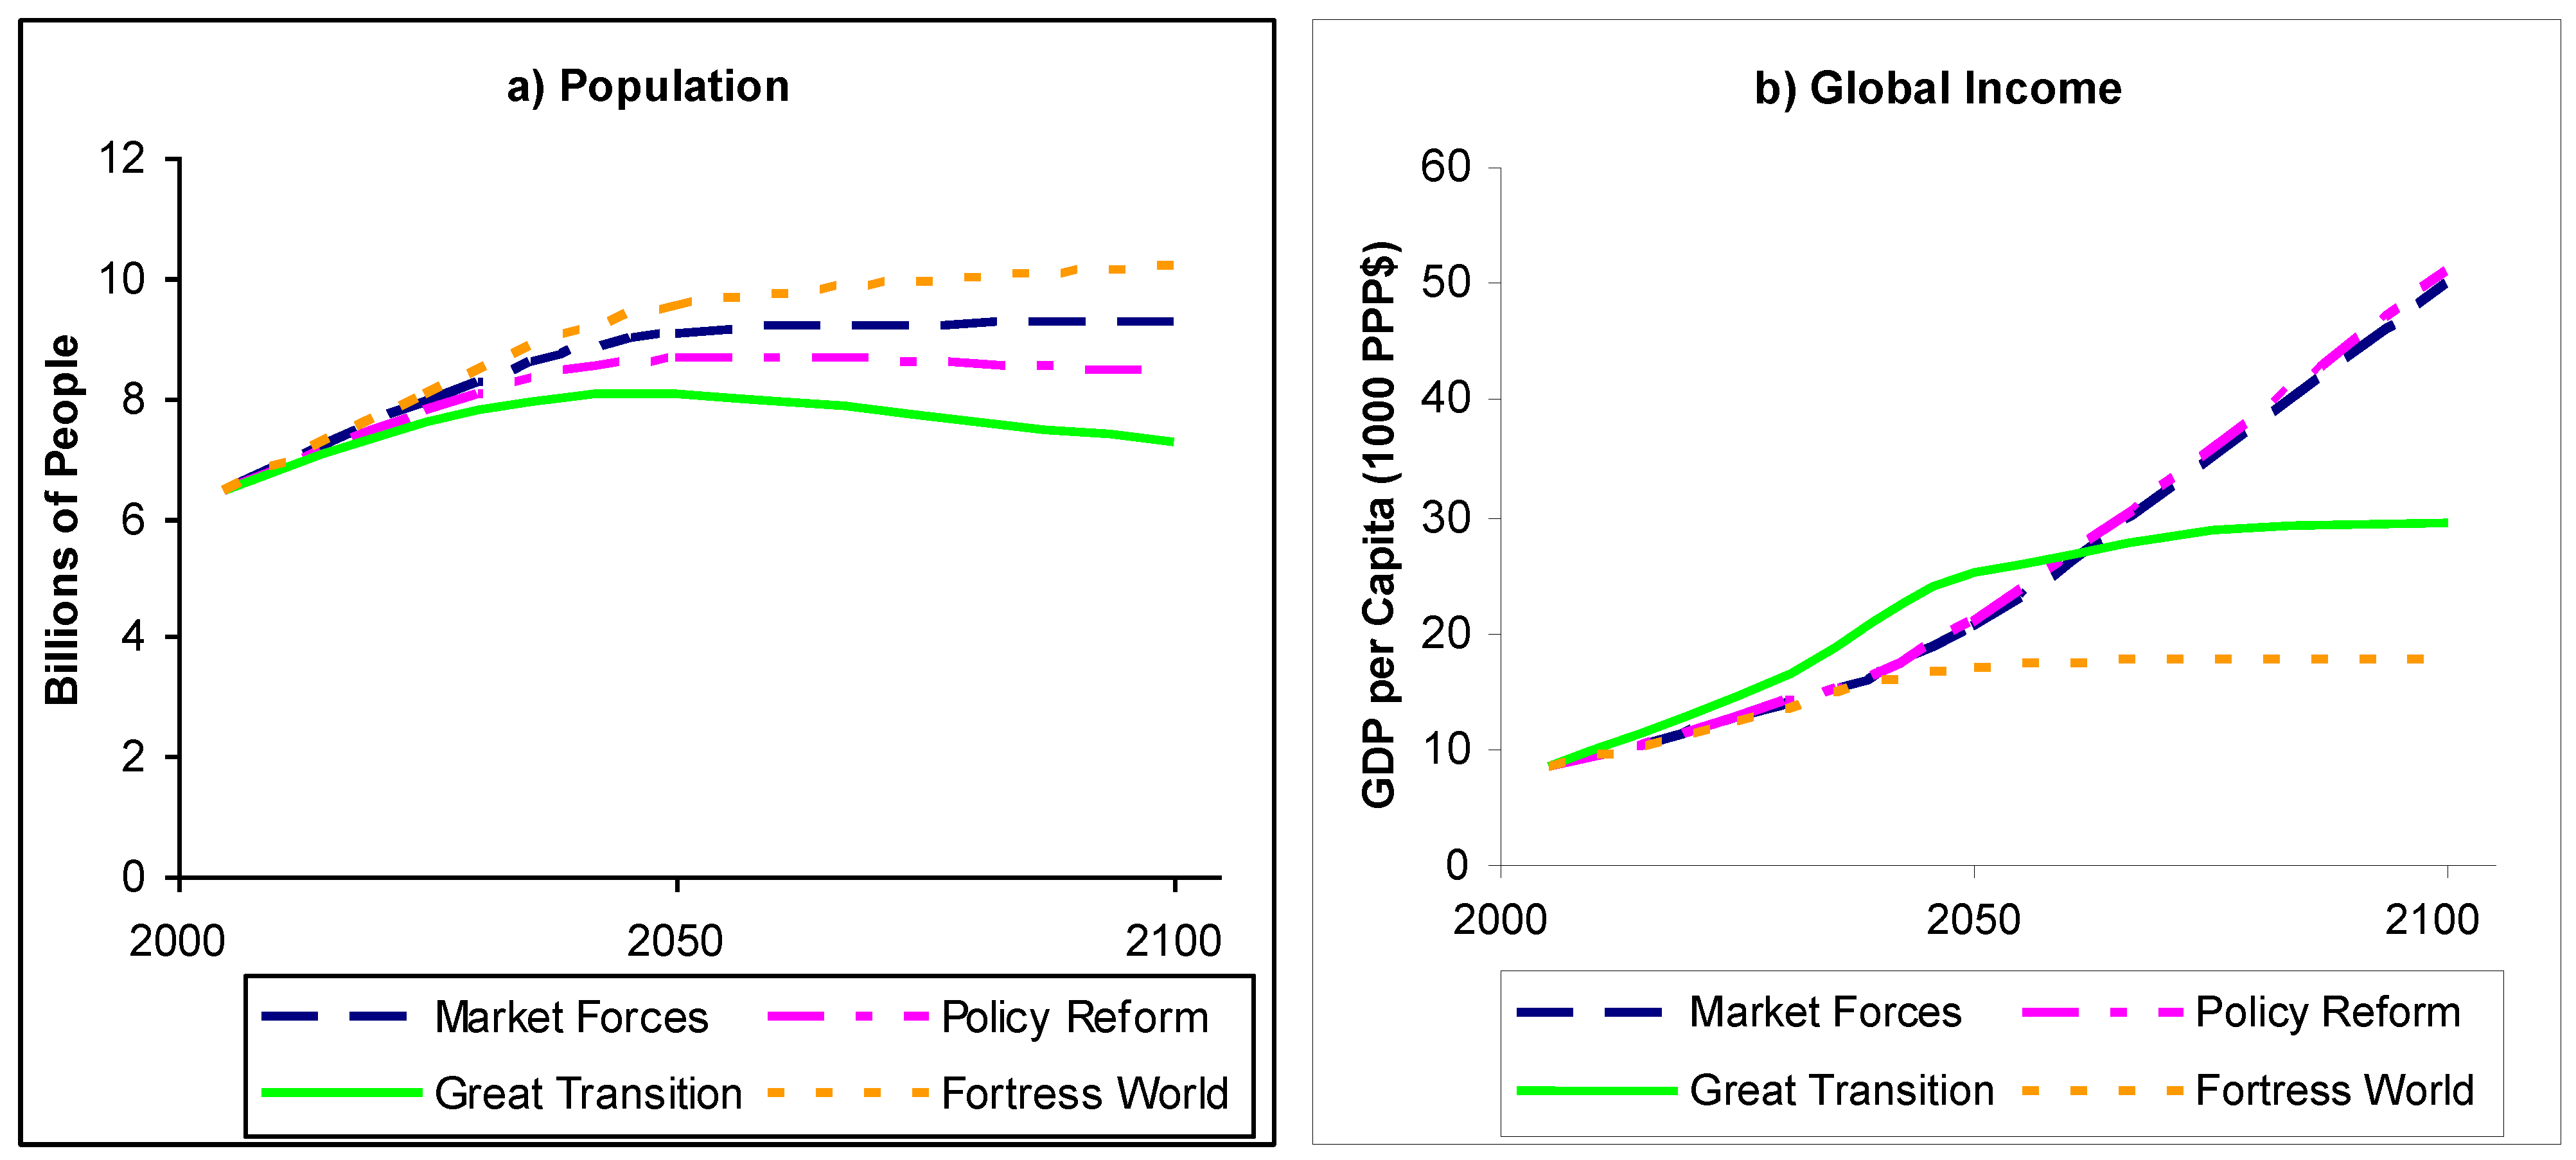
4.1.1. Population
World population grows from 6.5 billion to between 7.2 and 10.2 billion depending on the scenario (Figure 3(a)), with most of the increase in developing countries. The variation in population trends is due primarily to differences in fertility rates (children per female), with lower rates correlating to higher levels of access to education (especially for girls) and family planning services, and the degree of poverty reduction. Correspondingly, the demographic transition to lower birth rates in the process of modernization is accelerated in Policy Reform and, especially, in Great Transition, but reversed in the de-developing Fortress World.
4.1.2. Income
As shown in Figure 3(b), average income per capita soars in both Policy Reform and Market Forces, and stagnates in Fortress World where most people become mired in poverty. In Great Transition, income rises rapidly before 2050, as strong commitments to equity spur rapid development in the global South, then moderates as high equity is achieved and the world economy approaches a steady state [12,13]. Note that, underlying these average patterns, Great Transition is simulated as a pluralistic future where social and cultural diversity flourishes across and within regions. Although regional incomes converge toward a similar level, Great Transition is envisioned as a pluralistic scenario with significant social and cultural diversity across and within regions.
Figure 3.
Macro-variables.

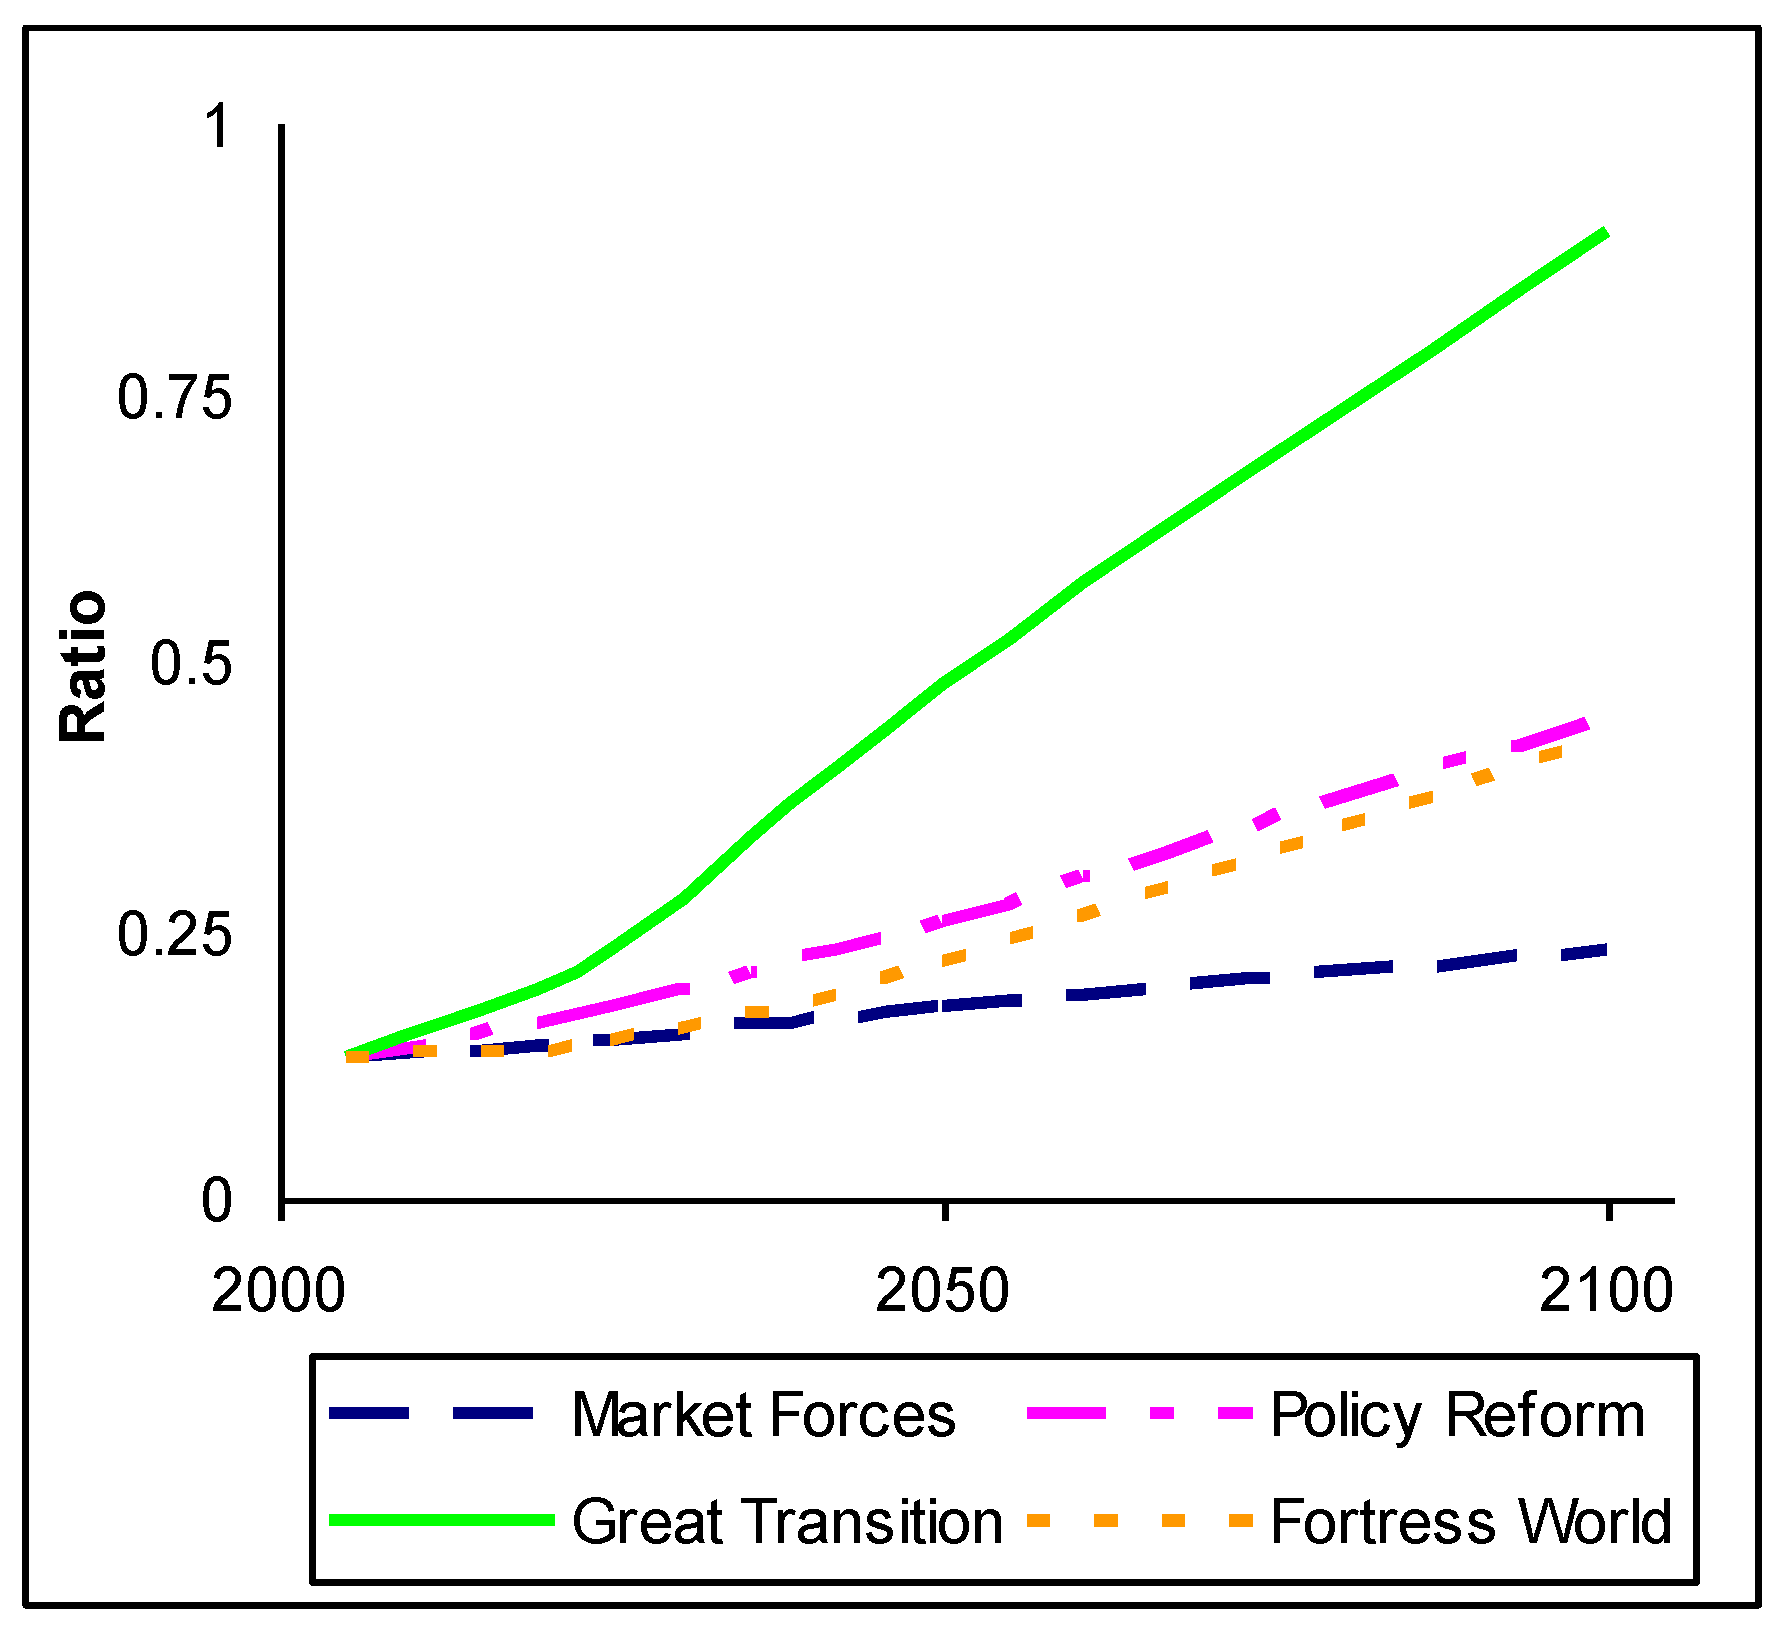
4.1.3. International equity
The current North-South disparity in economic development is extreme. International equity—defined here as the ratio of average income in non-OECD to OECD nations—was 0.13 in 2005, with markedly different trends in each scenario (Figure 4). International equity rises to 0.23 in Market Forces by 2100, a result of the somewhat higher growth in poorer countries found in standard economic projections (even so, the absolute difference in incomes between rich and poor regions increases). Ironically, international equity improves more in Fortress World than in Market Forces as regions become more equally poor. Through proactive pursuit of poverty reduction, Policy Reform drives international equity significantly higher, reaching 0.45 as a result of financial transfers and development aid from OECD to non-OECD regions. Great Transition, rooted in the core values of justice and solidarity, reaches an equitable world by 2100, where the gaps between regions have nearly vanished.
Figure 4.
International Equity (Ratio of non-OECD to OECD regions).

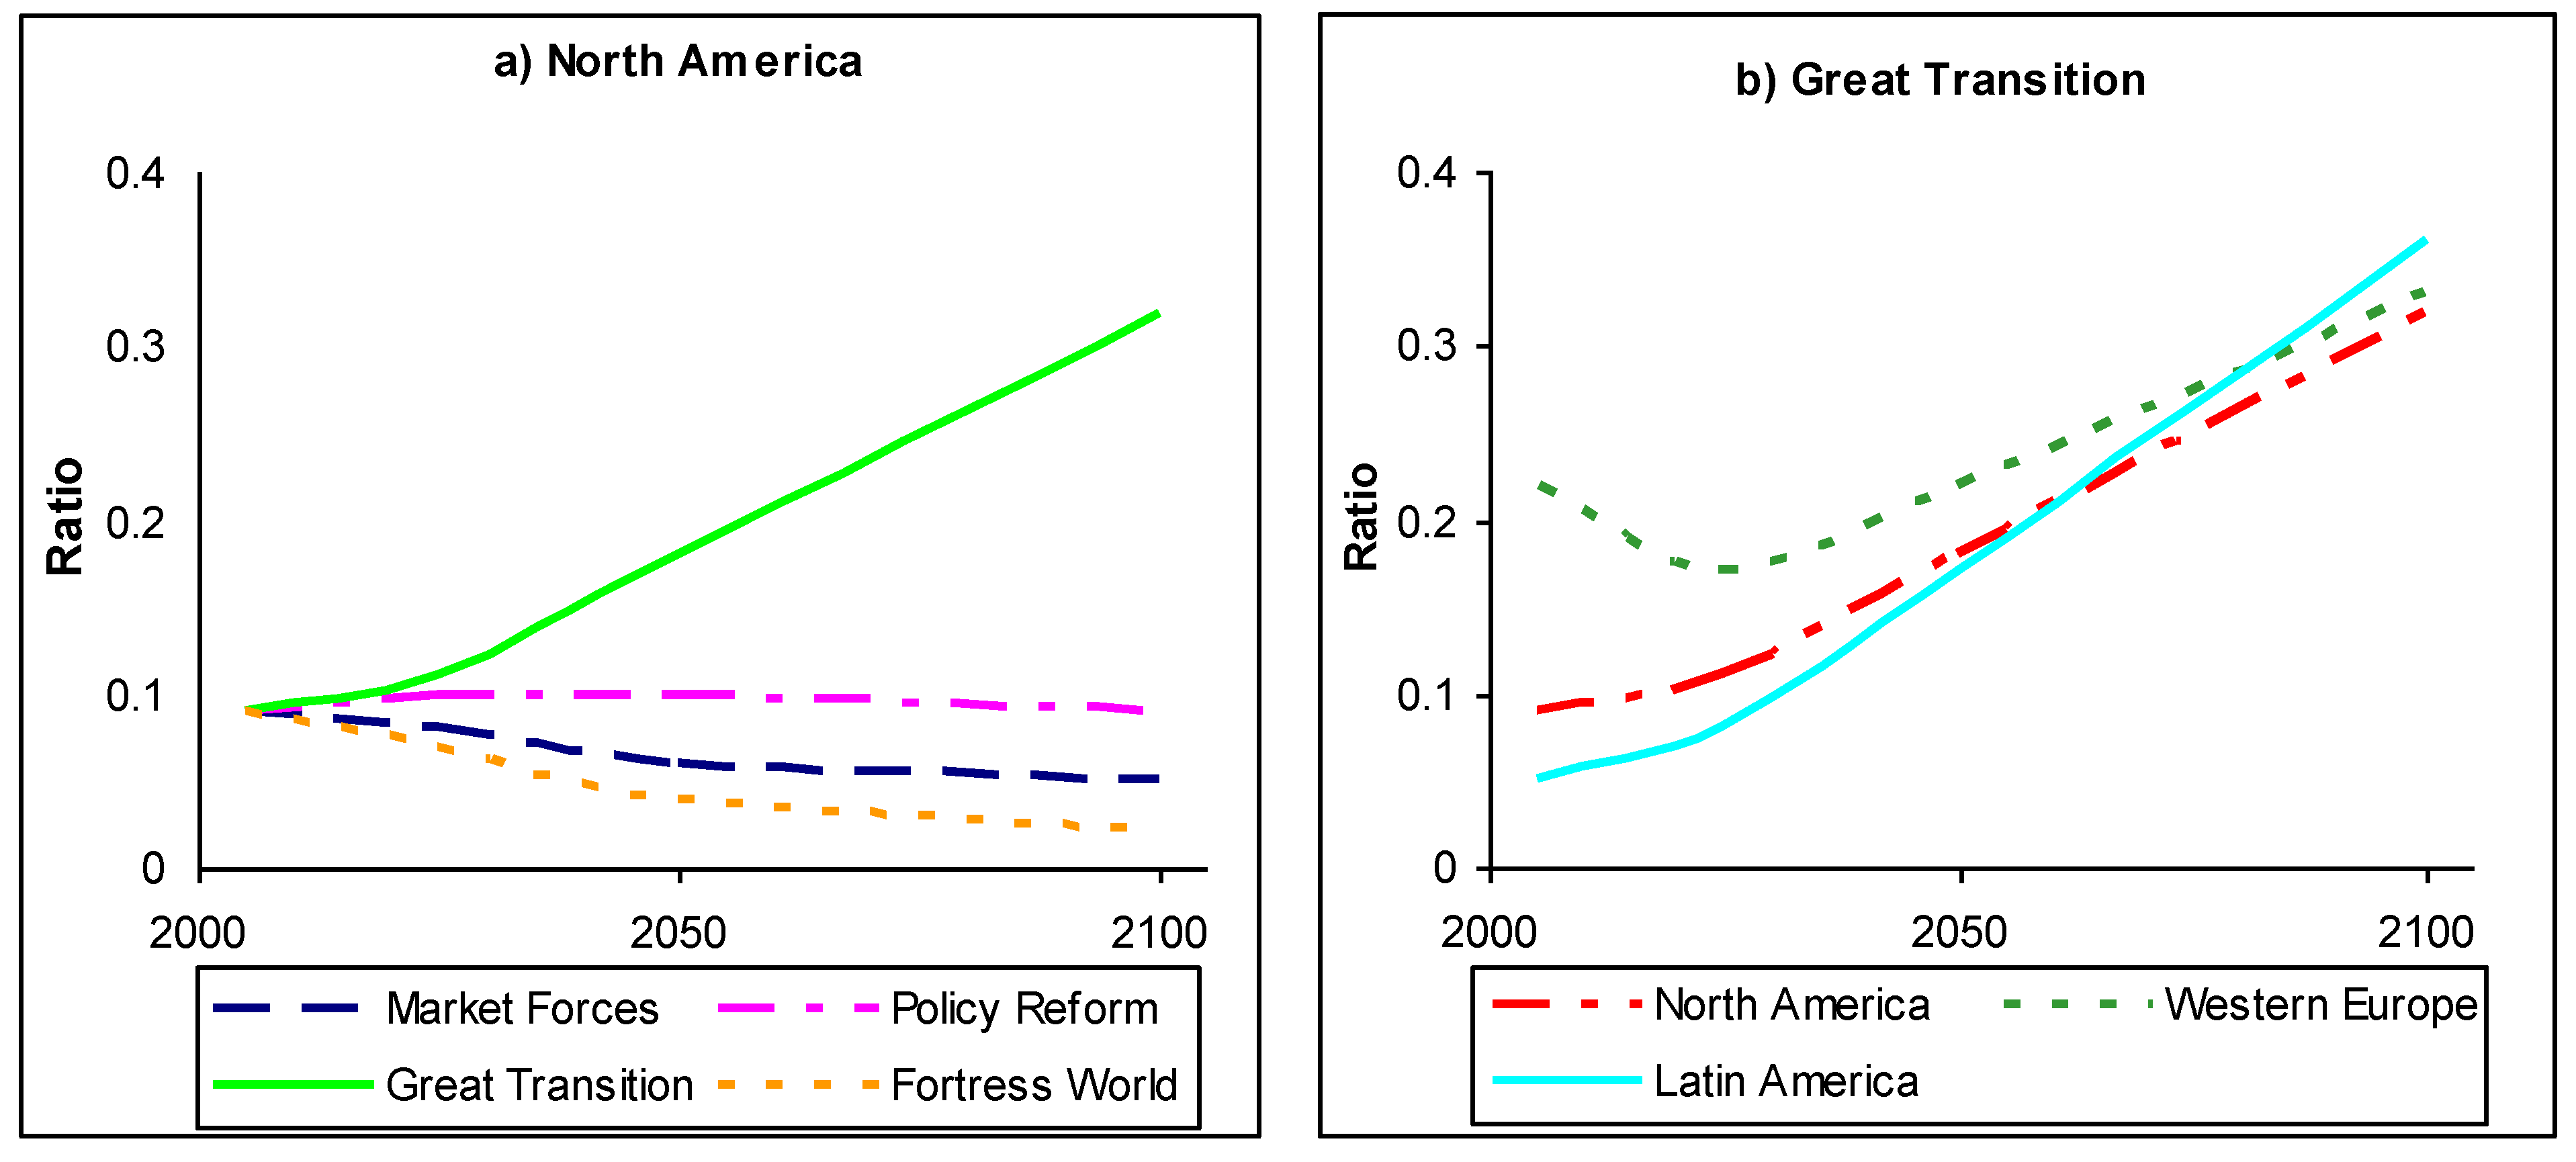
4.1.4. Intra-regional equity
The distribution of income within regions also varies substantially across scenarios. Figure 5(a) illustrates the range of variation of intra-regional equity—defined as the ratio of the income of the poorest 20 percent to the richest 20 percent—for North America. The patterns for the highly equitable Great Transition are shown in Figure 5(b), where all regions approach a ratio of about 0.35, nearly 60 percent higher than Western Europe today.
Figure 5.
Intra-regional Equity (Ratio of income of poorest 20% to richest 20%).
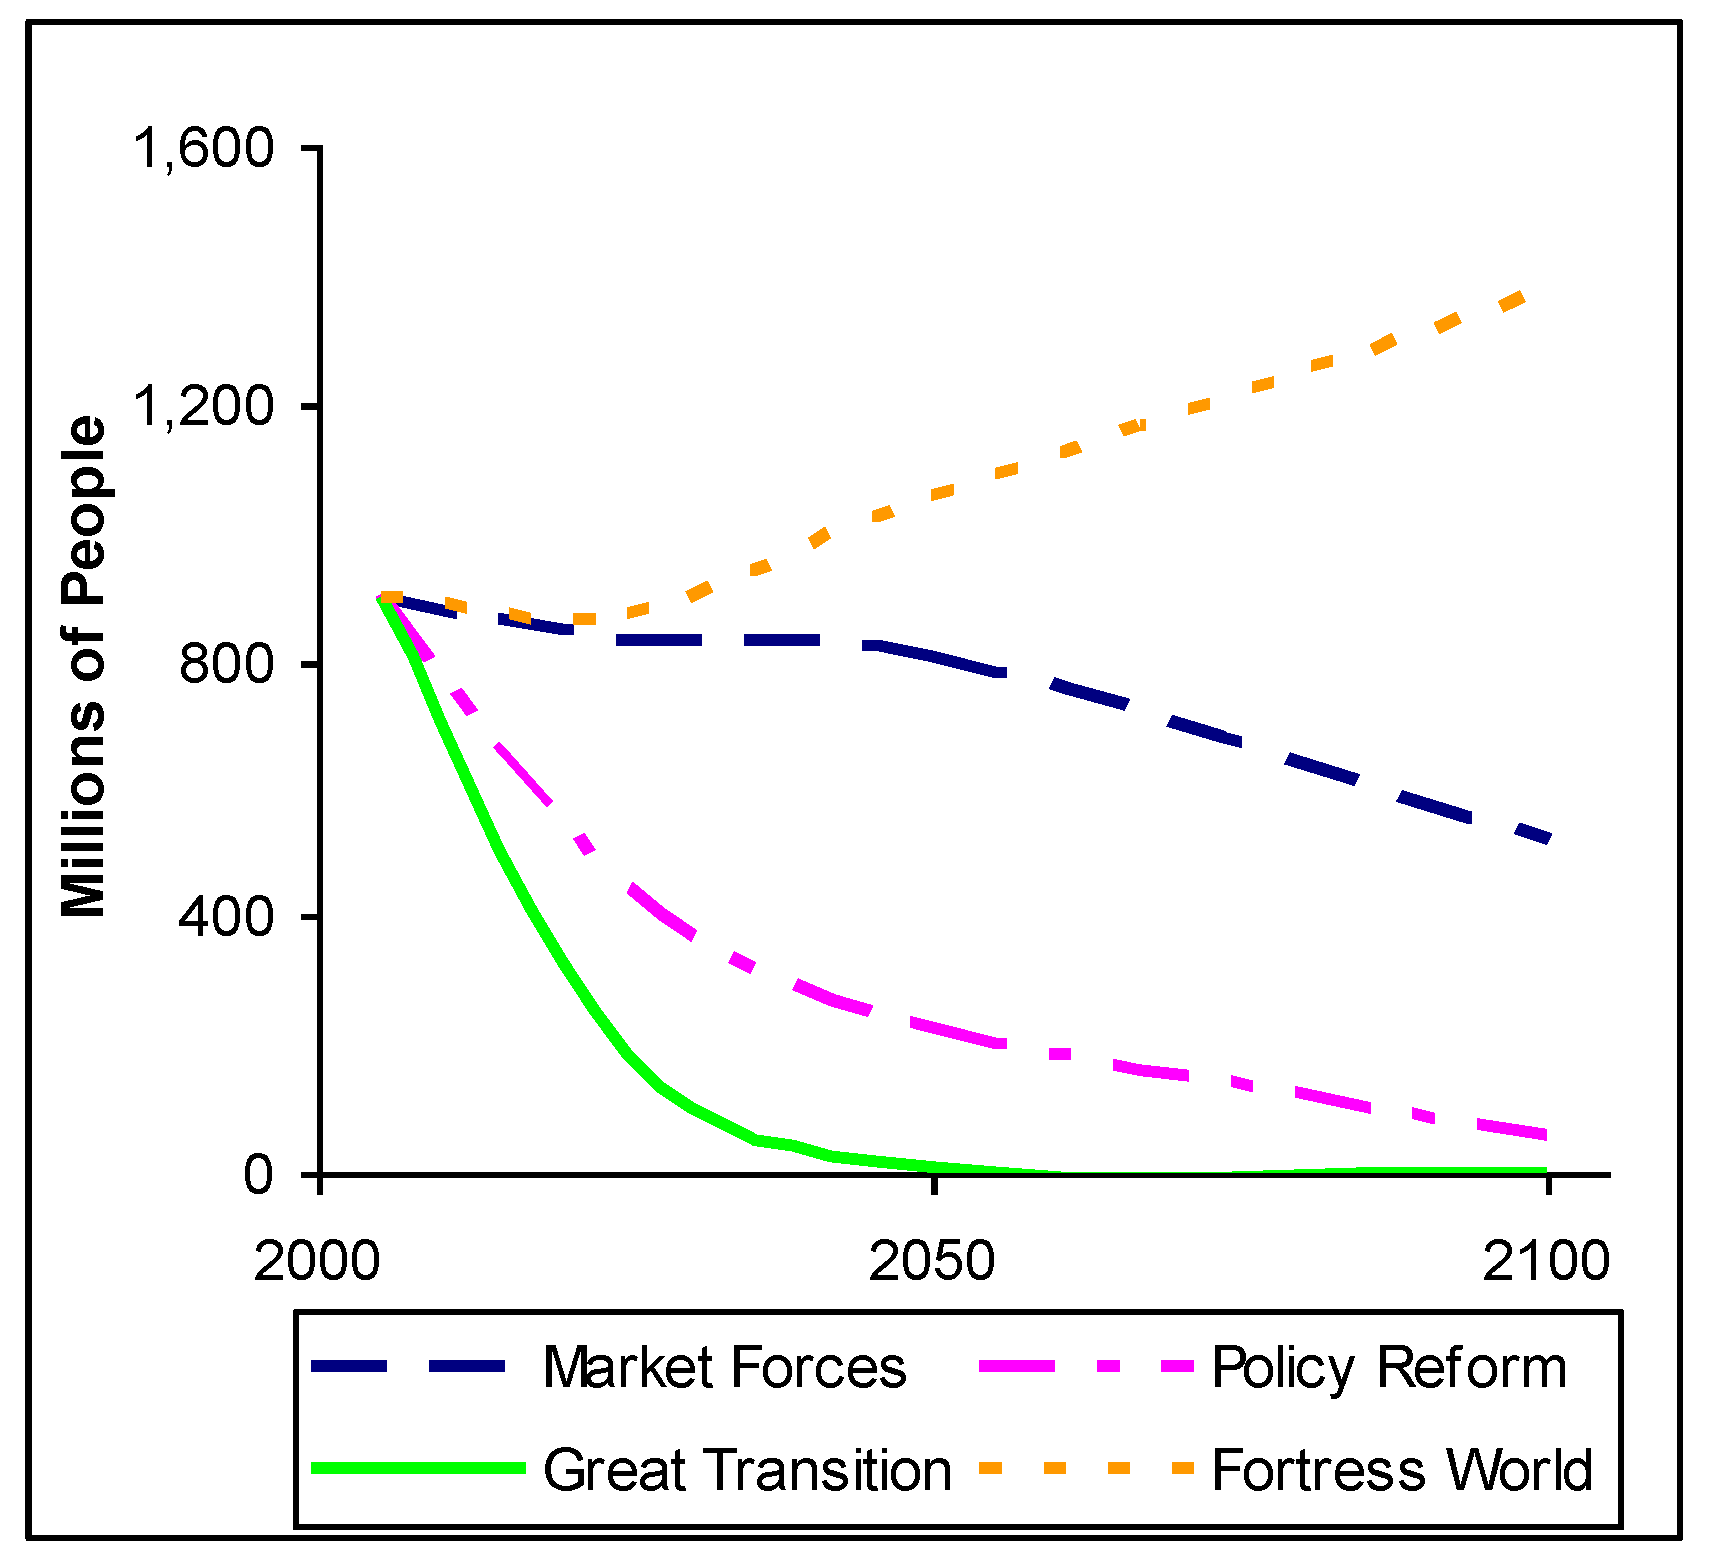
4.1.5. Poverty and hunger
The incidence of chronic hunger, our primary indicator of poverty, varies dramatically in the scenarios. The number of chronically undernourished people in a region depends on four key parameters: population, average income, income distribution, and the “hunger line,” the income below which most people today are hungry. Hunger lines increase as countries get richer as traditional, non-monetary coping mechanisms lose efficacy (for details on the methods used for computing hunger, see [9], p. 26). Since these various factors evolve differently across the scenarios, hunger trends differ as well (Figure 6). The sustainability target for the Policy Reform scenario is to halve world hunger by 2025, and halve it again by 2050. The Great Transition scenario reduces hunger far more rapidly as incomes converge more quickly both between and within regions. In Market Forces, current levels of hunger persist through 2050 as population growth counterbalances the poverty reducing effects of income growth. In the polarized Fortress World, hunger rises persistently.
Figure 6.
Incidence of Hunger.
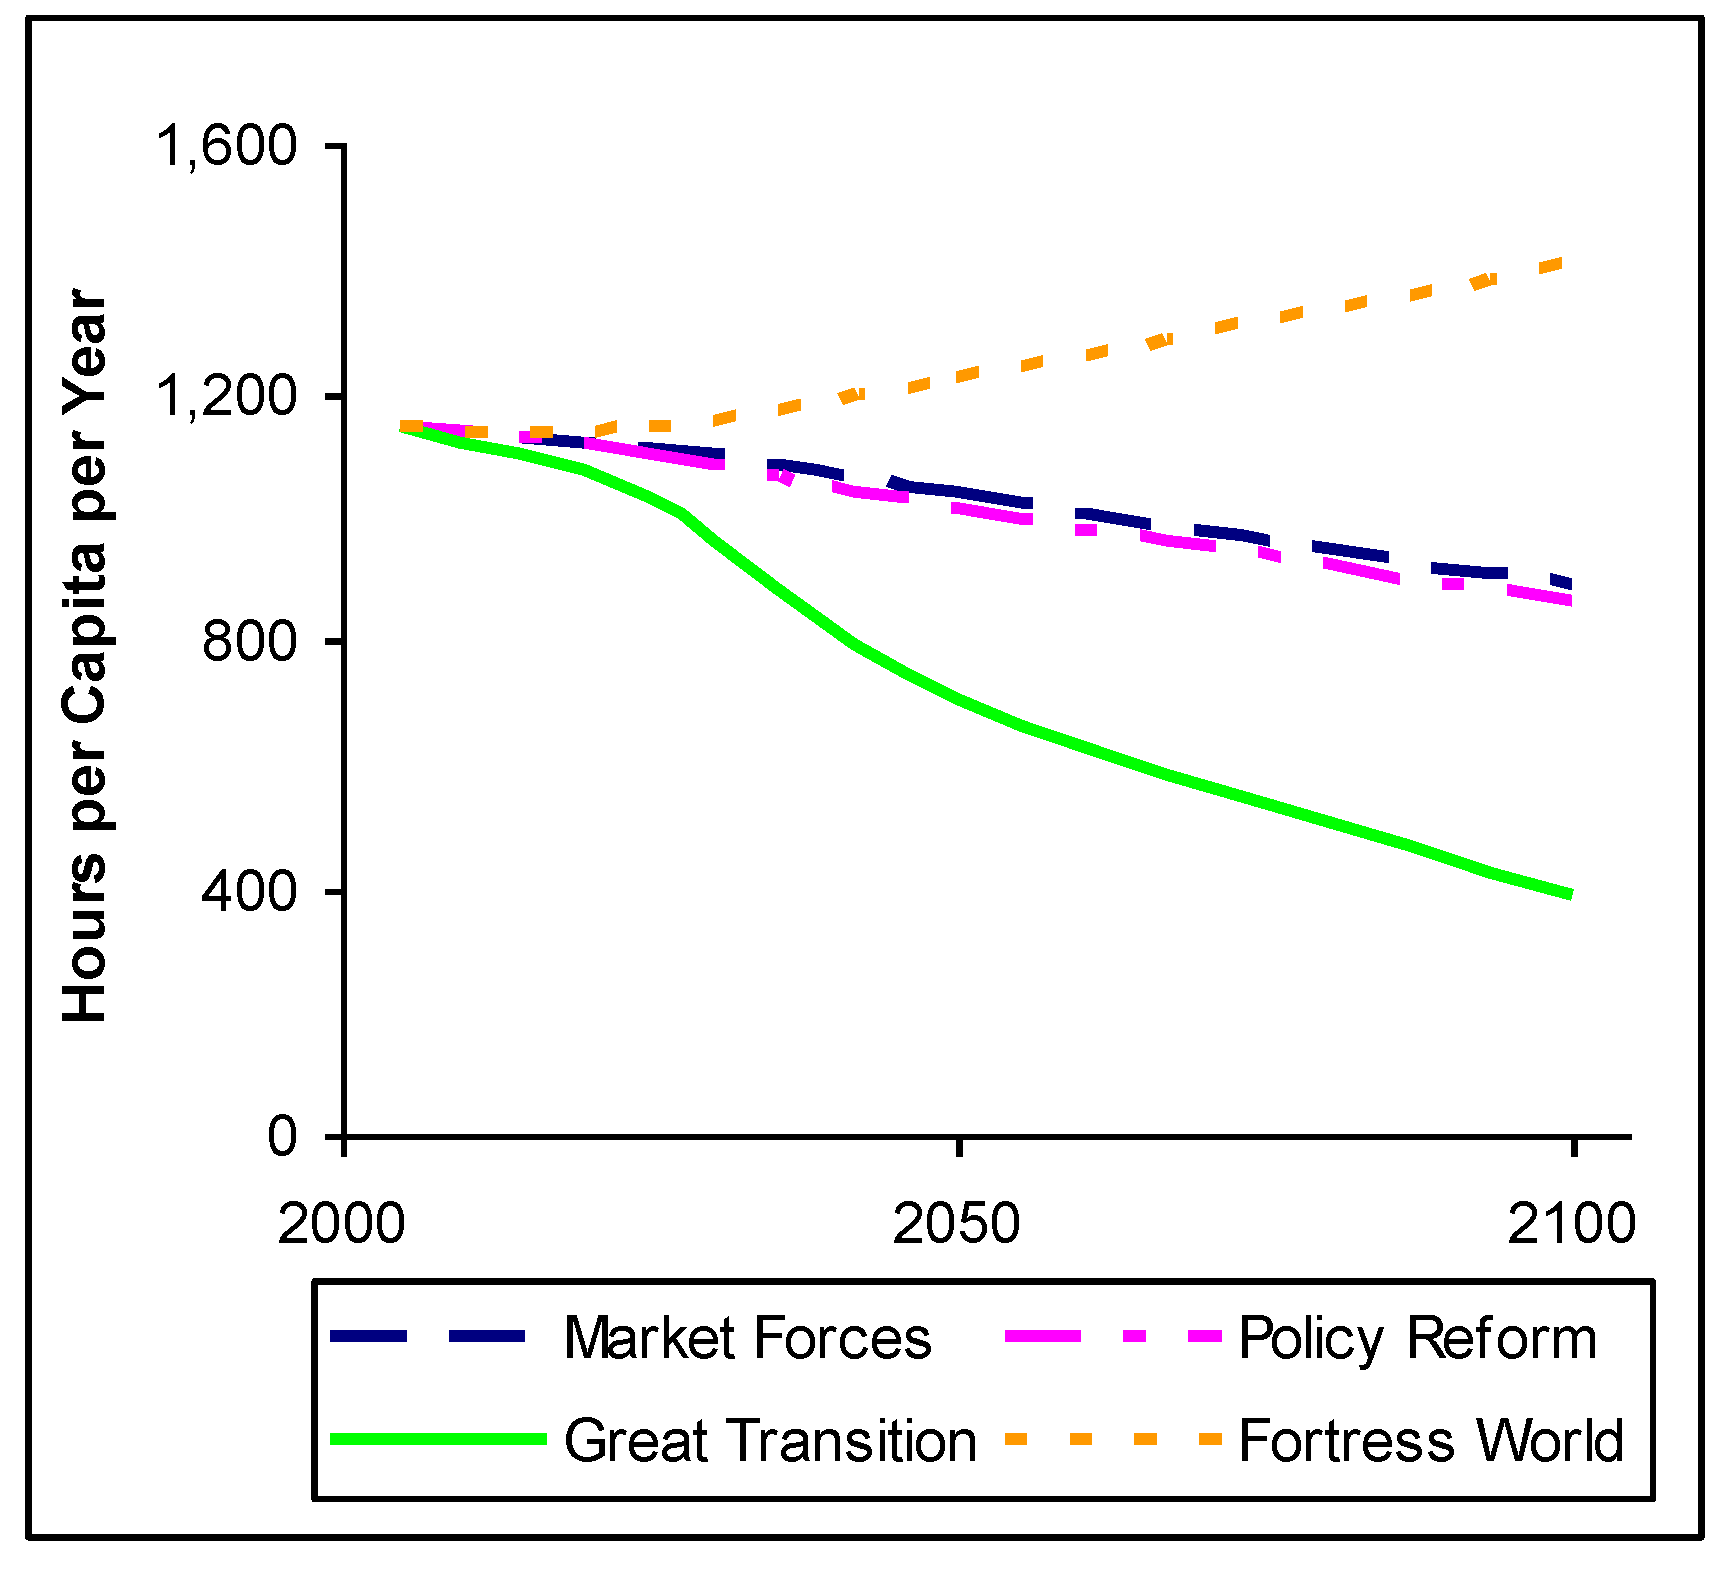
4.1.6. Work and leisure time
A key factor enhancing human well-being is the amount of time people have available for discretionary activities. Work time is defined here as the average number of hours worked per person across a whole population, including children, unemployed, and the elderly. Declining work time may be due to individuals working fewer hours and/or fewer people in the labor force due to, e.g., the elimination of child labor or earlier retirements. Work time is related to two other variables: GDP per capita and productivity (GDP per hour), since income equals productivity times work time. Market Forces and Policy Reform assume the maintenance of current work weeks in developed countries with gradual convergence to those levels in developing countries (leading to the decreases in global averages shown in Figure 7). Work time trends higher in Fortress World as the poor, who shoulder higher work loads, increase as a percentage of the population. In contrast, work time falls substantially in Great Transition as emphasis moves from production and consumption to quality of life. In this scenario, a worker in the United States might, for example, put in a 3-day work weeks at 7 hours per day, with vacation time at current relatively high Western European levels.
Figure 7.
Work Time.
4.1.7. Travel
An energy intensive activity, travel can be a positive or negative feature of life, a source of pleasure and cosmopolitan enrichment, on the one hand, or the drudgery of commuting and onerous business travel, on the other. In Market Forces and Policy Reform, past trends showing a strong correlation between travel levels and rising incomes persist (Figure 8). As large segments of the population become mired in poverty, travel declines in Fortress World. In Great Transition, rapid economic development in poorer regions drives average per capita distance traveled higher through mid-century, with slower growth thereafter with the approach of steady-state economies. Notably, the energy required per kilometer traveled becomes far lower in Great Transition due to greater dependence on environmentally-friendly modes: 26 percent of passenger travel is via public transportation by 2100 (versus 7 percent in Market Forces), and compact settlement patterns encourage more bicycling and walking.
Figure 8.
Travel Intensity.

4.2. Environment and Natural Resources
4.2.1. Climate change
Carbon dioxide, the most significant anthropogenic greenhouse gas, is emitted from fossil fuel combustion, industrial processes, and land-use change. In Market Forces, where proactive energy efficiency and renewable energy measures remain weak, CO2 emissions rise from 30 to 73 billion tonnes per year in 2100 as economic growth outpaces a 1.3 percent per annum decline in carbon intensity (CO2 emissions per dollar of GDP). In Policy Reform and Great Transition, scenarios designed to prevent global warming greater than 2 °C, CO2 emissions decrease quickly and dramatically (Figure 9(a)). This daunting constraint requires deep improvements in energy efficiency, rapid uptake of renewable energy, and soil and forest conservation. Even with maximal effort, we see from the figure that emissions must become negative after 2075, accomplished by capturing and sequestering CO2 from the waste stream of biomass-burning power plants. When biomass harvest is balanced by regeneration, burning biomass for electricity is carbon neutral. If, in addition, post-combustion CO2 is captured and stored underground (say, in abandoned mines), the net effect is to remove that quantity of CO2 from the atmosphere.
Figure 9.
Carbon Dioxide Emissions.

The long atmospheric residence time of CO2 requires a focus on cumulative emissions, the sum of annual net emissions (Figure 9(b)). Meeting the sustainability target of 350 parts per million (ppm) atmospheric CO2 concentration allows cumulative emissions of about 265 GtC between 2005 and 2100, which implies a CO2-equivalent concentration of approximately 450 ppm when other greenhouse gases are included [14,15]. This would give an approximately 70 percent chance of meeting the 2 °C temperature change constraint [16]; some stress that even lower concentrations levels may be necessary [17]. In Policy Reform and Great Transition, global emission rights are distributed on the “contraction and convergence” equity principle wherein aggregate annual global emissions are capped and allocated to countries on the basis of population, approaching equal per capita emission rights by mid-century. This criterion allows temporary increases in emissions in poorer countries in the transition to a decarbonized global development path (Figure 9(c)). Emissions in OECD countries must fall some 85 percent by 2050.
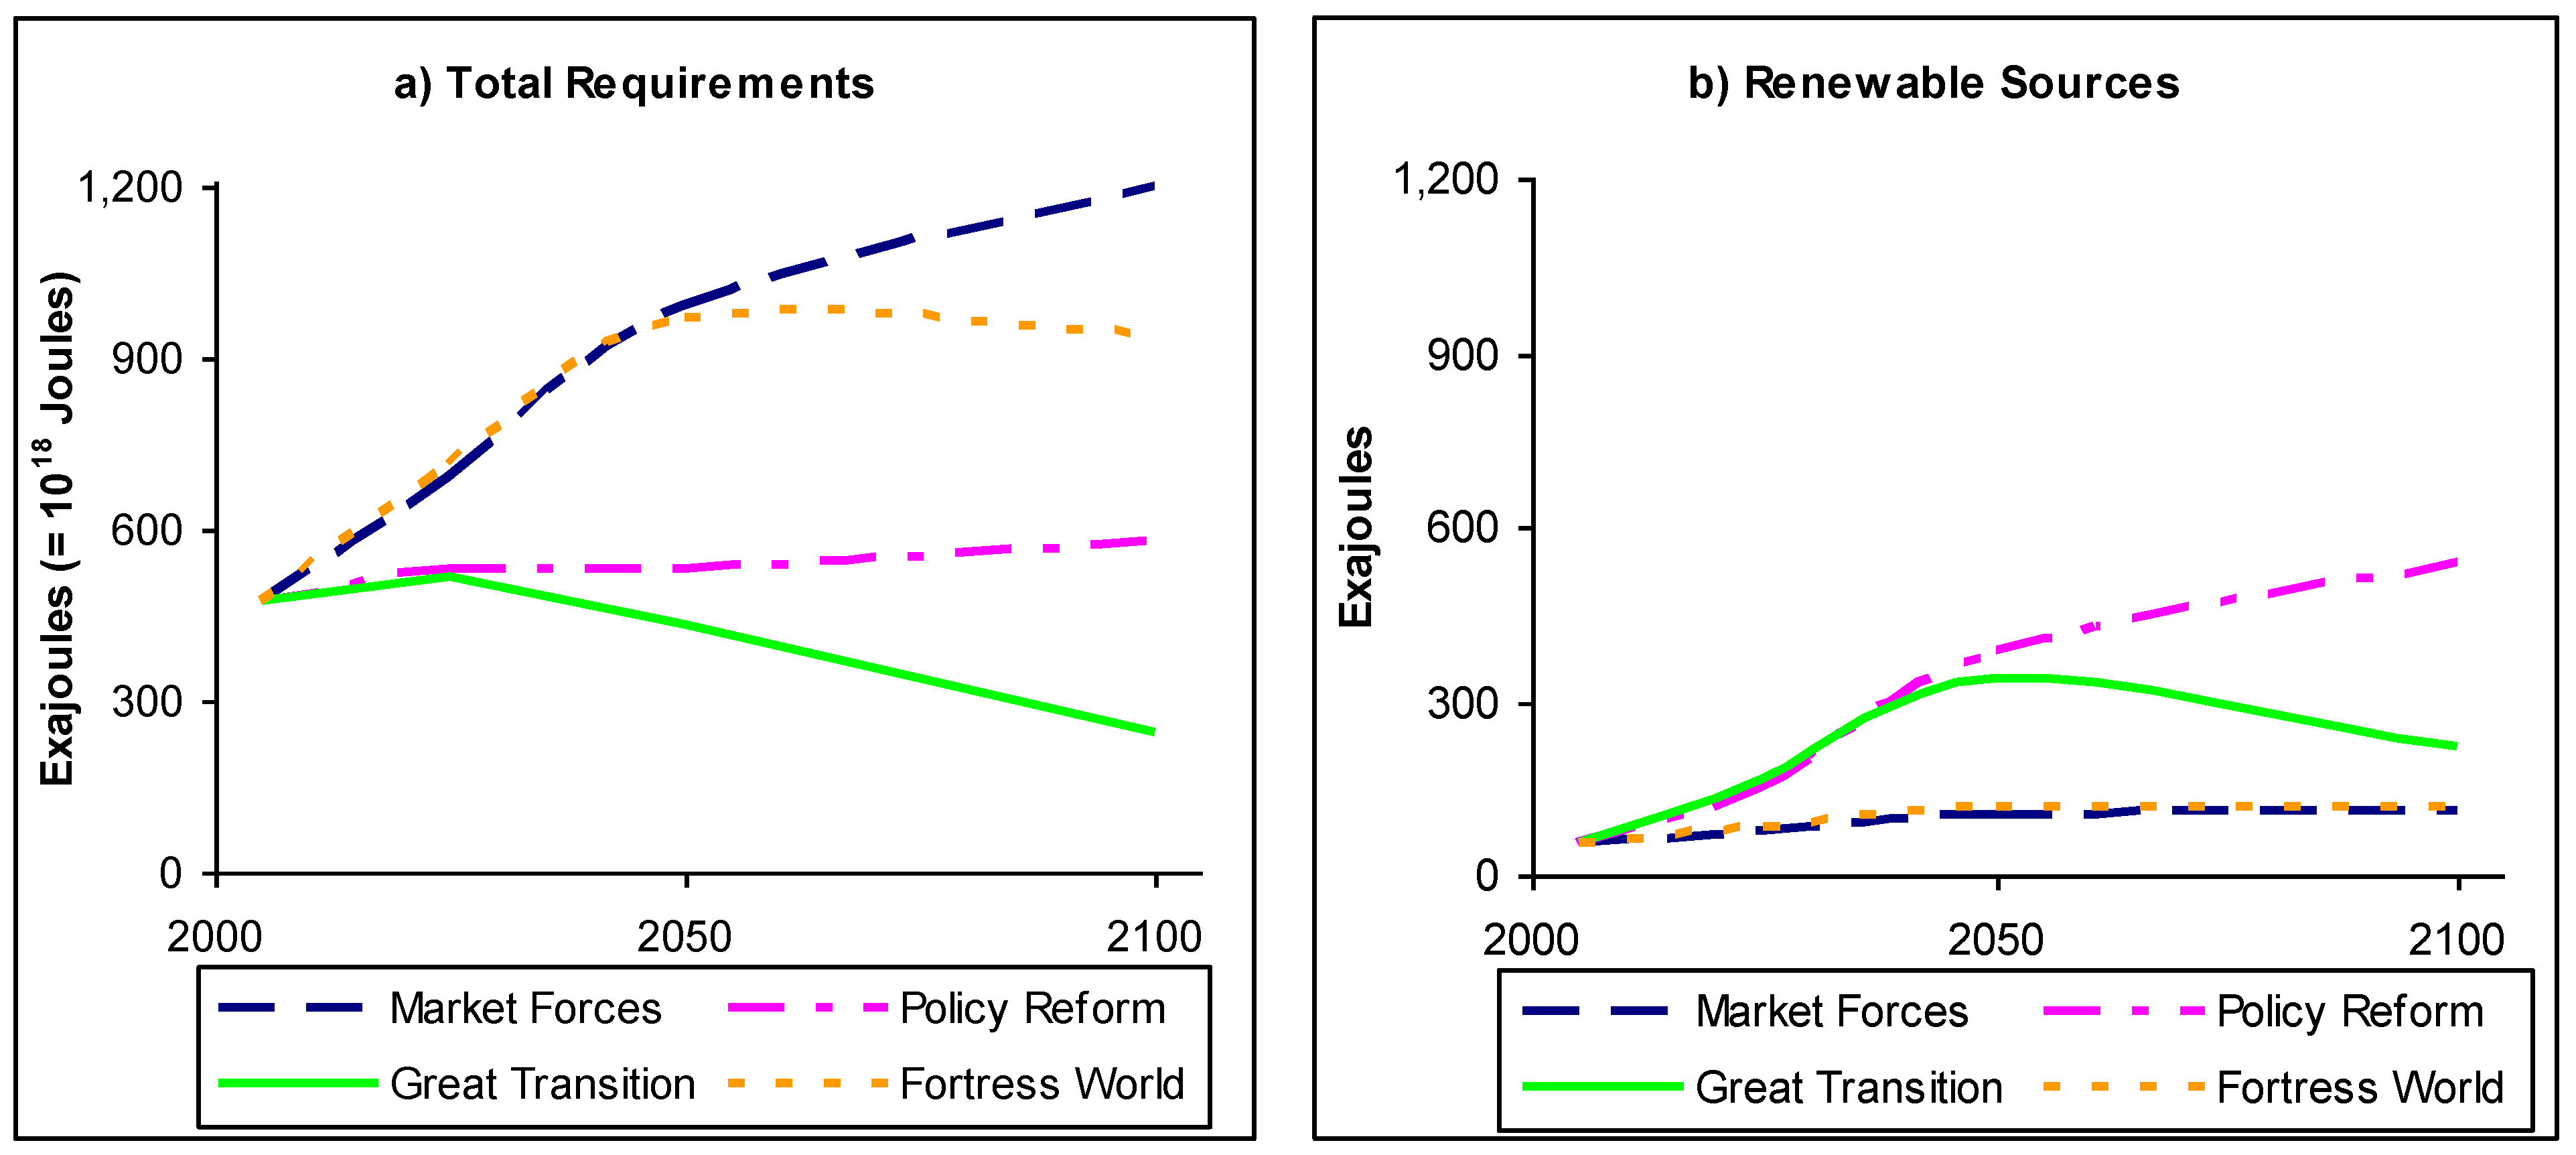
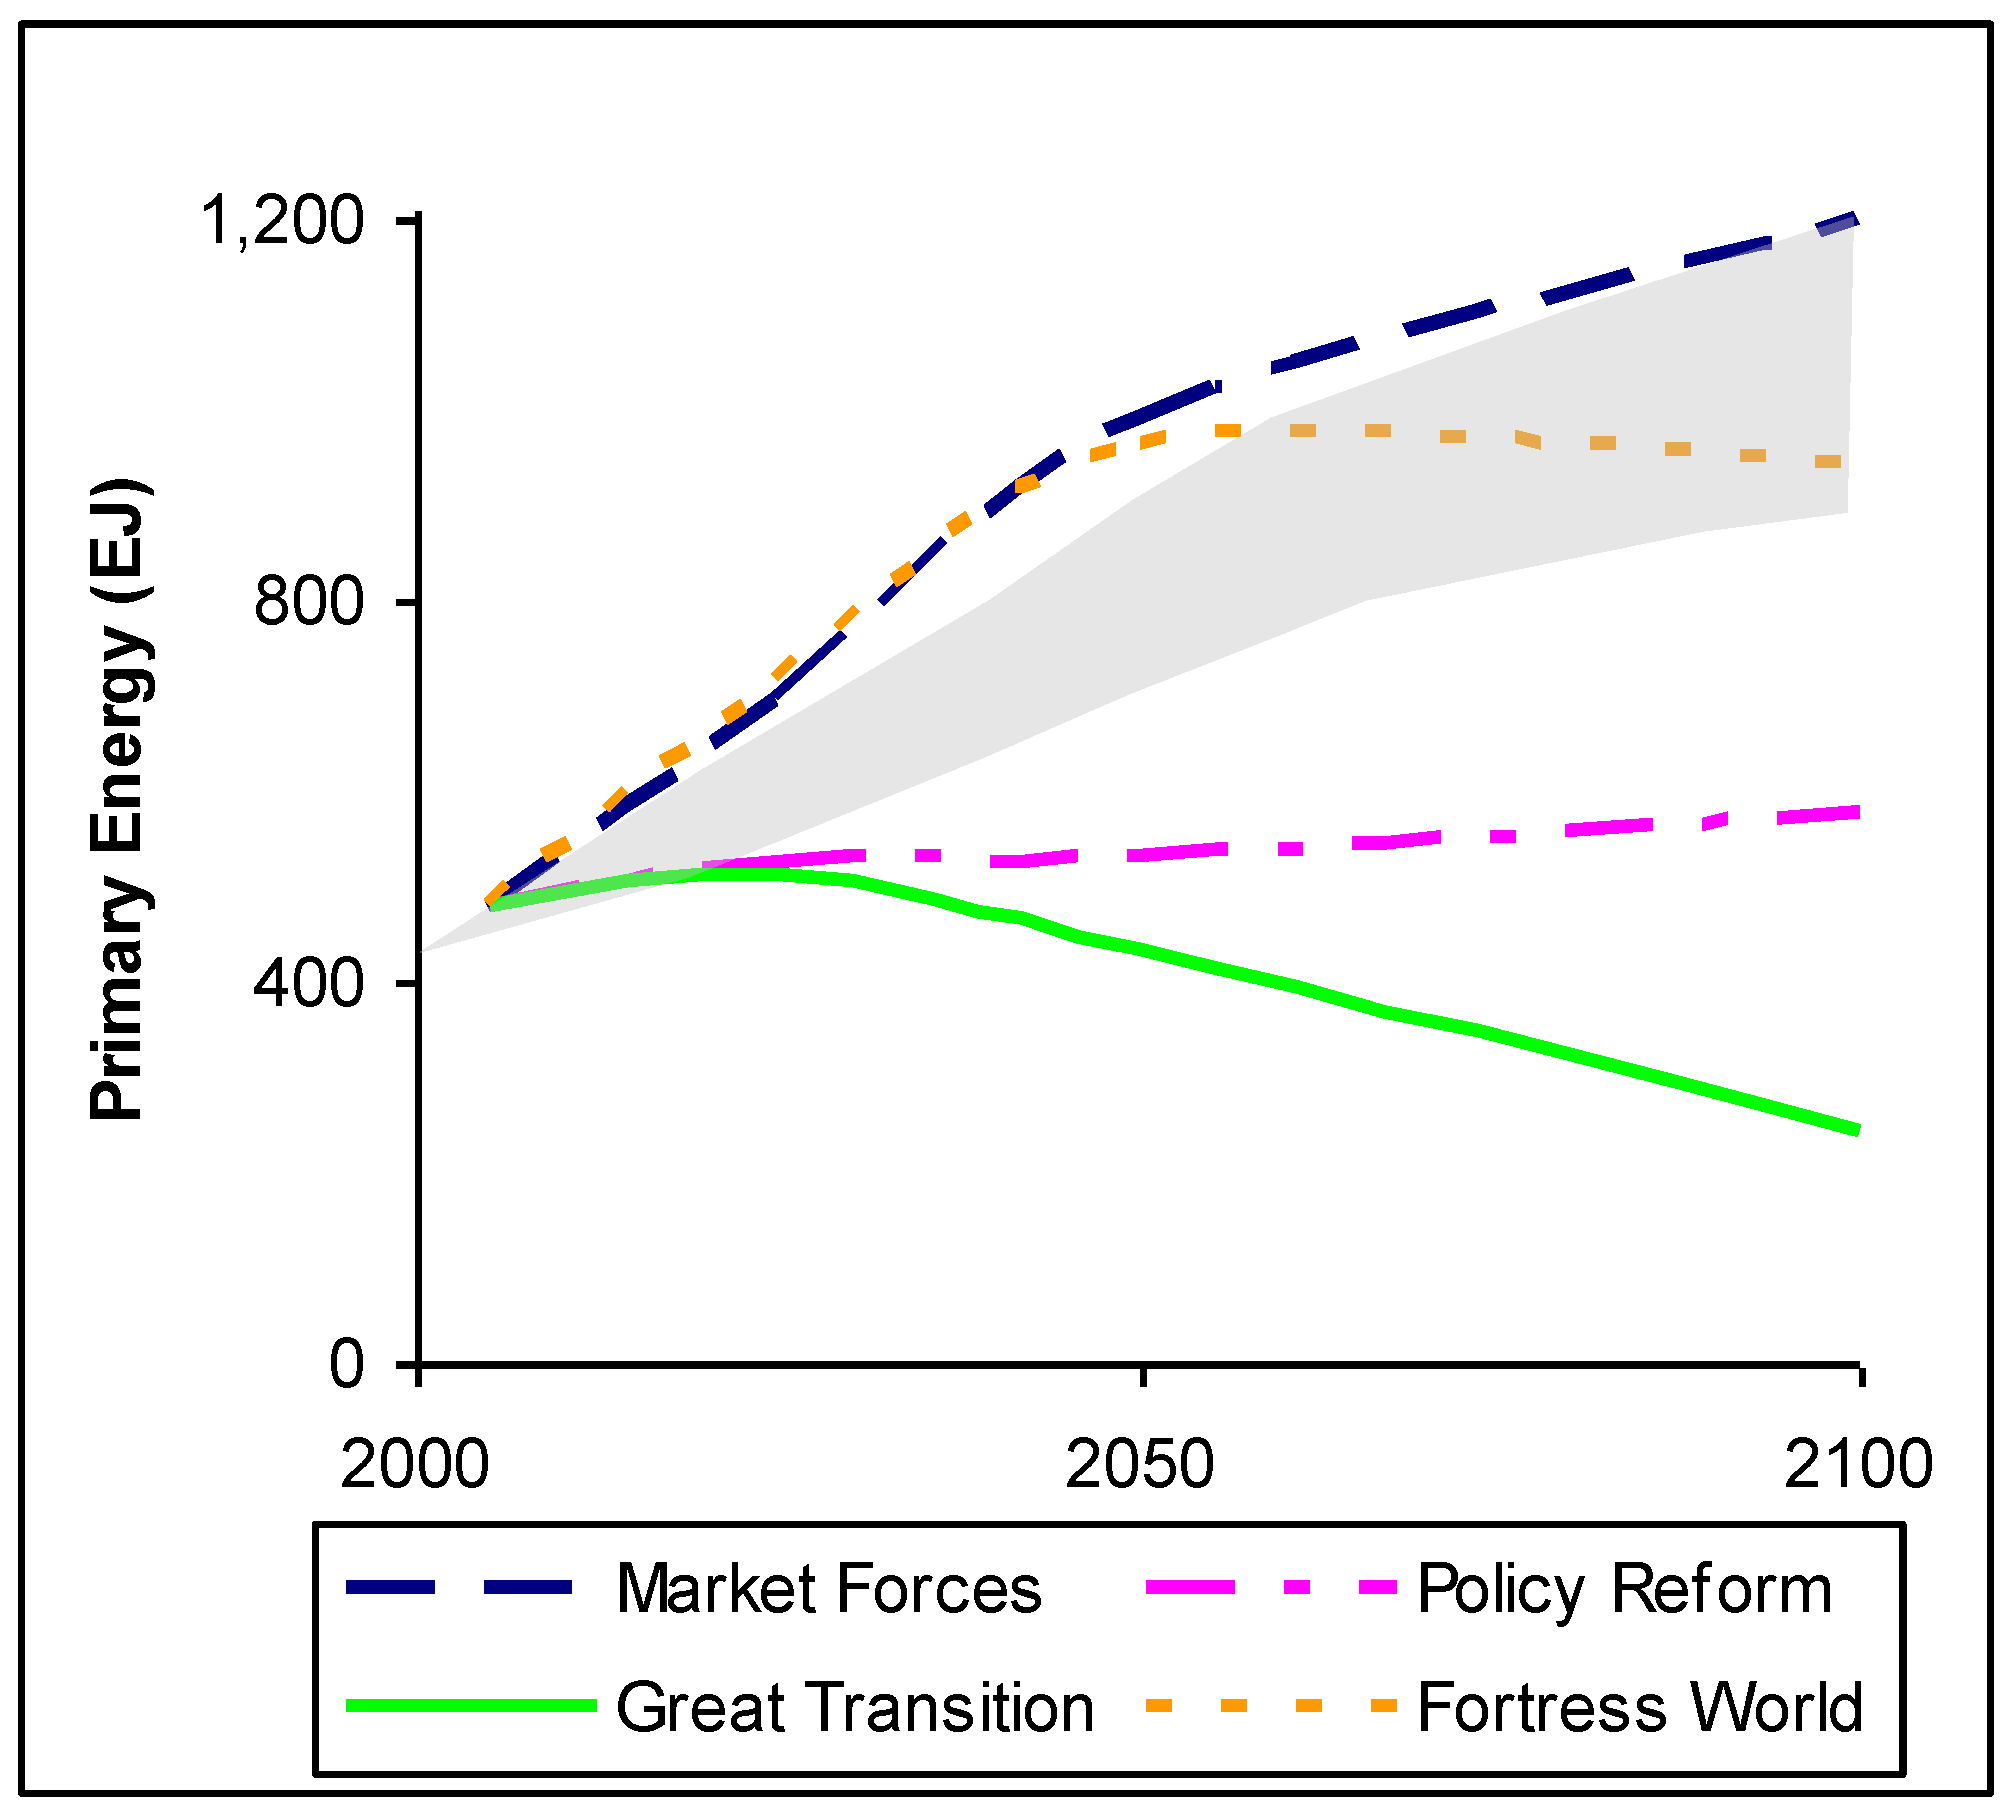
4.2.2. Energy demand
Achieving these climate goals requires strongly moderating energy demand and rapidly reducing the use of fossil fuels. We see from Figure 10(a) that energy demand in Policy Reform is far below Market Forces (a scenario that itself encompasses significant market-induced energy efficiency improvements) as a result of across-the-board efforts to promote highly efficient vehicles, green building regulations, and appliance and industrial process standards. Great Transition achieves additional reductions in energy demand, primarily through dematerialized lifestyles: moderated consumption, compact settlement patterns, reduced travel, and less meat-intensive diets. The lower energy demands in the Great Transition scenario substantially reduce the burdens of building the new post-fossil fuel energy infrastructure and depending on carbon sequestration to meet emissions constraints. Fortress World energy demand decreases eventually, but for the unwelcome reasons that development goes into reverse.
Figure 10.
Energy.

4.2.3. Energy supply
Cost-effective conventional oil and gas resources are becoming scarce as requirements continue to rise. Any future gap between supply and demand will need to be filled by unconventional sources: shale oil, tar sands, biomass-based oils, and oil from coal. Table 6 shows estimates of the year of exhaustion of conventional resources in each scenario, suggesting that the onset of a widening shortfall is imminent in Market Forces and Fortress World. The evolutionary Market Forces vision assumes that a “peak oil” economic crisis can be avoided by bringing unconventional fossil fuel alternatives seamlessly to market in vast quantities, a Herculean technological task compounded by the heavier environmental burdens of the substitutes, which also require higher energy inputs in extraction and reformation stages. Policy Reform, by rapidly deploying additional energy efficiency technologies and renewable energy resources, postpones the exhaustion of conventional oil and gas for nearly a half century; Great Transition is able to avoid entirely the use of unconventional fossil fuels. Figure 10(b) shows trends in the use of renewable energy: gradual increase in Market Forces and Fortress World, and rapid increase in Policy Reform. Great Transition requirements decrease after 2050 in concert with decreasing total energy demand. These simulations assume nuclear-generated electricity remains a marginal energy source, limited by a host of risks: proliferation of nuclear weapons, storage of highly radioactive waste, safety, and high costs.
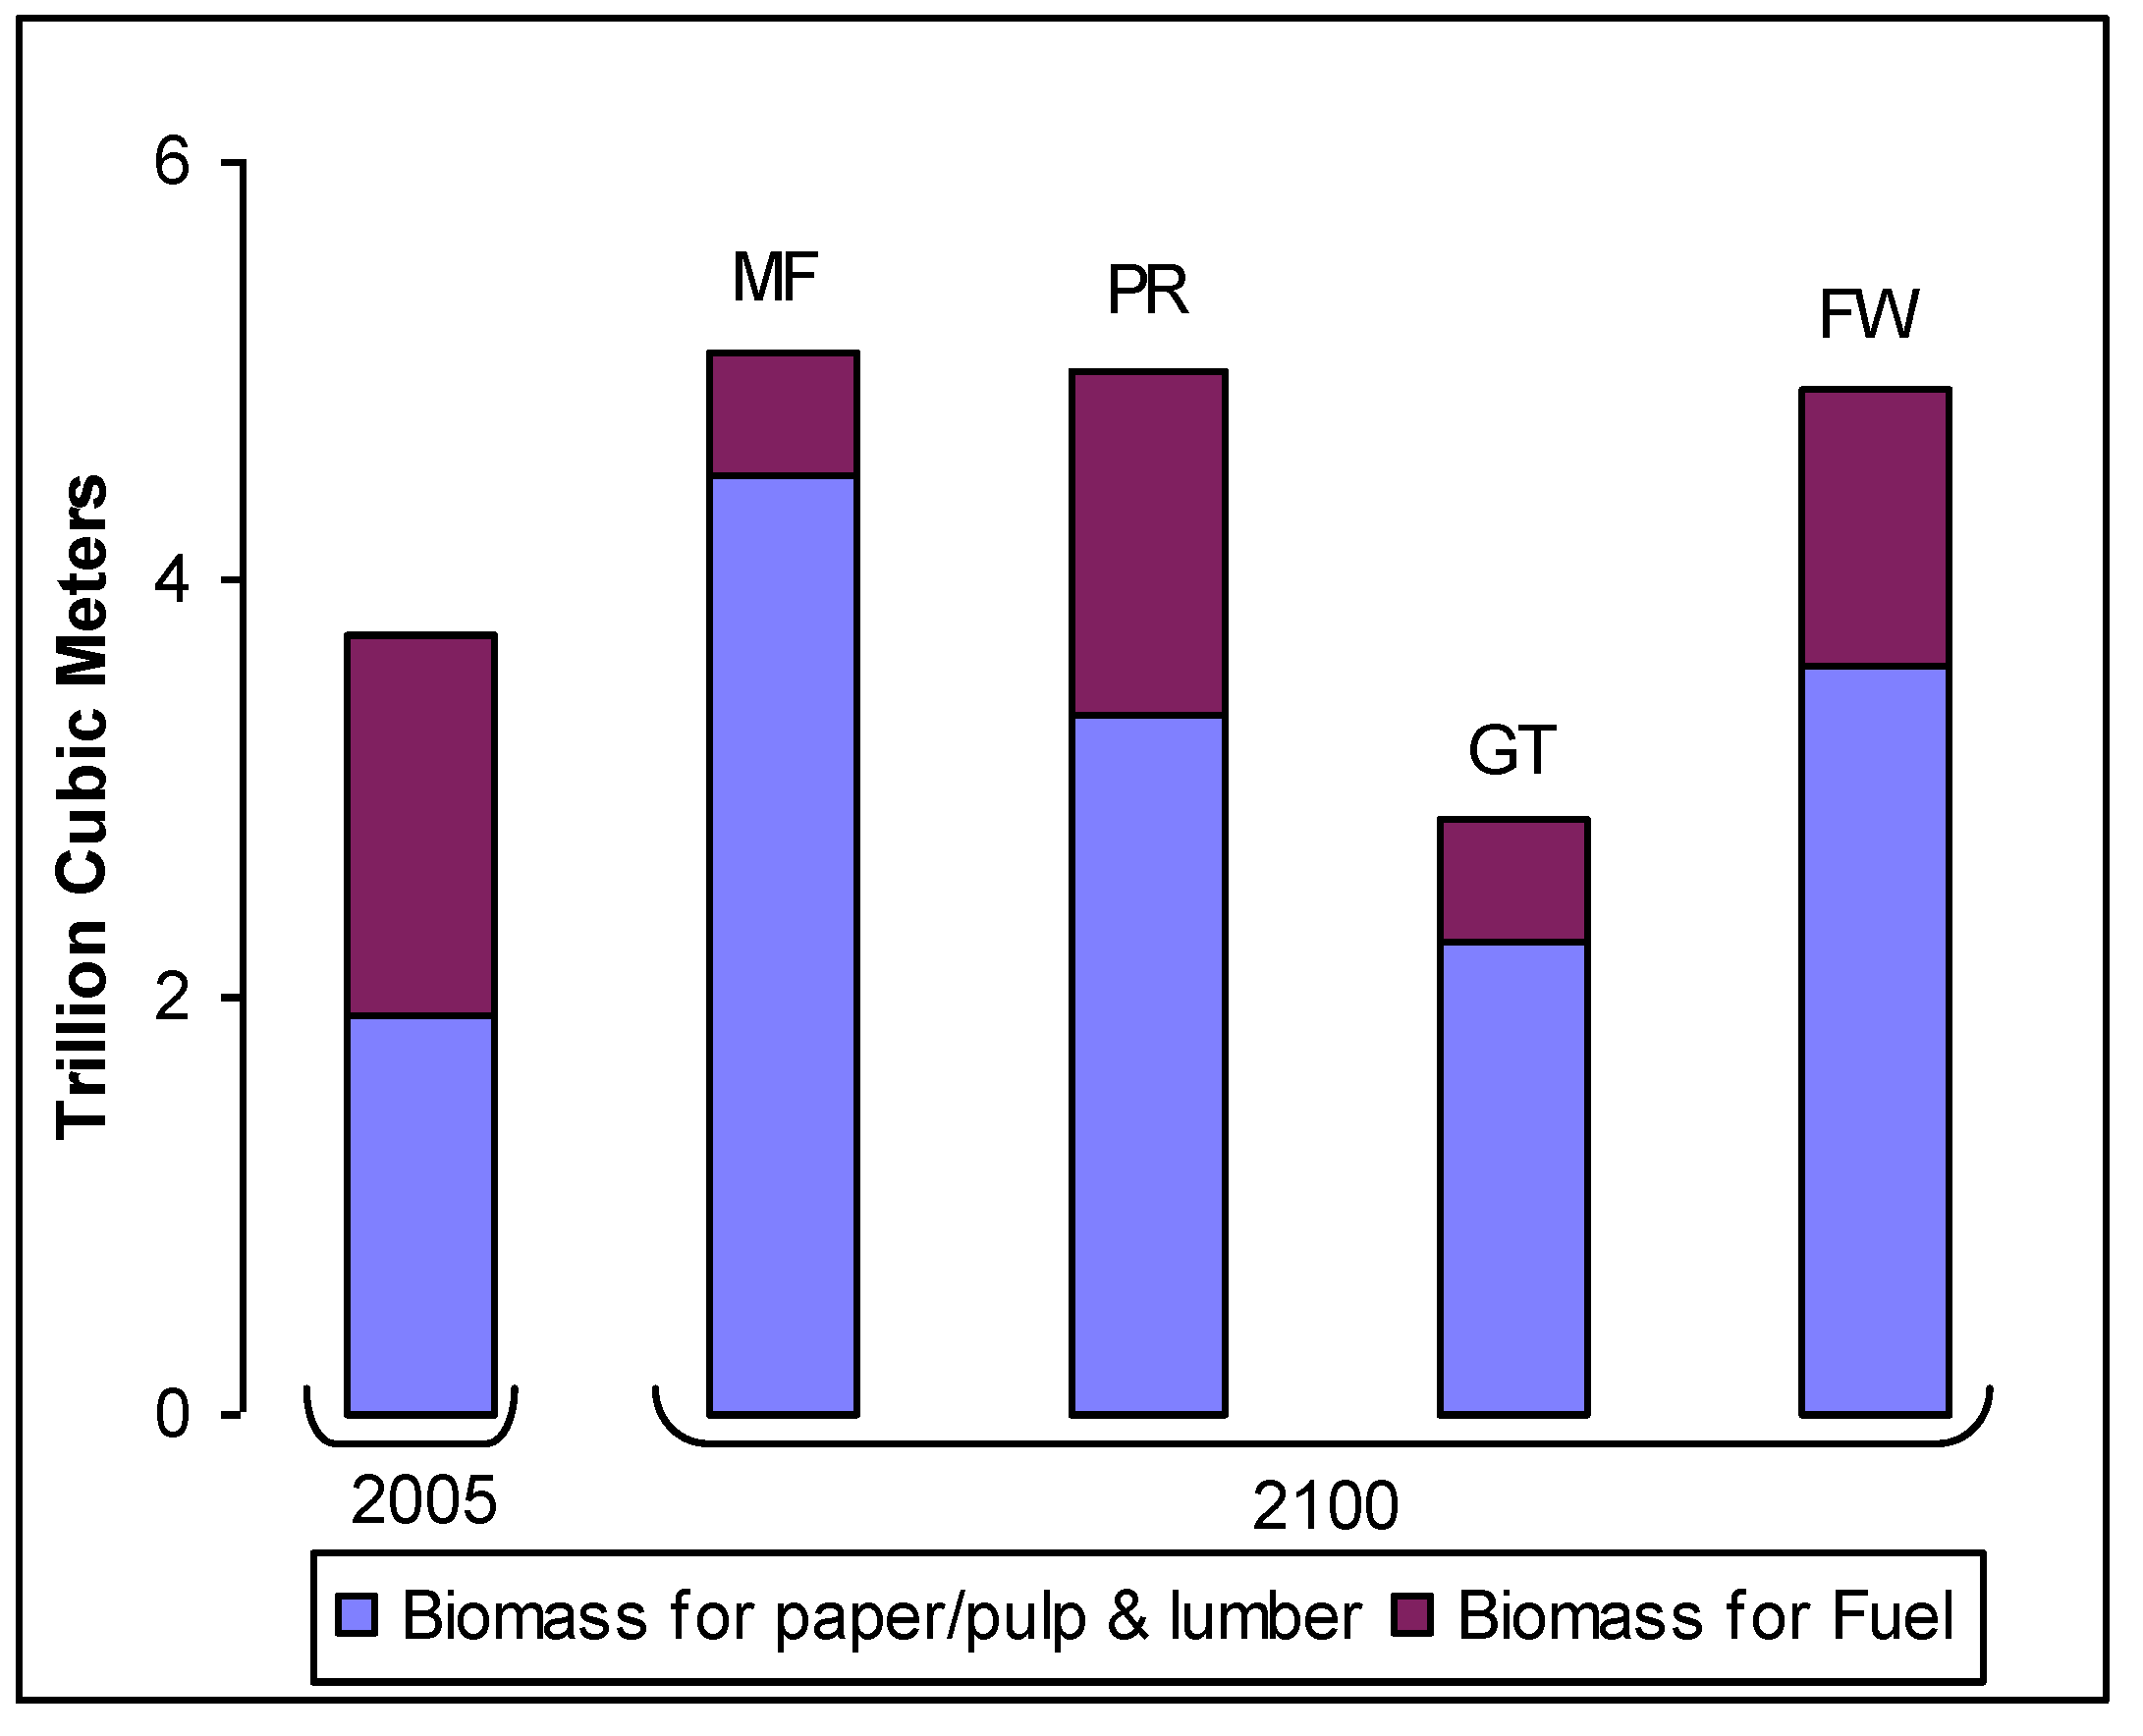
4.2.4. Biomass
Biomass is used as a fuel (firewood, bio-diesel, bio-kerosene, and ethanol) and a raw material for the paper and pulp, lumber, furniture, and construction industries. While lowering requirements for traditional firewood, rapid economic growth in Market Forces increases biomass demands in modern sectors (Figure 11). Despite strong waste recycling and efficiency measures, requirements are comparable in Policy Reform as biomass energy becomes a more significant element in the energy mix. However, land-intensive bio-fuel production competes with food production, putting additional pressure on agricultural innovations to increase yields and stabilize the prices of food staples. It takes the moderated energy demands of Great Transition for biomass demand to eventually decline from current levels, thereby sparing land for agriculture and nature.
Figure 11.
Biomass Production.

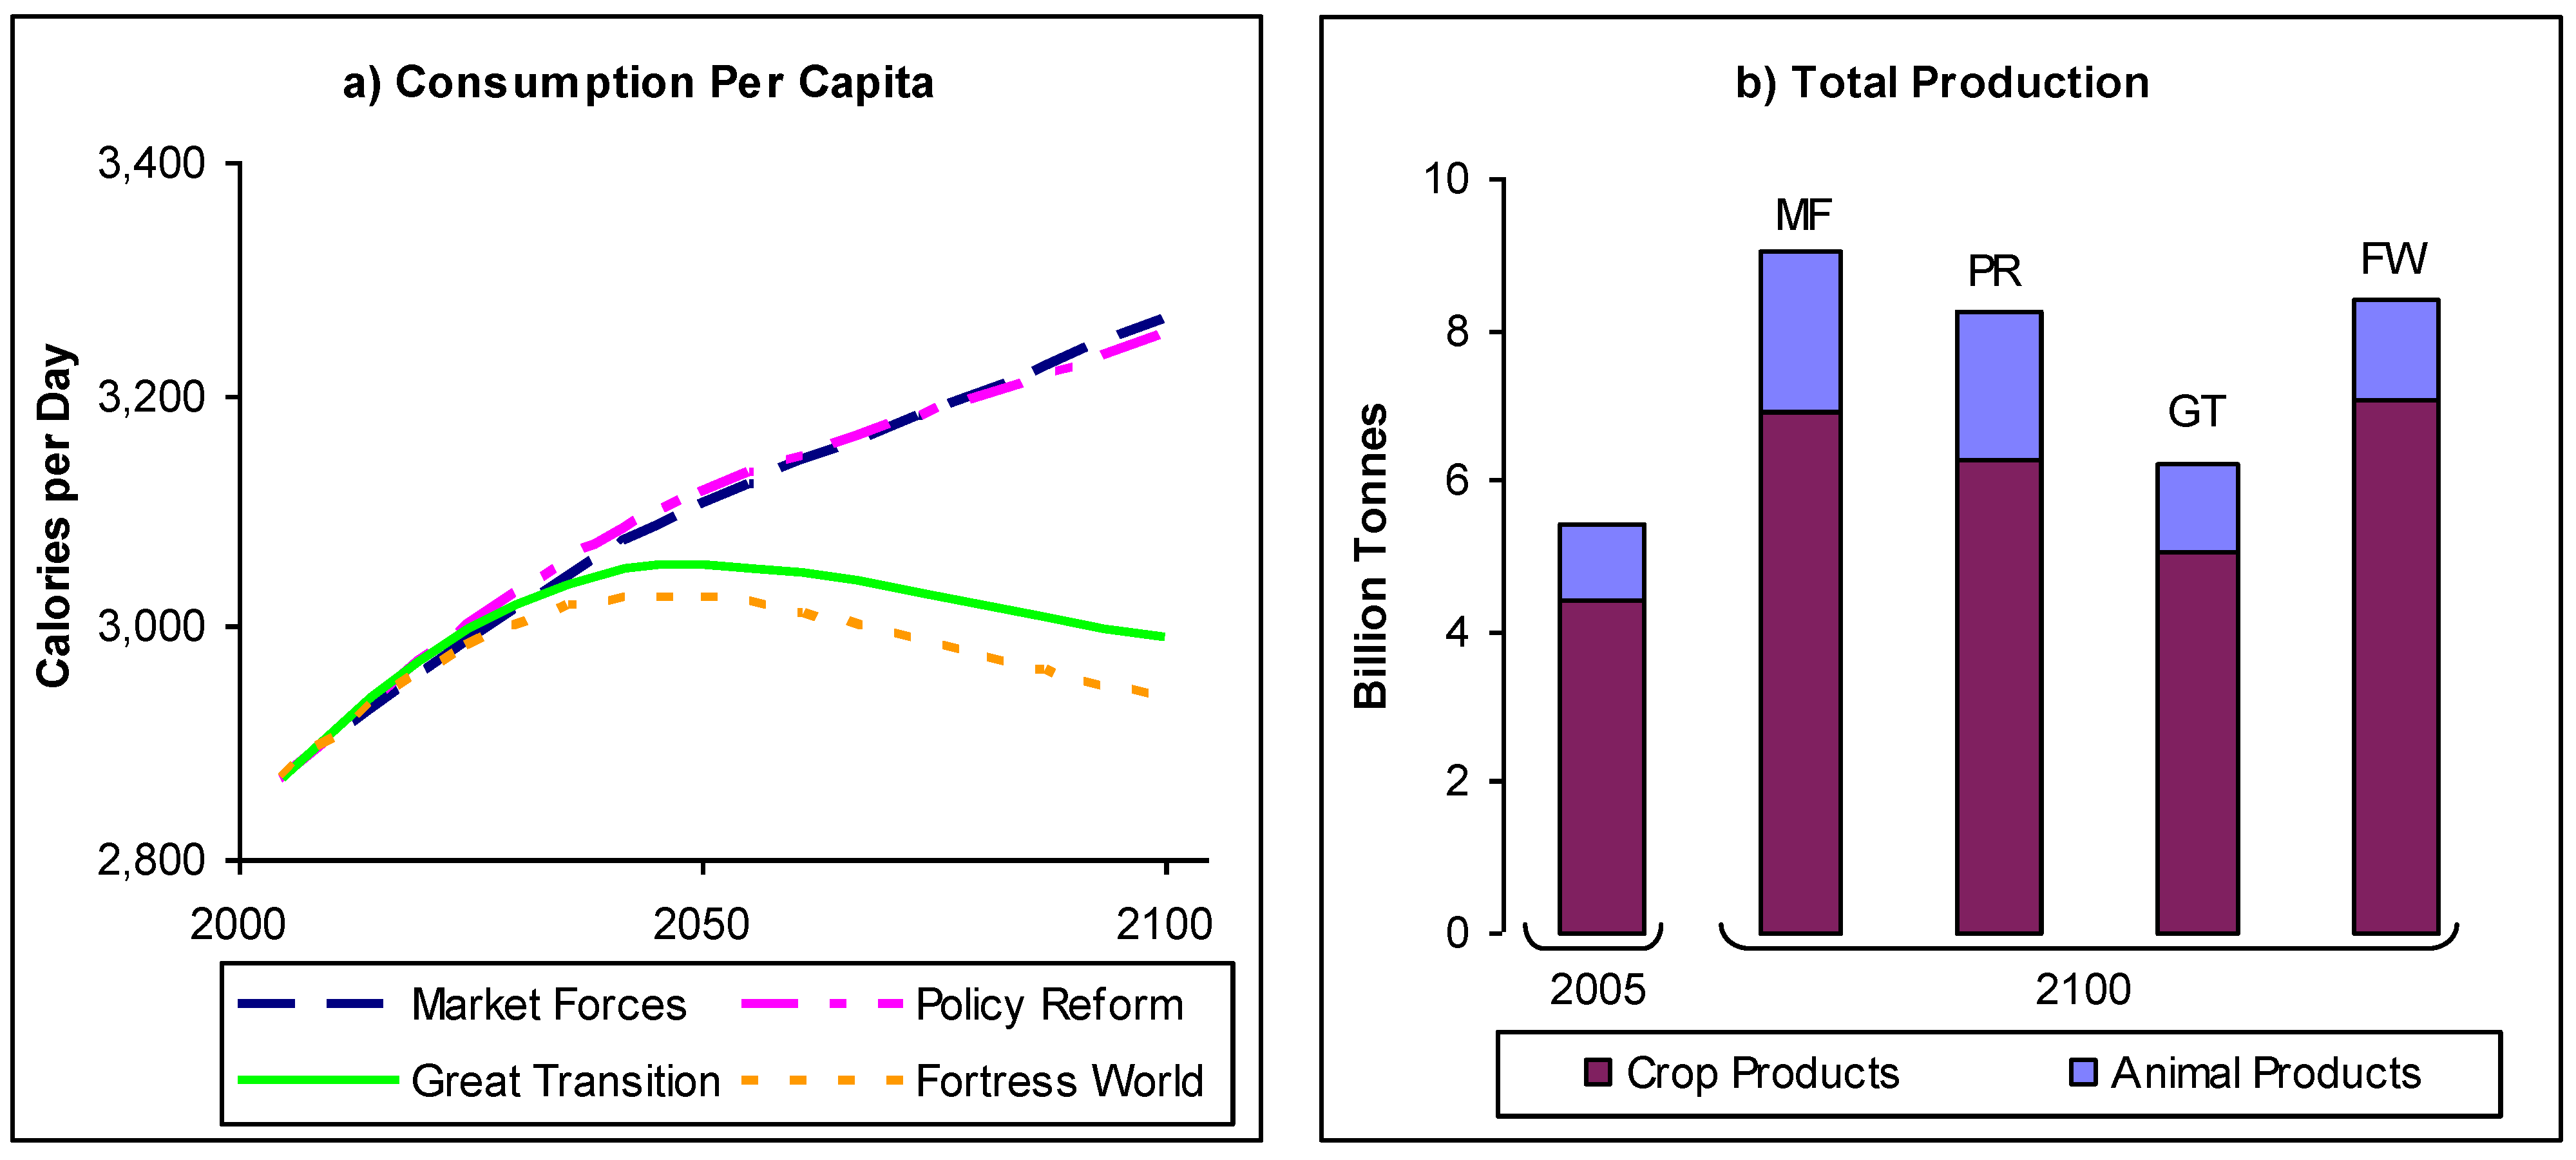
4.2.5. Food and agriculture
Adequate nutrition and sound agriculture practices are central to human and environmental well-being. In recent decades, the conversion of land to crops and pastures has had major detrimental impacts on natural forests and other important ecosystems. By rapidly increasing crop yields, the Green Revolution of the past half century helped avoid the then looming food shortages, while moderating land requirements. But modern farming practices require high inputs of chemicals and irrigation water that pollute, stress water resources, and degrade soil. A more sustainable development pathway would abjure crop-intensive and unhealthy high-meat diets, while adopting ecologically-sound farming practices. Global food requirements increase in all scenarios with rising incomes (Figure 12(a)), but decrease after 2050 in Great Transition as health and environmental motives foster diets high in nutrition and low in meat products. These diet adjustments, along with lower population, reduce aggregate requirements after 2050 (Figure 12(b)). On the production side, Market Forces and Fortress World rely heavily on chemical inputs and genetically modified organisms, while Policy Reform and Great Transition adopt organic, ecological agricultural methods.
Figure 12.
Food Requirements.

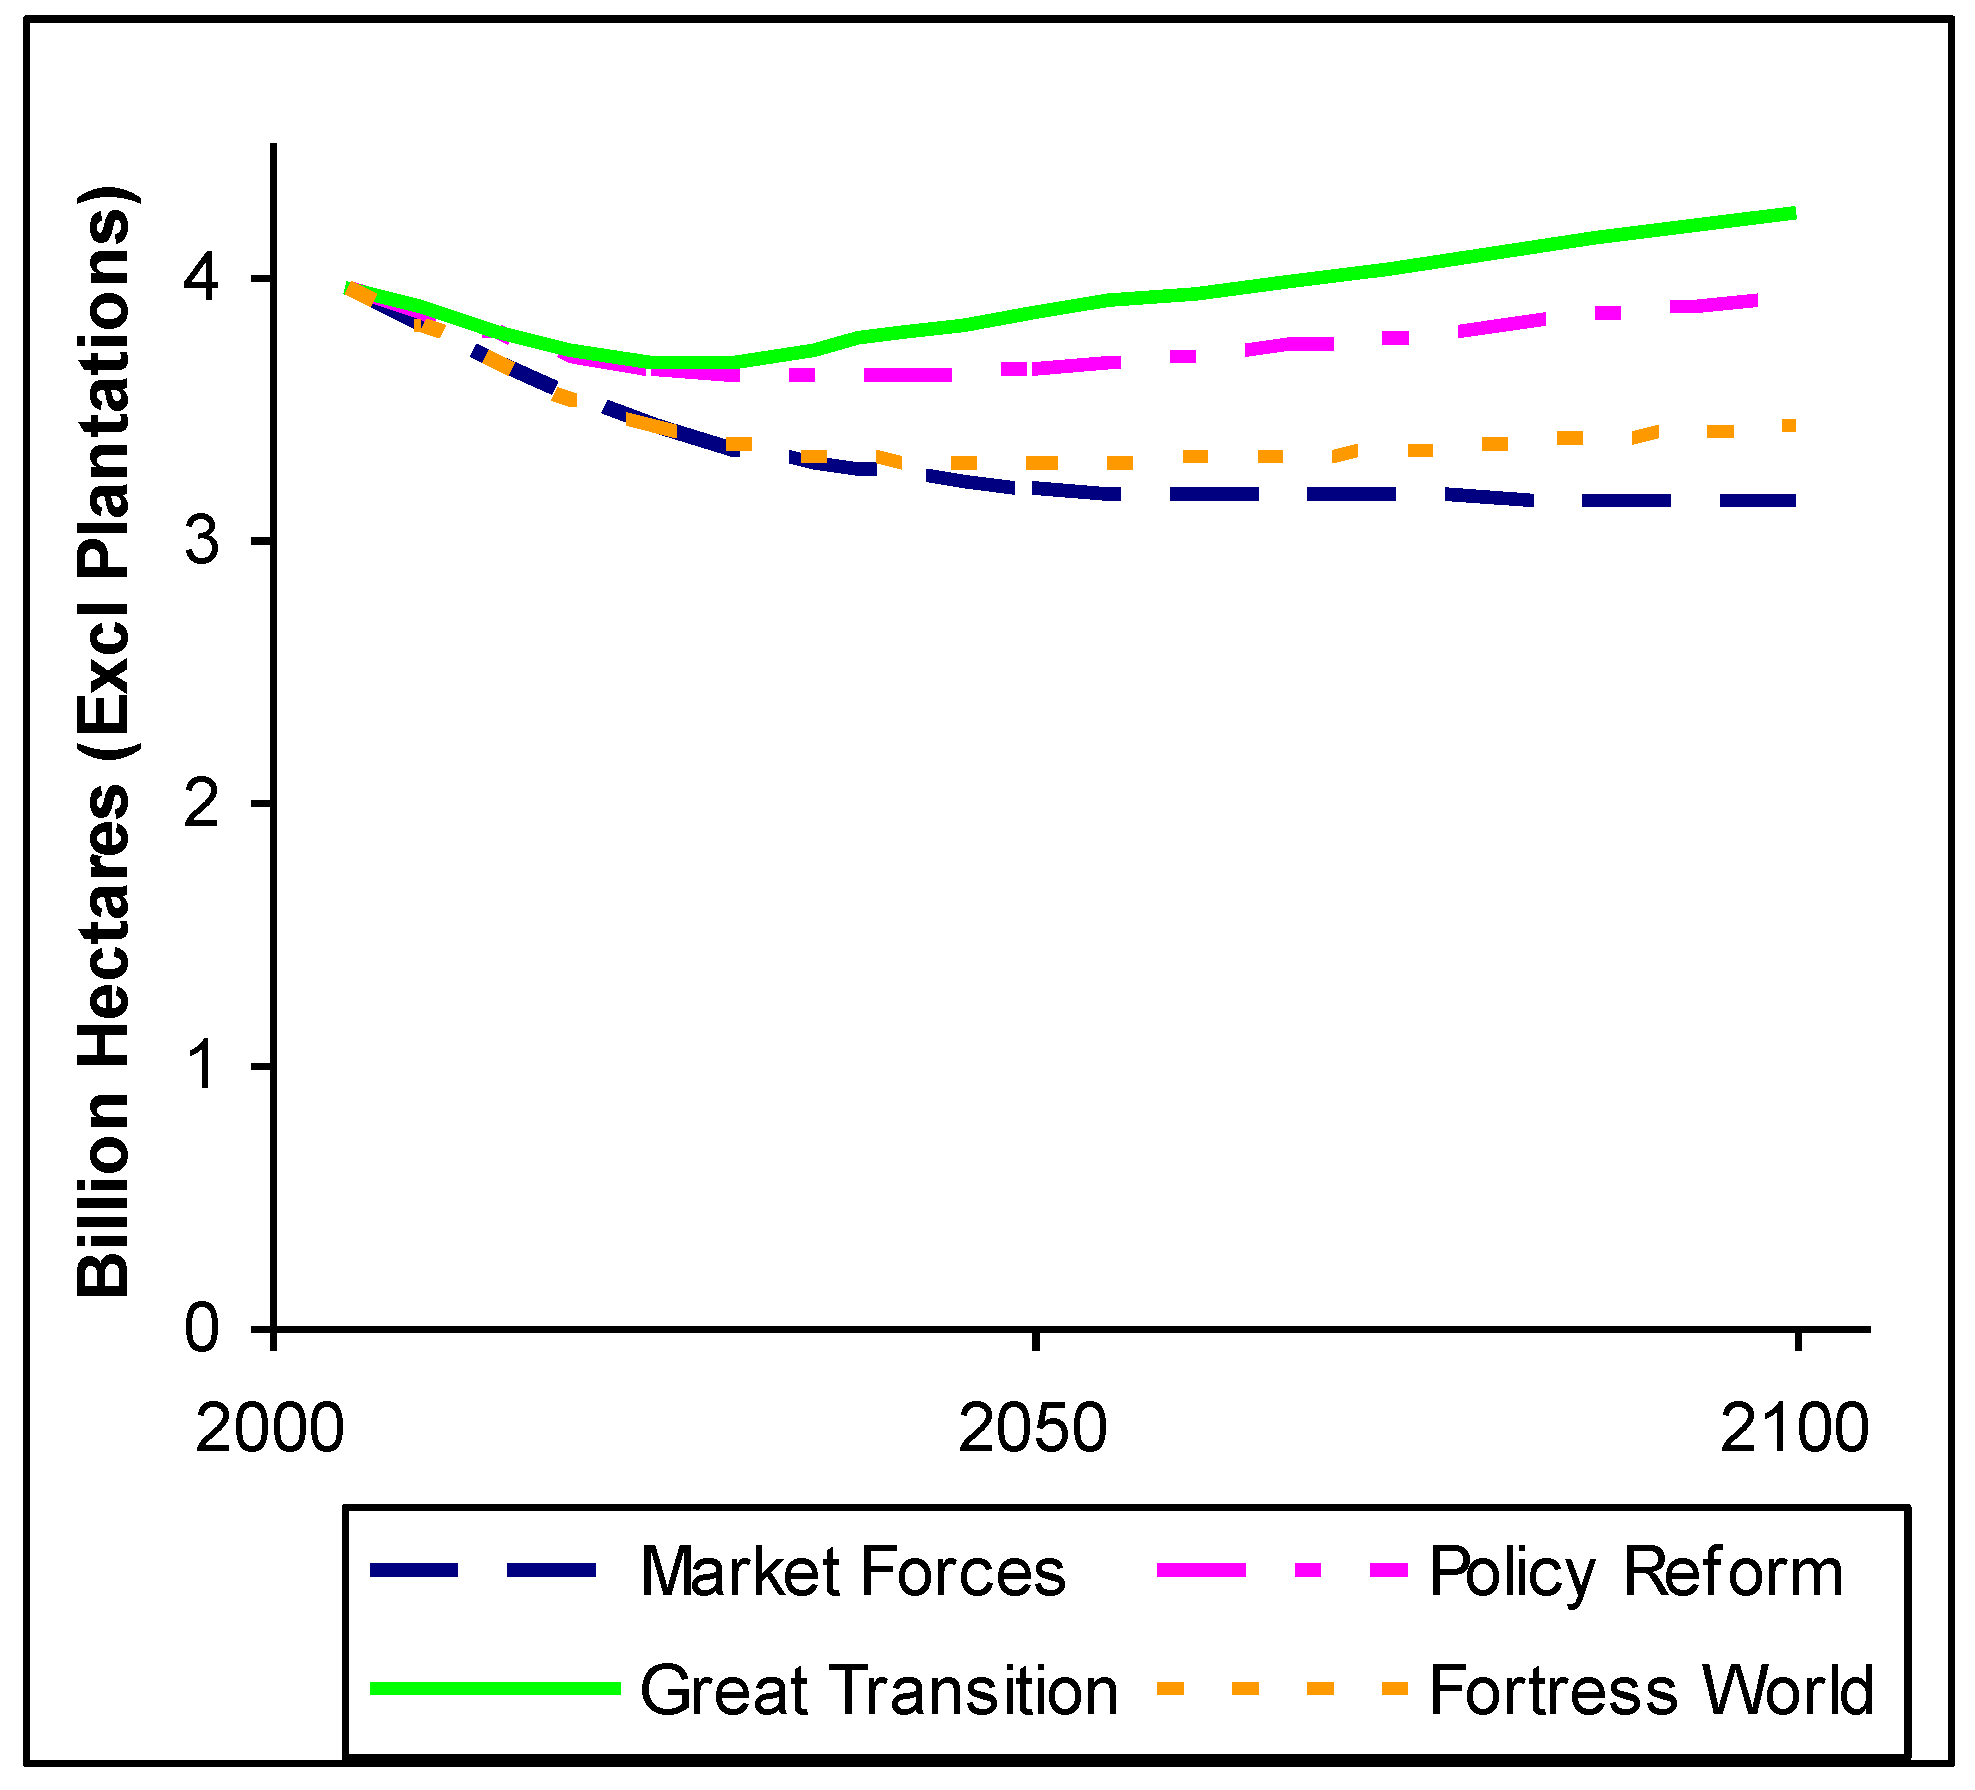
4.2.6. Land
A major challenge in the transition to sustainability will be protecting ecosystems and habitats in the face of increasing pressures on land resources. Finding solutions that balance the needs of economies and nature is an urgent matter of human self-interest, since healthy ecosystems provide vital and valuable resources and services, though these are usually not monetized. For those who place inherent worth on the vitality of the natural world, preserving biodiversity and natural beauty is also an ethical concern. Rising populations and incomes drive the demand for land for agriculture, pasturing, human settlements, forest products, and bio-fuels. Reversing the momentum of habitat loss will take action on both the demand and supply side of the equation, moderating requirements and managing land resources sustainably. We illustrate scenario patterns for the case of forest land in Figure 13. The failure to align economies with environmental objectives in Market Forces leads to continued loss and degradation of land. Masses of land-hungry poor and technological stagnation in Fortress World further diminish ecosystems. Intensive governmental efforts to protect and restore ecosystems in Policy Reform slow, and then modestly reverse habitat loss. Lower population and economic growth, compact settlements, less land-intensive diets, and much lower use of biomass in Great Transition combine to enhance ecosystems, though even under these salutary conditions the protection of nature remains a long-term challenge.
Figure 13.
Forest Cover.

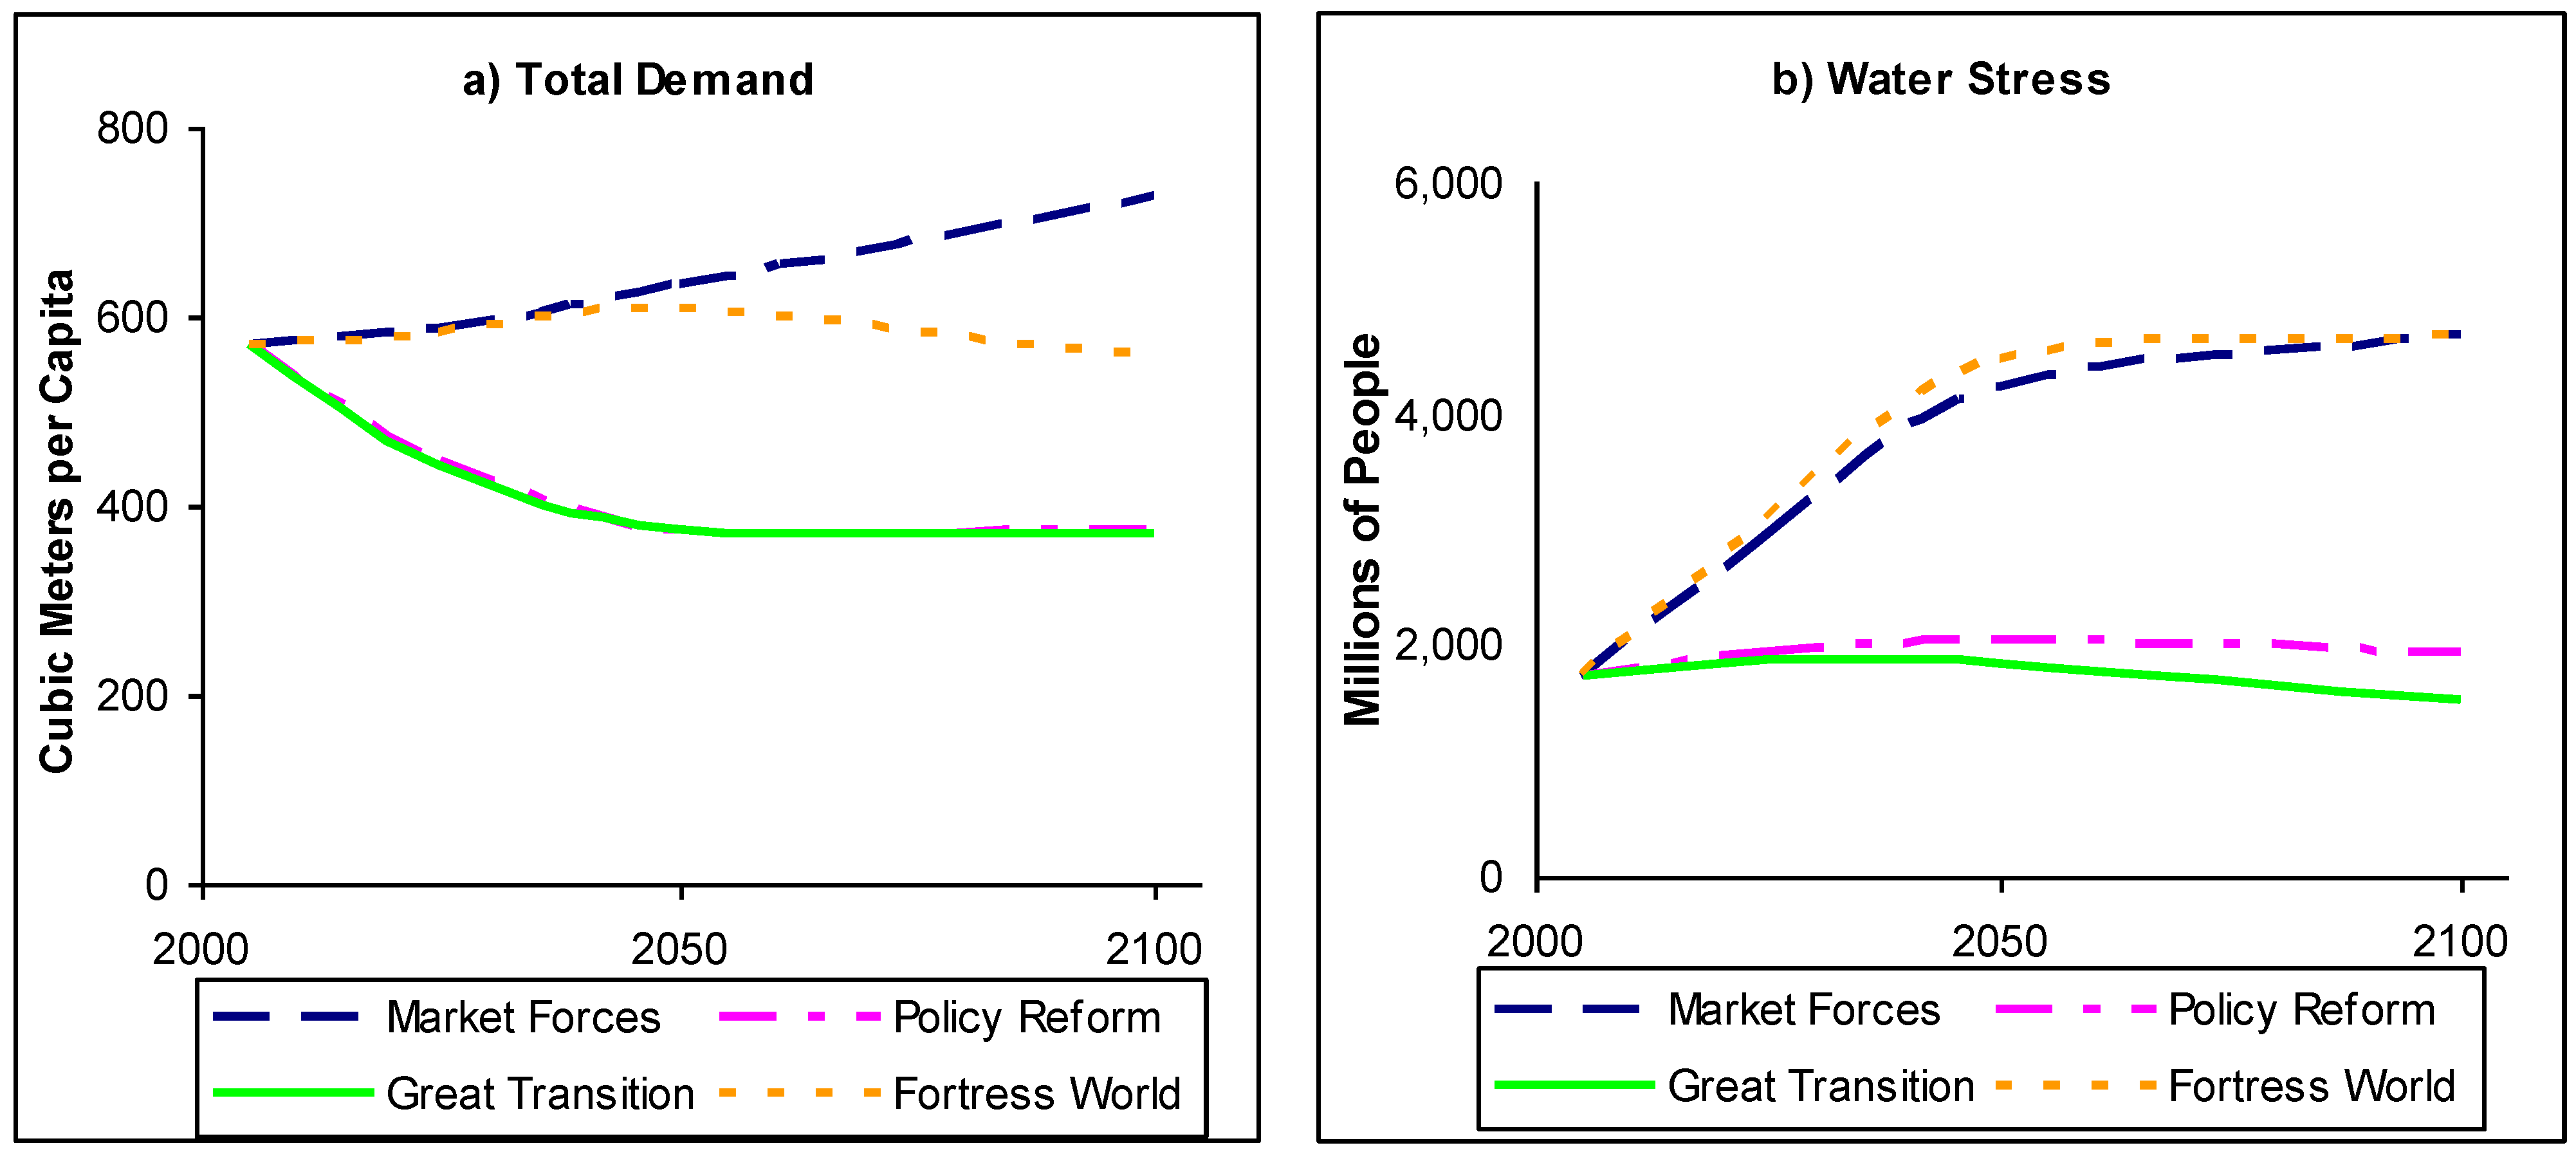
4.2.7. Water
Providing adequate freshwater for the maintenance of human and natural systems will be another persistent challenge in this century. Today, 1.7 billion people live in areas of water stress, i.e., where there is significant competition for water among agricultural, industrial, public, and environmental claims. In addition, several hundred million people endure “high water stress” of absolute and chronic shortages of freshwater resources. We deem a population in ‘water stress’ when water demand divided by renewable water resources (use-to-resource ratio) exceeds critical values and in ‘high’ stress at more stringent values (see [9], pp. 229-234). Future requirements in the scenarios, shown in Figure 14(a), exhibit a now familiar pattern. The decreases in Policy Reform and Great Transition are traced to vigorous efforts to deploy best-practice efficiency improvements for irrigation, which accounts for 70% of requirements in 2005, and other end-uses. Figure 14(b) shows that these interventions, along with more sustainable water harvesting, meet our sustainability target (Table 5), despite high population growth in the Mideast, northern Africa, and swaths of many other regions short of water. In the absence of such intensive effort in Market Forces and Fortress World, water stress more than doubles. Moreover, climate change induced alteration of hydrological patterns, not accounted for in this analysis, could further exacerbate the problem of freshwater unsustainability.
Figure 14.
Water Requirements and Sufficiency.
4.2.8. Local pollution
The scenario simulations track changes in representative air pollutants (e.g., sulfur oxides), water contaminants (nitrogen and biochemical oxygen demand), industrial toxics, and municipal solid waste. The broad patterns are illustrated in Figure 15 using the example of toxic chemical loads from industrial products and processes. Rapid economic growth and weak regulation lead to extreme contamination in Market Forces, while the deployment of clean technology and recycling substantially reduce pollution in Policy Reform and the Great Transition.
Figure 15.
Toxic Chemical Loads.

5. Selected Comparisons to Other Studies
In recent years, scenario analysis has been applied extensively at local, regional, and national scales across a staggering range of themes and issues. See [25] and [26] for histories of global scenarios, and [27] for a review of recent scenario-based environmental assessments. Global studies have focused on energy, water, environment, population, food and agriculture, and the economy [10,28,29,30,31,32,33], but only a handful have undertaken a comprehensive and detailed socio-ecological assessment of the long term prospects for sustainability [34,35]. Significant efforts include the PoleStar-based work of the Global Scenario Group [9,36,37], upon which the current study builds, and applications of the IMAGE model [38] of the Netherlands Environmental Agency.
Figure 16.
CO2 Emissions Trajectories.
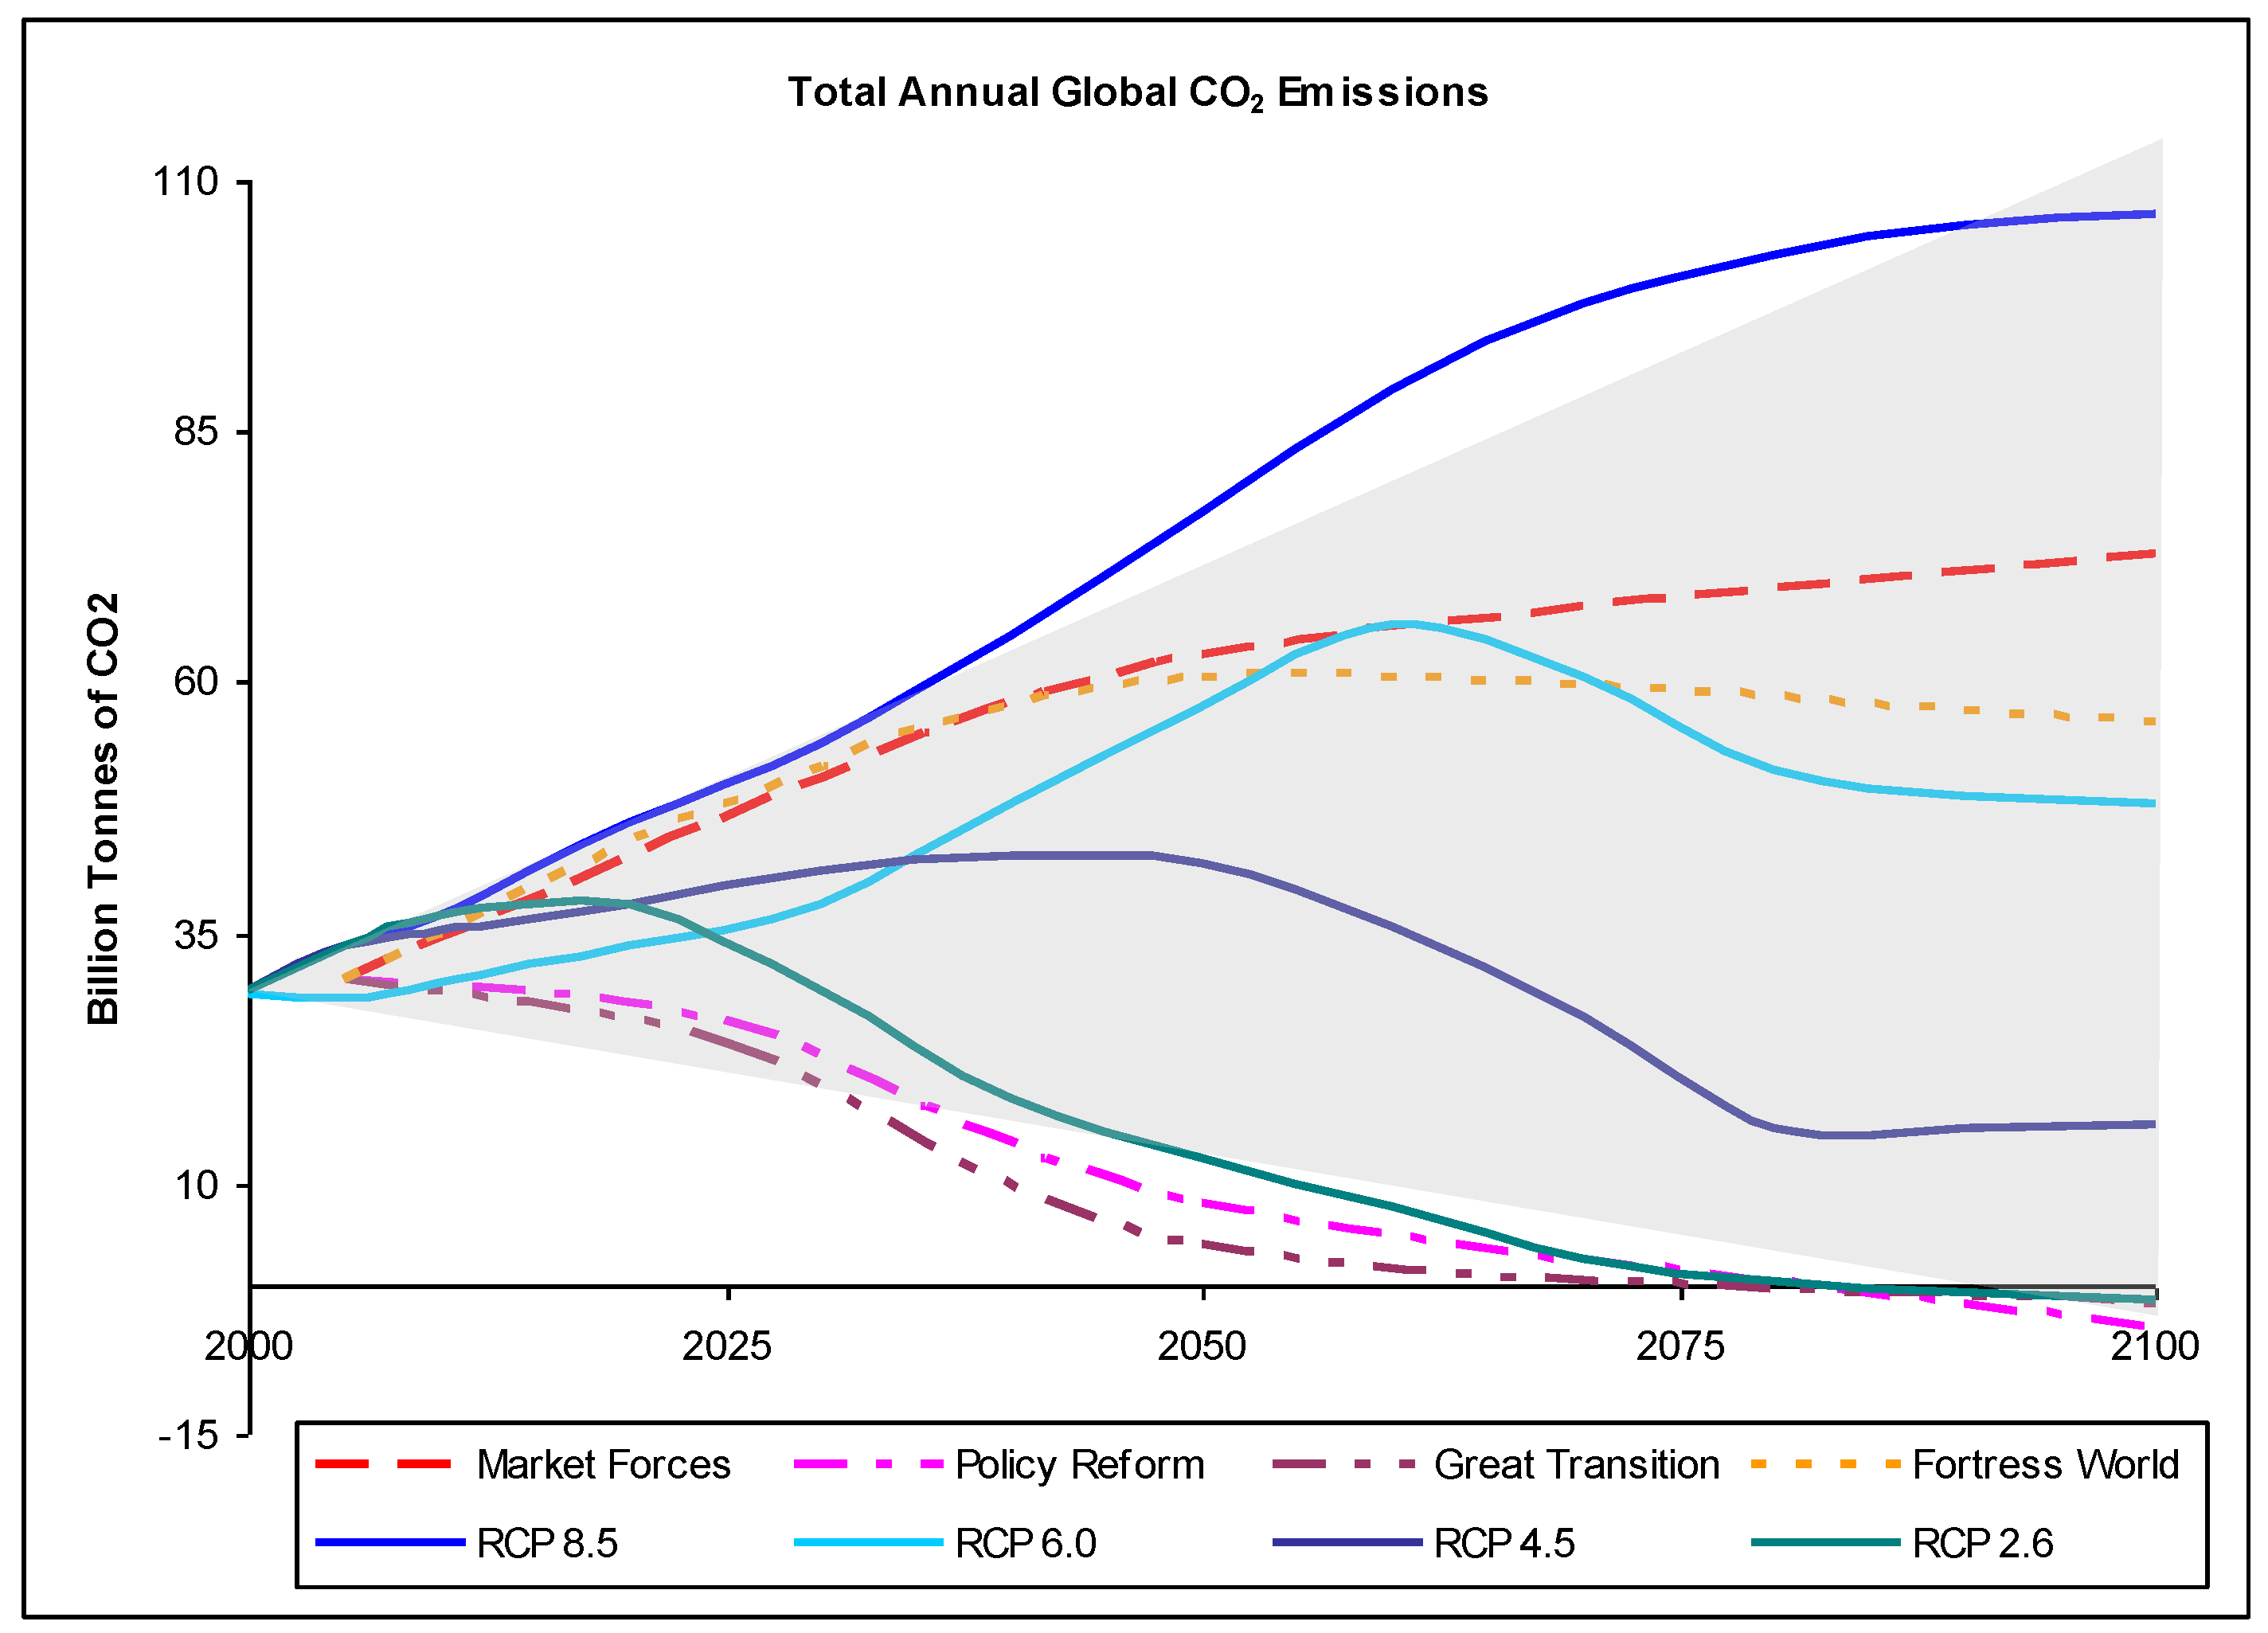
For the sake of brevity, we focus our comparisons of scenario analyses on a single aspect of the sustainability problématique: the climate and energy nexus. Figure 16 displays CO2 emissions trajectories for our four scenarios along with others drawn from the work of the Intergovernmental Panel on Climate Change (IPCC). The shaded background shows the range of results of the Special Report on Emissions Scenarios (SRES) [39], relied on in IPCC’s third and fourth assessments [40,41]. The solid lines are provisional “representative concentration pathways” slated for use in the upcoming fifth assessment [25,42]. This set is labeled “RCP X” in the figure with the X corresponding to the anthropogenic radiative forcing in 2100 expressed in watts/meter2.
Carbon dioxide emissions in the Policy Reform and Great Transition scenarios fall below the lowest range of the IPCC scenarios. The RCP 2.6 trajectory, the most ambitious emissions reduction scenario currently being considered by IPCC, relies on massive deployment of carbon sequestration (capture of CO2 from power plant waste streams with subsequent underground storage), though this remains an unproven technology at anything like the scales envisioned. By contrast, deeper and more rapid penetration of renewable energy and efficiency in Policy Reform reduces the need and delays the deployment of sequestration technology, while the dematerialized life-styles and moderated population growth in Great Transition reduces its role still further.
Figure 17 turns to a comparison of the energy requirements of our scenarios with the RCP set. The shaded area of the figure is bounded below by RCP 2.6, and above by the RCP “baseline” scenario [43], which has an emissions profile comparable to Market Forces. Although Figure 16 shows similar emissions trajectories for Policy Reform and RCP 2.6, energy requirements deviate radically. The far higher energy use in RCP 2.6 requires comparably heavier reliance on carbon sequestration with its inherent energy inefficiencies and uncertain prospects. The low energy requirements in Great Transition suggest the importance of transcending conventional development visions in designing global climate simulations to consider possibilities for more fundamental alterations in long-range social conditions. This, in turn, will encourage overcoming rigidities in standard integrated assessment models that might circumscribe the range of possible development paths for this century.
Figure 17.
Comparison of Primary Energy Requirements to IPCC RCP Trajectories (shaded area).

As a final comparison, Figure 18 displays the energy requirements of our four scenarios along with those from “GEO-4”, the most recent Global Environmental Outlook (GEO) of the United Nations Environment Programme [44]. The time horizon in the figure extends only to 2050, the last year reported in the GEO-4 report. The comparison is apt since the GEO scenarios were originally based on the Global Scenario Group scenarios herein updated and enhanced (the Global Scenario Group was originally established as the “scenario working group” for the GEO process) [45,46]. We see that the Policy Reform and Great Transition scenario follow trajectories below the GEO range as a result of more aggressive energy conservation policies and, in Great Transition, more basic adjustments in the scale and composition of energy demand. Where the GEO-4 scenarios rely heavily on nuclear power and carbon sequestration of fossil-fuel-generated energy, the Policy Reform and Great Transition scenarios require neither by 2050.
Figure 18.
Comparison of Primary Energy Requirements to GEO-4 Trajectories (shaded area).

These comparisons illustrate the basic pattern that our results tend to span a wider range than other scenarios studies. In particular, the Great Transition and Fortress World, by introducing unconventional narratives of global development, expand the aperture for scanning possible futures. Standard modeling tools, built on algorithms specified on the basis of historic development patterns and structural relationships, have limited utility for illuminating scenarios in which the global system undergoes such fundamental restructuring [26]. The PoleStar system relied on here casts a wider net by allowing flexible specification of novel outcomes and images of the future that serve as constraints on scenario trajectories. This backcasting technique shifts epistemological emphasis from passive projection (where are we going?) to normative consideration of alternative destinations (where do we want to go? how do we get there?), offering enriched insight on the possible worlds of tomorrow, and how best to act today.
6. Conclusions
This paper has sketched four very different futures that could emerge from the forces currently driving the global system toward critical environmental and social uncertainties. The world now faces multifaceted and interacting environmental, resource, and social problems, an inauspicious point of departure for all scenarios. The global trajectory can branch in alternative directions in the coming decades, depending on how bio-physical and cultural stresses manifest themselves and how society responds. The destiny of both people and planet rest ultimately with human choice as we anticipate and respond to crises and seize opportunities for positive transformation. Will our actions be tardy and tepid? Or timely and consequential?
If we muddle forward in a complacent Market Forces mode, the risks rise of deterioration of life-support ecosystems and civilized norms. By contrast, a long and tenacious process of proactive adjustments in policy and technology—as embodied in the Policy Reform scenario—could, in principle, redirect world development toward sustainability. However, this approach confronts the daunting challenge of marshalling the massive globally-coordinated interventions at the pace and magnitude required. If the strategy of incremental change fails, and crises mount, the global trajectory could swerve toward the authoritarian order of Fortress World, or even the collapse of organized institutions.
Yet, the sustainability challenge presents, as well, the prospect of transcending technological solutions with a transformation in human values and restructuring of economic and governance institutions. If humanity musters the will for a Great Transition, a new and vital phase of human history could open in this century: a planetary civilization that pursues peace and justice, delivers material sufficiency and rich lives, and understands humanity as a respectful member of a wider community of life.
Each scenario raises critical questions of feasibility. The laissez-faire optimism of Market Forces would invite a host of environmental and social crises that could feedback and amplify, undercutting its rosy assumption of perpetual economic growth. The necessary political will for Policy Reform is nowhere in sight. The organized cooperation of the global elite in Fortress World, in the face of unfolding crises and the resistance, no doubt, of the excluded masses, would be extremely difficult.
The Great Transition can only emerge as a collective cultural and political project of global citizens, a development that is far from guaranteed. We can only hope that our scan of the global future, suggesting the desirability—even necessity—of such a deep change, will help spur action to achieve sustainability.
Acknowledgements
This study carries forward a two-decade program of exploration of alternative global futures conducted by the Tellus Institute, the Global Scenario Group and the Stockholm Environment Institute. We are grateful to each of the scores of colleagues who have contributed along the way, with special mention due to Gordon Goodman for originally conceiving of the PoleStar Project, Gilberto Gallopín for intellectual leadership in scenario formulation and Eric Kemp-Benedict for technical innovations and support. Of course, the authors alone are responsibility for any errors of fact or inadequacies of judgment in the current document.
References
- Richardson, K.; Steffen, W.; Schellnhuber, H.J.; Alcamo, J.; Barker, T.; Kammen, D.M.; Leemans, R; Liverman, D.; Munasinghe, M.; Osman-Elasha, B.; Stern, N.; Wæver, O. Synthesis Report, Climate Change: Global Risks, Challenges & Decisions. In Proceedings of the Climate Change Congress, University of Copenhagen, Copenhagen, Denmark, 10–12 March 2009.
- Millennium Ecosystem Assessment. Ecosystems and Human Well-Being: Current State and Trends; Island Press: Washington, DC, USA, 2005; Volume 1. [Google Scholar]
- Raskin, P. World lines: A framework for exploring global pathways. Ecol. Econ. 2008, 65, 461–470. [Google Scholar] [CrossRef]
- Swart, R.; Raskin, P.; Robinson, J. The problem of the future: Sustainability science and scenario analysis. Glob. Environ. Change 2004, 14, 137–146. [Google Scholar] [CrossRef]
- Gallopín, G.; Raskin, P. Global Sustainability: Bending the Curve; Routledge: St Paul, MN, USA, 2002. [Google Scholar]
- Raskin, P.; Banuri, T.; Gallopín, G.; Gutman, P.; Hammond, A.; Kates, R.; Swart, R. Great Transition: The Promise and Lure of the Times Ahead; Stockholm Environment Institute: Boston, MA, USA, 2002. [Google Scholar]
- Global Scenario Group Homepage. http://www.gsg.org (accessed on 1 June 2010).
- The PoleStar Project Homepage. http://www.polestarproject.org (accessed on 1 June 2010).
- Electris, C.; Raskin, P.; Rosen, R.; Stutz, J. The Century Ahead: Four Global Scenarios, Technical Documentation; Tellus Institute: Boston, MA, USA, 2009. Available online: http://www.tellus.org/publications/files/TheCenturyAhead_TechDoc.pdf (accessed on 1 June 2010).
- United Nations. Population, Resources, Environment and Development: The 2005 Revision. Available online: http://www.un.org/esa/population/unpop.htm (accessed on 1 June 2010).
- The Millennium Development Goals Report; United Nations: New York, NY, USA, 2009.
- Raskin, P. The Great Transition Today: A Report from the Future; Tellus Institute: Boston, MA, USA, 2006. Available online: http://www.gtinitiative.org/resources/paperseries.html (accessed on 1 June 2010).
- Rosen, R.; Schweichart, D. Visions of Regional Economies in a Great Transition World; Tellus Institute: Boston, MA, USA, 2006. Available online: http://www.gtinitiative.org/resources/paperseries.html (accessed on 1 June 2010).
- Nakicenovic, N. World Energy Outlook 2007: CO2 Emissions Pathways Compared to Long-Term CO2 Stabilization Scenarios in the Literature and IPCC AR4; Organisation for Economic Co-operation and Development (OECD): Paris, France, 2007. Available online: http://www.iea.org/weo/docs/weo2007/CO2_Scenarios.pdf (accessed on 1 June 2010).
- International Institute for Applied Systems Analysis (IIASA). Greenhouse Gas Initiative Scenario Database. Available online: http://www.iiasa.ac.at/Research/GGI/DB/ (accessed on 1 June 2010).
- Meinshausen, M.; Meinshausen, N.; Hare, W.; Raper, S.C.B.; Frieler, K.; Knutti, R.; Frame, D.J.; Allen, M.R. Greenhouse gas emission targets for limiting global warming to 2 °C. Nature 2009, 458, 1158–1162. [Google Scholar] [CrossRef] [PubMed]
- Hansen, J.; Sato, M.; Kharecha, P.; Beerling, D.; Berner, R.; Masson-Delmotte, V.; Pagani, M.; Raymo, M.; Royer, D.L.; Zachos, J.C. Target atmospheric CO2: Where should humanity aim? Open Atmos. Sci. J. 2008, 2, 217–231. [Google Scholar] [CrossRef]
- BP. BP Statistical Review of World Energy. Available online: http://www.bp.com/liveassets/bp_internet/globalbp/globalbp_uk_english/reports_and_publications/statistical_energy_review_2007/STAGING/local_assets/downloads/pdf/statistical_review_of_world_energy_full_report_2007.pdf (accessed on 1 June 2010).
- World Energy Council. Survey of Energy Resources 2007. Available online: http://www.worldenergy.org/publications/survey_of_energy_resources_2007/default.asp (accessed on 1 June 2010).
- International Institute for Applied Systems Analysis (IIASA). Global Energy Assessment (GEA). Available online: http://www.iiasa.ac.at/Research/ENE/GEA/index.html (accessed on 1 June 2010).
- Cosgrove, W.; Rijsberman, F. World Water Vision: Making Water Everybody’s Business; Earthscan: London, UK, 2000. [Google Scholar]
- Environmental Outlook to 2030; Organisation for Economic Co-operation and Development (OECD): Washington, DC, USA, 2008.
- World Energy Outlook 2009; International Energy Agency (IEA): Paris, France, 2009.
- Rosengrant, M.W.; Paisner, M.S.; Meijer, S.; Witcover, J. 2020 Global Food Outlook; International Food Policy Research Institute: Washington, DC, USA, 2001. [Google Scholar]
- Moss, R.H.; Edmonds, J.A.; Hibbard, K.A.; Manning, M.R.; Rose, S.K.; van Vuuren, D.P.; Carter, T.R.; Emori, S.; Kainuma, M.; Kram, T.; Meehl, G.; Mitchell, J.F.B.; Nakicenovic, N.; Riahi, K.; Smith, S.J.; Stouffer, R.J.; Thomson, A.M.; Weyant, J.P.; Wilbanks, T.J. The next generation of scenarios for climate change research and assessment. Nature 2010, 463, 747–756. [Google Scholar] [CrossRef] [PubMed]
- Raskin, P. Worldlines: A Framework for Exploring Global Pathways. Ecol. Econ. 2008, 65, 461–470. [Google Scholar] [CrossRef]
- Kok, M.T.J.; Bakkes, J.A.; Eickhout, B.; Manders, A.J.G.; van Oorschot, M.M.P.; van Vuuren, D.P.; van Wees, M.; Westhoek, H.J. Lessons from Global Environmental Assessments; Netherlands Environmental Assessment Agency: Bilthoven, The Netherlands, 2008. [Google Scholar]
- World Agriculture: Toward 2030/2050; Global Perspective Studies Unit, Food and Agriculture Organization of the United Nations (FAO): Rome, Italy, 2006.
- OECD-FAO Agricultural Outlook 2009–2018; Organisation for Economic Co-operation and Development (OECD): Paris, France, 2009.
- Prinn, R.; Paltsev, S.; Sokolov, A.; Sarofim, M.; Reilly, J.; Jacoby, H. The Influence on Climate Change of Differing Scenarios for Future Development Analyzed Using the MIT Integrated Global System Model. In Joint Program Report Series; MIT Joint Program on the Science and Policy of Global Change: Cambridge, MA, USA, 2008. [Google Scholar]
- Wise, M.A.; Calvin, K.V.; Thomson, A.M.; Clarke, L.E.; Bond-Lamberty, B.; Sands, R.D.; Smith, S.J.; Janetos, A.C.; Edmonds, J.A. The Implications of Limiting CO2 Concentrations for Agriculture, Land Use, Land-use Change Emissions and Bioenergy; Pacific Northwest National Laboratory: Richland, WA, USA, 2009. [Google Scholar]
- Barker, T.; Foxon, T.; Scrieciu, S. Achieving the G8 50% target: Modelling induced and accelerated technological change using the macro-econometric model E3MG. Clim. Policy 2008, 8, S30–S45. [Google Scholar] [CrossRef]
- Stern, N. The Economics of Climate Change: The Stern Review; Cambridge University Press: Cambridge, UK, 2007. [Google Scholar]
- Millennium Ecosystem Assessment; Island Press: Washington, DC, USA, 2005.
- Raskin, P. Global scenarios: Background review for the millennium ecosystem assessment. Ecosystems 2005, 8, 133–142. [Google Scholar] [CrossRef]
- Gallopín, G.; Hammond, A.; Raskin, P.; Swart, R. Branch Points: Global Scenarios and Human Choice; Stockholm Environment Institute: Stockholm, Sweden, 1997. [Google Scholar]
- Raskin, P.; Gallopín, G.; Gutman, P.; Hammond, A.; Swart, R. Bending the Curve: Toward Global Sustainability; Stockholm Environment Institute: Stockholm, Sweden, 1998. [Google Scholar]
- Integrated Model to Assess the Global Environment (IMAGE). IMAGE Model Site. Available online: http://www.pbl.nl/en/themasites/image/index.html (accessed on 1 June 2010).
- Intergovernmental Panel on Climate Change (IPCC). IPCC Special Report on Emissions Scenarios; Nakicenovic, N., Swart, R., Eds.; Cambridge University Press: Cambridge, UK, 2000. [Google Scholar]
- Intergovernmental Panel on Climate Change (IPCC). Third Assessment Report: Climate Change 2001; Cambridge University Press: Cambridge, UK, 2001. [Google Scholar]
- Intergovernmental Panel on Climate Change (IPCC). Fourth Assessment Report: Climate Change 2007; Cambridge University Press: Cambridge, UK, 2007. [Google Scholar]
- Weyant, J.; Azar, C.; Kainuma, M.; Kejun, J.; Nakicenovic, N.; Shukla, P.R.; La Rovere, E.; Yohe, G. Report of 2.6 Versus 2.9 Watts/m2 RCPP Evaluation Panel; Intergovernmental Panel on Climate Change (IPCC): Geneva, Switzerland, 2009. [Google Scholar]
- Rao, S.; Riahi, K.; Stehfest, E.; van Vuuren, D.; Cho, C.; den Elzen, M.; Isaac, M.; van Vliet, J. IMAGE and MESSAGE Scenarios Limiting GHG Concentration to Low Levels; Interim Report, IR-08-020; International Institute for Applied Systems Analysis (IIASA): Laxenburg, Austria, 2008. [Google Scholar]
- Global Environment Outlook GEO-4: Environment for Development; United Nations Environment Programme: Washington, DC, USA, 2007.
- Raskin, P.D.; Kemp-Benedict, E. Global Environment Outlook Scenario Framework: Background Paper for UNEP’s Third global Environmental Outlook Report (GEO-3); UNEP: Nairobi, Kenya, 2004. [Google Scholar]
- The GEO-3 Scenarios 2002–2032: Quantification and Analysis of Environmental Impacts; Potting, J.; Bakkes, J. (Eds.) Netherland Environmental Assessment Agency: Bilthoven, The Netherlands, 2004; p. 25.
© 2010 by the authors; licensee MDPI, Basel, Switzerland. This article is an Open Access article distributed under the terms and conditions of the Creative Commons Attribution license (http://creativecommons.org/licenses/by/3.0/).
Share and Cite
MDPI and ACS Style
Raskin, P.D.; Electris, C.; Rosen, R.A. The Century Ahead: Searching for Sustainability. Sustainability 2010, 2, 2626-2651. https://doi.org/10.3390/su2082626
AMA Style
Raskin PD, Electris C, Rosen RA. The Century Ahead: Searching for Sustainability. Sustainability. 2010; 2(8):2626-2651. https://doi.org/10.3390/su2082626
Chicago/Turabian StyleRaskin, Paul D., Christi Electris, and Richard A. Rosen. 2010. "The Century Ahead: Searching for Sustainability" Sustainability 2, no. 8: 2626-2651. https://doi.org/10.3390/su2082626