Article

Fumonisin B1 Toxicity in Grower-Finisher Pigs: A Comparative Analysis of Genetically Engineered Bt Corn and non-Bt Corn by Using Quantitative Dietary Exposure Assessment Modeling

Interdepartmental Toxicology Program, Department of Agronomy, Iowa State University, Ames, IA 50011, USA
*
Author to whom correspondence should be addressed.
Int. J. Environ. Res. Public Health 2011, 8(8), 3179-3190; https://doi.org/10.3390/ijerph8083179
Submission received: 11 May 2011 / Revised: 12 July 2011 / Accepted: 15 July 2011 / Published: 28 July 2011
(This article belongs to the Special Issue Environmental Health Risk Assessment)

Abstract

:
In this study, we investigate the long-term exposure (20 weeks) to fumonisin B1 (FB1) in grower-finisher pigs by conducting a quantitative exposure assessment (QEA). Our analytical approach involved both deterministic and semi-stochastic modeling for dietary comparative analyses of FB1 exposures originating from genetically engineered Bacillus thuringiensis (Bt)-corn, conventional non-Bt corn and distiller’s dried grains with solubles (DDGS) derived from Bt and/or non-Bt corn. Results from both deterministic and semi-stochastic demonstrated a distinct difference of FB1 toxicity in feed between Bt corn and non-Bt corn. Semi-stochastic results predicted the lowest FB1 exposure for Bt grain with a mean of 1.5 mg FB1/kg diet and the highest FB1 exposure for a diet consisting of non-Bt grain and non-Bt DDGS with a mean of 7.87 mg FB1/kg diet; the chronic toxicological incipient level of concern is 1.0 mg of FB1/kg of diet. Deterministic results closely mirrored but tended to slightly under predict the mean result for the semi-stochastic analysis. This novel comparative QEA model reveals that diet scenarios where the source of grain is derived from Bt corn presents less potential to induce FB1 toxicity than diets containing non-Bt corn.

1. Introduction

Fumonisins are a series of mycotoxins ubiquitous in Nature, infecting corn (Zea mays L) and other grains throughout the World. Major fumonisin fungi species-mycotoxin associations are derived from Fusarium verticilliodes (formerly known as F. moniliforme) and F. proliferatum. Minor fumonisin sources include Fusarium nygamai, F. napiforme, F. thapsinum, F. anthophilum and F. dlamini [1]. Detection of mycotoxicosis usually involves a close association between the consumption of moldy feed and a specific onset of toxicological effects, altered performance or behavior. Fumonisin-induced porcine pulmonary edema (PPE) is a well-established toxin specific adverse effect [2], and fumonisin also has the potential to negatively impact the food and feed market due to contaminated grain [3].
We recently reported after conducting an exposure assessment that swine populations in nursery facilities may frequently exhibit incipient fumonisin B1 (FB1) toxicological effects (i.e., 8% decrease in average daily weight gain) when diets are contaminated at 1 mg of FB1/kg of diet. The results of Delgado and Wolt [4] have been largely validated by the recent study of Rossi et al. [5] which reports better performance in weaned piglets fed Bt corn compared to piglets fed near isogenic corn and suggests better performance due to lower FB1 associated with Bt corn [4,5]. The authors’ goals in this investigation are to better understand the lifetime exposure (utero-to-finish) and toxicity of FB1 in pig diets. Due to the variation of percent corn in the diet design throughout the lifetime production, we have divided our quantitative exposure assessment (QEA) modeling into three major components: gestation, nursery, and grower-finisher. This investigation is currently focused on the grower-finisher component and will use our previously established analytical exposure model framework. The only variation in the grower-finisher model compared to our previous nursery model is the current inputs reflect diet formulation for grower-finisher pigs.
Quantitative exposure assessment was conducted using both deterministic (single-point estimates) and stochastic (probabilistic) analysis for comparative interpretation of FB1 exposure originating from genetically engineered Bacillus thuringiensis (Bt)-corn, conventional non-Bt corn and distiller’s dried grains with solubles (DDGS). Comparative analysis between Bt corn and non-Bt corn is conducted to determine if FB1 concentrations differ depending on the corn source, estimating which swine populations may be more susceptible to FB1 toxicity.

2. Materials and Methods

Animal Care and Use Committee approval was not obtained for this study because forecast data were derived from existing literature.

2.1. Analytical Model

Characterization of risk from FB1 dietary exposure was estimated by using a conceptual model, which consists of three major components: toxicological effects (levels of concern, LOC), swine management, and agronomic management as described in Delgado and Wolt [4]. Six scenarios were developed to consider FB1 exposure influenced by corn and DDGS as the primary protein source in diets:
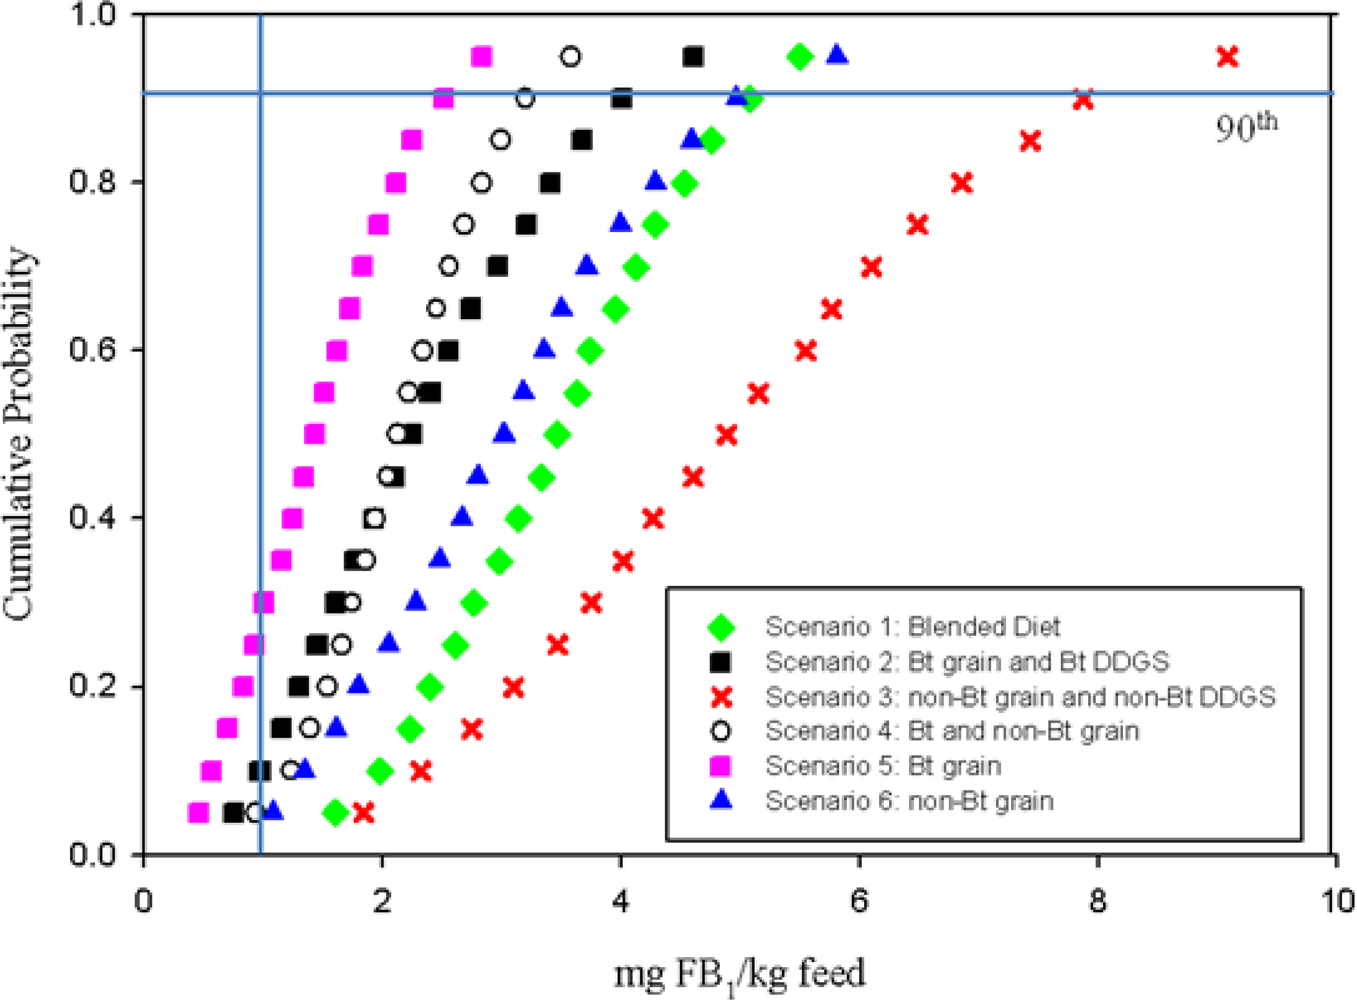
  • Scenario 1: Blended diet (Bt grain, non-Bt grain, Bt-DDGS and non-Bt DDGS)
  • Scenario 2: Bt grain and Bt DDGS
  • Scenario 3: non-Bt grain and non-Bt DDGS
  • Scenario 4: Bt and non-Bt grain
  • Scenario 5: Bt grain
  • Scenario 6: non-Bt grain

2.2. Exposure Characterization and Model Parameterization

Information necessary to forecast FB1 exposure and model parameterization needed to estimate risk consistent with the conceptual model is presented in the following subsections. Each diet scenario required separate sets of worksheets (Microsoft Excel 2010) to describe the FB1 exposure. Deterministic inputs (Table 1) used average, maximum, midpoint or fixed parameter estimates and all probabilistic modeling (Table 1) used Palisade @Risk 5.7 with random Latin hypercube sampling [6]. The term semi-stochastic will be used to refer to the non-deterministic modeling which does not contain distributions for the inputs of specific week in grower-finisher phase, Bt use fraction in diets and estimations of FB1 in corn. Refer to Table 1 for descriptions of model input assumptions.
Swine Management. Model parameterization required for diet development included the following: mycotoxin exposure assessed by weekly intervals during the production phase, changes in body weight (BW) over time (i.e., weekly), and total corn intake fraction (TCIF). Information for modeling the diet reflected a typical corn-soybean diet for swine facilities in the Midwestern USA.
Duration of Exposure (Weekly). For the purpose of this dietary exposure assessment, weekly intervals were modeled in order to estimate variations of FB1 in diets. Estimating exposure by daily intervals was not conducted due to limited changes in diet composition. The sampling of the weekly intervals (i.e., 20 weeks) during production allows for an estimated correlated BW and expected TCIF in accordance with the Kansas State University Growth and Feed Intake Curve Calculator (FICC, see BW and TCIF below). All deterministic modeling scenarios used the 10th week of production to represent the midpoint of duration. For the semi-stochastic analysis a total of 20 weekly intervals of production were partitioned into six timeframes representative of weight ranges corresponding to the TCIF (Table 2 and Table 3) and sampled by a discrete uniform distribution to estimate the body weight associated with weekly interval.
Bodyweight (BW). Determination of BW was calculated by the Kansas State University Growth FICC as a function of the specific week during production [7]. Parameterization inputs for the FICC included initial nursery average BW of 5.67 kg and an average daily gain of 0.39 kg. Initial BW of grower-finisher production was 22.68 kg with an average daily gain of 0.82 kg, and 120.20 kg as the close out average BW. Values of BW were calculated at the end of the indicated week after placement into the grower-finisher phase (Table 2).
Total Corn Intake Fraction. Estimation of the TCIF in diet is based on the BW intervals associated within the 20 week production duration (Table 3) [9].

2.3. Agronomic Management

Bt vs. non-Bt Corn Fraction in Diet. Estimation of the fraction of Bt and non-Bt corn in swine diets was conducted by using the percentage of US hectares planting Bt and non-Bt seed corn. The USDA National Agricultural Statistics Service (NASS) estimated in 2010 that 15% of corn planted in the state of Iowa was insect-resistant (Bt) and 61% of all corn planted in Iowa was stacked gene varieties (Bt plus herbicide resistance) [10]. Therefore, in our deterministic model we assume that the TCIF in swine diets has a maximum Bt use fraction (BUF) representing 76% of Iowa corn planted, whereas the stochastic analysis distribution was developed from hectares planted in the major corn production states of the US [10]. For stochastic analysis Bt-corn adoption fractions were estimated by using a beta generalized distribution as described by Delgado and Wolt (Table 4) [4].
DDGS Fraction in Diet. In the Midwestern USA DDGS is increasingly used as an alternative feed source due to increased prices of corn and the widespread availability of DDGS as a by-product of ethanol production. Producers usually design the diets to use the maximum allowed percentage of DDGS. Therefore, DDGS distributions were not used in the models. Both deterministic and semi-stochastic modeling used a maximum of 30% DDGS in the diet formulation, since this value represents acceptable growth performance for swine in the grower-finisher phase [8].
Fumonisin B1 Concentrations in Bt-hybrids, Non-Bt Hybrids, and DDGS. Paired trials of Bt and non-Bt hybrids were used for estimates of FB1 in diets, which were expressed as cumulative distribution functions (CDF) describing the empirical data (Figure 1) [1121]. For specific details pertaining to the CDF calculations, see Delgado and Wolt [4]. Estimates of FB1 concentration in DDGS used a 3-fold scaling for both deterministic and semi-stochastic analysis as a typically reported value [3].
Information used to generate CDF contains both US and non-US data. We considered very carefully the source data and rationale for inclusion of non-US data sites. Rationale for inclusiveness is to better represent the potential variation in FB1 due to diverse genetic backgrounds and environments (e.g., location and years). The inclusion of non-US data represents 8.31% (i.e., 32 observations in a total of 385) of the total data used to represent FB1 in corn (Figure 2).

2.4. Effects Characterization

Chronic toxicological adverse effects associated with FB1 concentrations relevant to dietary exposure in the grower-finisher production phase for formulating the incipient level of concern (LOC) are reviewed in depth by Delgado and Wolt [4] and include the toxicological study of Rotter et al. [22]. The LOC for this QEA is 1.0 mg of FB1/kg of diet, which is consistent with the lower LOC used by Delgado and Wolt in the QEA for swine in nurseries [4].

3. Results

3.1. Deterministic Results

Existing data were used to forecast long-term FB1 exposures in feeding scenarios which may occur in the swine industry. Risk findings were expressed as the probability for exposures to exceed the LOC for long-term effects (1 mg FB1/kg diet). All diet scenarios predicted some level of FB1 exposure exceeding the LOC (Table 5). Diet scenarios where the source of grain or DDGS is derived from non-Bt corn (scenarios 3 and 6) pose the greatest opportunity for exceeding the LOC. Scenarios including only Bt grain (scenario 5) without DDGS exhibited the least mycotoxin exposure. The blended diet design (scenario 1) containing Bt and non-Bt grain and DDGS was ranked intermediate relative to other diet scenarios.

3.2. Semi-Stochastic Results

FB1 exposures exceeding the LOC were forecasted for all diet scenarios (Figure 3). Variation of FB1 exposure among scenarios and worst-case incidences representing the 90th percentile of exposure (Table 5) showed the least risk when the diets were developed with Bt grain only (scenario 5) while non-Bt and non-Bt DDGS diets (scenario 3) showed the highest LOC exceedance in 95% of cases. The percentile exceedance of LOC (1 mg FB1/kg diet) forecasted were:
  • Scenario 1: Blended diet (95% of occasions)
  • Scenario 2: Bt-grain and Bt DDGS (85% of occasions)
  • Scenario 3: non-Bt and non-Bt DDGS (95% of occasions)
  • Scenario 4: Bt-grain and non-Bt grain (90% of occasions)
  • Scenario 5: Bt grain (70% of occasions)
  • Scenario 6: non-Bt grain (95% of occasions)

4. Discussion

Semi-stochastic results predicted FB1 ranging from 1.50 to 5.08 and 2.52 to 7.87 mg FB1/kg diet for the mean and 90th percentile, respectively, where the chronic toxicological incipient level of concern is 1.0 mg of FB1/kg of diet. Due to the lack of toxicological data in grower-finisher pigs, it is difficult to predict the possible adverse effects induced above the LOC. Additional studies will be required to fully understand the potential negative impact(s) that may be generated from chronic low-dose exposure to FB1 diets. It is worth noting that the blended diet (scenario 1) may represent the swine industry as a whole; however, it is more likely that diets will contain 1 type of corn source or 1 type of DDGS. Methods of preventing, decontaminating and minimizing the toxicity of mycotoxins in feeds has been discussed by Jouany [23].
Long-term, low-dose exposures to FB1 in swine feed (as well as in the diets for other sensitive species with a large component of corn and/or DDGS) may represent a factor limiting health and productivity even when FB1 is controlled to levels below the acute advisory limits. Both our previous QEA and the recent study of Rossi et al. show any potential concern for FB1 chronic toxicity in nursery production will be largely alleviated by the use of Bt corn in the feed [4,5]. In order to understand the lifetime exposure (utero-to-finish) of FB1, further QEA models will be required for the gestation phase. This novel Bt and non-Bt comparative dietary QEA model may assist researchers in the dosimetry exposure characterization of experimental designs.

Uncertainties in Assessment

Our current model did not include environmental factors inputs, such as temperature, insect pressure, and storage practice variations [24]. However, since we have used data for FB1 corn spanning multiple use environments and seven growing seasons, the effects of environmental factors is represented in our sampling distribution.
Estimating the DDGS concentration factor of a 3-fold increase is an overestimate of FB1 in diets. Preliminary research to determine the DDGS FB1 concentration factors is estimated to range from 1.5 to 2.8 fold [25]. Inclusion of 30% DDGS throughout the entire grower-finisher production phase has been documented to induce softer pork fat due to high concentrations of linoleic acid in the oil of DDGS, resulting in pork fat iodine that are not acceptable. Therefore, recommendations suggest the removal of DDGS at least 3 weeks before slaughter [8]. The current model included DDGS in diets throughout the production phase without removal.

Acknowledgments

Appreciation is expressed to K. Stalder for swine nutrition consultation.

References

  1. Frisvad, JC; Thrane, U; Samson, RA; Pitt, JI. Important mycotoxins and the fungi which produce them. Adv. Food Mycol 2006, 571, 3–31. [Google Scholar]
  2. Haschek, WM; Gumprecht, LA; Smith, G; Tumbleson, ME; Constable, PD. Fumonisin toxicosis in swine: An overview of porcine pulmonary edema and current perspectives. Environ. Health Perspect 2001, 109, 251–257. [Google Scholar]
  3. Wu, F; Munkvold, GP. Mycotoxins in ethanol co-products: Modeling economic impacts on the livestock industry and management strategies. J. Agr. Food Chem 2008, 56, 3900–3911. [Google Scholar]
  4. Delgado, JE; Wolt, JD. Fumonisin B1 and implications in nursery swine productivity: A quantitative exposure assessment. J. Anim. Sci 2010, 88, 3767–3777. [Google Scholar]
  5. Rossi, F; Morlacchini, M; Fusconi, G; Pietri, A; Piva, G. Effect of insertion of Bt gene in corn and different fumonisin content on growth performance of weaned piglets. Ital. J. Anim. Sci 2011, 10, 95–100. [Google Scholar]
  6. Cullen, AC; Frey, HC. Probabilistic Techniques in Exposure Assessment: A Handbook for Dealing with Variability and Uncertainty in Models and Inputs; Plenum Press: New York, NY, USA, 1999; p. 39. [Google Scholar]
  7. Goodband, RD. Kansas State University: Manhattan, KS, USA, personal communication, 2008.
  8. Stein, HH; Shurson, GC. BOARD-INVITED REVIEW: The use and application of distillers dried grains with solubles in swine diets. J. Anim. Sci 2009, 87, 1292–1303. [Google Scholar]
  9. DeRouchey, JM; Tokach, MD; Dritz, SS; Goodband, RD; Nelssen, JL. Growing-Finishing Pig Recommendations, MF2300; Kansas State University Agriculture Experiment Station and Cooperative Extension Service: Manhattan, NY, USA, 2007. [Google Scholar]
  10. USDA. Adoption of Genetically Engineered Crops in the U.S: Corn Varieties; Economic Research Service: Washingtong, DC, USA, 2010; Available online: http://www.ers.usda.gov/data/biotechcrops/ExtentofAdoptionTable1.htm (accessed on 22 July 2011).
  11. Munkvold, GP; Hellmich, RL; Showers, WB. Reduced Fusarium ear rot and symptomless infection in kernels of maize genetically engineered for European corn borer resistance. Phytopathology 1997, 87, 1071–1077. [Google Scholar]
  12. Munkvold, GP; Hellmich, RL. Genetically modified insect resistant maize implications for management of ear and stalk disease. Plant Health Progr 2000. [Google Scholar] [CrossRef]
  13. Dowd, PF. Biotic and abiotic factors limiting efficacy of Bt corn in indirectly reducing mycotoxin levels in commercial fields. J. Econ. Entomol 2001, 94, 1067–1074. [Google Scholar]
  14. Bakan, B; Melcion, D; Richard-Molard, D; Cahagnier, B. Fungal growth and Fusarium mycotoxin content in isogenic traditional maize and genetically modified maize grown in France and Spain. J. Agr. Food Chem 2002, 50, 728–731. [Google Scholar]
  15. Magg, T; Melchinger, AE; Klein, D; Bohn, M. Relationship between European corn borer resistance and concentration of mycotoxins produced by Fusarium spp. in grains of transgenic Bt maize hybrids, their isogenic counterparts, and commercial varieties. Plant Breed 2002, 121, 146–154. [Google Scholar]
  16. Clements, MJ; Campbell, KW; Maragos, CM; Pilcher, C; Headrick, JM; Pataky, JK; White, DG. Influence of Cry1Ab protein and hybrid genotype on fumonisin contamination and Fusarium ear rot of corn. Crop Sci 2003, 43, 1283–1293. [Google Scholar]
  17. Hammond, BG; Campbell, KW; Pilcher, CD; Degooyer, TA; Robinson, AE; McMillen, BL; Spangler, SM; Riordan, SG; Rice, LG; Richard, JL. Lower fumonisin mycotoxin levels in the grain of Bt corn grown in the United States in 2000−2002. J. Agr. Food Chem 2004, 52, 1390–1397. [Google Scholar]
  18. Tatli, F; Gullu, M; Ozdemir, F. Determination of fungi species, relationship between ear infection rates and fumonisin quantities in Bt maize. IOBC/WPRS Bull 2004, 27, 161–164. [Google Scholar]
  19. De la Campa, R; Hooker, DC; Miller, JD; Schaafsma, AW; Hammond, BG. Modeling effects of environment, insect damage, and Bt genotypes on fumonisin accumulation in maize in Argentina and the Philippines. Mycopathologia 2005, 159, 539–552. [Google Scholar]
  20. Papst, C; Utz, HF; Melchinger, AE; Eder, J; Magg, T; Klein, D; Bohn, M. Mycotoxins produced by Fusarium spp. in isogenic Bt vs. non-Bt maize hybrids under European corn borer pressure. Agron. J 2005, 97, 219–224. [Google Scholar]
  21. Catangui, MA; Berg, RK. Western Bean Cutworm, Striacosta albicosta (Smith) (Lepidoptera: Noctuidae), as a potential pest of transgenic Cry1Ab Bacillus thuringiensis corn hybrids in south Dakota. Environ. Entomol 2006, 35, 1439–1452. [Google Scholar]
  22. Rotter, BA; Prelusky, DB; Fortin, A; Miller, JD; Savard, ME. Impact of pure fumonisin B-1 on various metabolic parameters and carcass quality of growing-finishing swine—Preliminary findings. Can. J. Anim. Sci 1997, 77, 465–470. [Google Scholar]
  23. Jouany, JP. Methods for preventing, decontaminating and minimizing the toxicity of mycotoxins in feeds. Anim. Feed. Sci.Technol 2007, 137, 342–362. [Google Scholar]
  24. Maiorano, A; Reyneri, A; Sacco, D; Magni, A; Ramponi, C. A dynamic risk assessment model (FUMA grain) of fumonisin synthesis by Fusarium verticillioides in maize grain in Italy. Crop Protect 2009, 28, 243–256. [Google Scholar]
  25. Munkvold, GP; Bilsten, E. Iowa State University: Ames, IA, USA, personal communication, 2011.
Figure 1. Cumulative distribution of fumonisin B1 (FB1) concentrations (mg of FB1/kg corn) in Bt (Bacillius thuringiensis) vs. non-Bt corn; data from 1999 to 2006 [1121] from Delgado and Wolt [4].
Ijerph 08 03179f1
Figure 2. Comparison of US and non-US data versus censoring non-US data showing a cumulative distribution of fumonisin B1 (FB1) concentrations (mg of FB1/kg corn).
Ijerph 08 03179f2
Figure 3. Cumulative distributions of chronic fumonisin B1 (FB1) exposure in grower-finisher pig diet scenarios compared to the lower threshold of concern (1 mg FB1/kg diet). Blended diet contains Bt grain, non-Bt grain, Bt DDGS, non-Bt DDGS.
Ijerph 08 03179f3
Table 1. Scenario 1 deterministic (single-point estimate) and semi-stochastic (probabilistic) analysis input assumptions for estimating long-term (20 weeks) exposure to fumonisin B1 in grower-finisher pig diets1.
Input ParameterDeterministic
Semi-stochastic
ValueRationaleDistributionParameters
Specific Week in Grower-FinisherDiscreterange: 1 to 20
Phase, (week, wk)210.00midpointUniform
Body Weight2, kg79.4FICC2BW = f(wk)FICC2
Bt Use Fraction, (BUF)30.76maximumGeneralizedmin = 0.47
Beta4max = 0.69
mean = 0.57
mode = 0.49
p = 1.02
q = 1.23
DDGS Use Fraction, (DUF)50.30maximummaximum
Total corn intake fraction (TCIF), kg corn/kg diet60.820TCIF=f(BW)TCIF = f(BW)
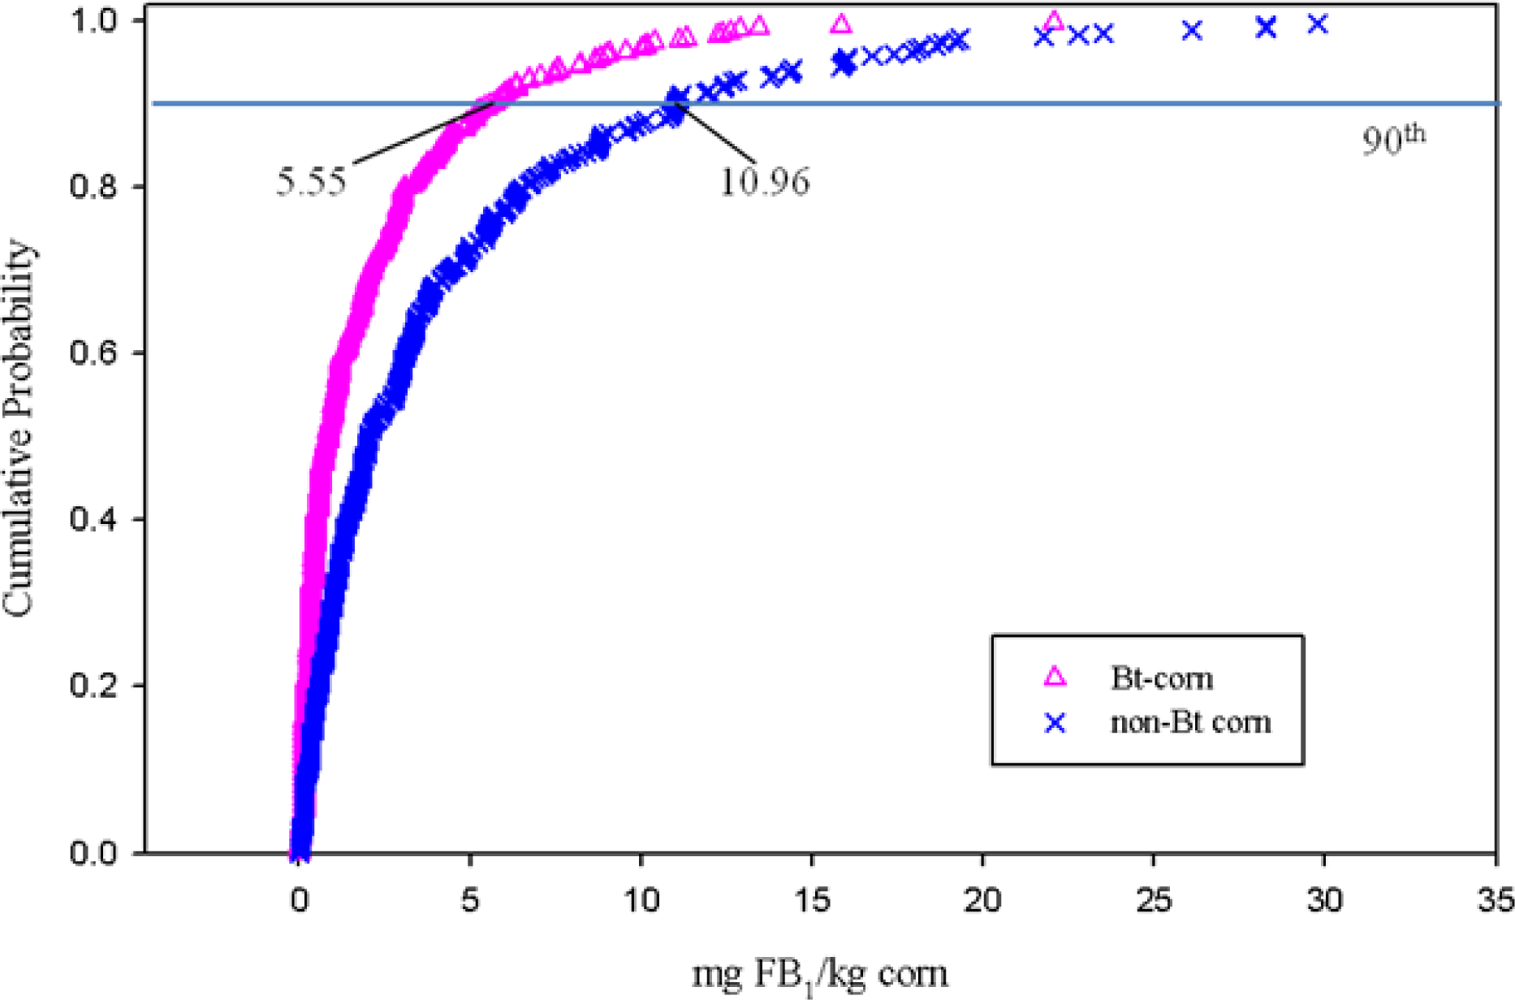
Fumonisin B1 concentration in Bt grain, mg FB1/kg corn, ([FB1]Bt)2.05arithmetic meanempirical CDF7min = 0.01
1% = 0.02
5% = 0.11
10% = 0.14
25% = 0.28
50% = 0.85
75% = 2.69
90% = 5.59
95% = 8.22
99% = 13.43
max = 22.50
Fumonisin B1 concentration in non-Bt grain, mg FB1/kg corn, ([FB1]non-Bt)4.15arithmetic meanempirical CDF7min = 0.00
1% = 0.05
5% = 0.14
10% = 0.28
25% = 0.78
50% = 2.05
75% = 5.59
90% = 11.03
95% = 15.91
99% = 28.28
max = 54.45
DDGS Concentration Factor (DCF)83.00fixedfixed
1Fumonisin B1 exposure equation: TCIF × [FB1]Bt [(BUF – DUF) + (DUF × DCF)] + TCIF × [FB1]non Bt {[(1 – BUF) – DUF] + (DUF × DCF)]}. Bt = Bacillus thuringiensis.
2Source: Kansas State University Feed Intake Curve Calculator (FICC).
3Source: USDA, 2010. Adoption of genetically engineered crops in the US: corn varieties.
4p and q = beta generalized distribution shape parameters.
5Source: [8].
6Data modified from the Kansas State University swine nutritional guide. Grower-Finishing pig recommendations [9]. Corn was determined by the appropriate TCIF on the basis of body weight.
7Cumulative distribution function (CDF).
8Corn source derived from distiller’s dried grains with solubles (DDGS) is estimated to increase fumonisin B1 concentrations by a magnitude of 3.
Table 2. Body weight estimates by weekly intervals during grower-finishing phase production as determined from the Kansas State growth and feed intake curve calculator (FICC)1 and partitioned timeframes corresponding to total corn intake fraction (TCIF)2.
WeekWeight, kgWeekWeight, KgPortioned Weekly TimeframesTCIF2
127.21185.5Weeks 1 and 20.685
232.41291.5Weeks 3, 4, and 50.734
337.81397.3Weeks 6, 7, and 80.783
443.714103.1Weeks 9, 10, and 110.820
549.215108.6Weeks 12, 13, and 140.844
655.116113.9Weeks 15, 16, 17, 18, 19 and 200.864
761.117118.9
867.218123.7
973.319128.2
1079.420132.4
1FICC [7].
2Data modified from the Kansas State University swine nutritional guide [9].
Table 3. Determination of total corn intake fraction (TCIF) in grower-finisher pig diets based on bodyweight1.
Weight Ranges, kgTCIF
22.7 to 33.60.685
34.0 to 54.00.734
54.4 to 72.10.783
72.6 to 88.00.820
88.5 to 104.00.844
>104.30.864
1Data modified from the Kansas State University swine nutritional guide [9].
Table 4. Percentage of insect-resistant Bacillucs thuringiensis (Bt) and stacked gene varieties (Bt plus herbicide resistance) in US 2010 corn varieties used to estimate Bt use fractions (BUF) in grower-finisher pig diets1 [4].
State% Insect-resistant Bt only% Stacked genes varities% Insect-resistant Bt only + % Stacked Gene VarietiesFraction of insect-resistant Bt only + stacked gene varieties
Illinois1552670.67
Indiana756630.63
Iowa1561760.76
Kansas2240620.62
Michigan1144550.55
Minnesota1846640.64
Missouri1545600.60
Nebraska2245670.67
North Dakota2237590.59
Ohio1336490.49
South Dakota660660.66
Texas1840580.58
Wisconsin1338510.51
Generalized β parameters2
Mean = μ0.61
Mode = c0.67
Maximum = b0.76
Minimum = a0.49
p = α10.67
q = α10.83
1USDA (2010), National Agriculture Statistics Service (NASS).
2p and q = shape parameters.
Table 5. Deterministic and semi-stochastic predictions of grower-finishing pig exposure to fumonisin B1 (FB1) in diets.
Feeding Scenarios1Deterministic exposures mg FB1/kg dietSemi-stochastic exposures mg of FB1/kg of diet
MedianMean90th
Scenario 1: Blended Diet22.863.463.505.08
Scenario 2: Bt grain & Bt DDGS2.322.252.404.01
Scenario 3: non-Bt grain & non-Bt DDGS4.694.885.087.87
Scenario 4: Bt & non-Bt grain2.092.132.193.20
Scenario 5: Bt grain1.681.431.502.52
Scenario 6: non-Bt grain3.403.023.114.97
1Corn and corn derived component distiller dried grains with solubles (DDGS) in diet.
2Includes a blend of Bt grain, non-Bt grain, Bt DDGS and non-Bt DDGS.

