2.1. Enzyme Purification
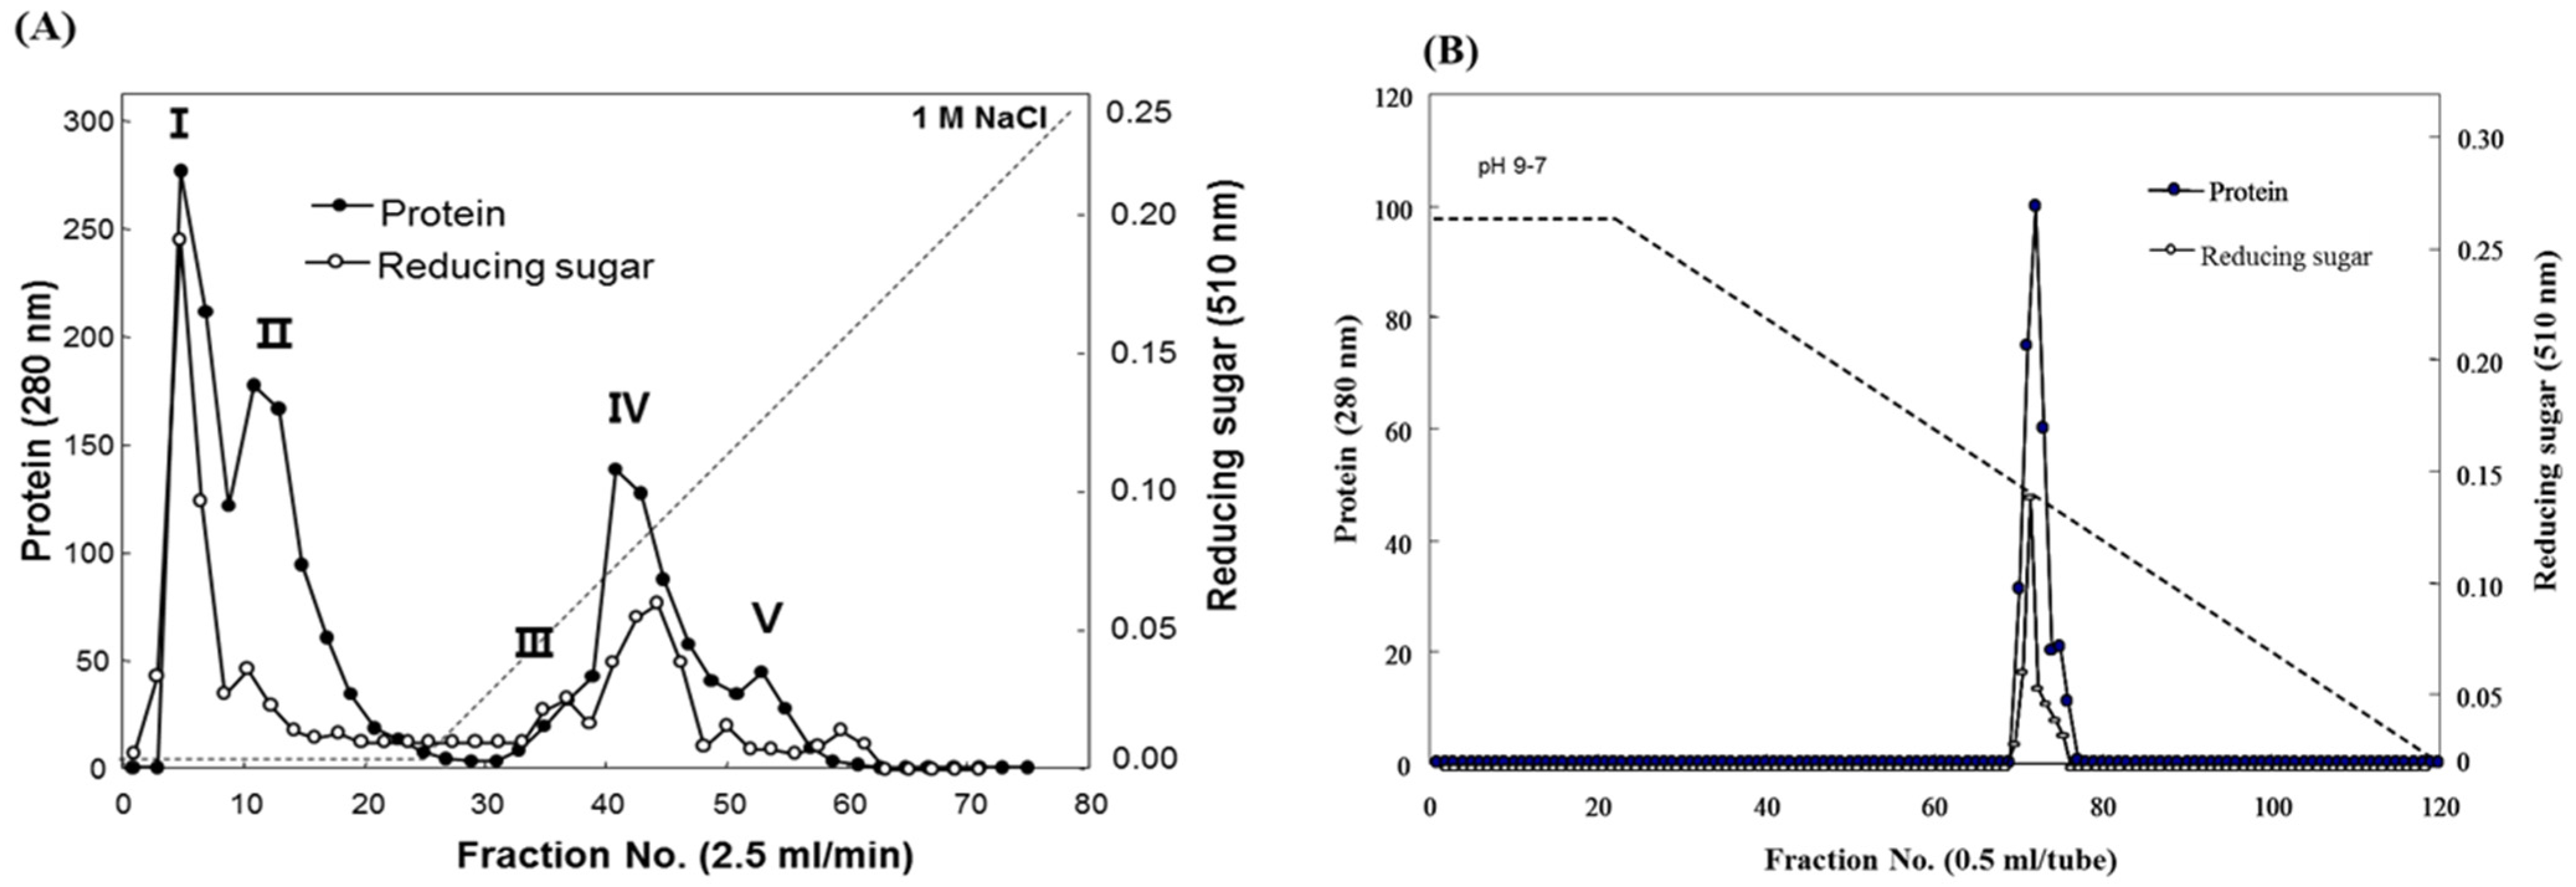
Fucodianase was purified from the supernatant that was prepared from the cell harvest via ammonium sulfate fractionation, diethylaminoethyl (DEAE)-Sepharose Fast-Flow anion-exchange chromatography and chromatofocusing. Consequently, the elution profile of the DEAE Sepharose chromatography indicated that among the five peaks with fucoidanase activities, fractions 2 to 8 (peak I) exhibited relatively higher peak than the others (
Figure 1A). The fractions in peak I were collected and concentrated with 80% (NH
4)
2SO
4. The elution profile from the chromatofocusing revealed a single peak with fucoidanase activity that appeared from fractions 71 to 75 (
Figure 1B). These results, summarized in
Table 1, indicate that the enzyme was purified to homogeneity, and a 112.8-fold increase in the specific fucoidanase activity (relative to the activity of the cell disruption supernatant) with a yield of approximately 3.2%. Notably, all of the processes employed in the purification step may provide useful tools for the purification of those displayed on the cell surface since we previously reported that this fucoidan-degrading enzyme activity of
S. paucimobilis PF-1 is observed with the harvested intact cells, implying its localization on the surface of the cell [
14].
Figure 1.
Elution profiles of the fucoidanase from Sphingomonas paucimobilis PF-1 resulting from (A) diethylaminoethyl (DEAE)-Sepharose fast-flow anion exchange column chromatography and (B) chromatofocusing.
Figure 1.
Elution profiles of the fucoidanase from Sphingomonas paucimobilis PF-1 resulting from (A) diethylaminoethyl (DEAE)-Sepharose fast-flow anion exchange column chromatography and (B) chromatofocusing.
Table 1.
Isolation and purification of fucoidanase from Sphingomonas paucimobilis PF-1.
Table 1.
Isolation and purification of fucoidanase from Sphingomonas paucimobilis PF-1.
| Step | Total volume (mL) | Protein (mg/mL) | Total protein (mg) | Activity (mg/mL) | Specific activity (U·mg−1 of protein) | Total activity (unit) | Yield (%) |
|---|
| Cell disruption supernatant | 100 | 44.287 | 4428.7 | 0.841 | 0.019 | 84.08 | 100 |
| 80% Ammonium sulfate | 70 | 19.582 | 1370.74 | 0.538 | 0.027 | 37.66 | 44.79 |
| DEAE-Sepharose | 15 | 0.147 | 2.205 | 0.210 | 1.429 | 3.15 | 3.75 |
| Chromatofocusing | 3 | 0.042 | 0.126 | 0.090 | 2.143 | 0.27 | 3.2 |
2.2. Estimation of the Molecular Mass and N-Terminal Sequence of the Fucoidanase
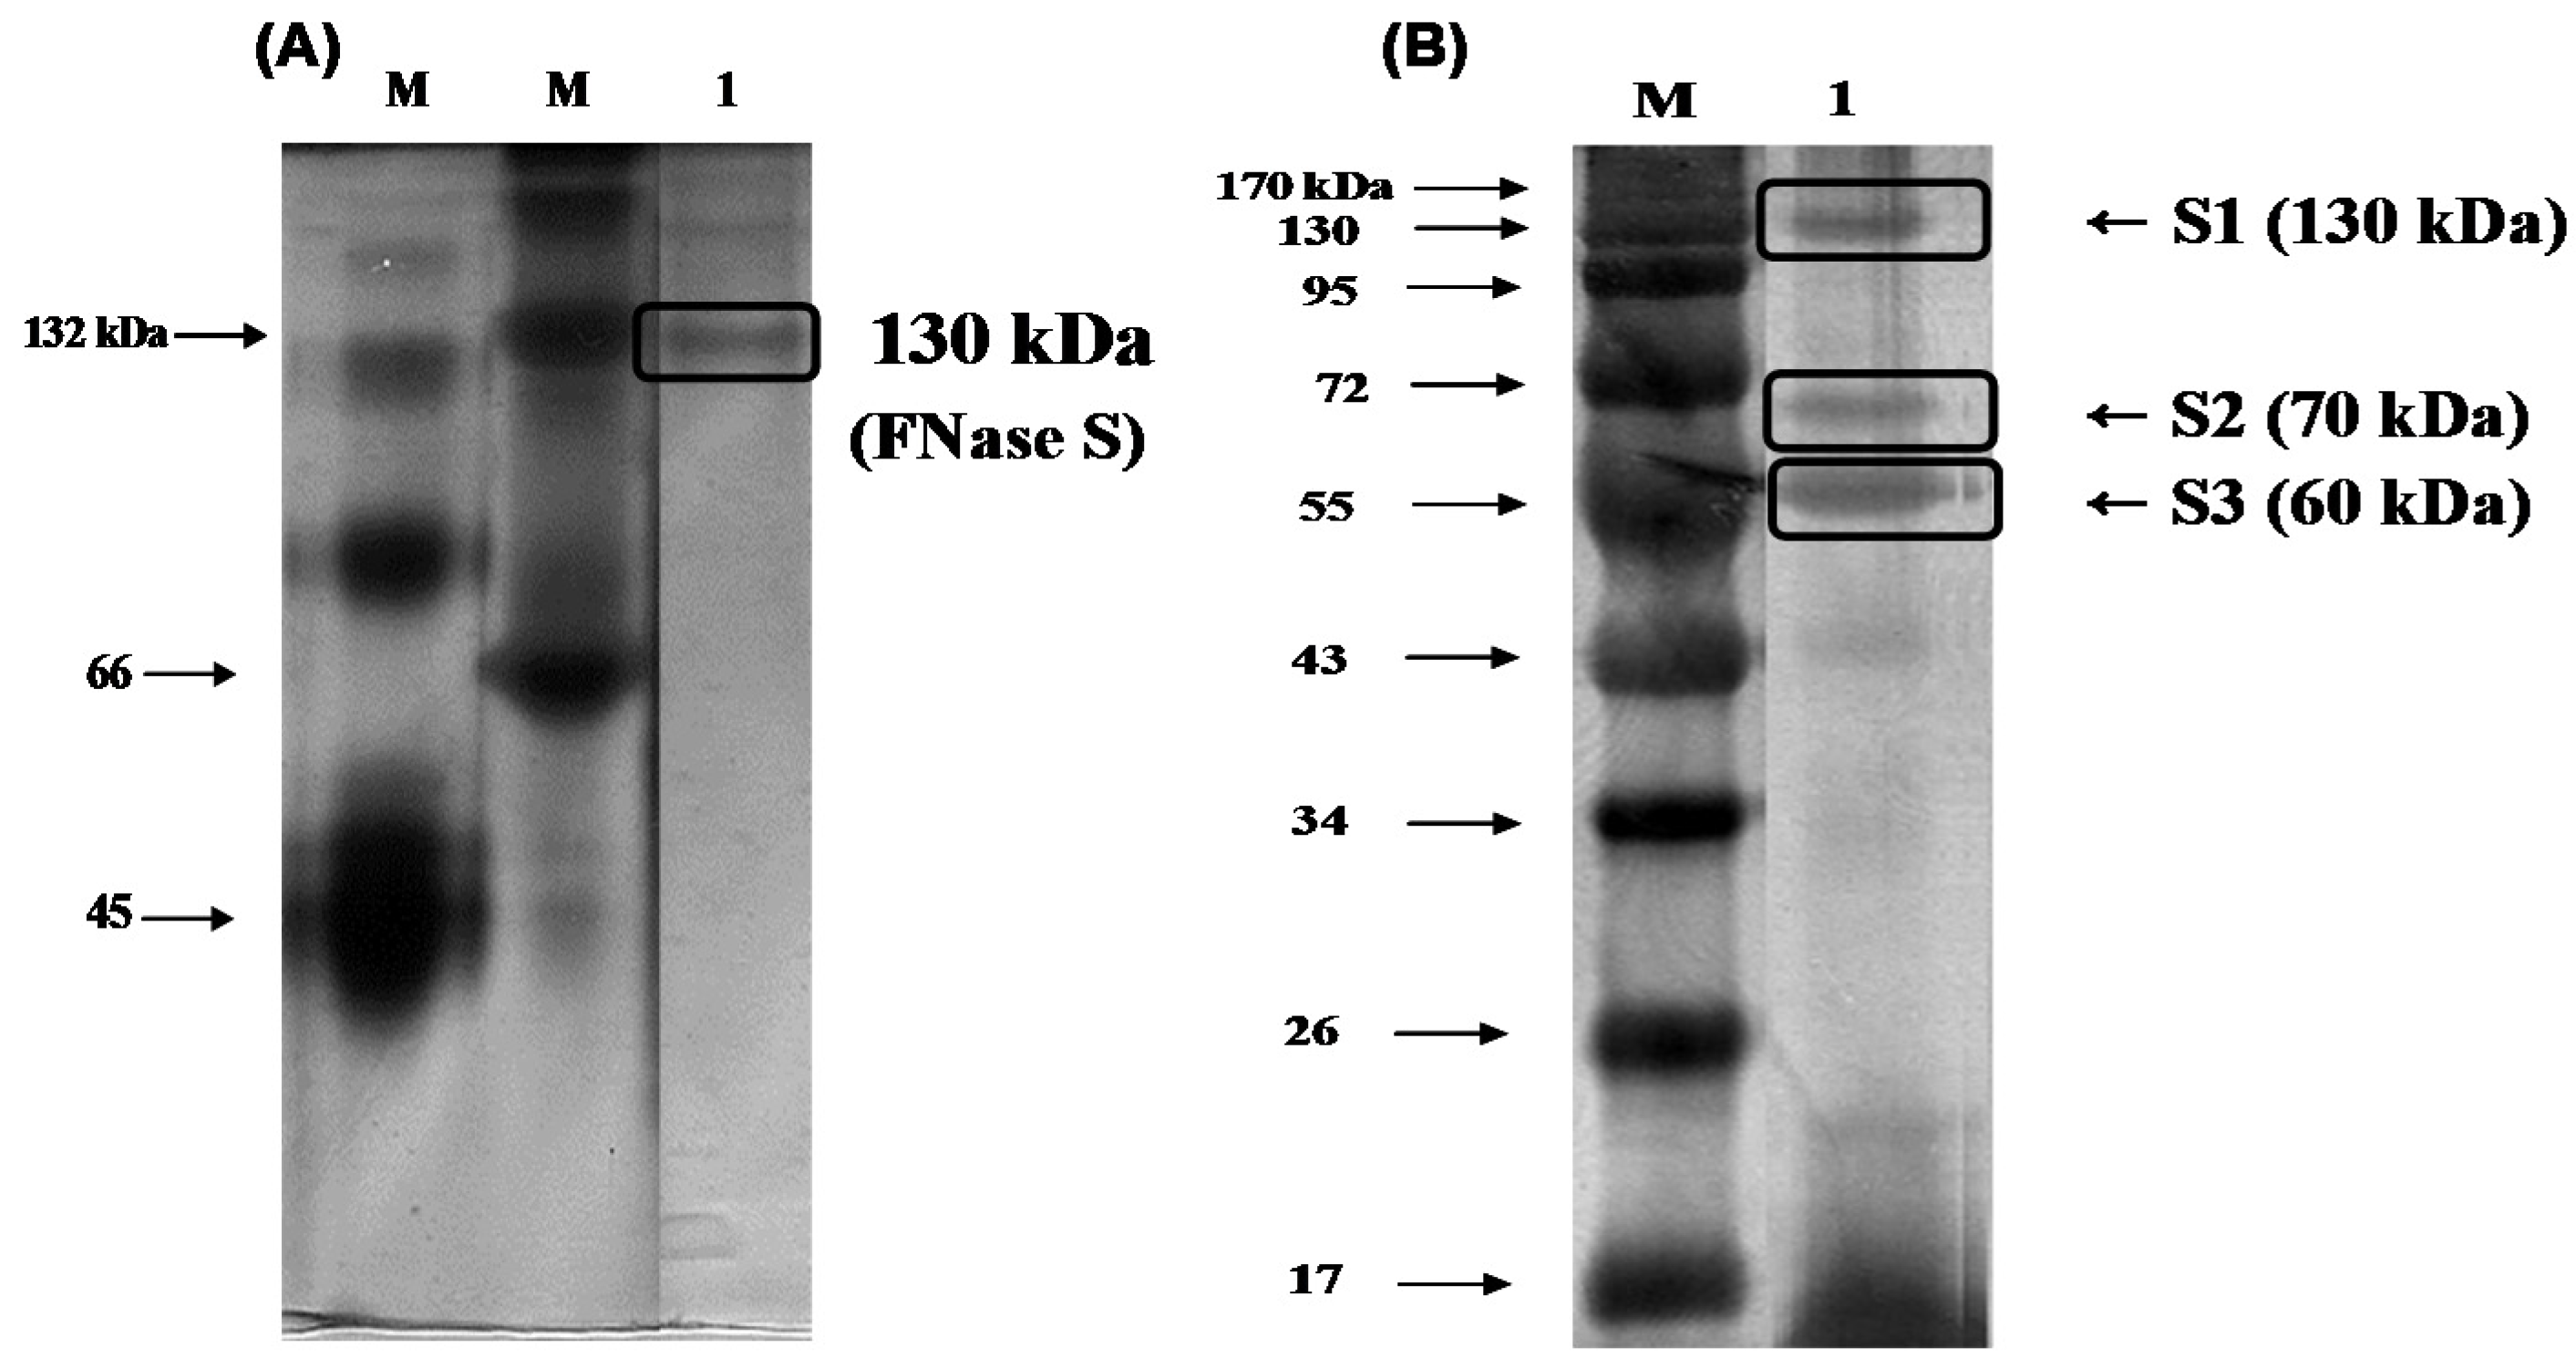
To determine the protein purity and molecular mass of the purified enzyme, native-polyacrylamide gel electrophoresis (PAGE) and sodium dodecyl sulfate (SDS)-PAGE was used according to the methods described by Laemmli [
16]. The results shown in
Figure 2A indicated that there was one single protein band from the final concentrated elutant, and the relative molecular mass of the purified fucoidanase was estimated to be 130 kDa (FNase S) with native-PAGE. It has been reported that the majority of
Flavobacteriaceae sp. fucoidanases have molecular masses of 105 kDa, based on SDS-PAGE [
17]. In general, the high-molecular weight enzyme (e.g., FNase S) can be dissociated by treatment with SDS and boiling for 10 min into several components that can be separated with SDS-PAGE. To determine whether the protein was monomeric, the purified enzyme was analyzed with SDS-PGAE. As shown in
Figure 2B, the isolated multi-complex enzyme exhibited three subunits that were derived from the purified enzyme, appeared as a single band in the native-PAGE, and were determined to have molecular weights of 130 (S1), 70 (S2), and 60 kDa (S3) by SDS-PAGE. A similar result was reported by another research group. Furukawa
et al. [
18] reported that the molecular masses of the fucoidanase E1, E2, and E3 of the
Vibrio sp. N-5 were 39 kDa, 68 kDa, and 68 kDa, respectively, based on SDS-PAGE analysis. Although the evidence is insufficient to reach a clear conclusion, these results indicated that the purified fucoidanases from both of the bacterial strains appeared to be similar to the large extracellular enzyme complex, called the cellulosome, of the plant-cell-wall-degrading anaerobic microorganisms [
19]. The cellulosome consists of a scaffolding protein and many bound enzymes. Similarly, the subunits of FNase S of
Sphingomonas paucimobilis PF-1 are probably involved in the enzyme’s activity, stability and/or binding to substrate in physiological conditions.
The
N-terminal 10-amino acid sequences of the S1, S2, and S3 subunits were analyzed and determined to be SXPEAASLPG, SPQFDVVXIG, and SLQFDVVVIG, respectively. A BLASTp search of GENBANKnr using the three domains revealed homologies primarily with hypothetical bacterial conserved proteins, with various annotations, such as protein-containing ATPase, core domain (EGF 27867), carbohydrate kinase, PfkB family protein (YP003854323) and dihydrolipoyl dehydrogenase (ZP08017938) (
Table 2), which are not related to any glycohydrolases or glycosidases. Based on these results, we suggest that the purified protein might be a unique enzyme with fucoidanase activity, although full amino acid sequences of these subunits need to be further determined in the future.
Table 2.
Determinations of the N-terminal amino acid sequences of (A) S1, (B) S2, and (C) S3. The isolated multi-complex enzyme was composed of three subunits with molecular weights of 130 (S1), 70 (S2), and 60 kDa (S3), as determined with SDS-PAGE.
Table 2.
Determinations of the N-terminal amino acid sequences of (A) S1, (B) S2, and (C) S3. The isolated multi-complex enzyme was composed of three subunits with molecular weights of 130 (S1), 70 (S2), and 60 kDa (S3), as determined with SDS-PAGE.
| Matched protein | Mol. Mass (kDa) | Positives (%) | Matched species | Functional category | Matched Peptide | Accession No. |
|---|
| (A) The homology comparison of N-terminal 10-amino acid sequence of the S1 subunit to the hypothetical bacterial conserved proteins by a BLASTp search. |
| Protein containing ATPase, AAA+ type, core domain | 244 | 8/10 (80) | Rhodopirellula baltica WH47 | Protein containing ATPase, core domain | maedaspeaaslpgaagdgg | EGF 27867 |
| Hypothetical protein RB6669 | 202 | 8/10 (80) | Rhodopirellula baltica SH 1 | ATP binding site | maedaspeaaslpgaagdgg | NP 867389 |
| Chitinase | 127 | 8/10 (80) | Arthroderma otae CBS 113480 | | wpdvldaaslptltletagg | XP002842640 |
| ABC sugar (glycerol) transporter, inner membrane subunit | 32 | 8/10 (80) | Sagittula stellata E-37 | Inner membrane subunit | madttsapgaaslpgdvtak | ZP01747232 |
| Glycoside hydrolase family protein | 103 | 8/10 (80) | Roseiflexus castenholzii DSM 13941 | Sugar binding domain | slsdgpesaslpgrfplret | YP001433316 |
| (B) The homology comparison of N-terminal 10-amino acid sequence of the S2 subunit to the hypothetical bacterial conserved proteins by a BLASTp search. |
| Carbohydrate kinase, PfkB family protein | 34 | 8/10 (80) | Parvularcula bermudensis HTCC2503 | Adenosine_kinase | mapqfdviaignaivdllah | YP003854323 |
| Hypothetical protein DFA_11777 | 78 | 9/10 (90) | Dictyostelium fasciculatum | Hypothetical protein | mvsphydvvvigagiaglsq | EGG14015 |
| Dihydrolipoamide dehydrogenase | 50 | 8/10 (80) | Xanthomonas axonopodis pv. citri str. 306 | Pyridine nucleotide-disulphide oxidoreductase | mseqfdvvvigagpagyhaa | NP641866 |
| Sugar kinase | 34 | 8/10 (80) | Erythrobacter sp. SD-21 | Adenosine kinase | mtdprydvvaignaivdvma | ZP01863524 |
| (C) The homology comparison of N-terminal 10-amino acid sequence of the S3 subunit to the hypothetical bacterial conserved proteins by a BLASTp search. |
| Dihydrolipoyl dehydrogenase | 51 | 9/10 (90) | Lautropia mirabilis ATCC 51599 | Dihydrolipoyl dehydrogenase | mslefdvvvigagpggyiaa | ZP08017938 |
| Anaerobic glycerol-3-phosphate dehydrogenase subunit B | 45 | 9/10 (90) | Serratia odorifera DSM 4582 | ANAEROBIC glycerol-3-phosphate dehydrogenase | mqfdvvvigg | ZP06638221 |
| Transmembrane protein | 42 | 9/10 (90) | Chromobacterium violaceum ATCC 12472 | Transmembrane protein | mqfdviviga | NP902173 |
Figure 2.
Gel-electrophoresis analyses of the purified enzyme. The purified fucoidanase was analyzed with (A) 12% native-polyacrylamide gel electrophoresis (PAGE) and (B) sodium dodecyl sulfate (SDS)-PAGE, and stained with silver. M, molecular weight marker (kDa); lane 1, purified fucoidanase on the native-PAGE (A); lane 1, purified fucoidanase on the SDS-PAGE performed without mercaptoethanol in the sample buffer (B).
2.3. Optimum pH and Temperature for Enzyme Activity and Stability
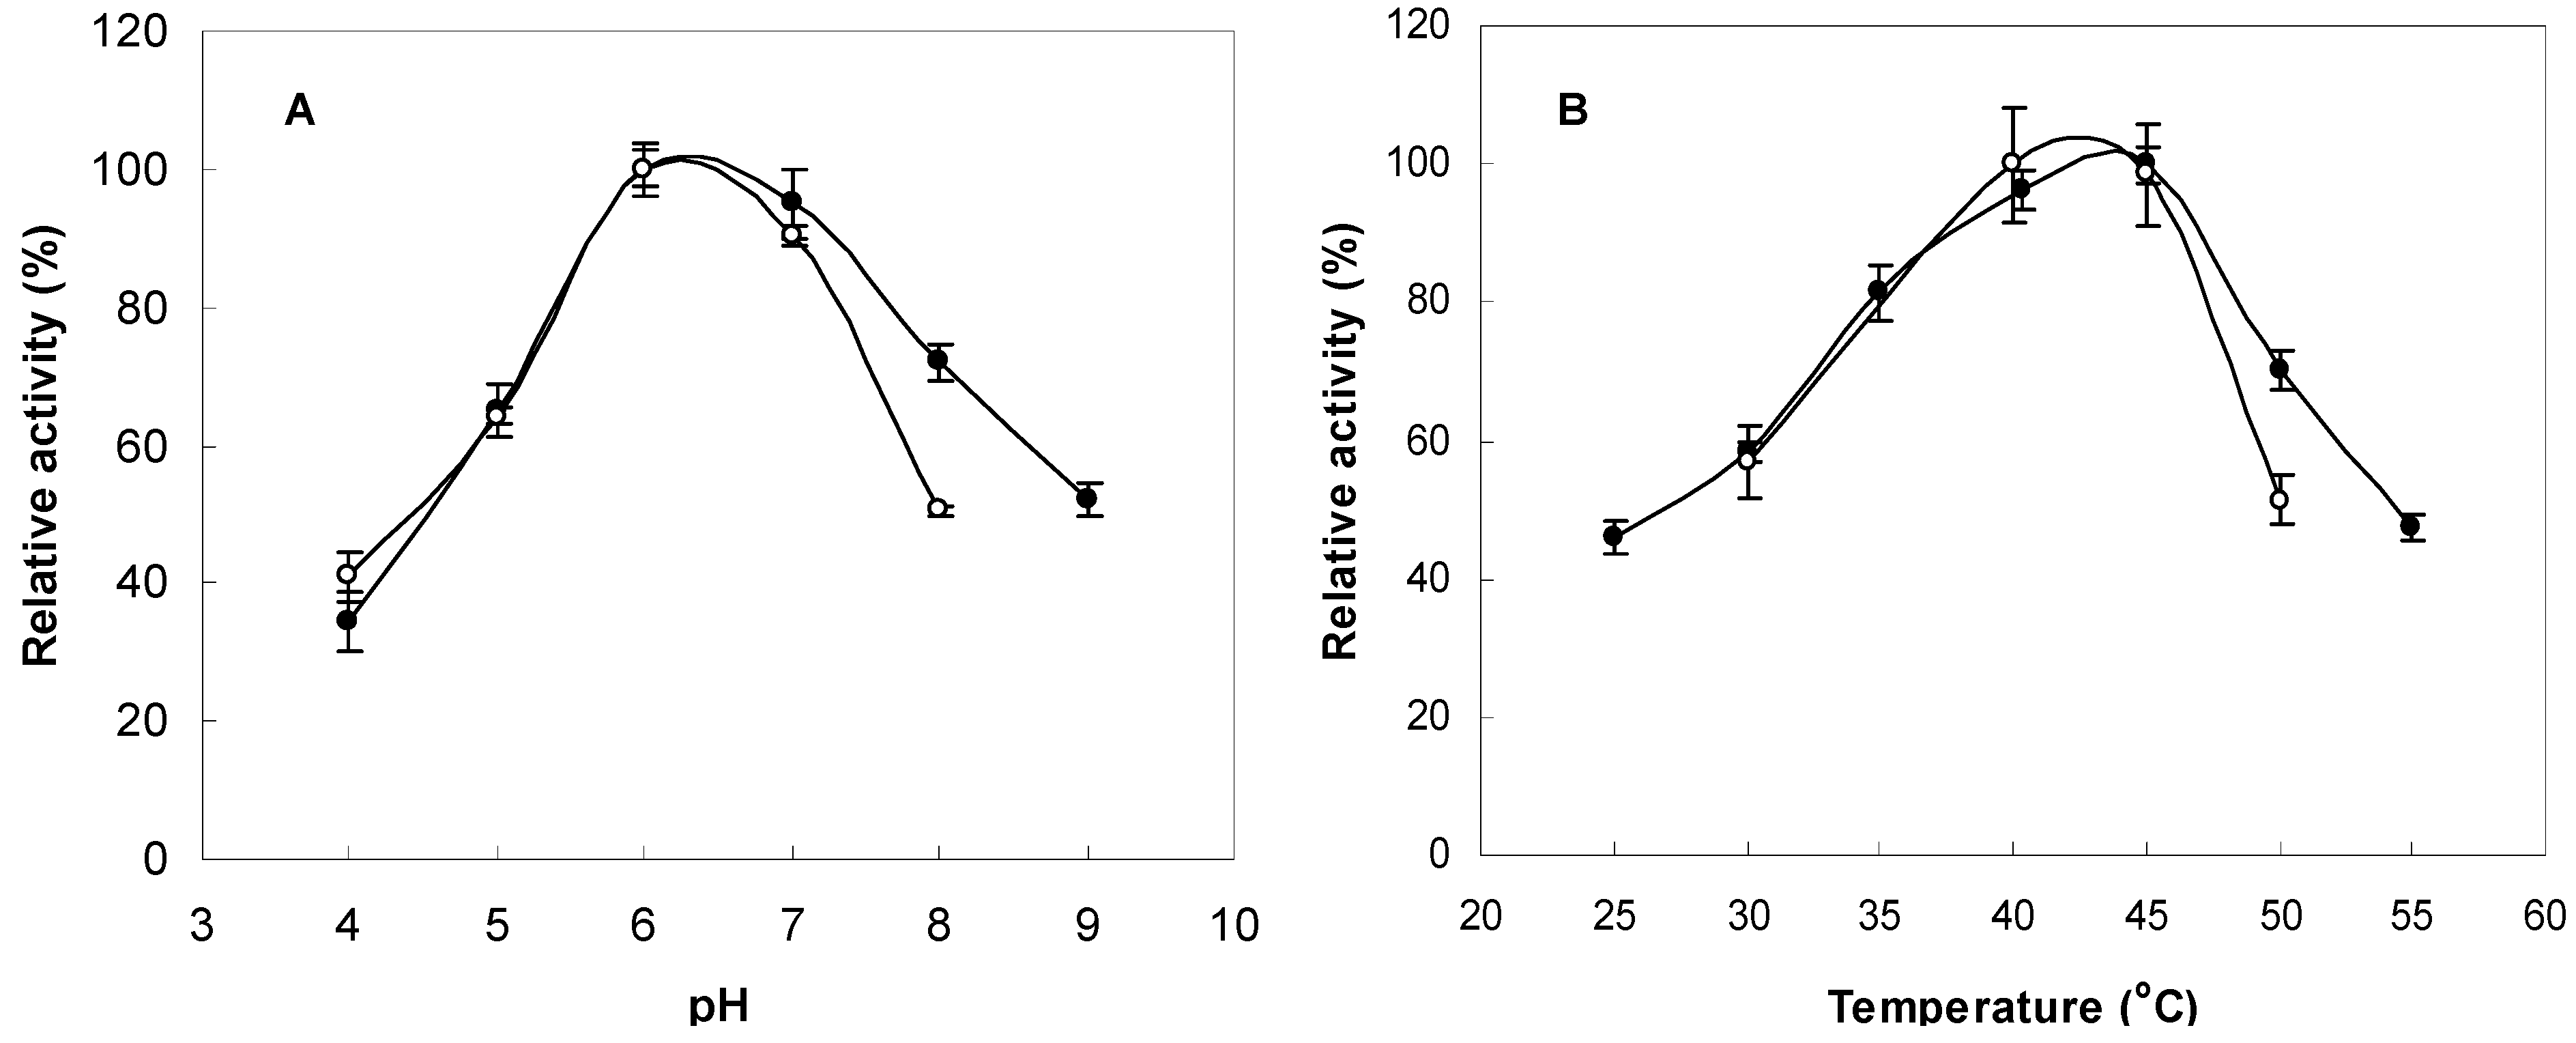
The FNase S activity was measured at various pH values (pH 4.0~9.0) in buffers with the same ionic concentrations to determine the optimal conditions. The pH stability was tested via 24-h preincubations of the FNase S in appropriate buffers at 45 °C that had the same ionic concentrations but different pH values that ranged from 4.0 to 9.0. The maximum activity was observed between pH 6.0 and 7.0 (
Figure 3A). The FNase S activity was measured as a function of temperature from 25 °C to 55 °C, and the activity was found to be greatest at 45 °C (
Figure 3B). The thermostability was tested after preincubation at various temperatures (25–55 °C) for one day at pH 6.0 and then by measuring the residual fucoidanase activity at 45 °C. As shown in
Figure 3B, this enzyme was shown to be stable at 40–45 °C. The optimum pH and temperature for this enzyme were very close to the enzyme of the marine
Vibrio sp., which has optimum pH and temperature ranges of pH 6.0 to 8.0 and 35 to 45 °C, respectively [
18].
Figure 3.
Effects of pH and temperature on enzyme activity and stability. (A) The enzyme activities were measured at various pH levels at 45 °C for three days (●). The enzyme solutions were preincubated at various pH levels for one day, and the remaining activities were measured at pH 6.0 and 45 °C for three days (○). (B) The enzyme activities were measured at various temperatures in 10 mM sodium acetate buffer at a pH of 6.0 for three days (●). The enzyme solutions were preincubated at various temperatures for one day in 10 mM sodium acetate buffer (pH 6.0), and the remaining activities were measured at 45 °C for three days (○).
2.4. Effects of Meal Ions and Substrate Specificities on the Enzyme Activities
The effects of metal ions on activity of FNase S were investigated (
Table 3A). Mn
2+ and Na
+ (concentrations of 1 mM) caused significant increases of 115% and 131%, respectively, while Ca
2+ (86%), K
+ (83%), Ba
2+ (84%) and Cu
2+ (89%) caused significant decreases in enzyme activity. FNase S may require mono- or divalent metal ions (Mn
2+ and Na
+) for effective enzyme activity or digestion of Miyeokgui fucoidan (MF) via the metabolic processes that occur in marine environments. The substrate specificities of FNase S on various carbohydrates were investigated (
Table 3B). A commercial fucoidan (FF, Sigma, St. Louis, MO, USA) and alginate stimulated the FNase S enzyme activity by 134% and 129%, respectively, when compared with that (100%) on MF as the control. However, heparin (79%), starch (25%), laminarin (54%) and dextran (15%) acted to decrease the activity of FNase S. Therefore, we concluded that FNase S exhibits substrate specificities for fucoidan and alginate. However, to more clearly define the relationships between the molecular structures of these polysaccharides and the enzyme activities, additional comparison studies with other fucoidanases are needed. Unfortunately, to date, less is known about the enzymatic properties of fucoidanases. It is very important to achieve a detailed understanding of the key factors, such as the sulfur content, the sugar composition and the molecular weight, of substrates involved in the enzymatic characteristics.
Table 3.
Effects of metal ions (A) and substrate specificities (B) on fucoidanase activities. The data are given as the means ± SD (standard deviation), n = 3. (A) Control, the fucoidanase activity in the absence of metal ions was regarded as 100%. (B) Control, the activity of the purified enzyme (FNase S) on MF was regarded as 100%.
| Metal ions (1 mM) | Relative activity (%) |
|---|
| (A) Effects of metal ions on fucoidanase activities. |
| Control | 100 |
| Na+ | 131.2 ± 0.83 |
| Mn2+ | 115.7 ± 0.93 |
| K+ | 83.7 ± 0.26 |
| Cu2+ | 89.3 ± 2.06 |
| Ca2+ | 86 ± 1.68 |
| Ba2+ | 84.3 ± 2.8 |
| (B) Effects of substrate specificities on fucoidanase activities. |
| Substrate | Relative activity (%) |
| Control | 100 |
| FF * | 134.5 ± 1.9 |
| Heparin | 79.2 ± 1.4 |
| Alginate | 129.4 ± 2.3 |
| Starch | 25.2 ± 0.8 |
| Laminarin | 54.9 ± 2.2 |
| Dextran | 15.5 ± 3.1 |
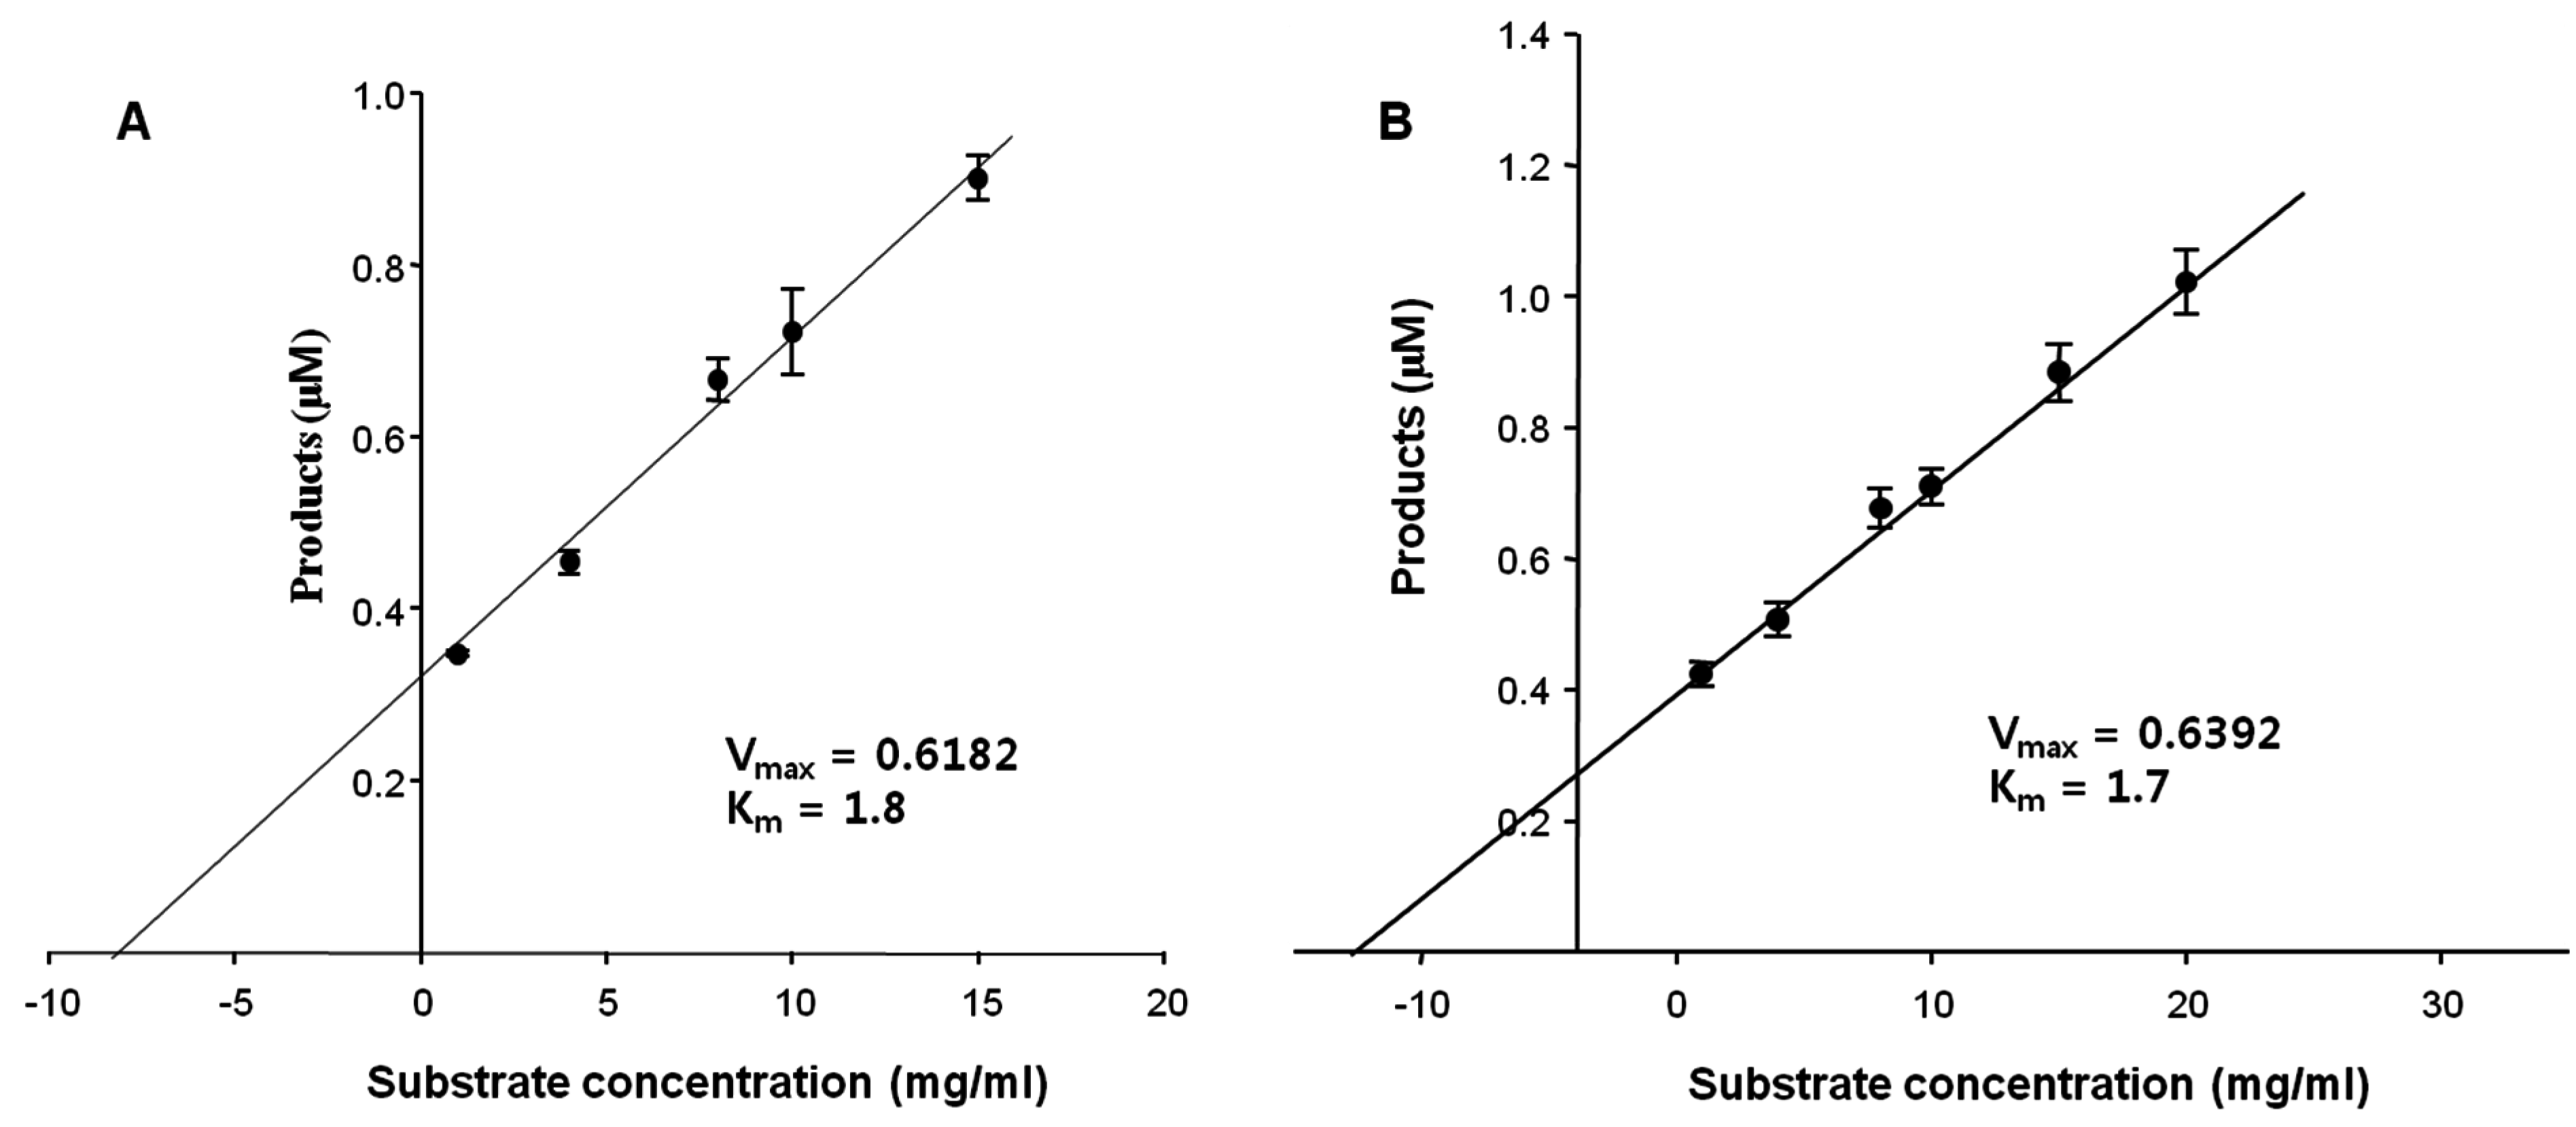
2.5. Kinetic Parameters
Initially, the kinetic parameters of the FNase S against the natural substrates, FF and MF, were determined to be
Km = 1.7 and 1.8 mM, and
Vmax = 0.62 and 0.64 mg/min, respectively (
Figure 4). These results also indicated that the
Kcat values of the FNase S were 0.376 S
−1 and 0.343 S
−1 (
Vmax/
Km), respectively (
Table 4). Interestingly, MF and FF were hydrolyzed at similarly fast rates (
Kcat) and high
Kcat/
Km values. As demonstrated in
Figure 3 and
Figure 4, the determination of the kinetic parameters and substrate specificities of FNase S are important for understanding its enzymatic properties. However, our ability to find valuable information from other comparable studies was limited due to the paucity of such studies. Therefore, our current date could be the most valuable in terms of its contributions to kinetic studies of the activities of fucoidanases and other related enzymes.
Figure 4.
Assay of the enzyme kinetics at different substrate concentrations. The concentration of the enzyme was fixed at 1 mg/mL. (A) Miyeokgui fucoidan (MF) and (B) FF (commercial fucoidan, Sigma) were used as the substrates. The values of the products were calculated by measuring the reducing sugars released from the substrate fucoidans, (A) MF and (B) FF, and were expressed in molar concentrations.
Table 4.
Kinetic parameters of the purified enzyme (FNase S) on Miyeokgui fucoidan (MF) and commercial fucoidan (FF) as the substrates.
Table 4.
Kinetic parameters of the purified enzyme (FNase S) on Miyeokgui fucoidan (MF) and commercial fucoidan (FF) as the substrates.
| Substrate | Kcat (S−1) | Km (mM) | Vmax (mg/min) | Kcat/Km (S−1·mM−1) |
|---|
| FF | 0.376 ± 0.04 | 1.7 ± 0.36 | 0.62 | 0.221 |
| MF | 0.343 ± 0.1 | 1.8 ± 0.25 | 0.64 | 0.19 |
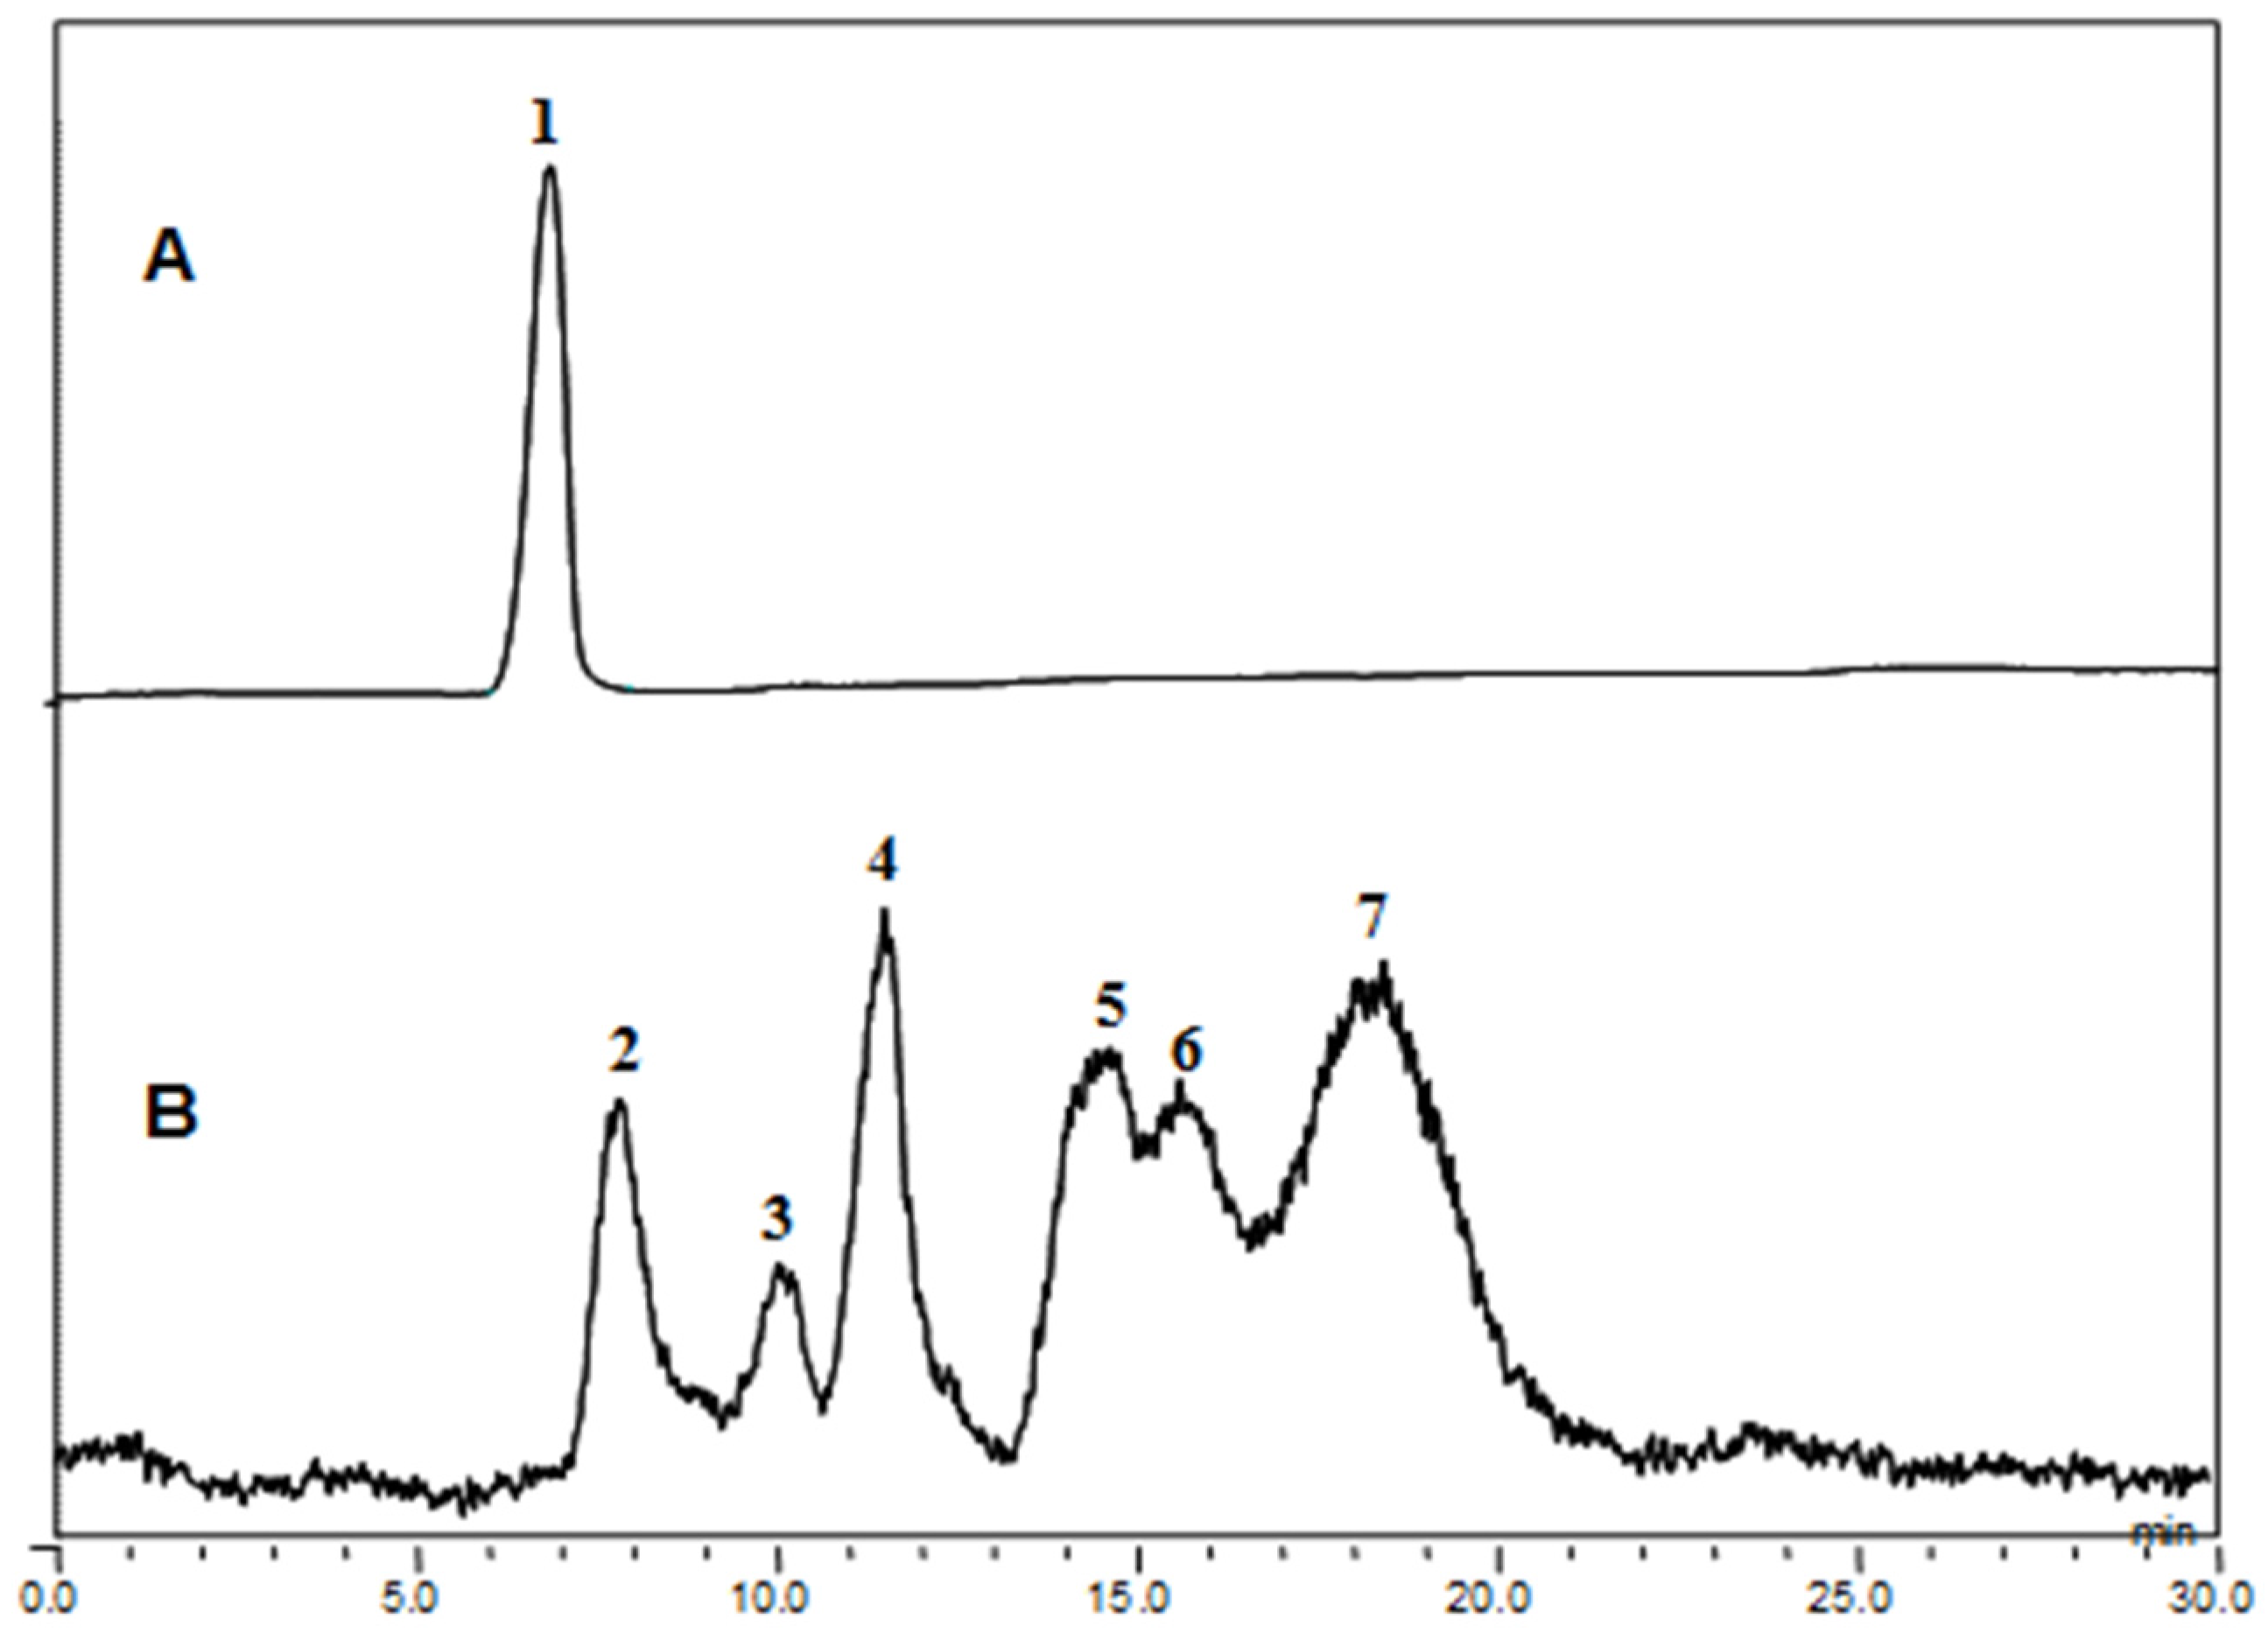
2.6. Production and Characterization of Galactofuco-Oligosaccharides by FNase S
The fucoidanase activity was determined by measuring the level of reducing sugars and confirmed by HPLC analyses of the degradation products (
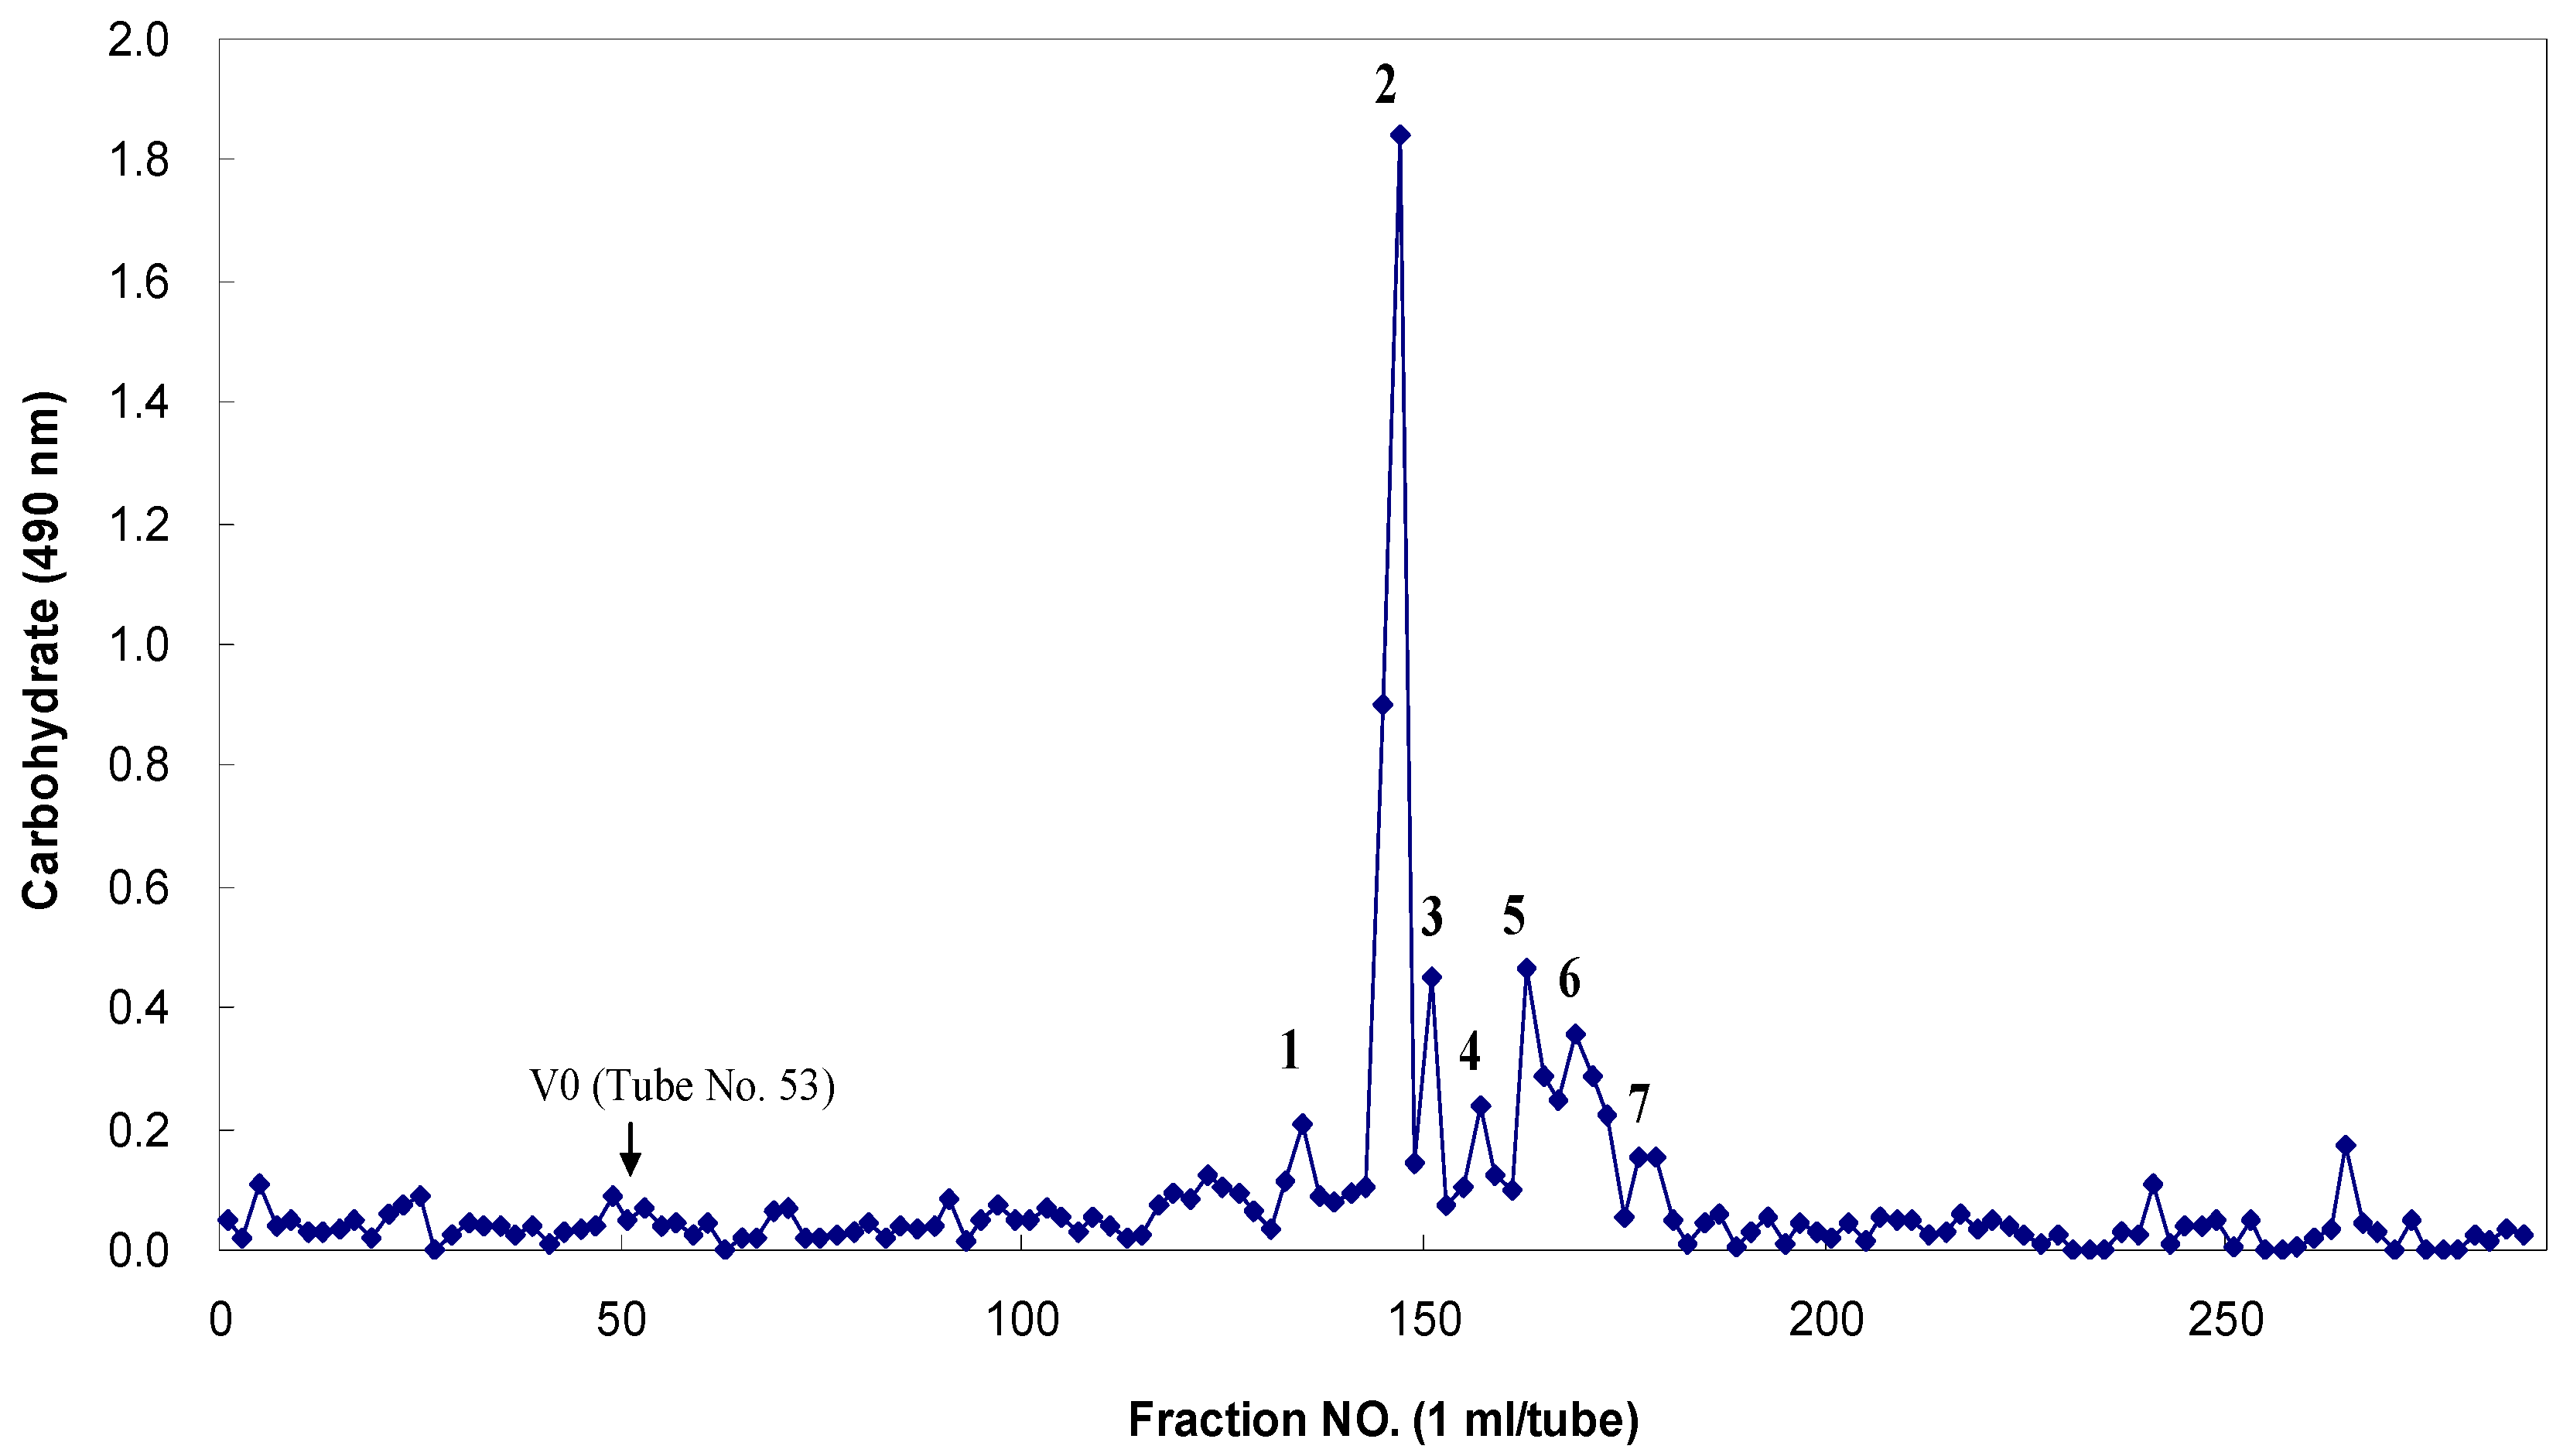
Figure 5). The fucoidan-degrading activity was also clearly confirmed by the fractionation of the degradation products through Bio-Gel P-4 size-exclusion chromatography and the analysis of the monosaccharide compositions of the resulting oligosaccharides (
Figure 6). The oligosaccharides generated were resolved into seven distinct low-molecular mass fractions with peaks that ranged from 1 to 7. Based on comparisons with the masses of the standard malto-oligosaccharides (1–7 glucose units, Sigma), the relative molecular masses of these fucoidan oligosaccharides were determined to be 3312 Da (peak 1), 2494 Da (peak 2), 1699 Da (peak 3), 1543 Da (peak 4), 1312 Da (peak 5), 817 Da (peak 6), and 318 Da (peak 7) (
Table 5). Based on the total sugar levels, one major fraction (peak 2) represented approximately 72% of the initial oligosaccharide mixture. Based on the high performance anion-exchange chromatography with pulsed amperometric detection (HPAEC/PAD) analysis that followed trifluoroacetic acid (TFA) hydrolysis, the constituent monosaccharides of these seven major oligosaccharides were determined to be the following: peak 1, fucose, galactose, mannose and xylose at 8:7:2:2 (given as the mole ratios); peak 2, 3:8:2:2; peak 3, 5:3:1:1; peak 4, 3:3:2:1; peak 5, fucose and galactose at 7:1; peak 6, fucose and galactose, 4:1; peak 7, fucose only (dimer) (
Table 5). The uronic acid and sulfate contents of these fractions were not determined at this time. These results clearly indicated that fucose and galactose were the major monosaccharides in these oligosaccharides that were derived from MF fucoidan.
Figure 5.
High performance liquid chromatography (HPLC) analysis of Miyeokgui fucoidan (MF) and its enzymatic hydrolysates produced by FNase S. (A) MF and (B) its hydrolysates were analyzed on a Shodex OHpak SB-806HQ column using HPLC system equipped with evaporative light scattering detector (ELSD). The elution was performed with distilled water at a rate of 0.8 mL/min.
Figure 6.
Bio-Gel P-4 column chromatography of the fragmented Miyeokgui fucoidan (MF) after digestion by FNase S.
Figure 6.
Bio-Gel P-4 column chromatography of the fragmented Miyeokgui fucoidan (MF) after digestion by FNase S.
Table 5.
Monosaccharide compositions and relative molecular masses of the galactofuco-oligosaccharides generated from MF by FNase S.
Table 5.
Monosaccharide compositions and relative molecular masses of the galactofuco-oligosaccharides generated from MF by FNase S.
| Peak No a | Mr b (Da) | Monosaccharide composition c | Relative amount (%) d |
|---|
| 1 | 3312 | Fucose, Galactose, Mannose, Xylose (mole ratio, 8:7:2:2) | 4.5 |
| 2 | 2494 | Fucose, Galactose, Mannose, Xylose (mole ratio, 3:8:2:2) | 72 |
| 3 | 1699 | Fucose, Galactose, Mannose, Xylose (mole ratio, 5:3:1:1) | 6.5 |
| 4 | 1543 | Fucose, Galactose, Mannose, Xylose (mole ratio, 3:3:2:1) | 2.7 |
| 5 | 1312 | Fucose, Galactose (mole ratio, 7:1) | 5.3 |
| 6 | 817 | Fucose, Galactose (mole ratio, 4:1) | 6.1 |
| 7 | 318 | Fucose (2 moles) | 2.9 |
This fucoidanase activity of FNase S was not related to α-
l-fucosidase. While the commercial α-
l-fucosidase released
p-nitrophenol from the artificial substrate,
p-nitrophenyl-α-
l-fucoside, our fucoidanase enzyme preparation (FNase S) did not produce
p-nitrophenol, which demonstrated that the fucoidanase activity of this enzyme in the degradation of MF was not related to the α-
l-fucosidase activity (data not shown). Taken collectively, these results strongly suggested that FNase S produces low-molecular weight galactofuco-oligosaccharides from MF, a sulfated galactofucan of the sporophyll (called
Miyeokgui in Korean) of Korean
Undaria pinnatifida, and that this FNase S is not an α-
l-fucosidase but is rather an
endo-acting fucoidanase that randomly attacks the fucoidan chains as other reports have demonstrated [
8,
20].
Bakunina [
21] reported on the 25 strains of epiphytic marine bacteria isolated from the brown algae
Fucus evanescens and
Chorda filum, and 53 bacterial strains isolated from the sea cucumber
Apostichopus japonicus were screened for having fucoidanase activity using fucoidans prepared from the brown algae
F. evanescens and
Laminaria cichorioides (
Table 6)
. The bacterial epiphytes
Cytophaga sp. and some bacterial isolates of the genera
Alteromonas and
Pseudoalteromonas from the sea cucumber were also found to possess fucoidanase activity [
13]. However, the enzyme activity was comparable but lower than that of the already known microbial fucoidanases [
22,
23]. Although very little is known about the genes that encode fucoidanases, the molecular cloning and biochemical characterization of a special fucanase FcnA termed fucan α-1,4-endohydrolase isolated from the family
Flavobacteriaceae have decoded the structural basis of sulfated polysaccharides [
17,
24]. The results of this study demonstrated that our FNase S produces low-molecular weight galactofuco-oligosaccharides from fucoidan (actually a sulfated galactofucan). However, these results raise the questions on how bacteria that produce fucoidanase can take up dimer and larger oligosaccharides into the cytoplasmic space through the cell wall for use as nutrients. Additional studies of the catabolic cascade of MF and its oligomers are underway. In addition, mining and molecular cloning of corresponding genes for FNase S in the future would stimulate the applicability of this enzyme to the various industries for the development of new nutraceuticals, cosmeceuticals, as well as pharmaceuticals.
Table 6.
Fucoidan-degrading enzymes and their properties.
Table 6.
Fucoidan-degrading enzymes and their properties.
| Producing microorganism | MW (Da) | Habitat | Substrate | Cleaving pattern | Refs. |
|---|
| Cytophaga, Alteromonas, Pseudoalteromonas | n.d. | Intra-cellular | Fucoidan from Fucus evanescens, Laminaria cichorioides and Laminaria japonica | Exo | [21] |
| Dendryphiella arenaria | n.d. | Intra-cellular | Fucoidan from Fucus vesiculosus and Laminaria digitata | n.d. | [25] |
| Flavobacteriaceae | n.d. | Extra-cellular | Fucoidan from Pevetia canaliculata | Endo | [24] |
| Flavobacteriaceae | 67,000 | Extra-cellular | Fucoidan from Kjellmaniella crassifolia | Endo | [26] |
| Littorina kurila | n.d. | Intra-cellular | Fucoidan from Fucus distichus | Disaccharides | [27] |
| Pseudoalteromonas atlantica | n.d. | Extra-cellular | Fucoidan from brown seaweed | Exo | [28] |
| Patinopecten yessoensis | 85,000 | Intra-cellular | Fucoidan from Nemacystus decipieus | Endo | [20] |
| Pecten maximus | 200,000 | Extra-cellular | Fucoidan from Ascophyllum nodosum, | endo | [29] |
| Pecten maximus | n.d. | Intra-cellular | Fucoidan from Ascophyllum nodosum | Releases l-fucose | [30] |
| Pecten maximus | n.d. | Intra-cellular | Sulfated l-fucopyranoside | Sulfoesterase | [31] |
| Vibrio sp. N5 | 40,000–68,000 | Extra-cellular | Fucoidan from Kjellmaniella crassifolia | Endo | [18] |
| Fucophilus fucidanolyticus | n.d. | Intra-cellular | Fucoidan from Cladosiphon okamuranus | Endo | [26] |
| Gram-negative bacterium | 67,000 | Extra-cellular | Fucoidan from Kjellmaniella crassifolia | Endo | [32] |
| Sphingomonas paucimobilis PF-1 | ≥132,000 | Extra-cellular | Fucoidan from Undaria pinnatifida sporophyll | Endo | This study |
FNase S was incubated with 1% fucoidan for three days at 45 °C in 50 mM sodium acetate buffer (pH 5.6) containing 0.01% sodium azide. The reaction products were eluted with 50 mM sodium nitrate at a flow rate of 0.5 mL/min. Each fraction was monitored for carbohydrates with the phenol-H2SO4 method at 490 nm using l-fucose as a reference. The arrow indicates the void volume at which the unhydrolyzed fucoidan and hydrolyzed products with larger molecular masses (over approximately 5000 Da) reached the upper exclusion limit of the gels. Only major peaks (1 to 7) were collected and examined for their monosaccharide compositions with high performance anion-exchange chromatography with pulsed amperometric detection (HPAEC-PAD) analyses.


