Biochemical Markers for Assessing Aquatic Contamination

Abstract
:1. Introduction
2. Methods
2.1 Liver sample processing
2.2 Quantitative determination of cytochrome P450
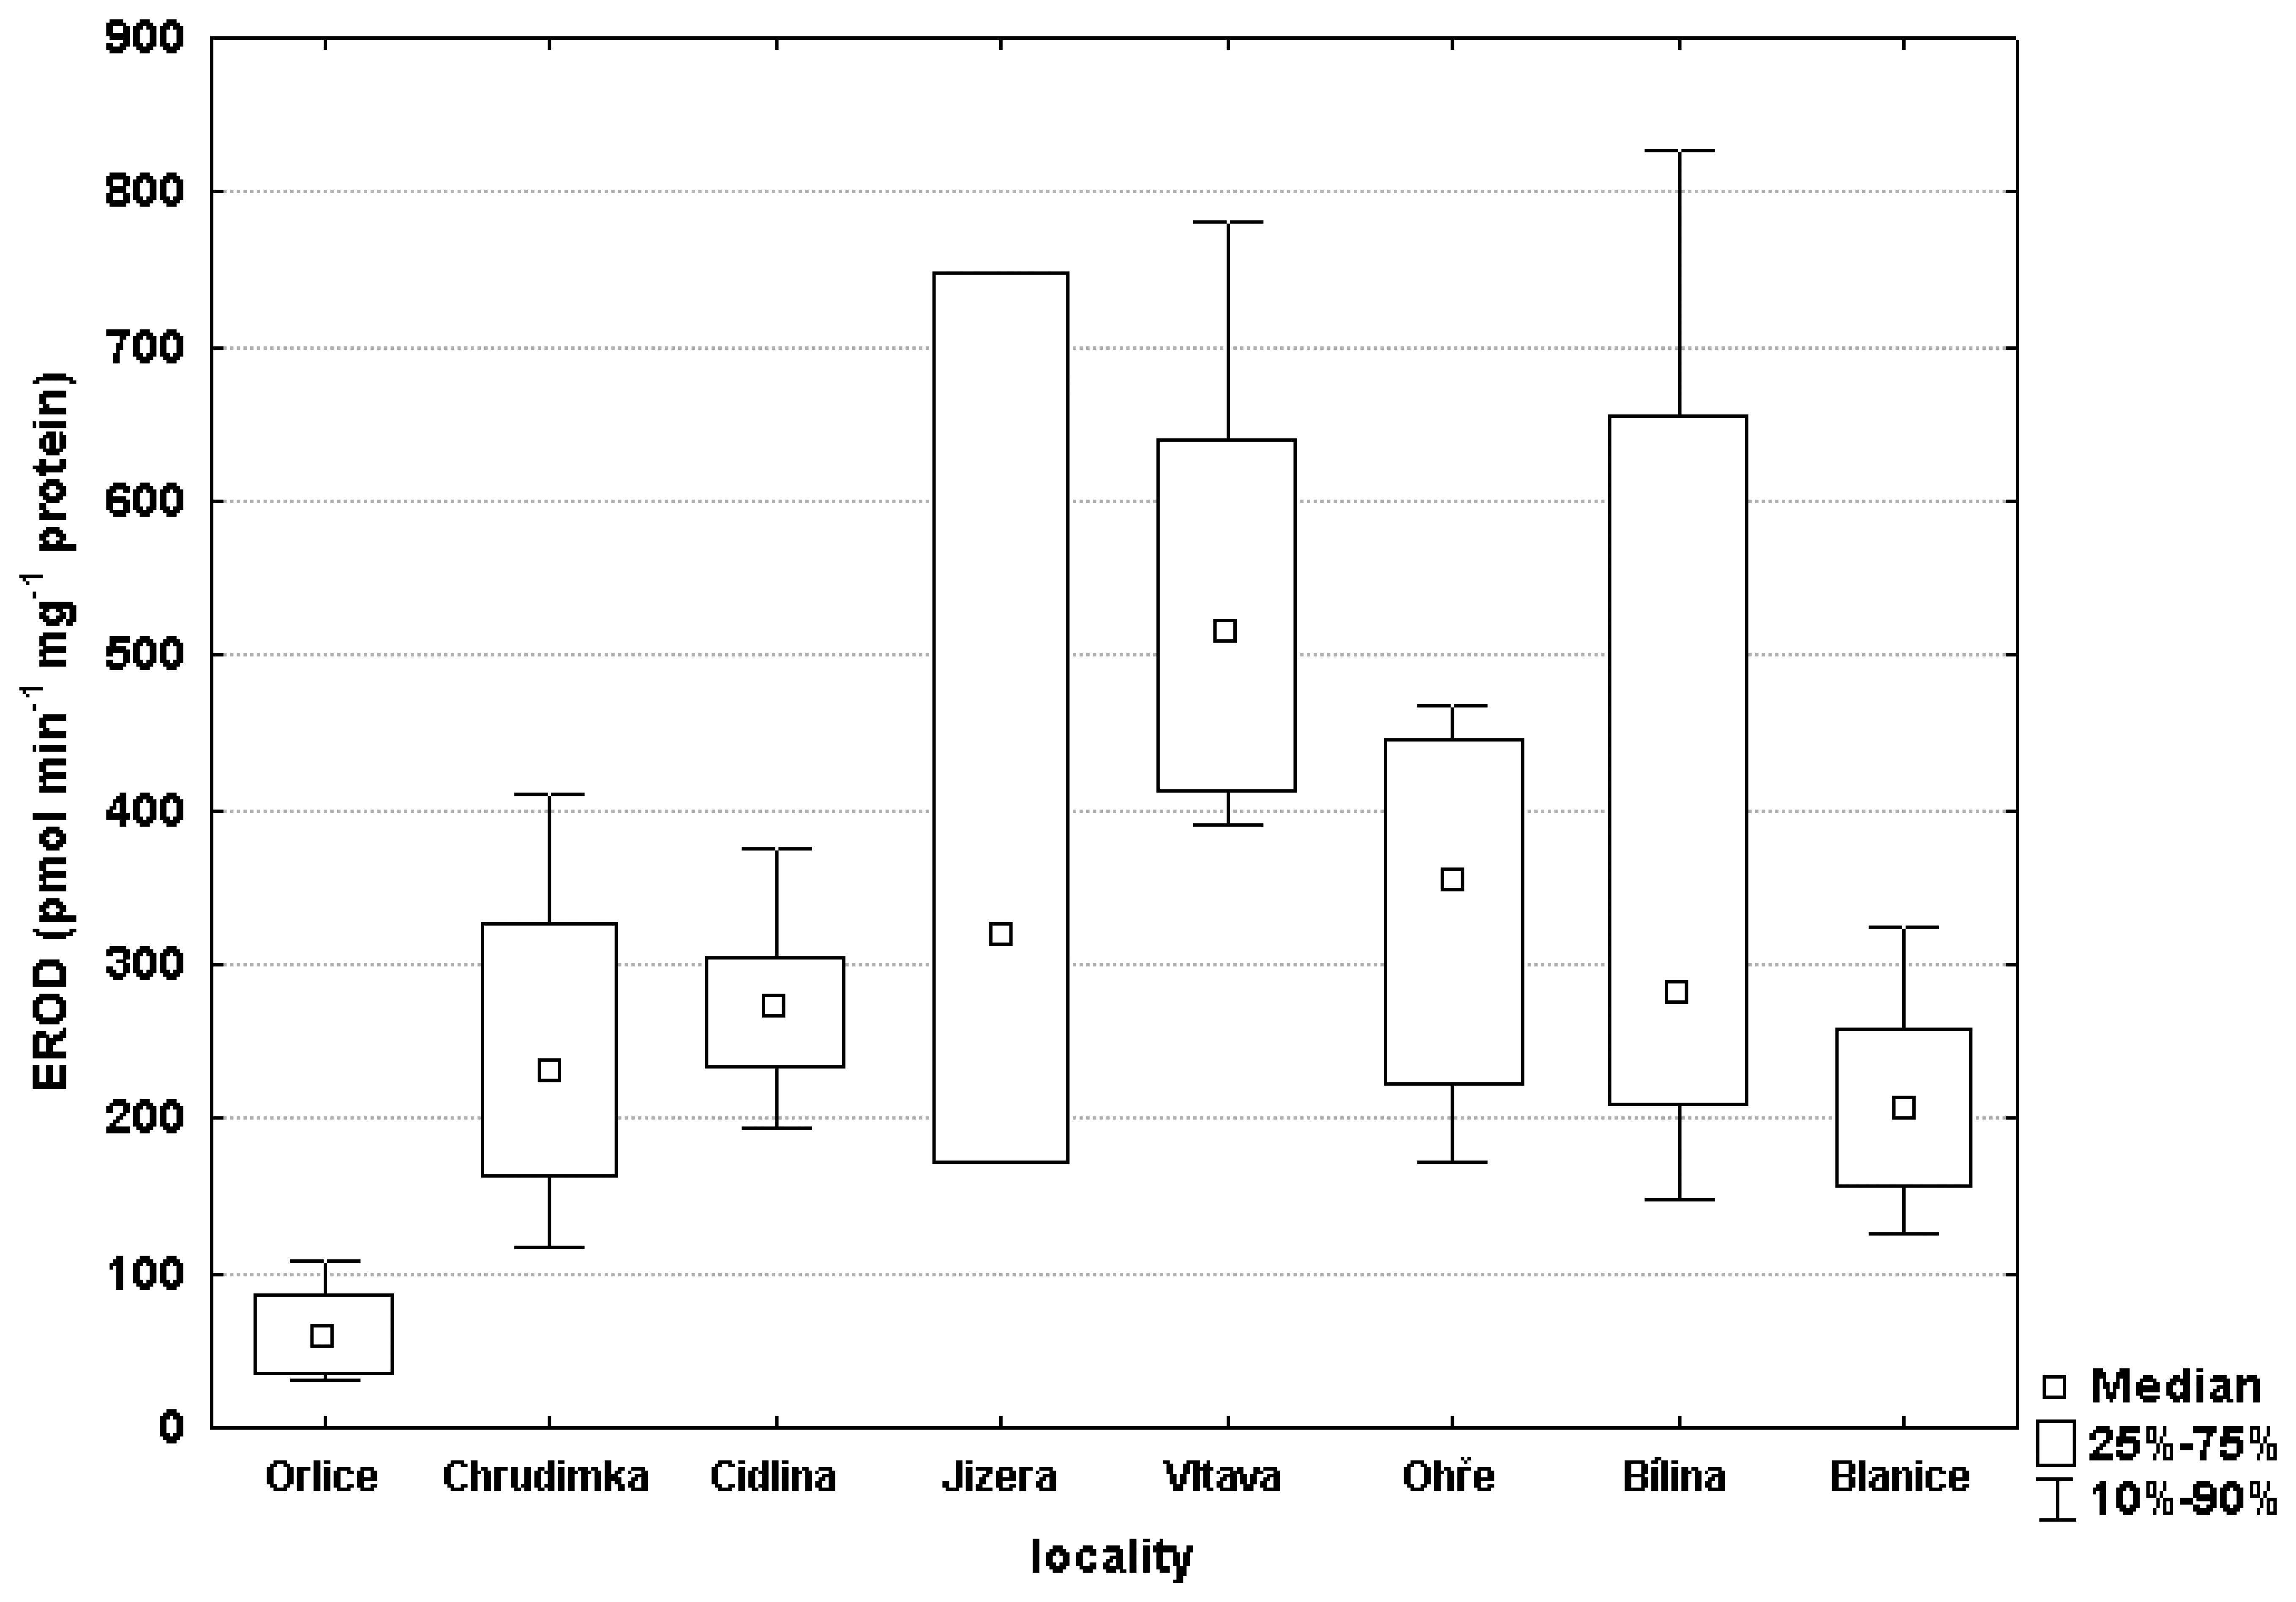
2.3 EROD activity determination
2.4 Determination of POPs in muscle samples
2.5 Statistical methods
3. Results
3.1 Macroscopic assessment of health status of fish
3.2 Biochemical markers
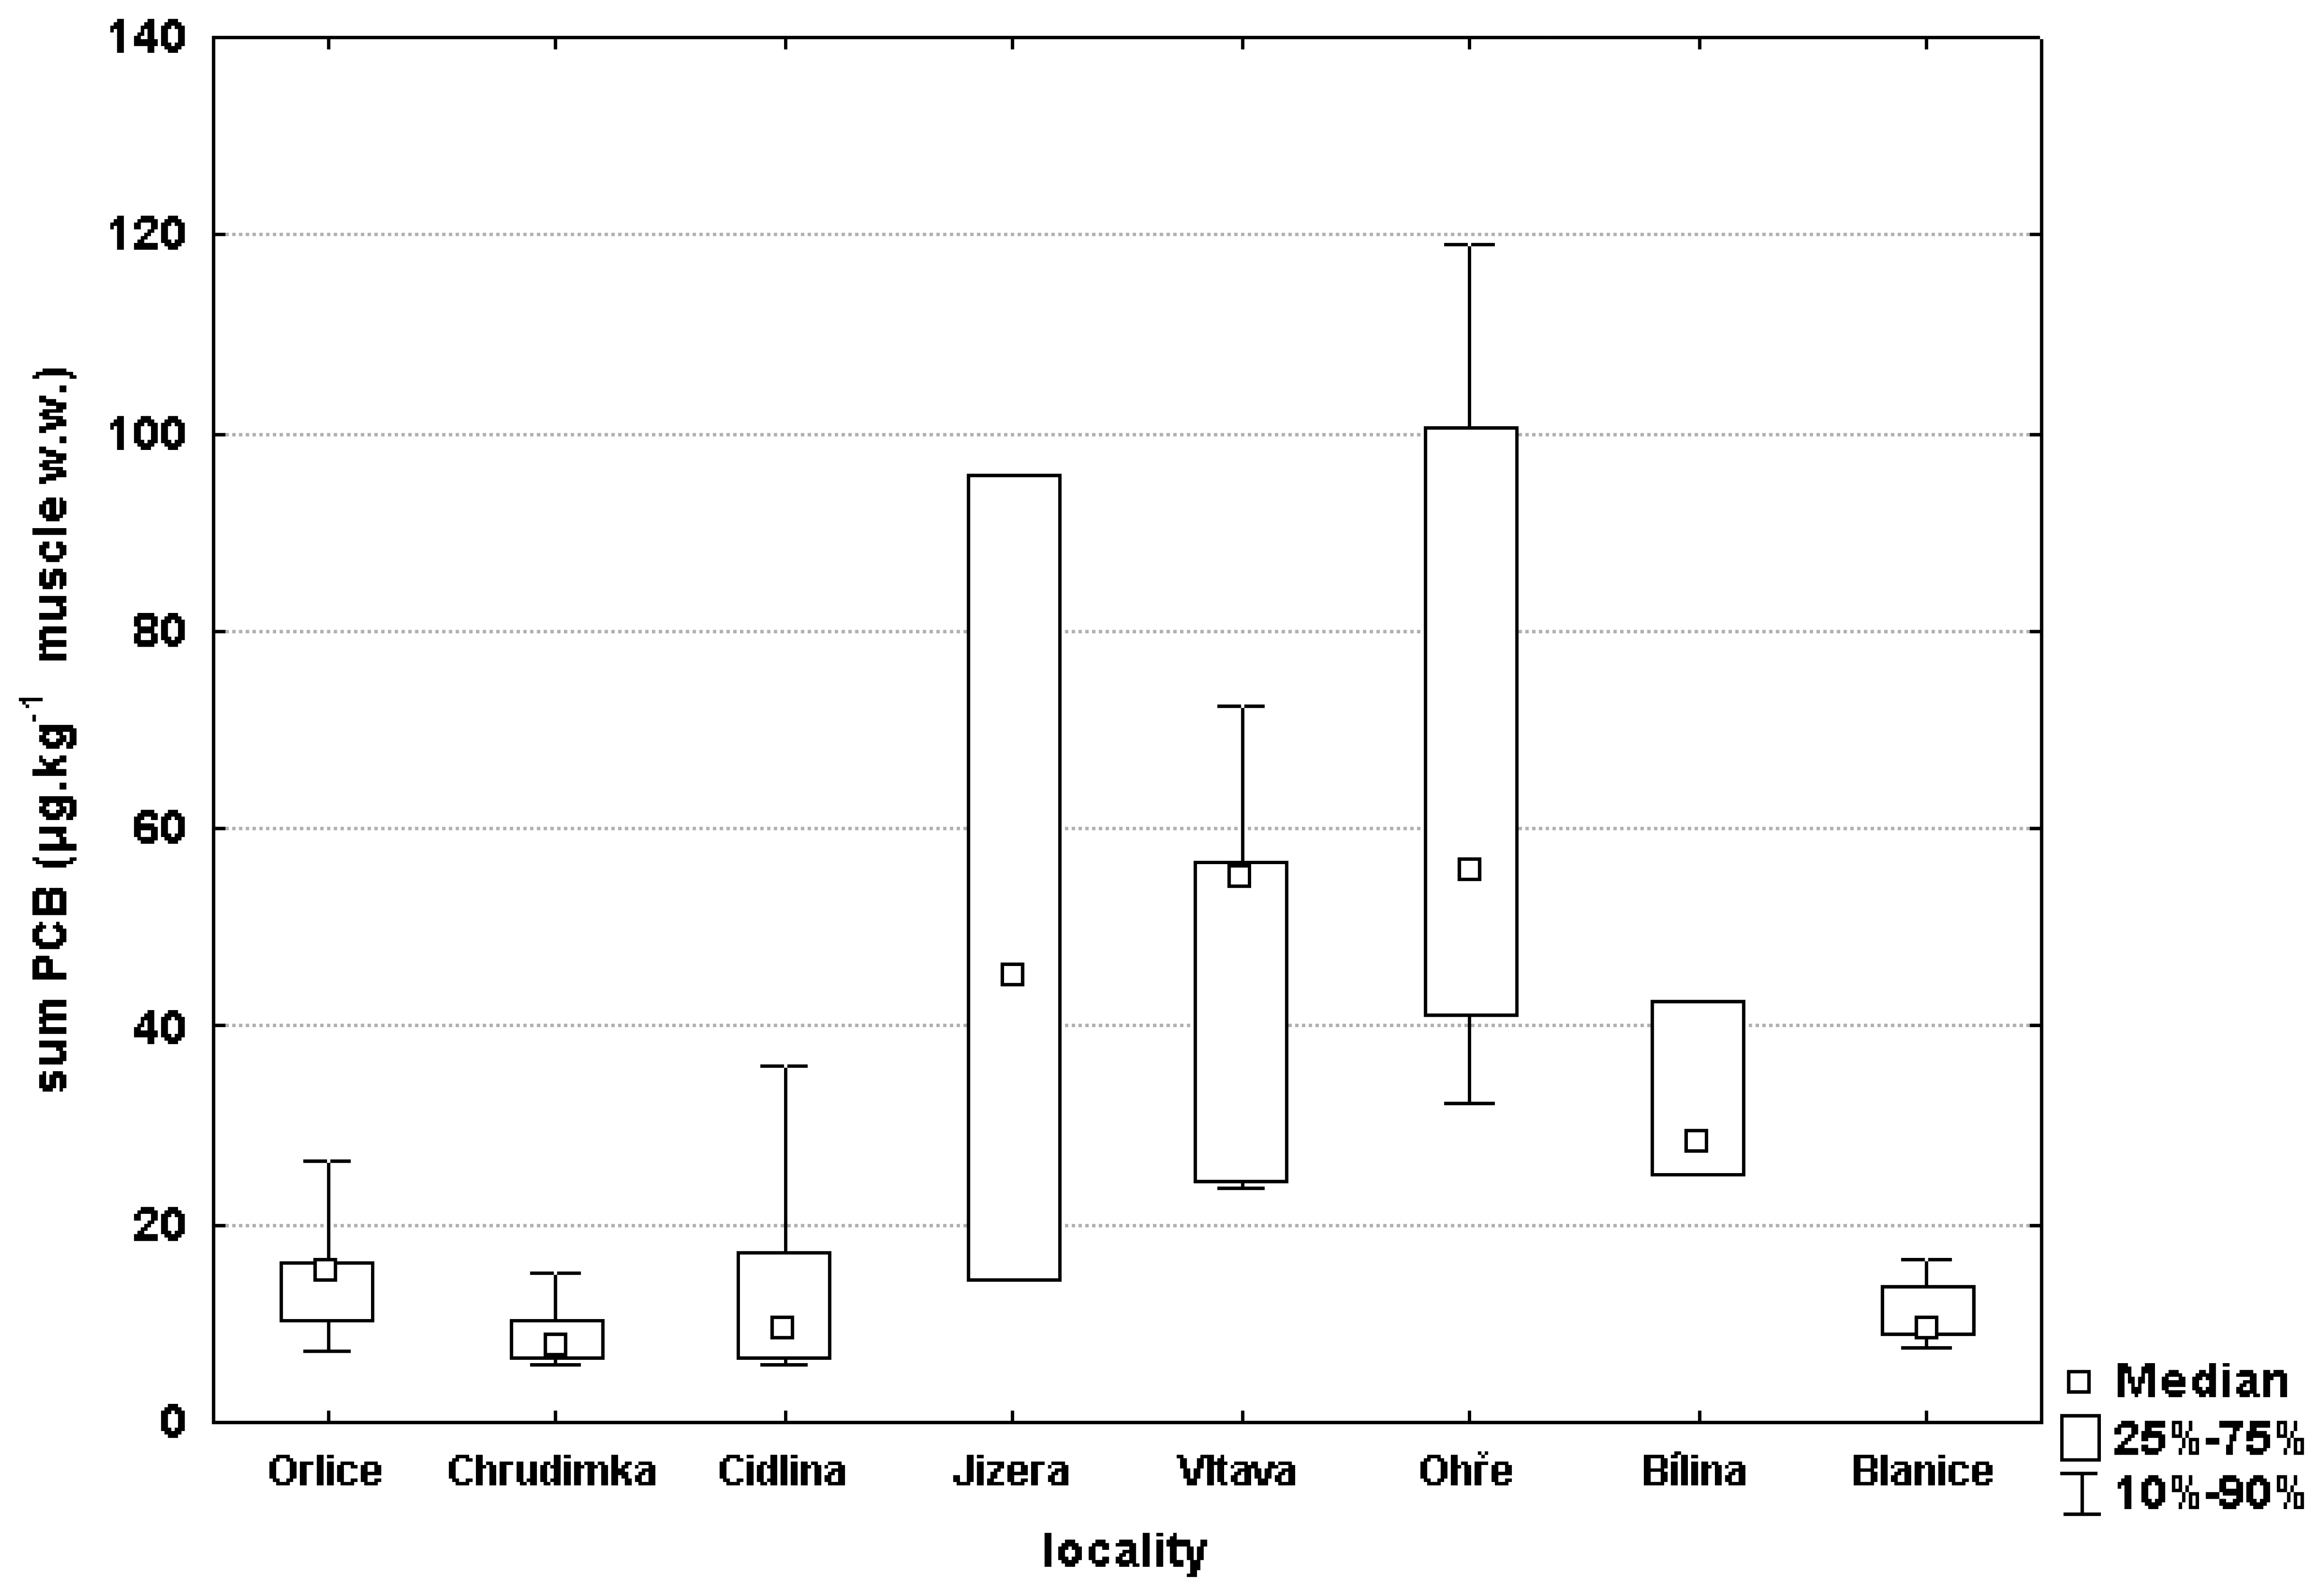
3.2 Chemical monitoring
3.3 Correlations between biochemical markers and pollutant concentrations
4. Discussion
5. Conclusion
Acknowledgments
References
- Payne, J.F.; Fancey, L.L.; Rahimtula, A.D.; Porter, E.L. Review and perspective on the use of mixed-function oxygenase enzymes in biological monitoring. Comp. Biochem. Physiol. Pt C 1987, 86, 233–245. [Google Scholar]
- Adams, M.S.; Ballin, U.; Gaumert, T.; Hale, B.W.; Kausch, H.; Kruse, R. Monitoring selected indicators of ecological change in the Elbe River since the fall of the Iron Curtain. Environ. Conserv. 2001, 28, 333–344. [Google Scholar]
- Hecker, M.; Sanderson, J.T.; Karbe, L. Suppression of aromatase activity in populations of bream (Abramis brama) from the River Elbe, Germany. Chemosphere 2007, 66, 542–552. [Google Scholar]
- Randak, T.; Zlabek, V.; Kolarova, J.; Svobodova, Z.; Hajslova, J.; Siroka, Z.; Janska, M.; Pulkrabova, J.; Cajka, T.; Jarkovsky, J. Biomarkers detected in chub (Leuciscus cephalus L.) to evaluate contamination of the Elbe and Vltava Rivers, Czech Republic. B. Environ. Contam. Tox. 2006, 76, 233–241. [Google Scholar]
- Siroka, Z.; Krijt, J.; Randak, T.; Svobodova, Z.; Peskova, G.; Fuksa, J.; Hajslova, J.; Jarkovsky, J.; Janska, M. Organic pollutant contamination of the River Elbe as assessed by biochemical markers. Acta Vet. BRNO 2005, 74, 293–303. [Google Scholar]
- Stachel, B.; Ehrhorn, U.; Heemken, O.P.; Lepom, P.; Reincke, H.; Sawal, G.; Theobald, N. Xenoestrogens in the River Elbe and its tributaries. Environ. Pollut. 2003, 124, 497–507. [Google Scholar]
- Zlabek, V.; Svobodova, Z.; Randak, T.; Valentova, O. Mercury content in the muscle of fish from the Elbe River and its tributaries. Czech J. Anim. Sci. 2005, 50, 528–534. [Google Scholar]
- Jung, D.K.J.; Klaus, T.; Fent, K. Cytochrome P450 induction by nitrated polycyclic aromatic hydrocarbons, azaarenes, and binary mixtures in fish hepatoma cell line PLHC-1. Environ. Toxicol. Chem. 2001, 20, 149–159. [Google Scholar]
- van der Oost, R.; Beyer, J.; Vermeulen, N.P.E. Fish bioaccumulation and biomarkers in environmental risk assessment: a review. Environ. Toxicol. Pharm. 2003, 13, 57–149. [Google Scholar]
- White, R.D.; Shea, D.; Stegeman, J.J. Metabolism of the aryl hydrocarbon receptor agonist 3,3',4,4'tetrachlorobiphenyl by the marine fish scup (Stenotomus chrysops) in vivo and in vitro. Drug Metab. Dispos. 1997, 25, 564–572. [Google Scholar]
- Malins, D.C.; McCain, B.B.; Brown, D.W.; Chan, S.L.; Myers, M.S.; Landahl, J.T.; Prohaska, P.G.; Friedman, A.J.; Rhodes, L.D.; Burrows, D.G.; Gronlund, W.D.; Hodgins, H.O. Chemical-pollutants in sediments and diseases of bottom-dwelling fish in Puget Sound, Washington. Environ. Sci. Technol. 1984, 18, 705–713. [Google Scholar]
- Anzenbacherova, E.; Anzenbacher, P. Cytochromy P450 a metabolismus xenobiotik. Bull. Ceske Spol. Biochem. Mol. Biol. 1999, 1, 4–33. [Google Scholar]
- Flammarion, P.; Devaux, A.; Nehls, S.; Migeon, B.; Noury, P.; Garric, J. Multibiomarker responses in fish from the Moselle River (France). Ecotox. Environ. Safe. 2002, 51, 145–153. [Google Scholar]
- Koehler, H.R.; Sandu, C.; Scheil, V.; Nagy-Petrica, E.M.; Segner, H.; Telcean, I.; Stan, G.; Triebskorn, R. Monitoring pollution in River Mures, Romania, Part III: biochemical effect markers in fish and integrative reflection. Environ. Monit. Assess. 2007, 127, 47–54. [Google Scholar]
- Lowry, O.H.; Rosebrough, N.J.; Farr, A.L.; Randall, R.J. Protein measurement with the Folin phenol reagent. J. Biol. Chem. 1951, 193, 265–275. [Google Scholar]
- Hajslova, J.; Schoula, R.; Holadova, K.; Poustka, J. Analysis of PCBs in biotic matrices by 2-dimensional GC-ECD. Int. J. Environ. An. Ch. 1995, 60, 163–173. [Google Scholar]
- Goksoyr, A.; Forlin, L. The cytochrome P-450 system in fish, aquatic toxicology and environmental monitoring. Aquat. Toxicol. 1992, 22, 287–311. [Google Scholar]
- Mayon, N.; Bertrand, A.; Leroy, D.; Malbrouck, C.; Mandiki, S.N.M.; Silvestre, F.; Goffart, A.; Thome, J.P.; Kestemont, P. Multiscale approach of fish responses to different types of environmental contaminations: A case study. Sci. Total Environ. 2006, 367, 715–731. [Google Scholar]
- Al-Arabi, S.A.M.; Adolfsson-Erici, M.; Waagbo, R.; Ali, M.S.; Goksoyr, A. Contaminant accumulation and biomarker responses in caged fish exposed to effluents from anthropogenic sources in the Karnaphuly River, Bangladesh. Environ. Toxicol. Chem. 2005, 24, 1968–1978. [Google Scholar]
- Behrens, A.; Segner, H. Cytochrome P4501A induction in brown trout exposed to small streams of an urbanised area: results of a five-year-study. Environ. Pollut. 2005, 136, 231–242. [Google Scholar]
- Broeg, K.; Zander, S.; Diamant, A.; Korting, W.; Kruner, G.; Paperna, I.; von Westernhagen, H. The use of fish metabolic, pathological and parasitological indices in pollution monitoring - 1. North Sea. Helgoland Mar. Res. 1999, 53, 171–194. [Google Scholar]
- Jedamskigrymlas, J.; Kammann, U.; Tempelmann, A.; Karbe, L.; Siebers, D. Biochemical responses and environmental contaminants in breams (Abramis-brama L) caught in the River Elbe. Ecotox. Environ. Safe. 1995, 31, 49–56. [Google Scholar]
- Jedamskigrymlas, J.; Lange, U.; Siebers, D.; Karbe, L. Induction of the hepatic biotransformation system of golden ide [Leuciscus-idus (L)] after exposure in the River Elbe. Ecotox. Environ. Safe. 1994, 28, 35–42. [Google Scholar]
- Heinisch, E.; Kettrup, A.; Bergheim, W.; Holoubek, I.; Wenzel, S. PCB in aquatic ecosystems of the river Elbe and Berlin waters - Source oriented monitoring. Fresen. Environ. Bull. 2003, 12, 103–110. [Google Scholar]
- Breivik, K.; Sweetman, A.; Pacyna, J.M.; Jones, K.C. Towards a global historical emission inventory for selected PCB congeners - A mass balance approach. 3. An update. Sci. Total Environ. 2007, 377, 296–307. [Google Scholar]
- Kitamura, S.; Yoshida, M.; Sugihara, K.; Ohta, S. Reductive dechlorination of p,p '-DDT mediated by hemoproteins in the hepatopancreas and blood of goldfish, Carassius auratus. J. Health Sci. 1999, 45, 217–221. [Google Scholar]
- Ackermann, G.E.; Brombacher, E.; Fent, K. Development of a fish reporter gene system for the assessment of estrogenic compounds and sewage treatment plant effluents. Environ. Toxicol. Chem. 2002, 21, 1864–1875. [Google Scholar]
- Toppari, J.; Larsen, J.C.; Christiansen, P.; Giwercman, A.; Grandjean, P.; Guillette, L.J.; Jegou, B.; Jensen, T.K.; Jouannet, P.; Keiding, N.; Leffers, H.; McLachlan, J.A.; Meyer, O.; Muller, J.; RajpertDeMeyts, E.; Scheike, T.; Sharpe, R.; Sumpter, J.; Skakkebaek, N.E. Male reproductive health and environmental xenoestrogens. Environ. Health Perspect. 1996, 104, 741–803. [Google Scholar]
- Leanos-Castaneda, O.; Van Der Kraak, G.; Rodriguez-Canul, R.; Gold, G. Endocrine disruption mechanism of o,p'-DDT in mature male tilapia (Oreochromis niloticus). Toxicol. Appl. Pharm. 2007, 221, 158–167. [Google Scholar]
- Metcalfe, T.L.; Metcalfe, C.D.; Kiparissis, Y.; Niimi, A.J.; Foran, C.M.; Benson, W.H. Gonadal development and endocrine responses in Japanese medaka (Oryzias latipes) exposed to o,p '-DDT in water or through maternal transfer. Environ. Toxicol. Chem. 2000, 19, 1893–1900. [Google Scholar]
- Nims, R.W.; Lubet, R.A.; Fox, S.D.; Jones, C.R.; Thomas, P.E.; Reddy, A.B.; Kocarek, T.A. Comparative pharmacodynamics of CYP2B induction by DDT, DDE, and DDD in male rat liver and cultured rat hepatocytes. J. Toxicol. Env. Health Pt A 1998, 53, 455–477. [Google Scholar]
- Gonzalez, A.; Piferrer, F. Aromatase activity in the European sea bass (Dicentrarchus labrax L.) brain. Distribution and changes in relation to age, sex, and the annual reproductive cycle. Gen. Comp. Endocr. 2003, 132, 223–230. [Google Scholar]
- Bailey, R.E. Global hexachlorobenzene emissions. Chemosphere 2001, 43, 167–182. [Google Scholar]
- Heinisch, E.; Kettrup, A.; Bergheim, W.; Martens, D.; Wenzel, S. Persistent chlorinated hydrocarbons (PCHC), source-oriented monitoring in aquatic media. 4. The chlorobenzenes. Fresen. Environ. Bull. 2006, 15, 148–169. [Google Scholar]
- Luckas, B.; Oehme, M. Characteristic contamination levels for polychlorinated hydrocarbons, dibenzofurans and dibenzo-para-dioxins in bream (Abramis brama) from the River Elbe. Chemosphere 1990, 21, 79–89. [Google Scholar]
- Oxynos, K.; Schramm, K.W.; Marth, P.; Schmitzer, J. Chlorinated hydrocarbons (CHC) and PCDD/F-levels in sediments and breams (Abramis-brama) from the River Elbe (A contribution to the German Environmental Specimen Banking). Fresenius J. Anal. Chem. 1995, 353, 98–100. [Google Scholar]
- Marth, P.; Oxynos, K.; Schmitzer, J.; Schramm, K.W.; Kettrup, A. Levels of chlorinated hydrocarbons (CHC) in breams (Abramis brama) from the River Elbe (A contribution to the Federal Environmental Specimen Bank). Chemosphere 1997, 34, 2183–2192. [Google Scholar]
- Bester, K.; Biselli, S.; Ellerichmann, T.; Huhnerfuss, H.; Moller, K.; Rimkus, G.; Wolf, M. Chlorostyrenes in fish and sediment samples from the River Elbe. Chemosphere 1998, 37, 2459–2471. [Google Scholar]
- Deboer, J.; Vandervalk, F.; Kerkhoff, M.A.T.; Hagel, P.; Brinkman, U.A.T. 8-year study on the elimination of PCBs and other organochlorine compounds from eel (Anguilla-anguilla) under natural conditions. Environ. Sci. Technol. 1994, 28, 2242–2248. [Google Scholar]
- Ferrante, M.C.; Cirillo, T.; Naso, B.; Clausi, M.T.; Lucisano, A.; Cocchieri, R.A. Polychlorinated biphenyls and organochlorine pesticides in seafood from the Gulf of Naples (Italy). J. Food Protect. 2007, 70, 706–715. [Google Scholar]
- Vorkamp, K.; Riget, F.; Glasius, M.; Pecseli, M.; Lebeuf, M.; Muir, D. Chlorobenzenes, chlorinated pesticides, coplanar chlorobiphenyls and other organochlorine compounds in Greenland biota. Sci. Total Environ. 2004, 331, 157–175. [Google Scholar]
- Yang, N.Q.; Matsuda, M.; Kawano, M.; Wakimoto, T. PCBs and organochlorine pesticides (OCPs) in edible fish and shellfish from China. Chemosphere 2006, 63, 1342–1352. [Google Scholar]


| Location | (n) | Weight (g) mean±SD | Age (years) (mean of the total) (min-max) |
|---|---|---|---|
| ORLICE | 6 | 323±39 | 3.8 (3–4) |
| CHRUDIMKA | 10 | 180±11 | 3.2 (3–4) |
| CIDLINA | 9 | 238±53 | 3.7 (2–5) |
| JIZERA | 3 | 377±189 | 4.0 (3–5) |
| VLTAVA | 7 | 290±30 | 3.3 (3–4) |
| OHŘE | 10 | 541±64 | 4.8 (3–7) |
| BÍLINA | 10 | 121±18 | 2.3 (2–3) |
| BLANICE (control location) | 10 | 339±39 | 4.8 (3–6) |
| LOCATION | PCB* | DDT** | HCB | HCH*** | OCS |
|---|---|---|---|---|---|
| ORLICE | 15.1±2.66 | 10.6±1.54 | 1.51±0.23 | 0.31±0.1 | 0.028±0.004 |
| CHRUDIMKA | 9.1±1.18 | 13.0±1.27 | 1.57±0.10 | 0.22±0.04 | 0.041±0.003 |
| CIDLINA | 13.7±3.24 | 8.1±1.67 | 0.52±0.05 | 0.45±0.10 | 0.072±0.02 |
| JIZERA | 51.9±23.73 | 23.2±10.21 | 1.22±0.36 | 0.20±0.02 | 0.24±0.13 |
| VLTAVA | 46.1±7.11 | 25.1±3.23 | 1.55±0.19 | 0.21±0.03 | 0.12±0.02 |
| OHŘE | 68.6±10.95 | 44.0±5.51 | 2.82±0.38 | 0.56±0.21 | 0.46±0.23 |
| BÍLINA | 31.9±2.92 | 14.4±1.73 | 2.93±0.38 | 0.32±0.01 | 0.10±0.02 |
| BLANICE (control location) | 10.8±1.06 | 35.0±4.09 | 1.75±0.20 | 0.18±0.03 | 0.03±0.008 |
© 2007 by MDPI ( http://www.mdpi.org). Reproduction is permitted for noncommercial purposes.
Share and Cite
Havelková, M.; Randák, T.; Žlábek, V.; Krijt, J.; Kroupová, H.; Pulkrabová, J.; Svobodová, Z. Biochemical Markers for Assessing Aquatic Contamination. Sensors 2007, 7, 2599-2611. https://doi.org/10.3390/s7112599
Havelková M, Randák T, Žlábek V, Krijt J, Kroupová H, Pulkrabová J, Svobodová Z. Biochemical Markers for Assessing Aquatic Contamination. Sensors. 2007; 7(11):2599-2611. https://doi.org/10.3390/s7112599
Chicago/Turabian StyleHavelková, Marcela, Tomáš Randák, Vladimír Žlábek, Jan Krijt, Hana Kroupová, Jana Pulkrabová, and Zdeňka Svobodová. 2007. "Biochemical Markers for Assessing Aquatic Contamination" Sensors 7, no. 11: 2599-2611. https://doi.org/10.3390/s7112599
APA StyleHavelková, M., Randák, T., Žlábek, V., Krijt, J., Kroupová, H., Pulkrabová, J., & Svobodová, Z. (2007). Biochemical Markers for Assessing Aquatic Contamination. Sensors, 7(11), 2599-2611. https://doi.org/10.3390/s7112599