Article

Electrochemical Interrogation of Interactions between Surface-Confined DNA and Methylene Blue

Shanghai Institute of Applied Physics, Chinese Academy of Sciences, Shanghai 201800, China
*
Author to whom correspondence should be addressed.
Sensors 2007, 7(11), 2671-2680; https://doi.org/10.3390/s7112671
Submission received: 31 October 2007 / Accepted: 9 November 2007 / Published: 12 November 2007

Abstract

:
In this work, we reported a systematic investigation on the interactions between methylene blue (MB) and surface-confined DNA by using electrochemical methods. We demonstrated that the redox potential of MB and binding and dissociation kinetics of MB to DNA differed significantly for single-stranded DNA (ss-DNA) and double-stranded DNA (ds-DNA) immobilized on gold electrodes. This was possibly due to the different binding mechanism between MB and ss- or ds-DNA. This work might provide useful information for developing MB-based sequence-specific electrochemical DNA sensors.

1. Introduction

DNA sensing is of great importance to early diagnostics of genetic deficiencies, detection of infectious diseases and individual identification in forensic analysis [1-7]. Because of this, a variety of DNA biosensors using optical (colorimetric, fluorescence Raman and surface plasmon resonance), acoustic (surface acoustic wave and quartz crystal microbalance) and electrochemical transducers have been developed toward sensitive, selective and rapid detection of clinically- or security- relevant target DNA [8-17].
Electrochemical techniques are well known to be rapid, miniaturizable, inexpensive and highly sensitive [18, 19], therefore electrochemical DNA sensors have significantly attracted both academic and industrial interest. As a result, a large amount of strategies have been proposed to convert DNA hybridization events to electrochemical signals. Methylene blue (MB), an aromatic heterocycle molecule, is often employed as an electrochemical “indicator” toward selective discrimination of single-stranded DNA (ss-DNA) and double-stranded DNA (ds-DNA). Previous spectroscopic investigations have demonstrated that MB binds to DNA through at least three different interactions, that is, electrostatic interaction between cationic MB and anionic DNA, intercalation of MB in the DNA double helix and preferential binding between MB and guanine bases. Possibly due to the existence of such complicated interactions, various MB-based DNA sensing strategies have been proposed and some reports existing in the literature are even seemingly contradictory. Ozsoz and coworkers reported that ss-DNA modified carbon electrodes produced large electrochemical signals for MB while hybridization led to significant signal attenuation [20]. In contrast, Ju et al reported a signal-on DNA sensor that showed apparent increase of MB redox signals after DNA detection [21]. Barton and coworkers developed a different DNA hybridization sensor that relied on the MB intercalation and efficient “wired” charge transfer through DNA double helix [22]. By using this elegant strategy they showed that this sensor was extremely sensitive to single-nucleotide mismatches.
In this work, we performed electrochemical investigation on the interactions between MB and DNA. Thiolated ss-DNA and ds-DNA were immobilized at gold electrodes via self-assembly and formed well-aligned DNA films [23, 24], which provided an ideal platform for studying both thermodynamics and kinetics of MB-DNA binding. We found that conformations of DNA at surfaces were critical for MB electrochemistry, which might account for the discrepancy in the literature. We also extensively studied the adsorption and desorption kinetics of MB on DNA strands. These studies are potentially useful for improving the performance of MB-based electrochemical DNA sensors.

2. Results and Discussion

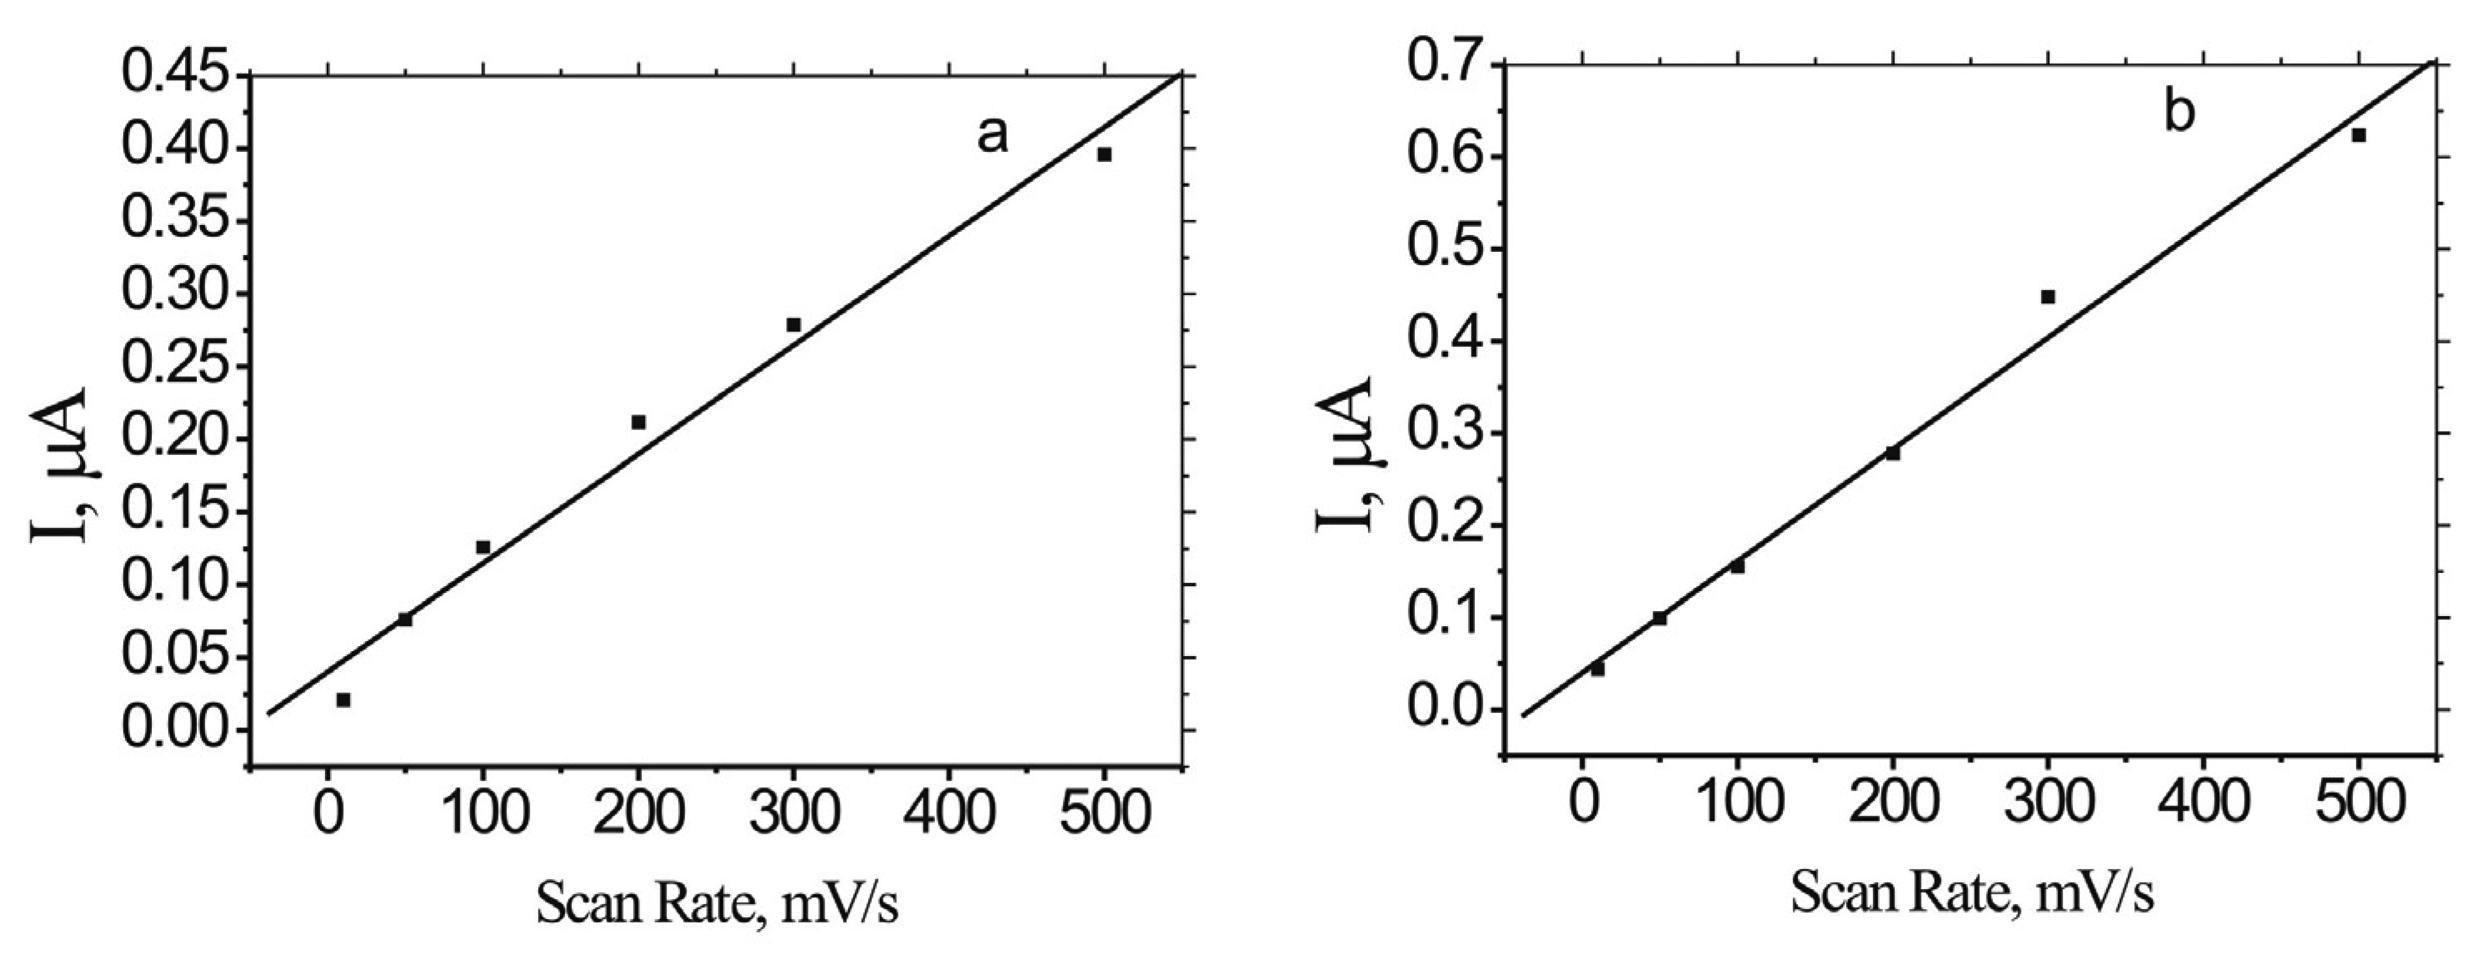
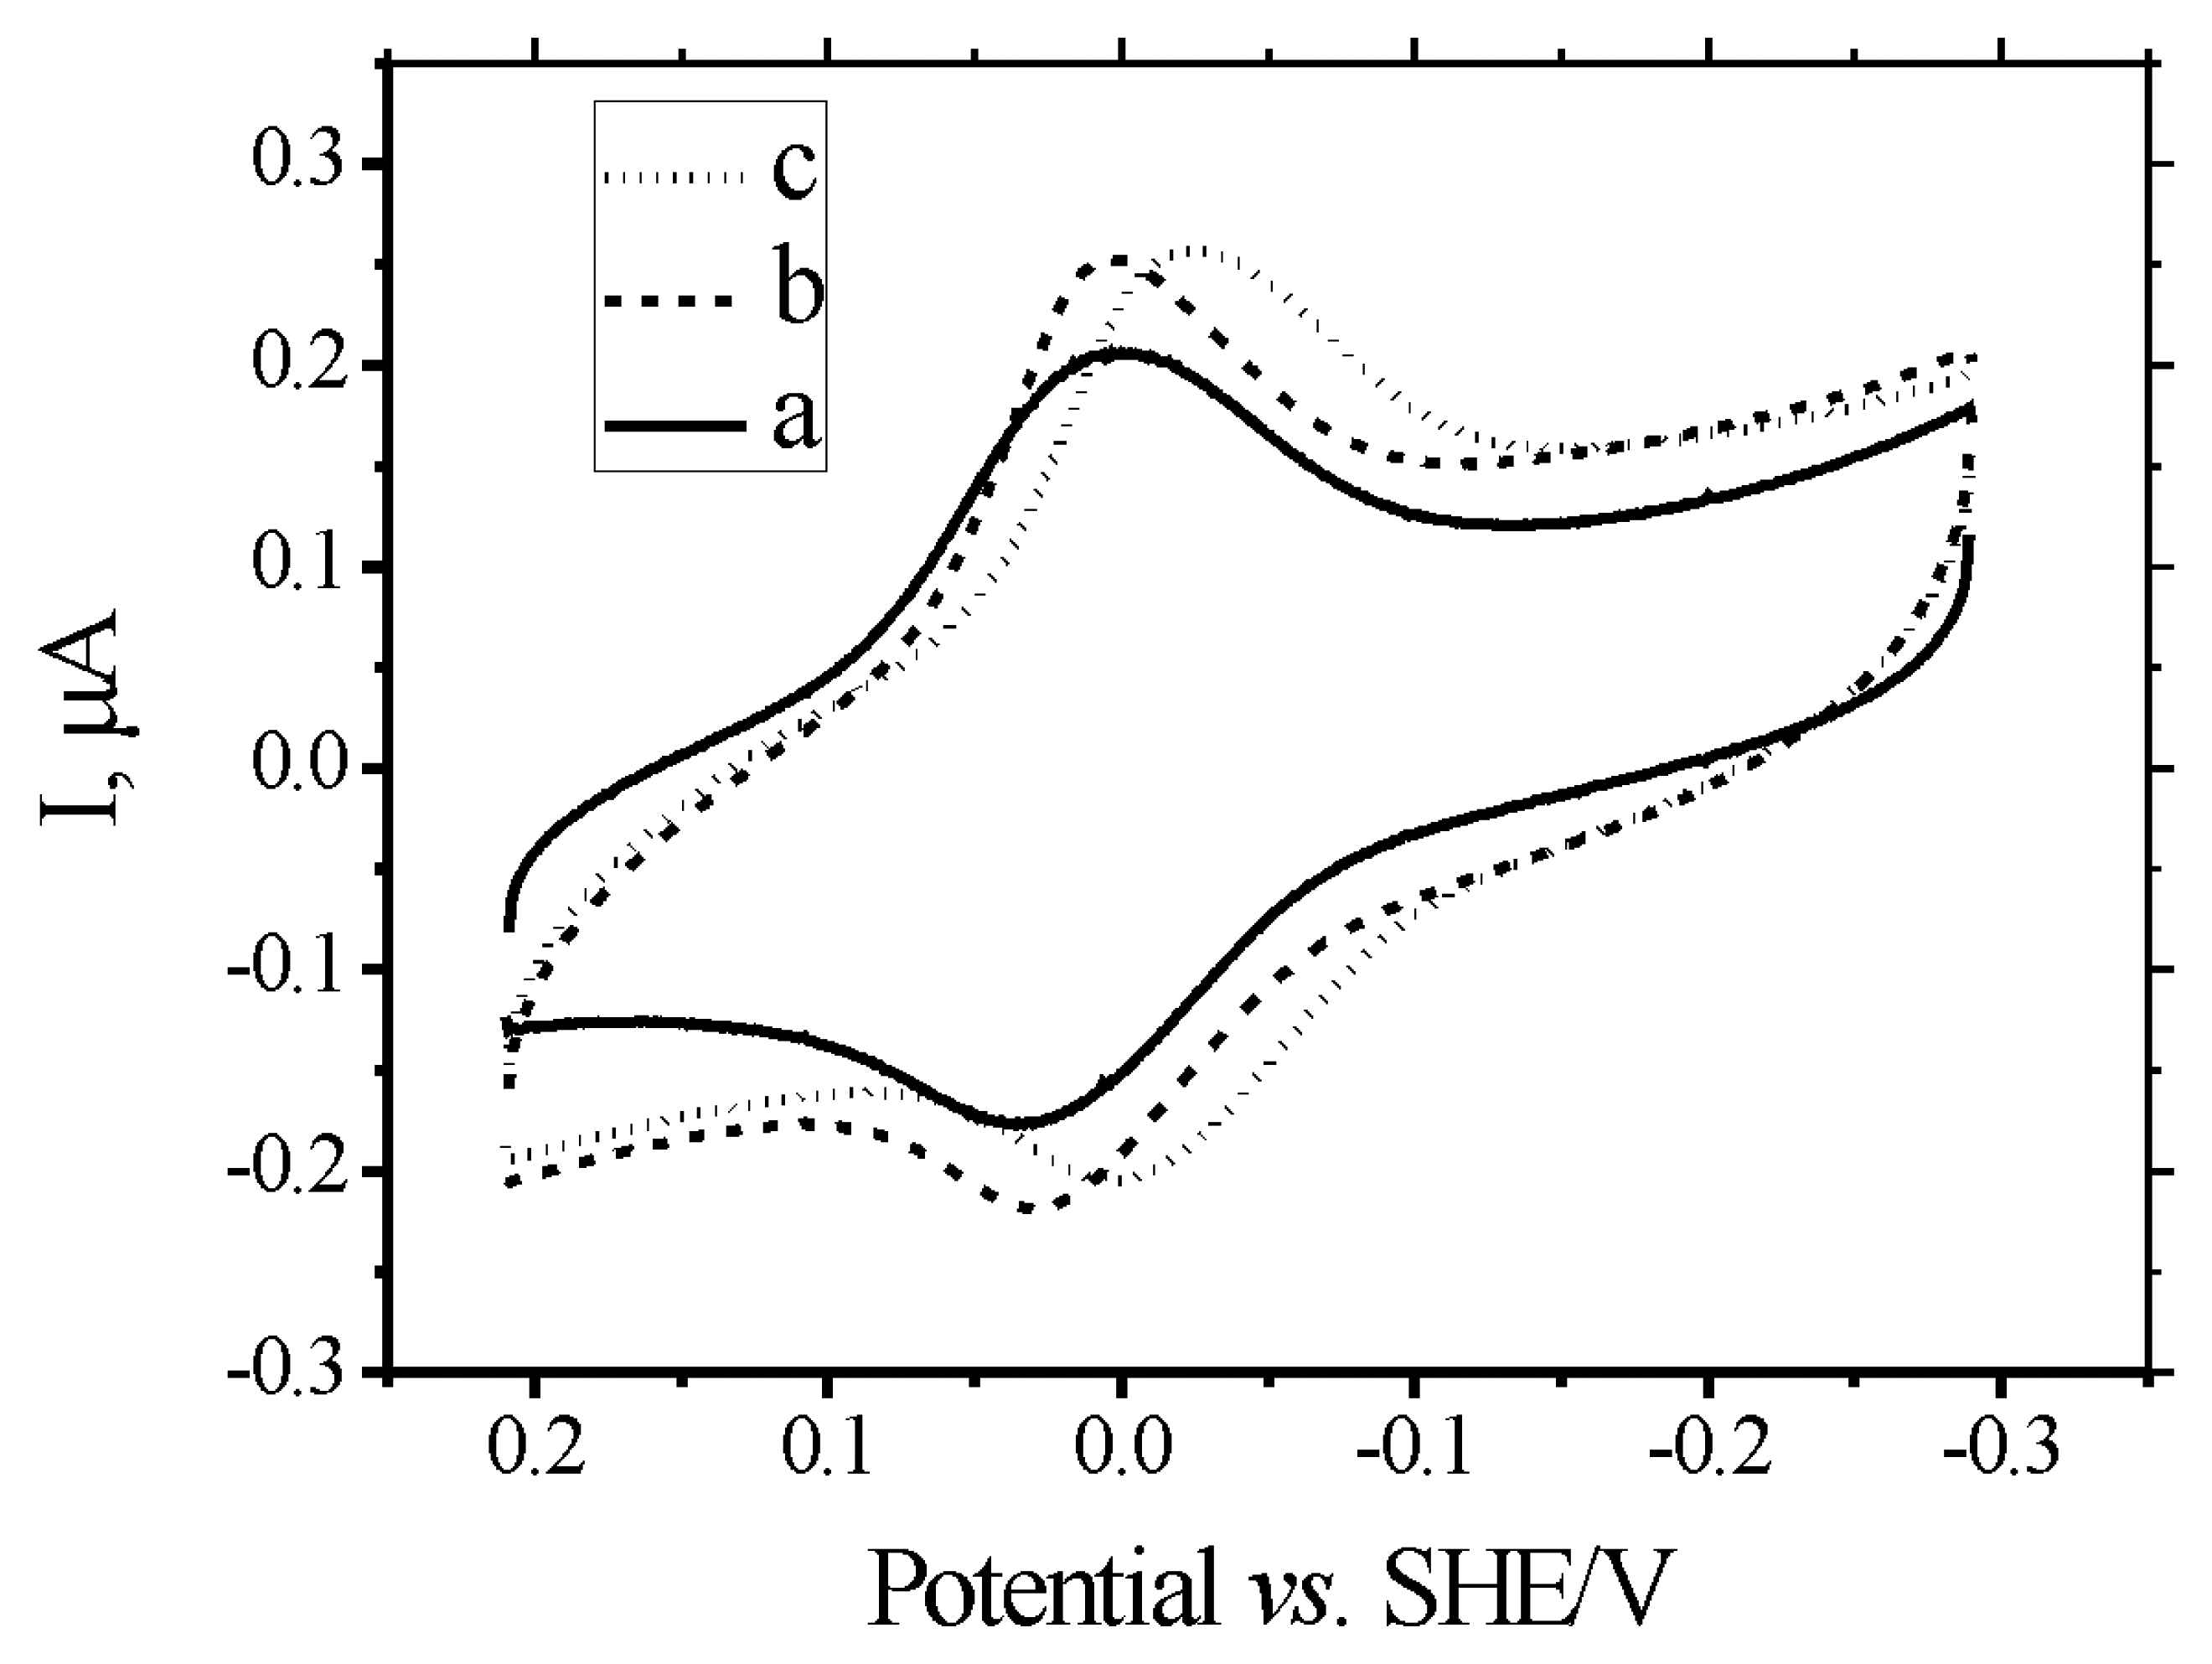
2.1. Electrochemistry of MB at DNA-modified gold electrodes

We first evaluated the electrochemistry of MB at electrodes modified with MCH, ss-DNA and ds-DNA (Figure 1). A pair of well-defined peaks appeared for all these three electrodes, corresponding to the reduction and oxidation of MB. The redox potentials of MB were nearly identical at the MCH and ss-DNA modified electrodes (E1/2-ss= 0.018 V vs. SHE). Interestingly, the redox potential shifted to the negative at ds-DNA modified electrodes (E1/2-ds= - 0.012 V vs. SHE), which suggested that MB binds more strongly to ds-DNA than to ss-DNA. Spectroscopic studies have shown that intercalation is the dominant mode of methylene blue interaction with ds-DNA [25]. These resulted in successive base pairs binding to MB face to face. On the other hand, MB interacts with ss-DNA by electrostatic binding process. The absence of base pairs and long–range structure in ss-DNA result in distinct environments for MB. Consequently, it is not surprising that the distinct redox potential was observed for MB bound to ss-DNA and ds-DNA.
We also compared peak currents of MB at ss-DNA and ds-DNA modified electrodes. We found that the peak current of MB at ds-DNA was slightly larger (∼ 20%) than at ss-DNA. This is in contrast to that in previously reports of Ozsoz and coworkers [20]. We think this phenomenon maybe attribute to the following reasons. In the report of Ozsoz, DNA lay down on electrode surfaces (Figure 2a, 2b). When ss-DNA was assembled on Au electrode as Figure 2a, a high MB reduction signal would be observed, because MB had a strong affinity for the guanine and could contact most guanines easily. But after the formation of DNA duplex (Figure 2b), the guanines were wrapped in the rigid duplex structure, thus preventing MB-guanines interactions. For example, guanine proximal to the electrode was almost inaccessible to MB. Also important, while MB could bind to MB distal to the electrode, the electron transfer of such MB molecules was slow because they had to overcome the axial distance of the duplex (∼ 2 nm). In contrast, we employed a system that assembled DNA to Au electrode in a vertical approach. When ss-DNA was assembled as Figure 2c, the MB could interact with the guanines easily even after the formation of DNA duplex (Figure 2d). Because the DNA duplex can be used as a electron transfer pathway [26, 27], the signal of MB reduction can be transported to the electrode. Therefore, DNA hybridization did not lead to the attenuation of MB redox currents in this configuration.
We then studied the electron-transfer properties of MB at both ss-DNA and ds-DNA modified electrodes. Peak currents (Ip) of MB were linearly proportional to scan rates at both ss-DNA and ds-DNA modified electrodes (Figure 3), which suggested that the MB electrochemistry was a surface-confined process and that MB was strongly adsorbed on DNA strands at gold electrodes [28].

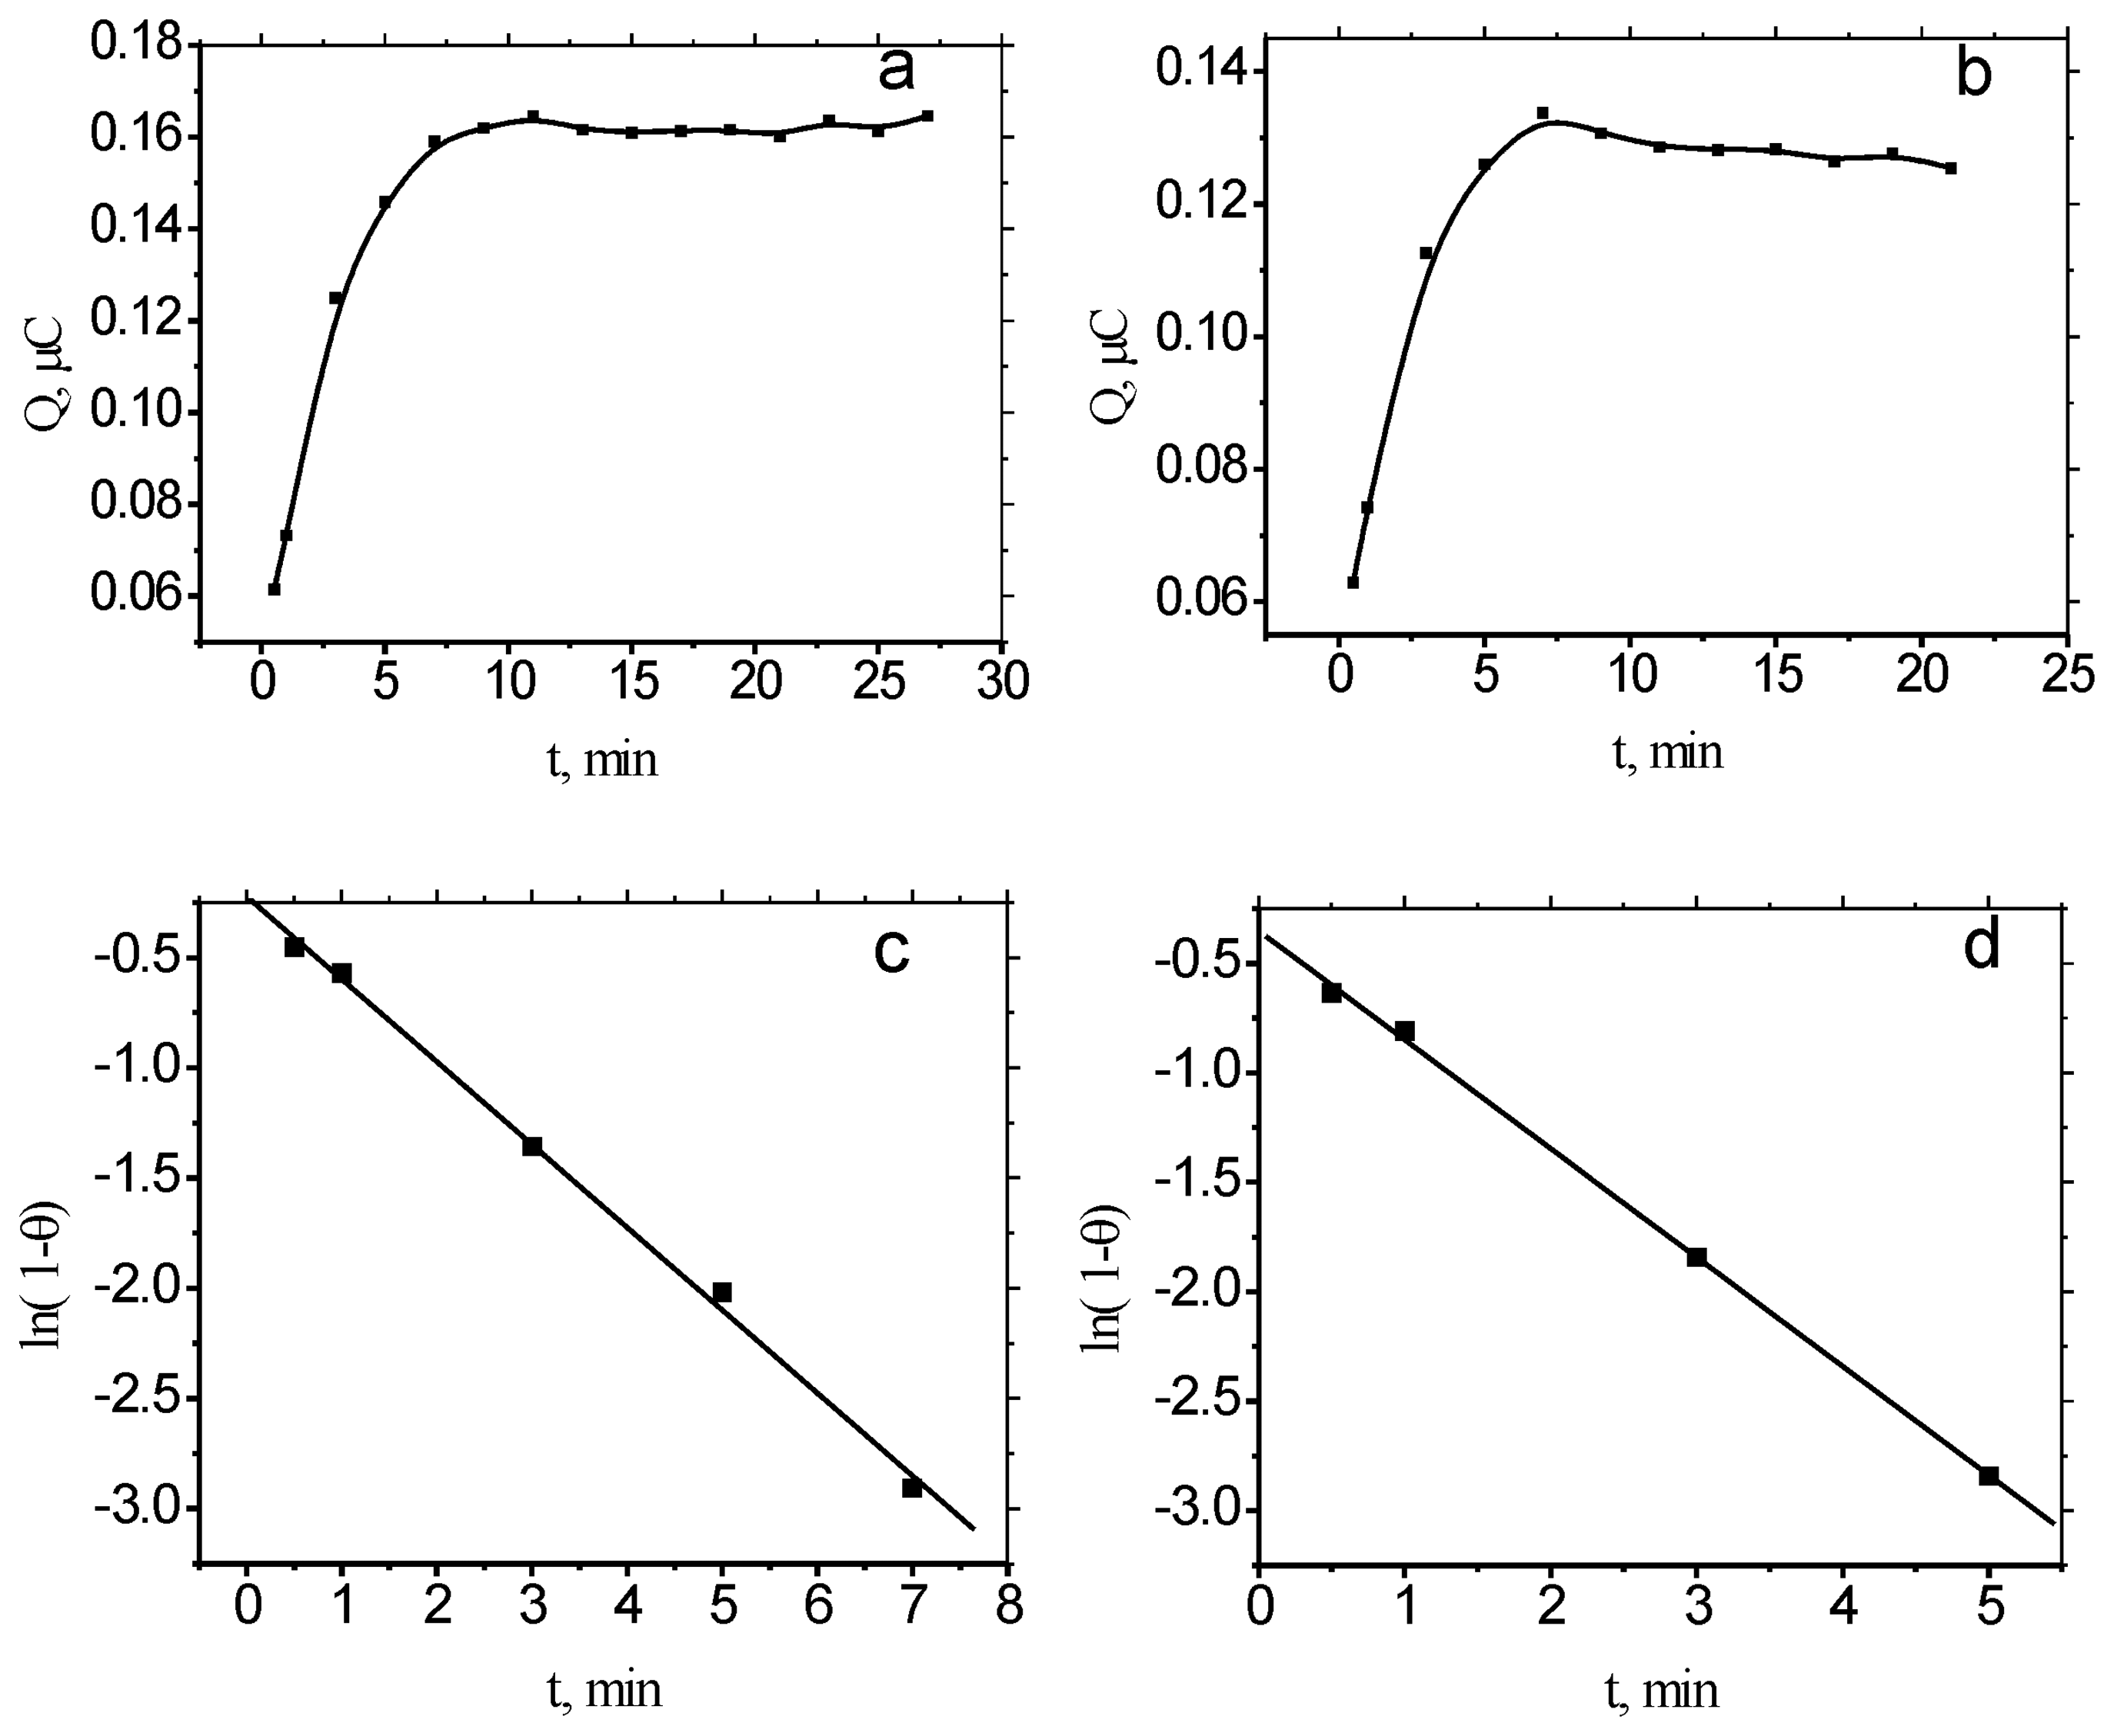
2.2. Binding equilibrium time of MB to ds-DNA/Au and ss-DNA/Au

With increasing incubation time of the ss-DNA/Au, and ds-DNA/Au electrodes in 3 μM MB solution, the peak currents of adsorb or bound MB increased and then reached steady values (Figure 4). The increase was attributed to the accumulation of MB at the electrode surface. The time that charges reached the steady values were different at ss-DNA/Au, and ds-DNA/Au. The increasement of charges at ss-DNA/Au and ds-DNA/Au electrodes reached equilibrium after 7 and 10 mins, respectively. The difference in equilibrium time was due to the different surface structures and accumulation mechanisms. The accumulation process of MB at ss-DNA at Au electrodes only involved the electrostatic binding of MB to ss-DNA. However, the binding of MB to ds-DNA also involved the intercalation process, which results in a slower equilibrium process.

2.3. Binding kinetics of MB to ds-DNA/Au and ss-DNA/Au

Since the surface quantity of MB can be readily determined by integration of the cathodic peak, we can quantitatively investigate the binding kinetics of MB with ss-DNA/Au and ds-DNA/Au. Assuming that the binding process can be described as
MB + DNA / Au k b k f MB - DNA / Au
As the solution concentration (C) of MB is more excessive, the solution concentration (C) of MB remains constant. On the other hand the backward dissociation process can be neglected before the equilibrium time, and then the equation 2 was derived.
ln ( 1 - θ ) = - k ' t + constant
where θ = Гt / Гs = Qt / Qs and = kfC.
In this expression, kf is the second-order binding rate constant, kb is the dissociation rate constant, is the apparent first-order rate constants for the interaction of MB with ss-DNA/Au and ds-DNA/Au. Гs is the saturation coverage of MB on the surface, and Гt is its coverage at any given time (t). Qt and Qs are the integrated charge of the cathodic peaks from the CV at any given time and the saturation situation, respectively.
Plots of ln (1-θ) versus t for a ds-DNA/Au (Figure 4) and ss-DNA/Au are linear up to 7 min and 5min, respectively, which is essentially in agreement with equation 2. The values of were 0.37 ± 0.05 and 0.49 ± 0.01 min-1, respectively, for the ds-DNA/Au and ss-DNA/Au electrodes at a solution concentration of 3 μM MB. The difference of indicates the different binding mode to ds-DNA and ss-DNA. Because of a course of intercalation for ds-DNA, its binding rate constant is smaller than ss-DNA. Of note, others reported analogous results for benzyl viologen to ds-DNA and ss-DNA [29, 30].

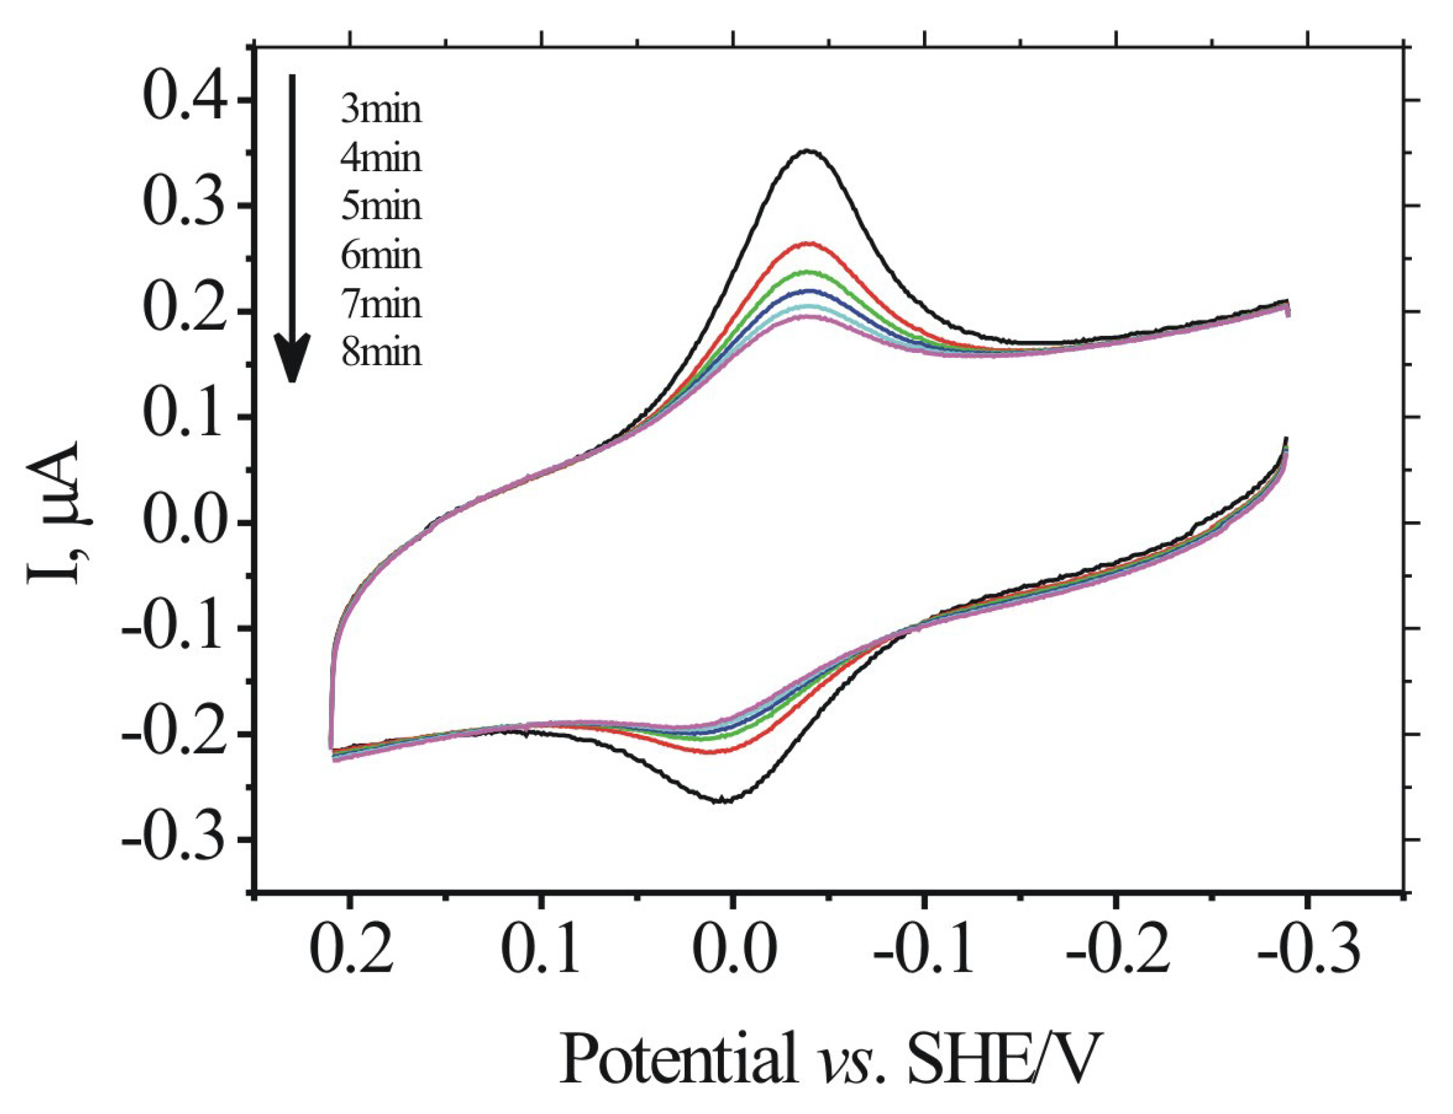
2.4. Dissociation process of MB to ss-DNA/Au and ds-DNA/Au

We have also determined the process of dissociation of MB from thiolate-DNA monolayers on gold. A simple approach to obtain dissociation rate constants consists of incubating the DNA modified electrode in relatively concentrated MB solution (e.g., 20 μM) and then transferring it into a MB-free buffer for voltammetric measurements. Figure 5 shows that the redox peaks decrease gradually with time due to the dissociation of MB from the electrode surface into the electrolyte solution.
Then equation 3 can be derived from equation1 because of the binding process can be neglected in this case.
ln ( θ ) = - k d t + constant
As expected, the integrated cathodic charge (Qt) decreases monotonically with time (Figure 6a and 6b). Plots of ln (θ) versus t for ds-DNA/Au and ss-DNA/Au (Figure 6c and 6d) are linear. The values of kd are 0.18 ± 0.04 min-1 for ds-DNA/Au and 0.09 ± 0.01 min-1 for ss-DNA/Au, respectively. The reason why the kd of ds-DNA is faster than that of ss-DNA/Au may be some weak interaction existing in ds-DNA.

3. Experimental Section

3.1. Materials

DNA oligonucleotides were purchased from Sangon Inc. (Shanghai, China). The sequences are 5′-SH-CACGA CGTTG TAAAA CGACG GCCAG-3′ (5′ thiolated probe at with a C6 spacer, SH-ss-DNA); and 5′-CTGGC CGTCG TTTTA CAACG TCGTG-3′ (c-DNA). Tris-(hydroxymethyl) aminomethane was purchased from Cxbio Biotechnology Ltd. 6-Mercapto-1-hexanol (MCH), tris (2-carboxyethyl) phosphine hydrochloride (TCEP) and methylene blue (MB) were purchased from Sigma. All solutions were prepared with Nanopure water (18 MΩ·cm resistivity) from a Millipore MilliQ system.
The buffers involved in this work were as follows: DNA immobilization buffer (I-buffer; 10 mM Tris-HCl, pH 8.0, 1 mM EDTA, 1 M NaCl, and 1mM TCEP employed to cleave disulfides), DNA hybridization buffer (H-buffer; 10 mM tris-HCl, pH 8.0, 1 mM EDTA, and 1 M NaCl) and buffer for electrochemistry (E-buffer; 20 mM Tris-HCl buffer, pH 7.5, 100 mM NaCl).

3.2. Pretreatment of Electrodes and DNA Immobilization

Gold electrodes (2 mm in diameter, CH Instruments Inc.) were first polished on microcloth (Buehler) with Gamma micropolish deagglomerated alumina suspension (0.05 μm) for 5 min. These electrodes were then sonicated in ethanol and Milli-Q water for 5 min, respectively. Finally, the electrodes were then electrochemically cleaned to remove any remaining impurities [31-33]. The ds-DNA modified gold electrodes were prepared by incubating electrodes in thiolated ds-DNA of appropriate concentrations for 14-16 h, followed by a 2 h post-treatment with 1 mM MCH. DNA duplex was prepared by hybridization of the two complementary sequences (1 μM each) in H-buffer for at least 1 h and was then ready for immobilization at surfaces. The ss-DNA modified gold electrodes were obtained by denaturing ds-DNA modified electrodes in the denaturing solution (100 mM NaOH, 85 °C) for 5 min.

3.3. Electrochemical Measurements

Cyclic voltammetry (CV) was performed on a CH Instruments model 600 eletrochemical analyzer. CV was carried out at a scan rate of 50 mV/s. A three-electrode cell consisting of Ag/AgCl reference electrode and platinum counter electrode was used for all electrochemical measurements. The E-buffers were thoroughly purged with pure nitrogen before experiments. All potentials are reported relative to the standard hydrogen electrode (SHE) although Ag/AgCl was experimentally used.

3.4. Procedures of MB binding and dissociation

The binding process of DNA modified electrode was measured by cyclic voltammetry (CV) as follows. The ss-DNA/Au (or ds-DNA/Au) was incubated in E-buffer containing 3 μM MB and the CV scans were applied and recorded at regular time intervals. The dissociation process was monitored as follows. The ss-DNA/Au (or ds-DNA/Au) was incubated in 20 mM Tris-HCl buffer containing 20 μM MB for 20 min and then was transferred in MB free E-buffer for CV measurements at regular time intervals.

4. Conclusions

MB can be bound to adsorbed ss-DNA by electrostatic interaction and to adsorbed ds-DNA by both electrostatic and intercalative interaction. The latter results in a more negative formal potential and a larger binding constant of MB to adsorbed ds-DNA in comparison with those obtained at ss-DNA/Au electrodes. The binding rate constants and dissociation rate constants of ss-DNA and ds-DNA are significantly different. Such difference in kinetics of MB to adsorbed ds-DNA and ss-DNA might be used to develop sequence-specific electrochemical DNA sensors.

Acknowledgments

This work supported by the National Natural Science Foundation (60537030 and 20725516), Ministry of Science and Technology of the People's Republic of China (2006CB933000, 2007CB936000 and 2006AA020903), Shanghai Municipal Commission for Science and Technology (0652nm006, 0652nm016, 0752nm021, 06ZR14106 and 03DZ14025 under the BDCC program), and Chinese Academy of Sciences.

References

  1. Heller, M. J. DNA microarray technology: devices, systems, and applications. Annu. Rev. Biomed. Eng. 2002, 4, 129–153. [Google Scholar]
  2. Wang, J.; Liu, G.; Merkoci, A. Electrochemical coding technology for simultaneous detection of multiple DNA targets. J. Am. Chem. Soc. 2003, 125, 3214–3215. [Google Scholar]
  3. Fan, C.; Plaxco, K. W.; Heeger, A. J. Biosensors based on binding-modulated donor-acceptor distances. Trends Biotechnol. 2005, 23, 186–192. [Google Scholar]
  4. Zhang, J.; Song, S.; Zhang, L.; Wang, L.; Wu, H.; Pan, D.; Fan, C. Sequence-specific detection of femtomolar DNA via a chronocoulometric DNA sensor (CDS): effects of nanoparticle-mediated amplification and nanoscale control of DNA assembly at electrodes. J. Am. Chem. Soc. 2006, 128, 8575–8580. [Google Scholar]
  5. Whiteley, G. R. Proteomic patterns for cancer diagnosis - promise and challenges. Molecular Biosystems 2006, 2, 358–363. [Google Scholar]
  6. Okamoto, A.; Tainaka, K.; Ochi, Y.; Kanatani, K.; Saito, I. Simple SNP typing assay using a base-discriminating fluorescent probe. Molecular Biosystems 2006, 2, 122–126. [Google Scholar]
  7. Staiano, M.; Bazzicalupo, P.; Rossi, M.; D'Auria, S. Glucose biosensors as models for the development of advanced protein-based biosensors. Molecular Biosystems 2005, 1, 354–362. [Google Scholar]
  8. Usui, K.; Tomizaki, K.; Ohyama, T.; Nokihara, K.; Mihara, H. A novel peptide microarray for protein detection and analysis utilizing a dry peptide array system. Molecular Biosystems 2006, 2, 113–121. [Google Scholar]
  9. Workman, P. Genomics and the second golden era of cancer drug development. Molecular Biosystems 2005, 1, 17–26. [Google Scholar]
  10. Yang, J.; Wang, B. Q.; Rusling, J. F. Genotoxicity sensor response correlated with DNA nucleobase damage rates measured by LC-MS. Molecular Biosystems 2005, 1, 251–259. [Google Scholar]
  11. Pastor, J.; Siro, J. G.; Garcia-Navio, J. L.; Vaquero, J. J.; Alvarez-Builla, J.; Gago, F.; de Pascual-Teresa, B.; Pastor, M.; Rodrigo, M. M. Azino-Fused Benzimidazolium Salts as DNA Intercalating Agents. 2. J. Org. Chem. 1997, 62, 5476–5483. [Google Scholar]
  12. Cao, Y.; He, X. W. Studies of interaction between safranine T and double helix DNA by spectral methods. Spectrochim Acta A Mol. Biomol. Spectrosc. 1998, 54A, 883–892. [Google Scholar]
  13. Coates, C. G.; Jacquet, L.; McGarvey, J. J.; Bell, S. E. J.; Al-Obaidi, A. H. R.; Kelly, J. M. Resonance Raman Probing of the Interaction between Dipyridophenazine Complexes of Ru(II) and DNA. J. Am. Chem. Soc. 1997, 119, 7130–7136. [Google Scholar]
  14. Pasternack, R. F.; Bustamante, C.; Collings, P. J.; Giannetto, A.; Gibbs, E. J. Porphyrin assemblies on DNA as studied by a resonance light-scattering technique. J. Am. Chem. Soc. 1993, 115, 5393–5399. [Google Scholar]
  15. Pasternack, R. F.; Collings, P. J. Resonance light scattering: a new technique for studying chromophore aggregation. Science 1995, 269, 935–939. [Google Scholar]
  16. Huang, C. Z.; Li, Y. F.; Hu, X. L.; Li, N. B. Three-dimensional spectra of the long-range assembly of Nile Blue sulfate on the molecular surface of DNA and determination of DNA by light-scattering. Anal. Chim. Acta 1999, 395, 187–197. [Google Scholar]
  17. Yu, X.; Kim, S. N.; Papadimitrakopoulos, F.; Rusling, J. F. Protein immunosensor using single-wall carbon nanotube forests with electrochemical detection of enzyme labels. Molecular Biosystems 2005, 1, 70–78. [Google Scholar]
  18. Wang, J. Electroanalysis and Biosensors. Anal. Chem. 1999, 71, 328–332. [Google Scholar]
  19. Wang, J. From DNA biosensors to gene chips. Nucleic Acids Res. 2000, 28, 3011–3016. [Google Scholar]
  20. Ozkan, D.; Kara, P.; Kerman, K.; Meric, B.; Erdem, A.; Jelen, F.; Nielsen, P. E.; Ozsoz, M. DNA and PNA sensing on mercury and carbon electrodes by using methylene blue as an electrochemical label. Bioelectrochemistry 2002, 58, 119–126. [Google Scholar]
  21. Gu, J. Y.; Lu, X. J.; Ju, H. X. DNA sensor for recognition of native yeast DNA sequence with methylene blue as an electrochemical hybridization indicator. Electroanalysis 2002, 14, 949–954. [Google Scholar]
  22. Boon, E. M.; Barton, J. K. DNA electrochemistry as a probe of base pair stacking in A-, B-, and Z-form DNA. Bioconjug. Chem. 2003, 14, 1140–1147. [Google Scholar]
  23. Steel, A. B.; Herne, T. M.; Tarlov, M. J. Electrochemical quantitation of DNA immobilized on gold. Anal. Chem. 1998, 70, 4670–4677. [Google Scholar]
  24. Lao, R.; Song, S.; Wu, H.; Wang, L.; Zhang, Z.; He, L.; Fan, C. Electrochemical interrogation of DNA monolayers on gold surfaces. Anal. Chem. 2005, 77, 6475–6480. [Google Scholar]
  25. Tani, A.; Thomson, A. J.; Butt, J. N. Methylene blue as an electrochemical discriminator of single- and double-stranded oligonucleotides immobilised on gold substrates. Analyst 2001, 126, 1756–1759. [Google Scholar]
  26. Kelley, S. O.; Boon, E. M.; Barton, J. K.; Jackson, N. M.; Hill, M. G. Single-base mismatch detection based on charge transduction through DNA. Nucleic Acids Res. 1999, 27, 4830–4837. [Google Scholar]
  27. Liu, T.; Barton, J. K. DNA electrochemistry through the base pairs not the sugar-phosphate backbone. J. Am. Chem. Soc. 2005, 127, 10160–10161. [Google Scholar]
  28. Kelley, S. O.; Barton, J. K.; Jackson, N. M.; Hill, M. G. Electrochemistry of methylene blue bound to a DNA-modified electrode. Bioconjug. Chem. 1997, 8, 31–37. [Google Scholar]
  29. Pang, D. W.; Abruna, H. D. Interactions of Benzyl Viologen with Surface-Bound Single- and Double-Stranded DNA. Anal. Chem. 2000, 72, 4700–4706. [Google Scholar]
  30. Yu, H. Z.; Luo, C. Y.; Sankar, C. G.; Sen, D. Voltammetric procedure for examining DNA-modified surfaces: quantitation, cationic binding activity, and electron-transfer kinetics. Anal. Chem. 2003, 75, 3902–3907. [Google Scholar]
  31. Fan, C.; Zhong, J.; Guan, R.; Li, G. Direct electrochemical characterization of Vitreoscilla sp. hemoglobin entrapped in organic films. Biochim. Biophys. Acta 2003, 1649, 123–126. [Google Scholar]
  32. Hoogvliet, J. C.; Dijksma, M.; Kamp, B.; van Bennekom, W. P. Electrochemical pretreatment of polycrystalline gold electrodes to produce a reproducible surface roughness for self-assembly: a study in phosphate buffer pH 7.4. Anal. Chem. 2000, 72, 2016–2021. [Google Scholar]
  33. Janeak, R. P.; Fawcett, W. R.; Ulman, A. J. Impedance Spectroscopy of Self-Assembled Monolayers on Au(111): Evidence for Complex Double-Layer Structure in Aqueous NaClO4 at the Potential of Zero Charge. J. Phys. Chem. B 1997, 101, 8550–8558. [Google Scholar]
Figure 1. Cylic voltammograms recorded at MCH/Au (a), ss-DNA/Au (b) and ds-DNA/Au (c) at 50 mV/s in E-buffer containing 3 μM MB.
Sensors 07 02671f1
Figure 2. In a) and b), ss-DNA and ds-DNA lies down on electrodes, while in c) and d) ss-DNA and ds-DNA are assembled on electrode such that they are in a vertical configuration (● represents guanine).
Sensors 07 02671f2
Figure 3. Effect of scan rate on peak current of MB at the ds-DNA/Au (a) and ss-DNA/Au (b) electrodes.
Sensors 07 02671f3
Figure 4. Integrated charge of cathodic peaks from CVs of 3 μM MB on ds-DNA/Au (a) and ss-DNA/Au (b) at 50 mV/s as function of the incubation time. Plot of ln (1-θ) versus incubation time, from which the first-order rate constant was determined, for ds-DNA/Au (c) and ss-DNA/Au (d).
Sensors 07 02671f4
Figure 5. Cyclic voltammograms of ds-DNA/Au.in MB free E-buffer after incubated in 20 μM MB for 20 min.
Sensors 07 02671f5
Figure 6. Integrated charge of the cathodic peaks from the CVs of ds-DNA/Au (a) and ss-DNA/Au (b) as a function of time after transfer to MB free E-buffer. Plot of ln(θ) versus incubation time, from which the first-order rate constant kd was determined, for ds-DNA/Au (c) and ss-DNA/Au (d).
Sensors 07 02671f6

