
Robust Tomato Recognition for Robotic Harvesting Using Feature Images Fusion

Abstract
:1. Introduction
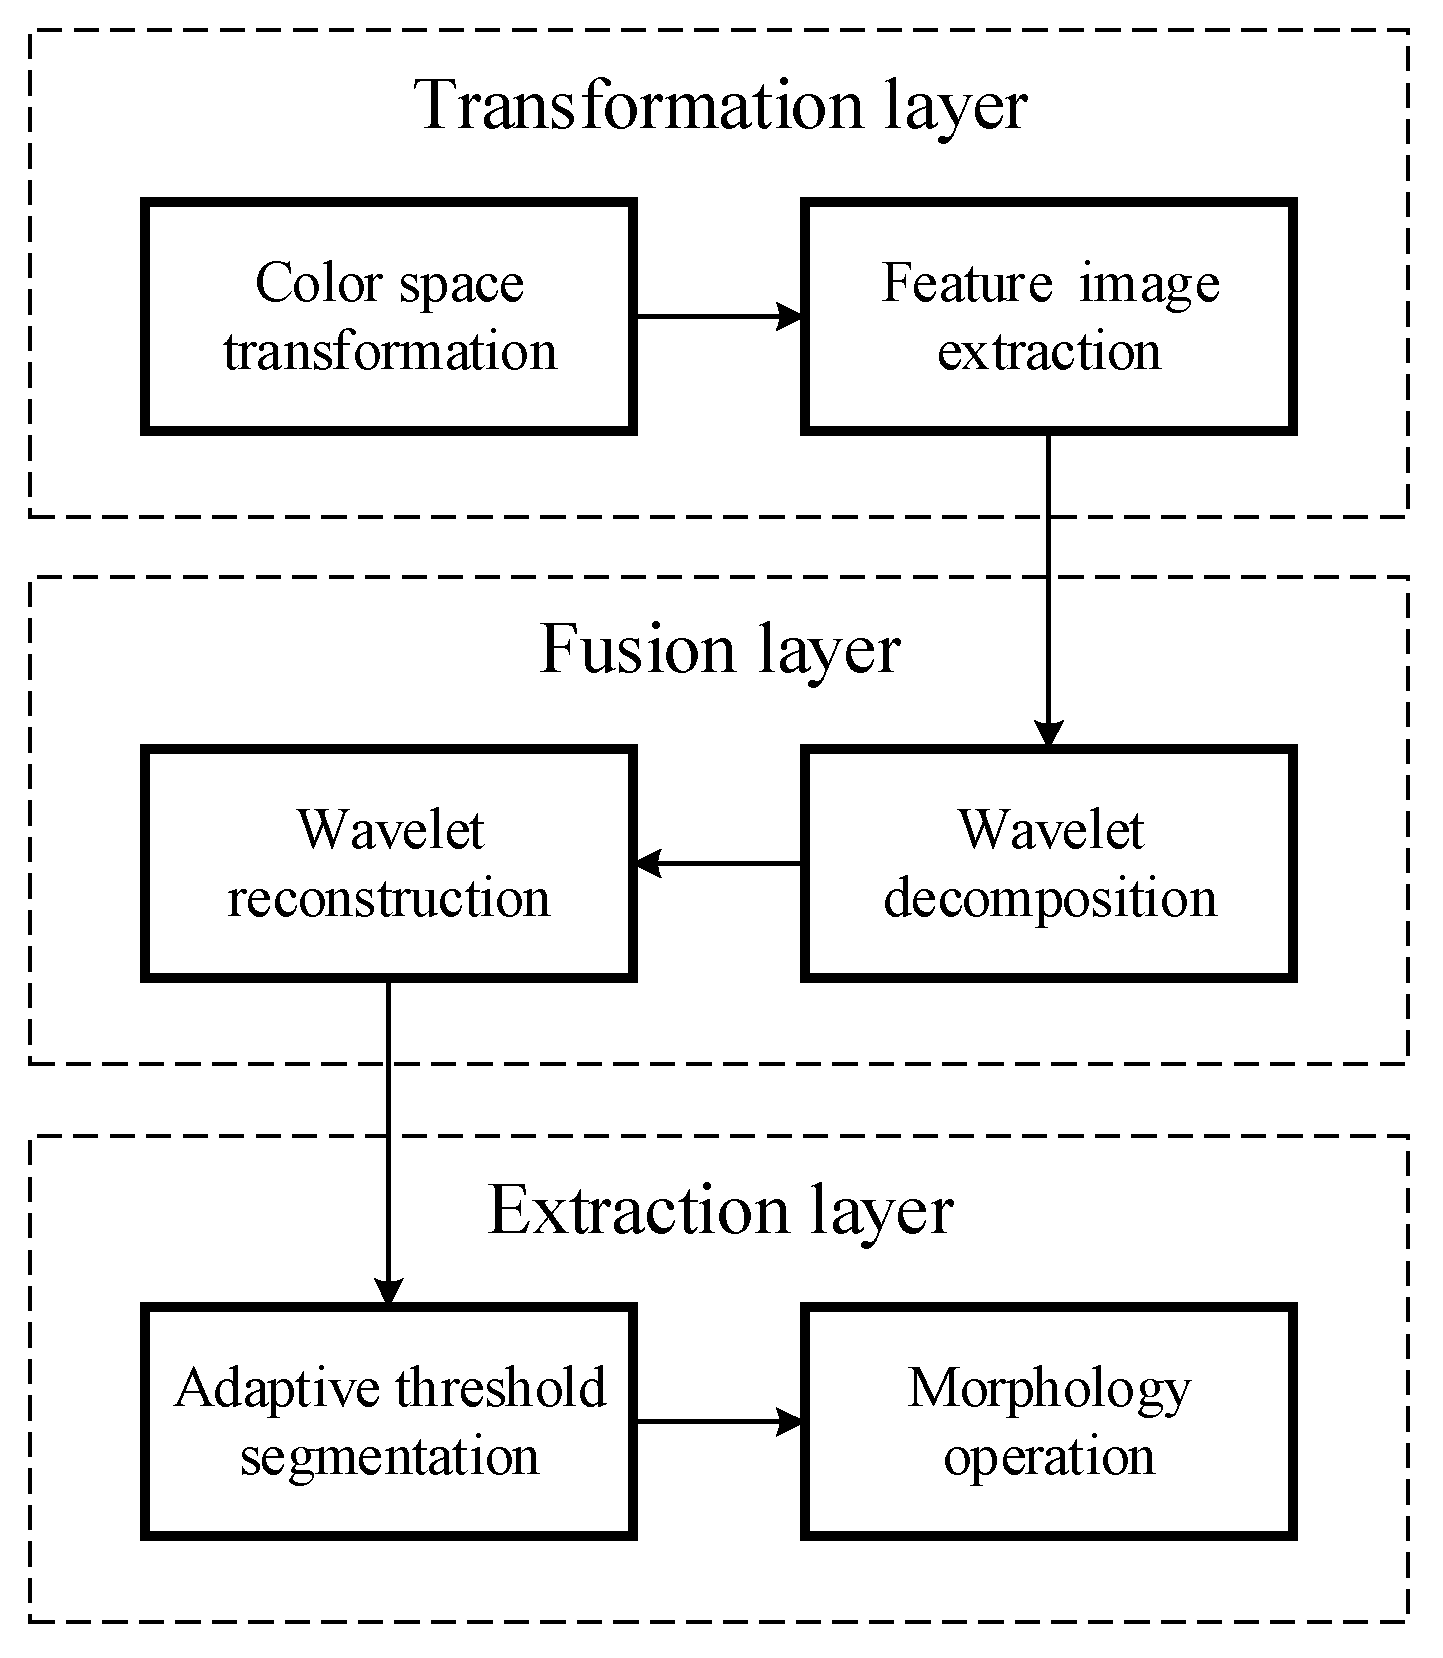
2. Materials and Methods
2.1. Image Acquisition
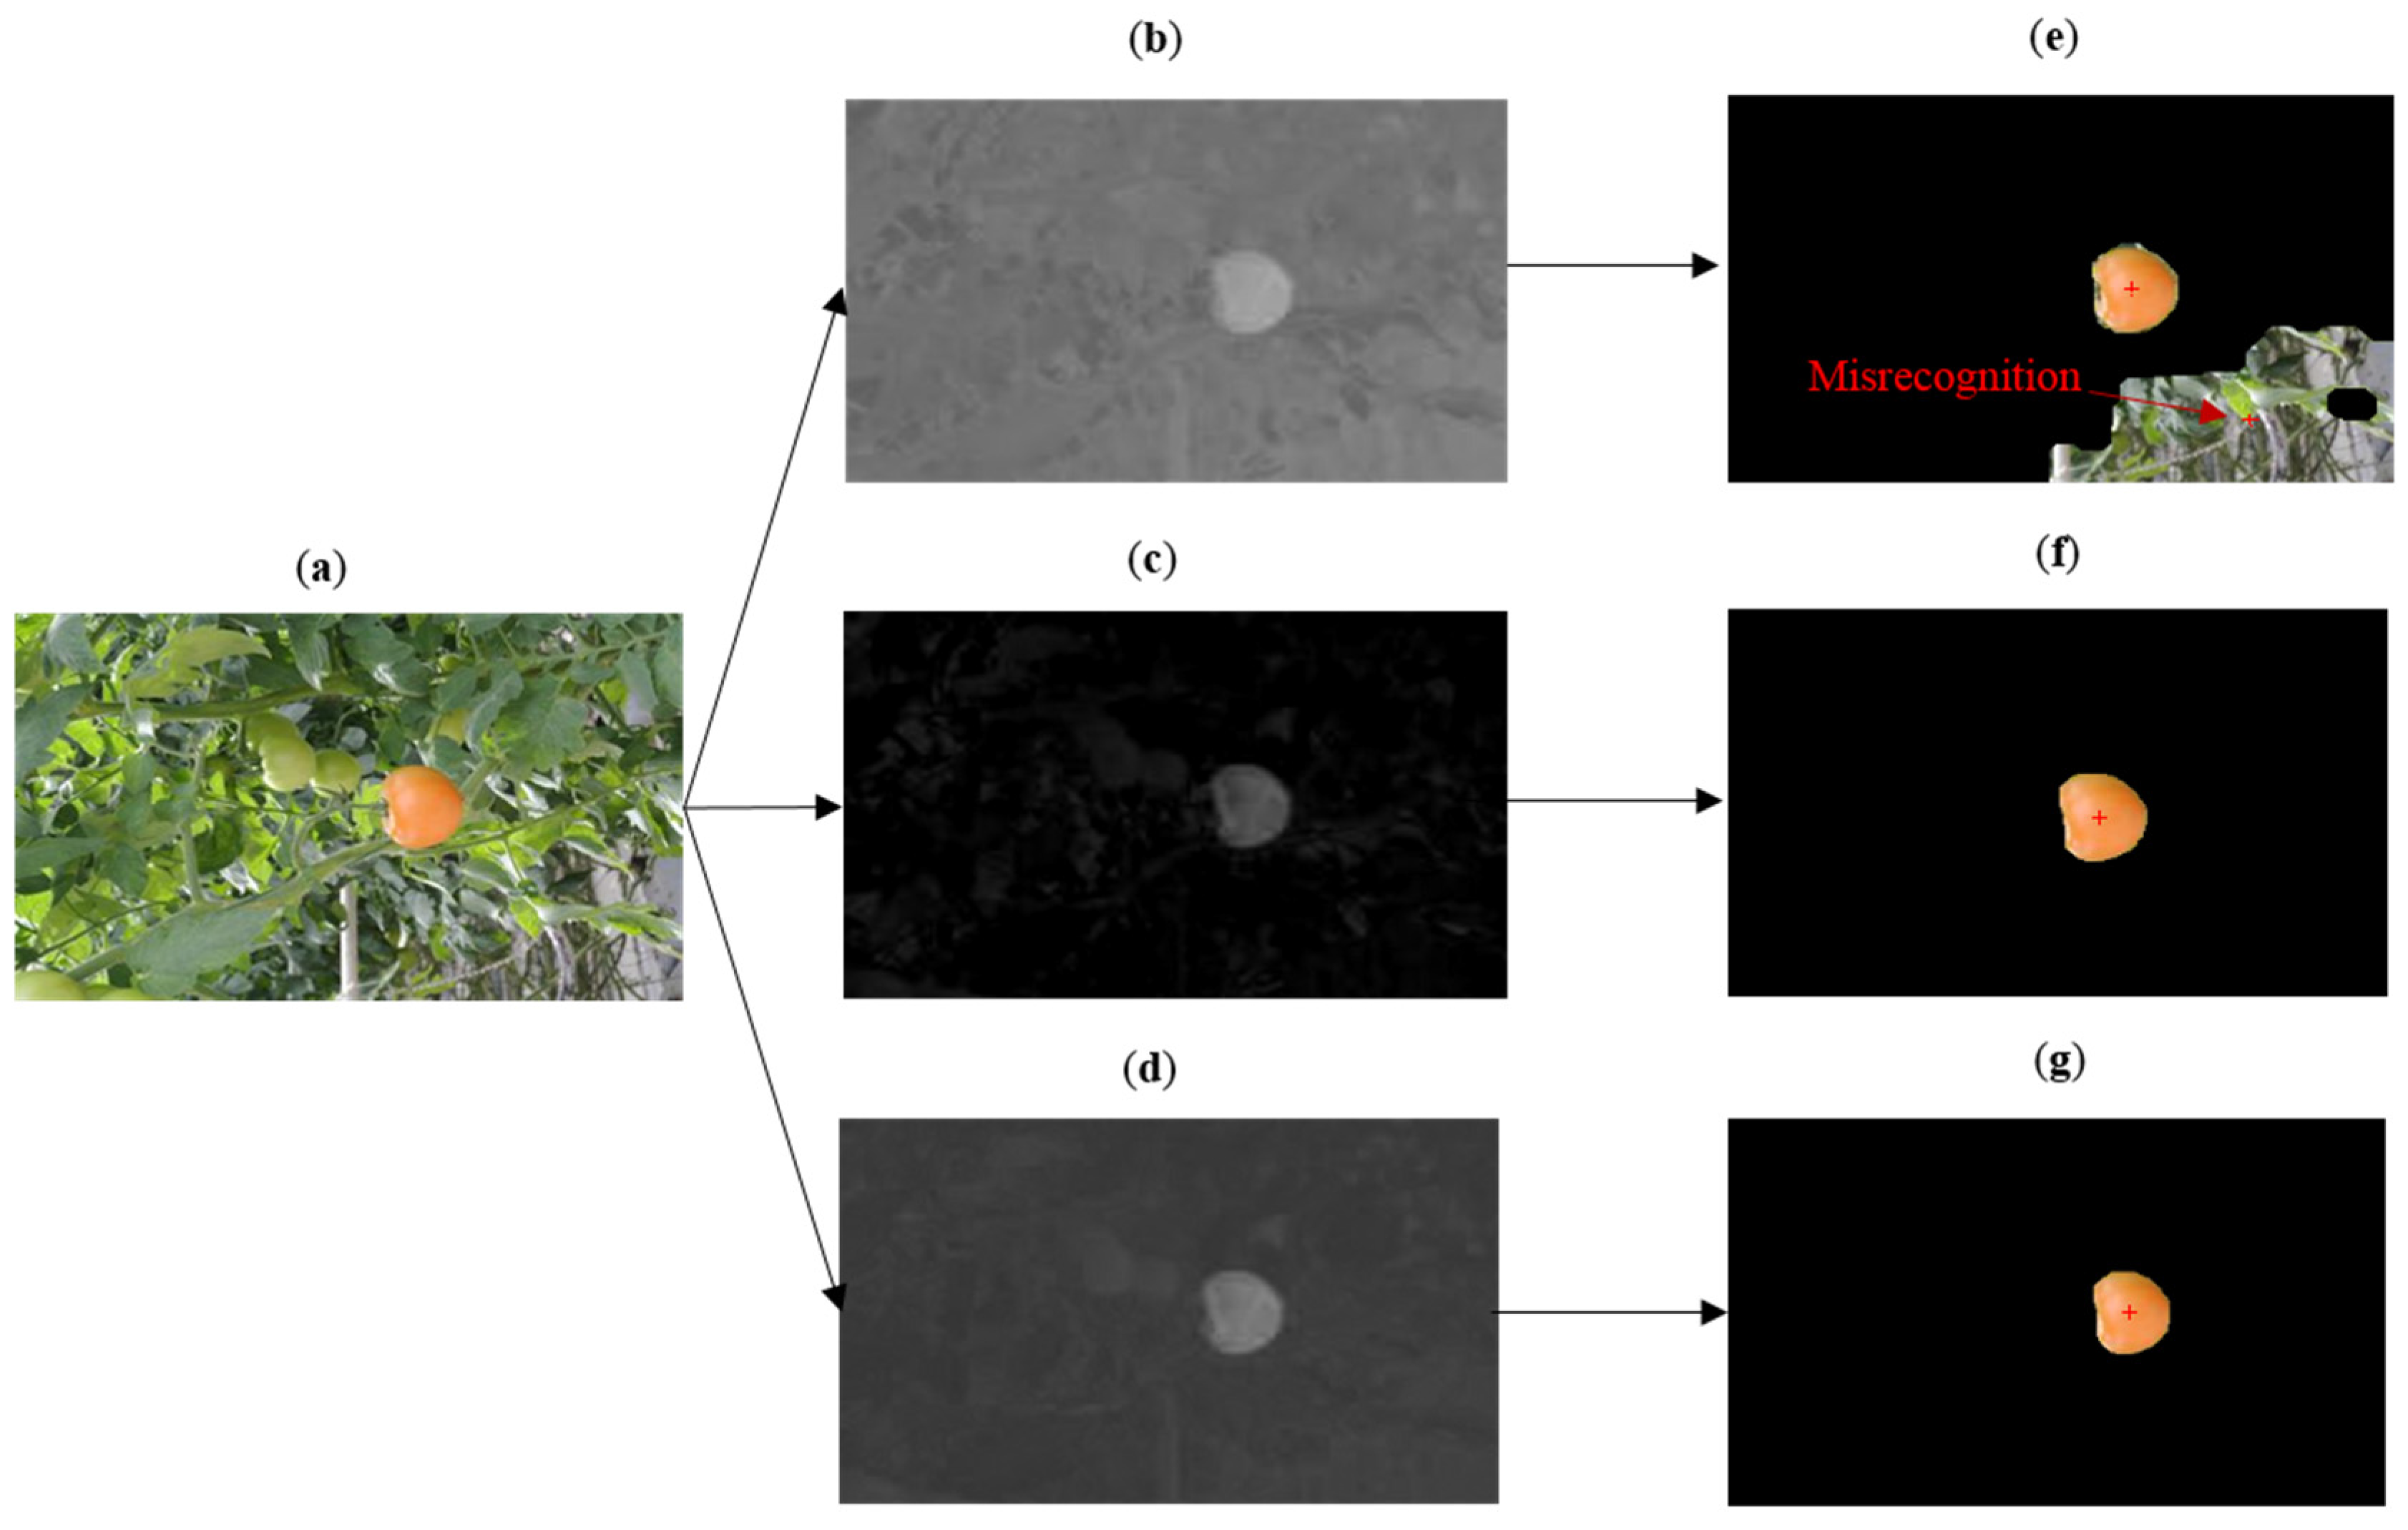
2.2. Feature Image Extraction
2.2.1. a*-Component Image
2.2.2. I-Component Image
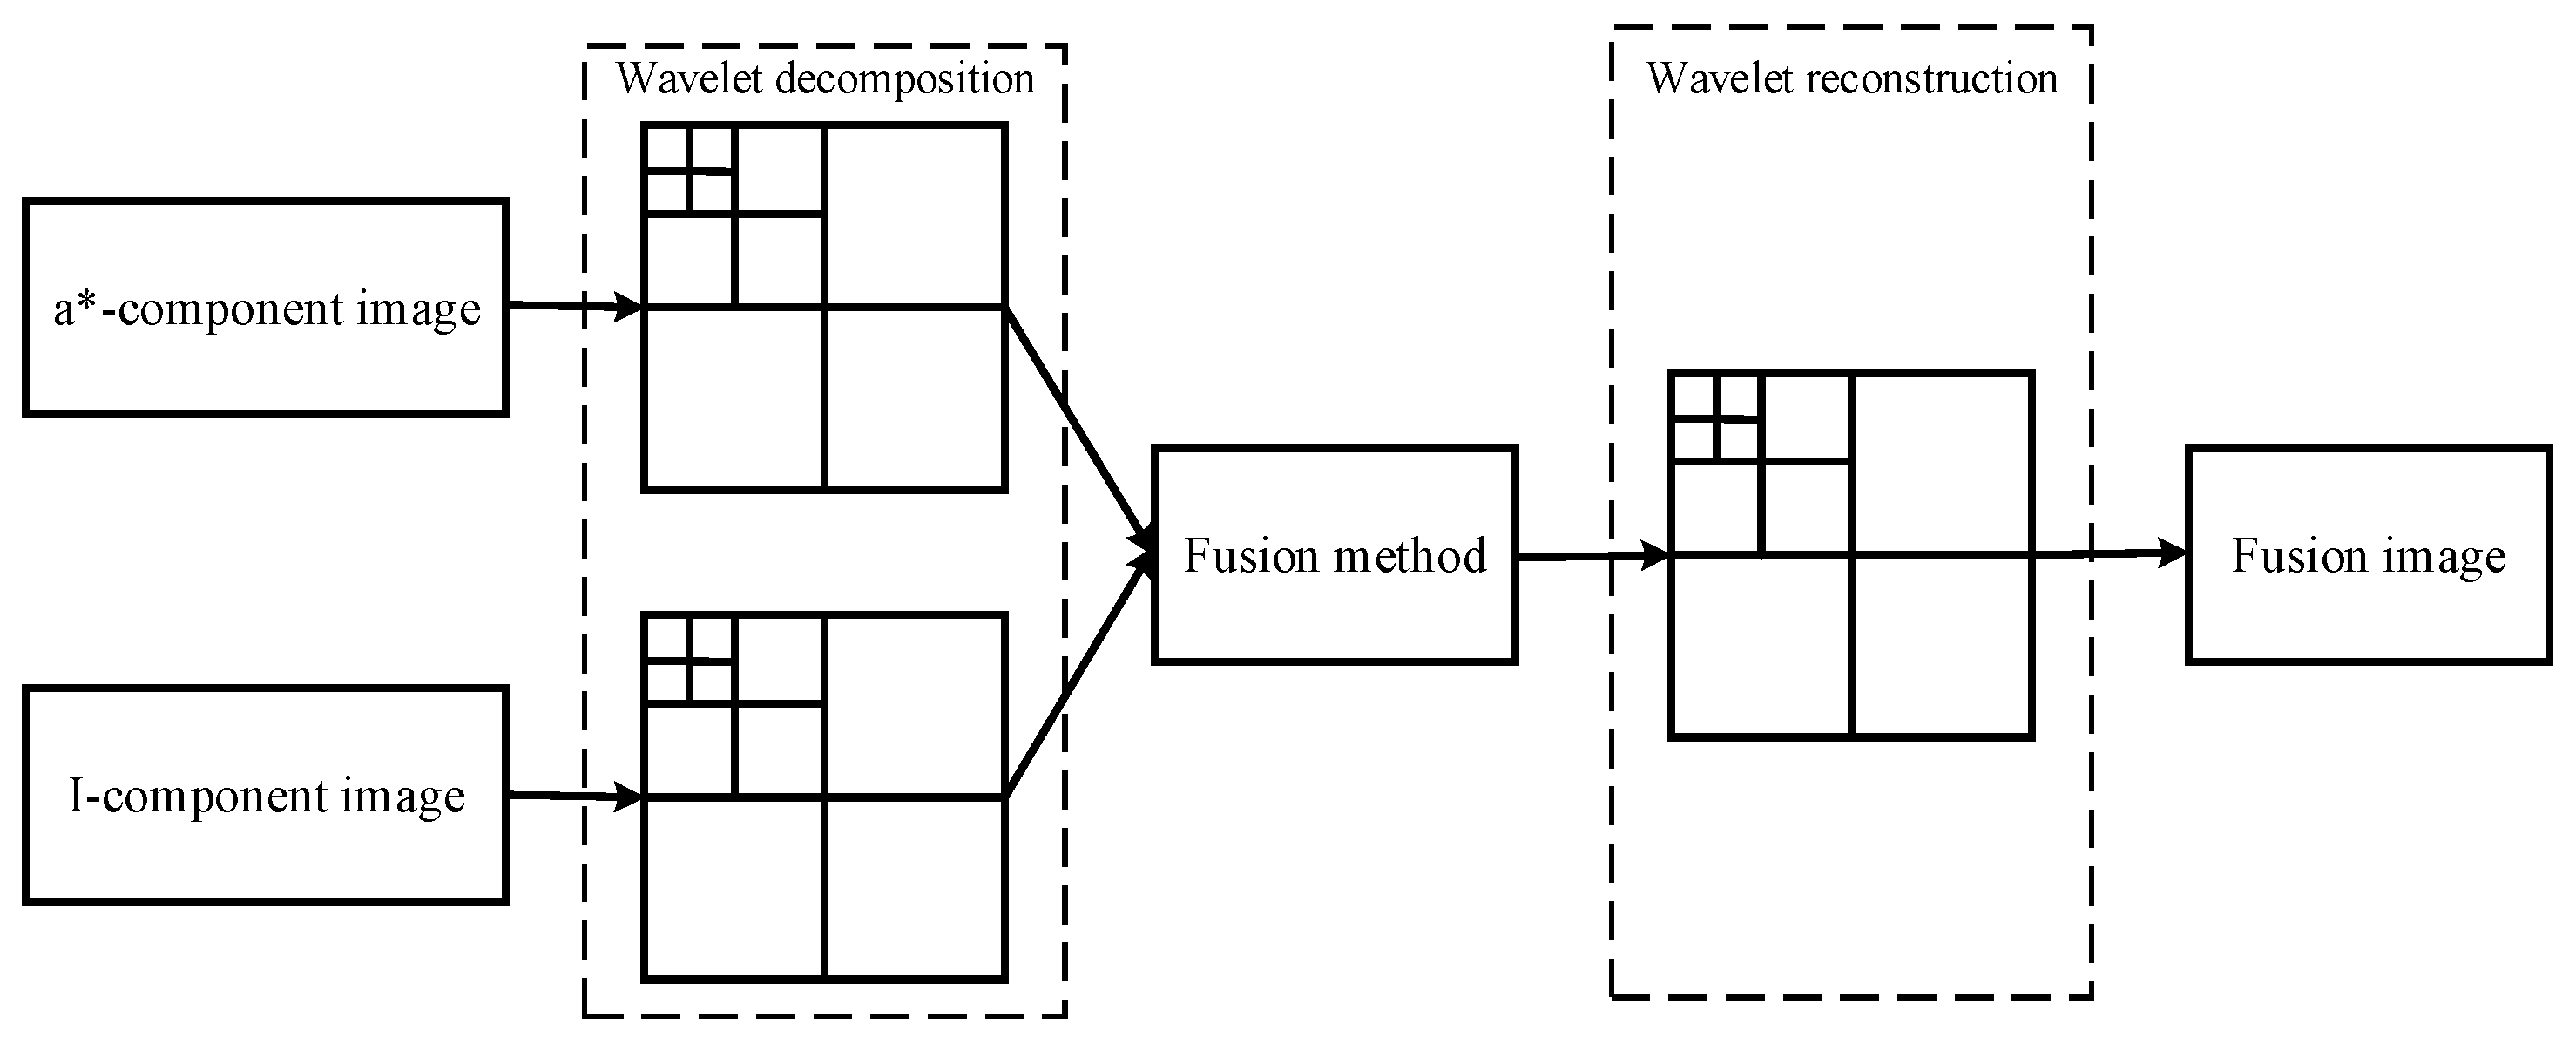
2.3. Image Fusion Strategy
2.4. Adaptive Threshold Segmentation
- (1)
- Assume the resolution of the fusion image is M × N; if a pixel on the fusion image is recorded as (i, j), then the grayscale value of the pixel (i, j) is recorded as T(i, j);
- (2)
- Calculate the maximum and the minimum grayscale values of the fusion image: Tmax and Tmin. The initial threshold can be worked out according to the following formula:where k is the number of iterations and Tk is the grayscale result after k iterations.
- (3)
- Based on the grayscale Tk, the fusion image is divided into two groups, A and B, and the average grayscale of A and B areas can be calculated by Equation (9).where TA and TB are the average grayscale of A and B areas and the W is the number of pixels that have grayscales that are larger than Tk.
- (4)
- After k times iterations, the new threshold is calculated as follows:
- (5)
- Repeat steps (3) and (4), until Tk = Tk + 1; and take the result Tk+ 1 as the final threshold Tm.
- (6)
- Obtain the other threshold Tn by the Otsu algorithm.
- (7)
- Determine the final segmentation threshold on the basis of comparing the results of Tm and Tn. When Tm is equal to and larger than Tn, define Tn as the final threshold Tf; when Tm is less than Tn, define Tm as the final threshold Tf.
- (8)
- The fusion image segmentation is calculated according to Equation (11), which is also defined as binary image processing.
2.5. Morphology Operation
3. Results and Discussion
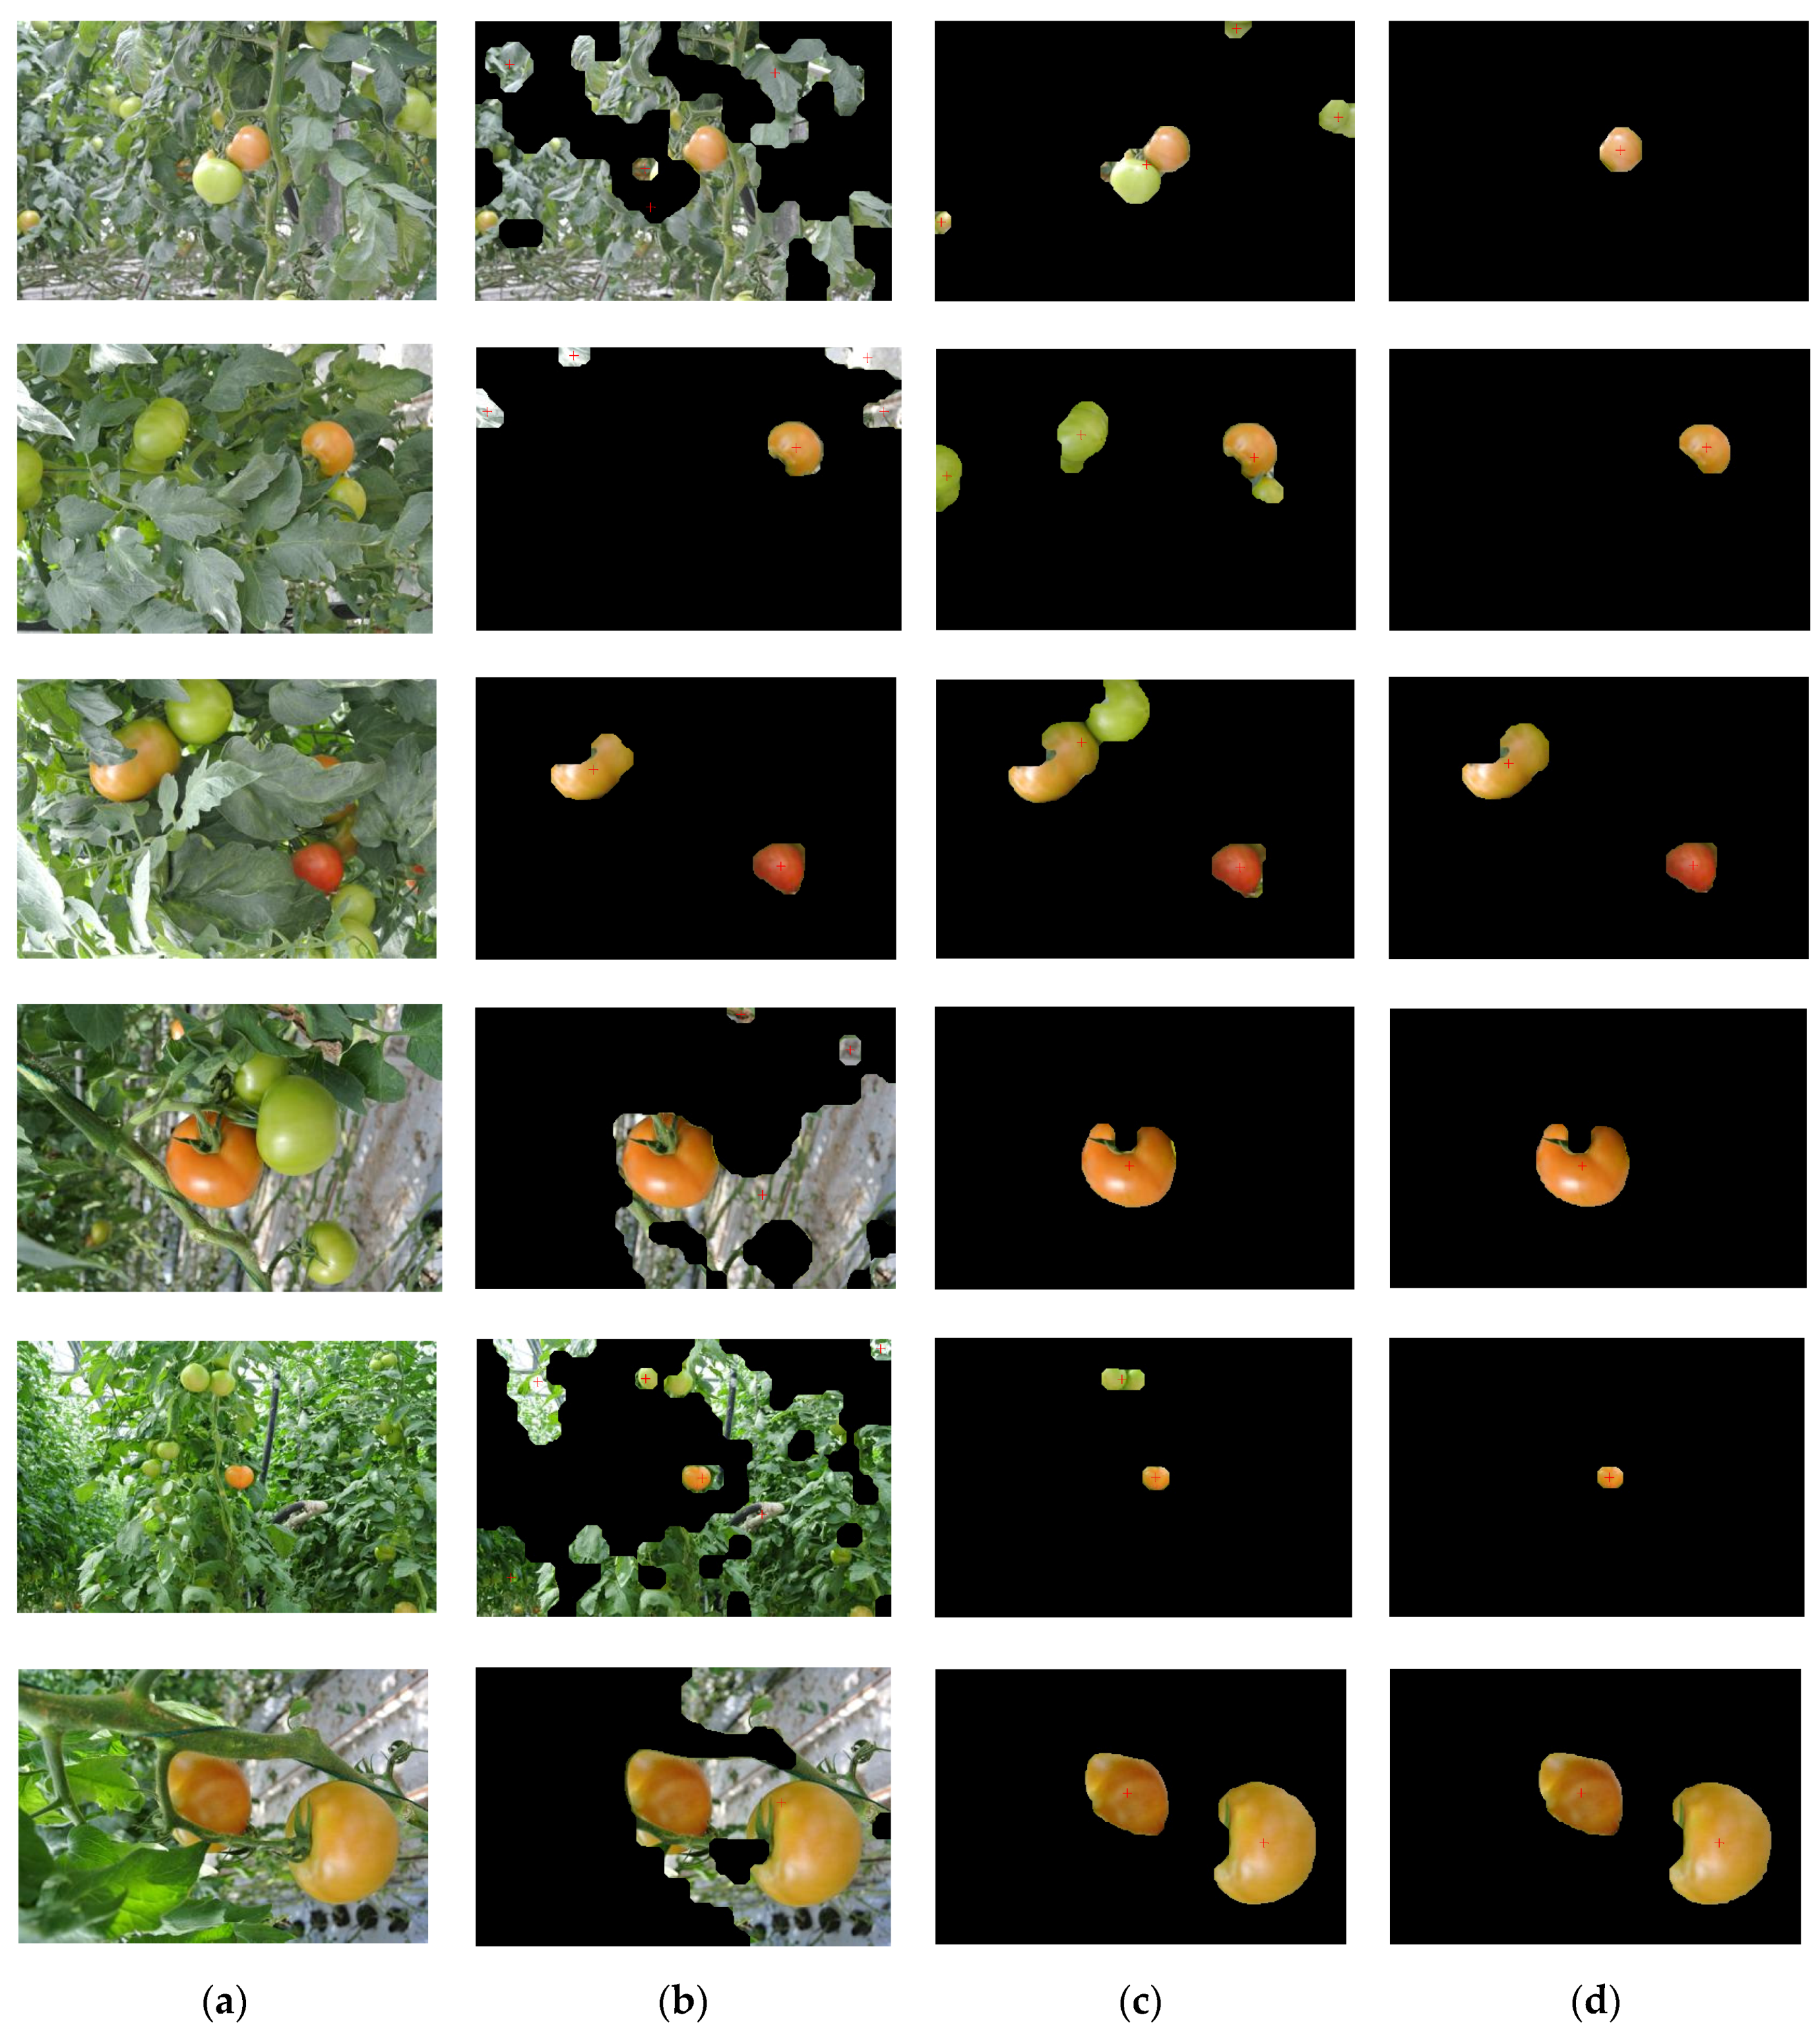
3.1. Tomato Recognition


| Types of Disturbances | Total | Recognized | ||
|---|---|---|---|---|
| a*-component Image | I-component Image | Fusion Image | ||
| variable illumination | 100 | 44 | 67 | 97 |
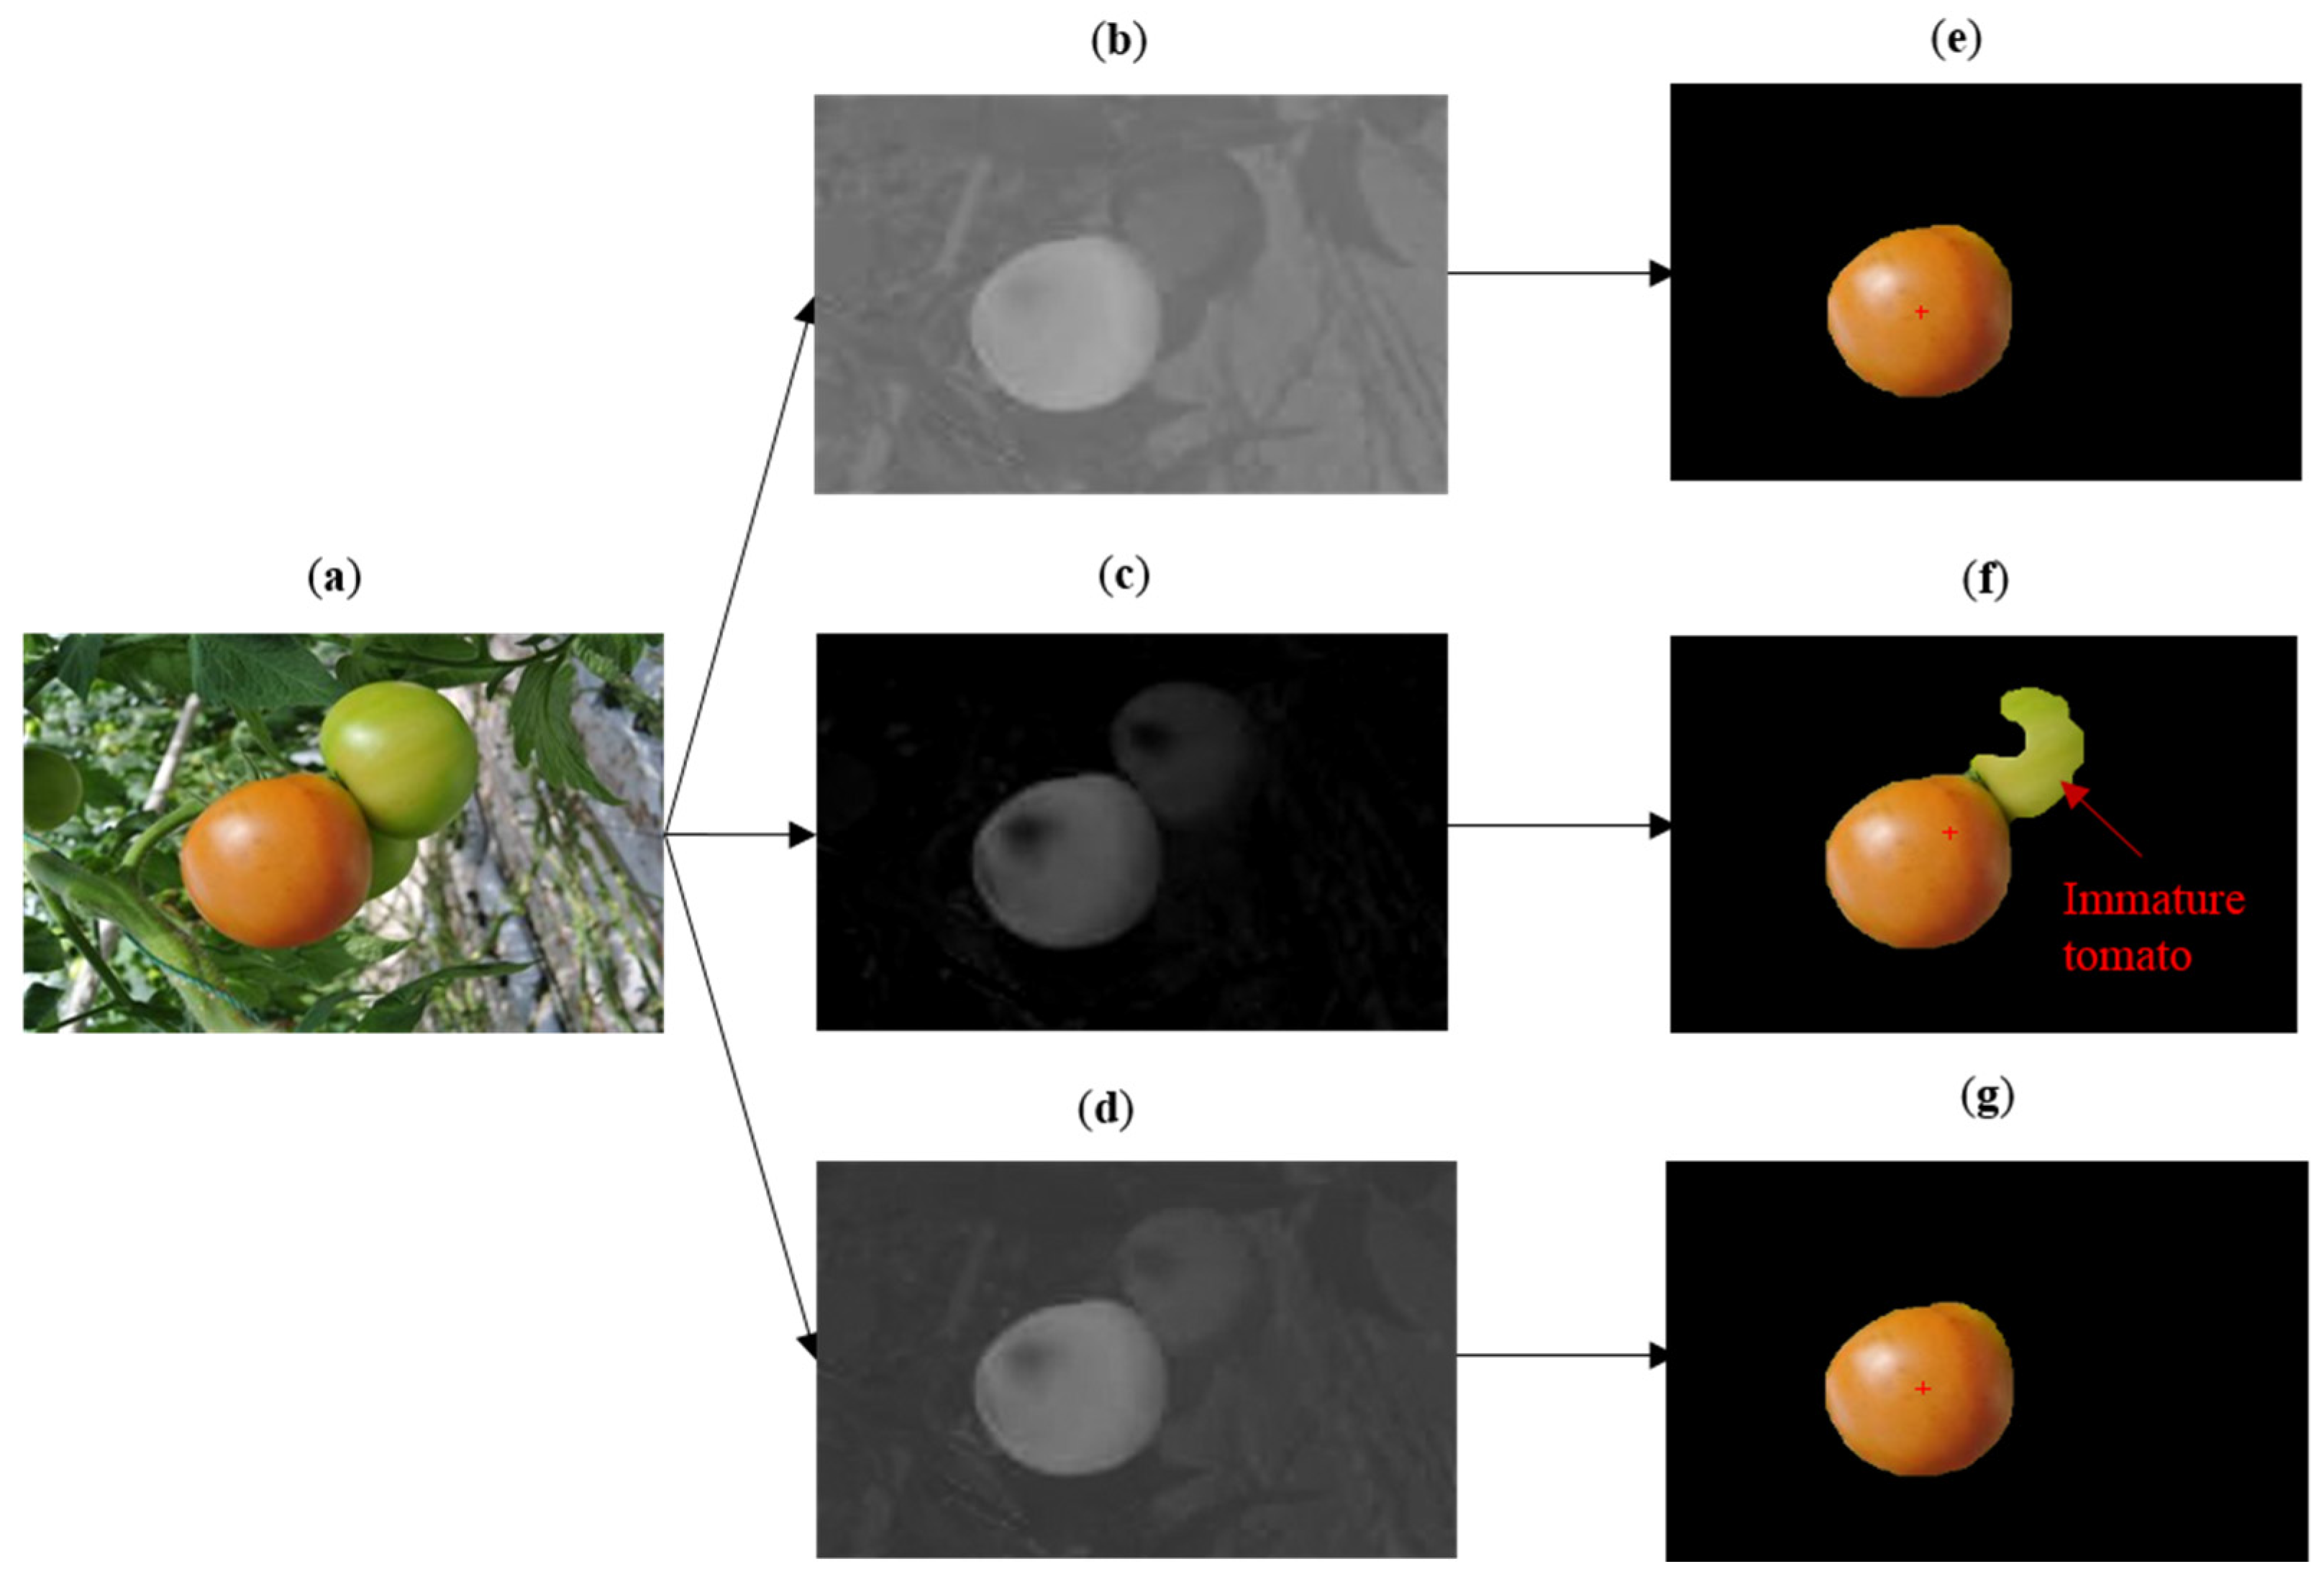
| clustering of immature fruit | 100 | 68 | 59 | 89 |
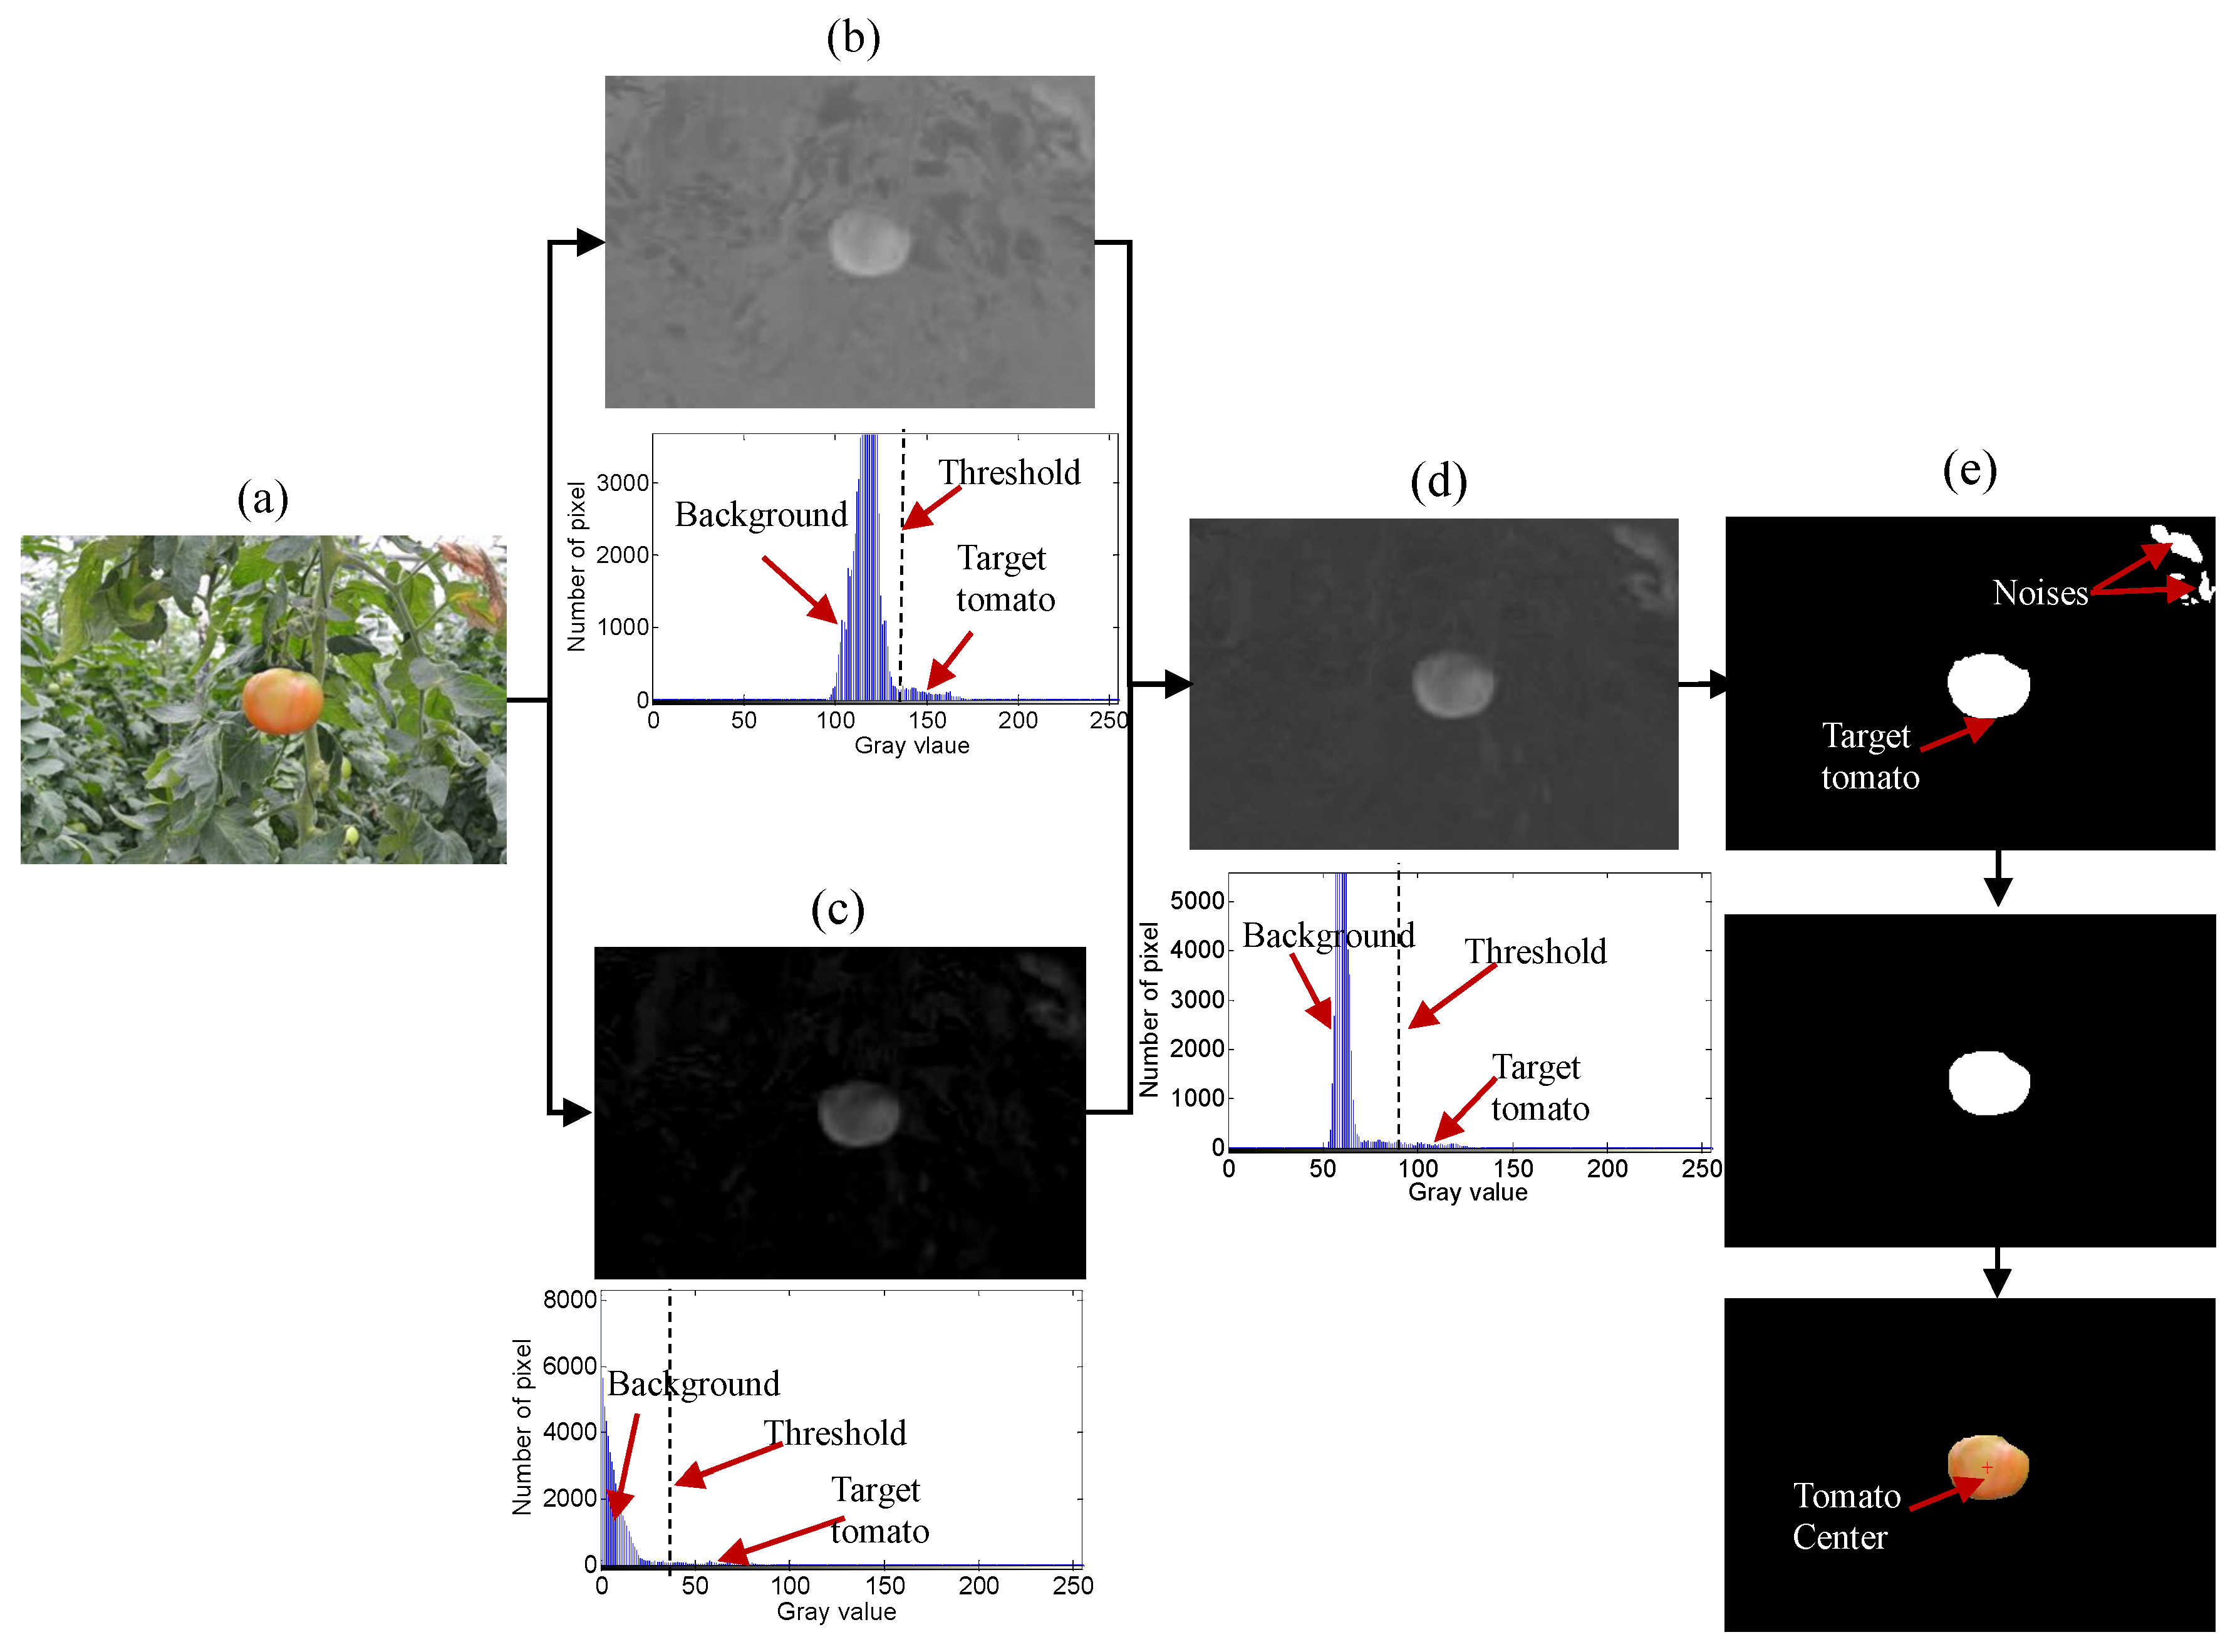
3.2. Histogram Analysis
| Image | Gray Distribution | Threshold |
|---|---|---|
| a*-component image | 100–170 | 140–145 |
| I -component image | 0–80 | 25–50 |
| Fusion image | 50–130 | 80–100 |
3.3. Comparative Analysis

3.4. Robust Analysis
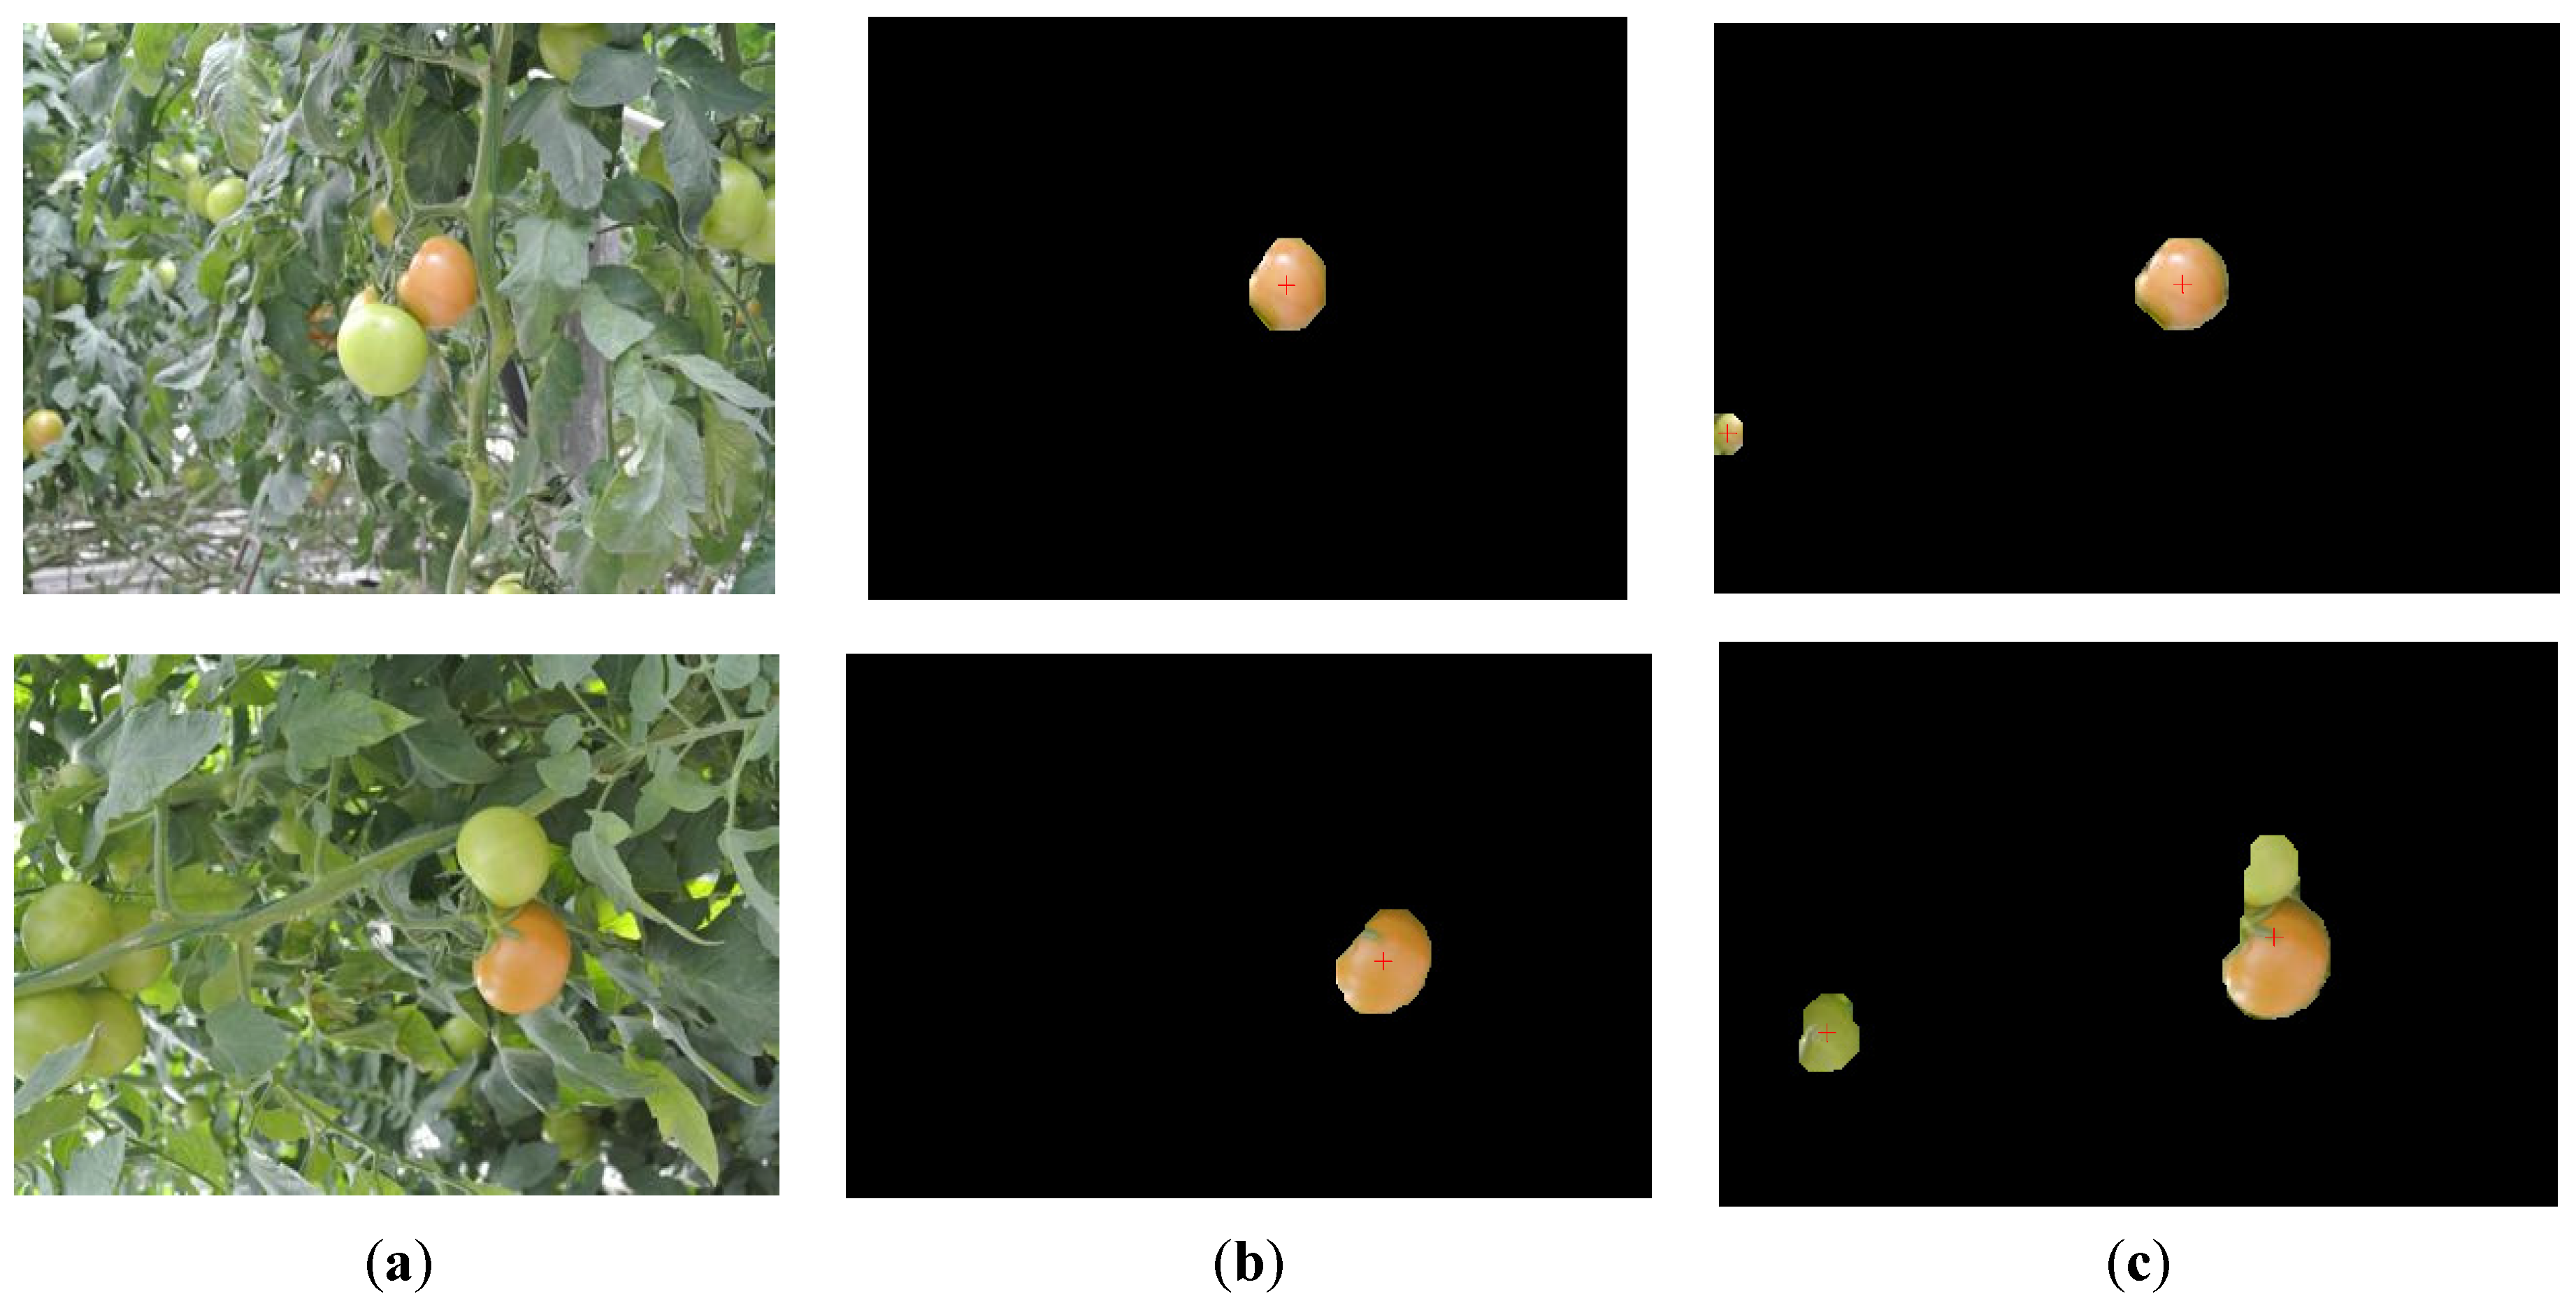
3.4.1. Illumination Varying Influence

3.4.2. Overlapped Influence

4. Conclusions
Acknowledgments
Author Contributions
Conflicts of Interest
References
- Ji, C.; Zhang, J.; Ting, Y. Research on key technology of truss tomato harvesting robot in greenhouse. Appl. Mech. Mater. 2014, 442, 480–486. [Google Scholar] [CrossRef]
- Schertz, C.E.; Brown, G.K. Basic considerations in mechanizing citrus harvest. Trans. ASAE 1968, 11, 343–346. [Google Scholar]
- David, C.S.; Roy, C.H. Discriminating Fruit for Robotic Harvest Using color in Natural Outdoor Scenes. Trans. ASAE 1989, 32, 757–763. [Google Scholar] [CrossRef]
- Henten, E.J.V.; Tuijl, B.A.J.V.; Hemming, J.; Kornet, J.G.; Bontsema, J.; Os, E.A.V. Field test of an autonomous cucumber picking robot. Biosyst. Eng. 2003, 86, 305–313. [Google Scholar] [CrossRef]
- Belforte, G.; Deboli, R.; Gay, P.; Piccarolo, P.; Aimonino, D.R. Robot design and testing for greenhouse applications. Biosyst. Eng. 2006, 95, 309–321. [Google Scholar] [CrossRef]
- Hayashi, S.; Shigematsu, K.; Yamamoto, S.; Kobayashi, K.; Kohno, Y.; Kamata, J.; Kurita, M. Evaluation of a strawberry-harvesting robot in a field. Biosyst. Eng. 2010, 105, 160–171. [Google Scholar] [CrossRef]
- Johan, B.; Donne, K.; Boedrij, S.; Beckers, W.; Claesen, E. Autonomous fruit picking machine: A robotic apple harvester. Field Serv. Robot. 2008, 42, 531–539. [Google Scholar]
- Bac, C.W.; Roorda, T.; Reshef, R.; Berman, S.; Hemming, J.; Henten, E.J.V. Analysis of a motion planning problem for sweet-pepper harvesting in a dense obstacle environment. Biosyst. Eng. 2015, 135, 1–13. [Google Scholar] [CrossRef]
- Li, Z.; Li, P.; Yang, H.; Wang, Y.Q. Stability tests of two-finger tomato grasping for harvesting robots. Biosyst. Eng. 2013, 116, 163–170. [Google Scholar] [CrossRef]
- Zhao, D.A.; Lv, J.; Ji, W.; Chen, Y. Design and control of an apple harvesting robot. Biosyst. Eng. 2011, 110, 112–122. [Google Scholar]
- Li, H.; Wang, K.; Cao, Q. Tomato targets extraction and matching based on computer vision. Trans. CSAE 2012, 28, 168–172. [Google Scholar]
- Mao, H.P.; Li, M.X.; Zhang, Y.C. Image segmentation method based on multi-spectral image fusion and morphology reconstruction. Trans. CSAE 2008, 24, 174–178. [Google Scholar]
- Molto, E.; Pla, F.; Juste, F. Vision systems for the location of citrus fruit in a tree canopy. J. Agric. Eng. Res. 1992, 52, 101–110. [Google Scholar] [CrossRef]
- Song, Y.; Glasbey, C.A.; Horgan, G.W. Automatic fruit recognition and counting from multiple images. Biosyst. Eng. 2014, 118, 203–215. [Google Scholar] [CrossRef]
- Li, P.; Lee, S.H.; Hsu, H.Y. Review on fruit harvesting method for potential use of automatic fruit harvesting systems. Procedia Eng. 2011, 23, 351–366. [Google Scholar] [CrossRef]
- Tankgaki, K.; Tateshi, F.; Akira, A.; Junichi, I. Cherry-harvesting robot. Comput. Electr. Agric. 2008, 63, 65–72. [Google Scholar] [CrossRef]
- Okamoto, H.; Lee, W.S. Green citrus detection using hyperspectral imaging. Comput. Electr. Agric. 2009, 66, 201–208. [Google Scholar] [CrossRef]
- Bulanon, D.M.; Burks, T.F.; Alchanatis, V. Study on temporal variation in citrus canopy using thermal imaging for citrus fruit detection. Biosyst. Eng. 2008, 101, 161–171. [Google Scholar] [CrossRef]
- Bulanon, D.M.; Burks, T.F.; Alchanatis, V. Image fusion of visible and thermal images for fruit detection. Biosyst. Eng. 2009, 103, 12–22. [Google Scholar] [CrossRef]
- Feng, J.; Zeng, L.H.; Liu, G.; Si, Y.S. Fruit Recognition Algorithm Based on Multi-source Images Fusion. Trans. CSAM 2014, 45, 73–80. [Google Scholar]
- Hetal, H.P.; Jain, R.K.; Joshi, M.V. Fruit Detection using improved Multiple Features based Algorithm. IJCA 2011, 13, 1–5. [Google Scholar]
- Huang, L.W.; He, D.J. Ripe fuji apple detection model analysis in natural tree canopy. Telkomnika 2012, 10, 1771–1778. [Google Scholar] [CrossRef]
- Zhao, J.Y.; Zhang, T.Z.; Yang, L. Object extraction for the vision system of tomato picking robot. Trans. CSAM 2006, 37, 200–203. [Google Scholar]
- Arman, A.; Motlagh, A.M.; Mollazade, K.; Teimourlou, R.F. Recognition and localization of ripen tomato based on machine vision. Aust.J. Crop Sci. 2011, 5, 1144–1149. [Google Scholar]
© 2016 by the authors; licensee MDPI, Basel, Switzerland. This article is an open access article distributed under the terms and conditions of the Creative Commons by Attribution (CC-BY) license (http://creativecommons.org/licenses/by/4.0/).
Share and Cite
Zhao, Y.; Gong, L.; Huang, Y.; Liu, C. Robust Tomato Recognition for Robotic Harvesting Using Feature Images Fusion. Sensors 2016, 16, 173. https://doi.org/10.3390/s16020173
Zhao Y, Gong L, Huang Y, Liu C. Robust Tomato Recognition for Robotic Harvesting Using Feature Images Fusion. Sensors. 2016; 16(2):173. https://doi.org/10.3390/s16020173
Chicago/Turabian StyleZhao, Yuanshen, Liang Gong, Yixiang Huang, and Chengliang Liu. 2016. "Robust Tomato Recognition for Robotic Harvesting Using Feature Images Fusion" Sensors 16, no. 2: 173. https://doi.org/10.3390/s16020173