Cancer Cell Response to Anthracyclines Effects: Mysteries of the Hidden Proteins Associated with These Drugs

 ,
,
Abstract
:
1. Introduction
2. Results
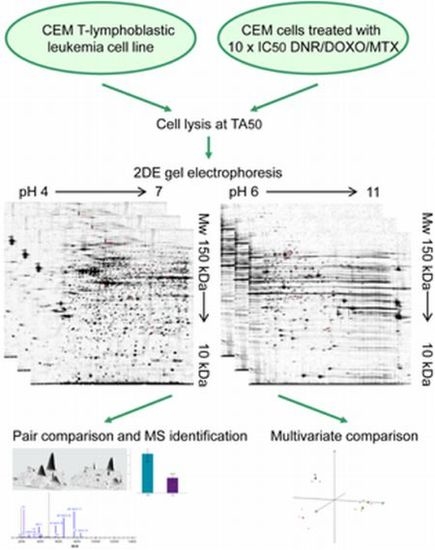
2.1. Determination of IC50, TA50
2.2. Proteome 2-D Maps—Number of Spots per Gel and Number of Differentially Abundant Spots per Anti-Cancer Drug
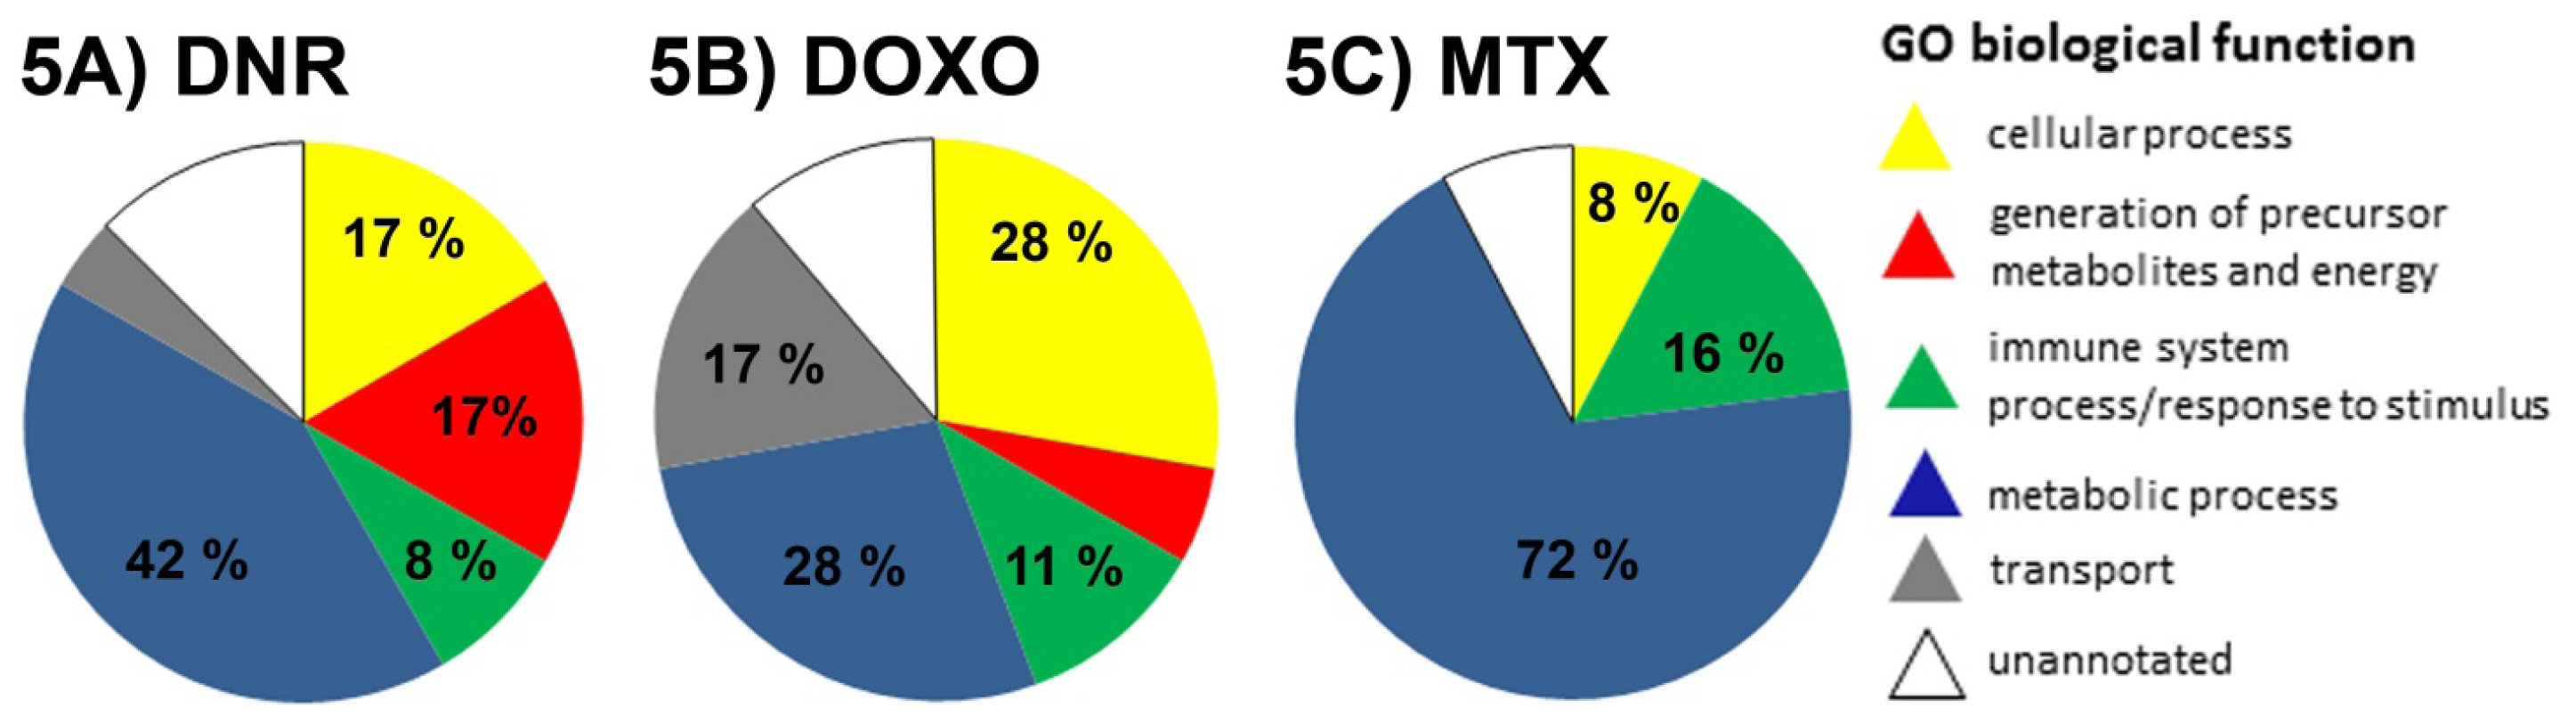
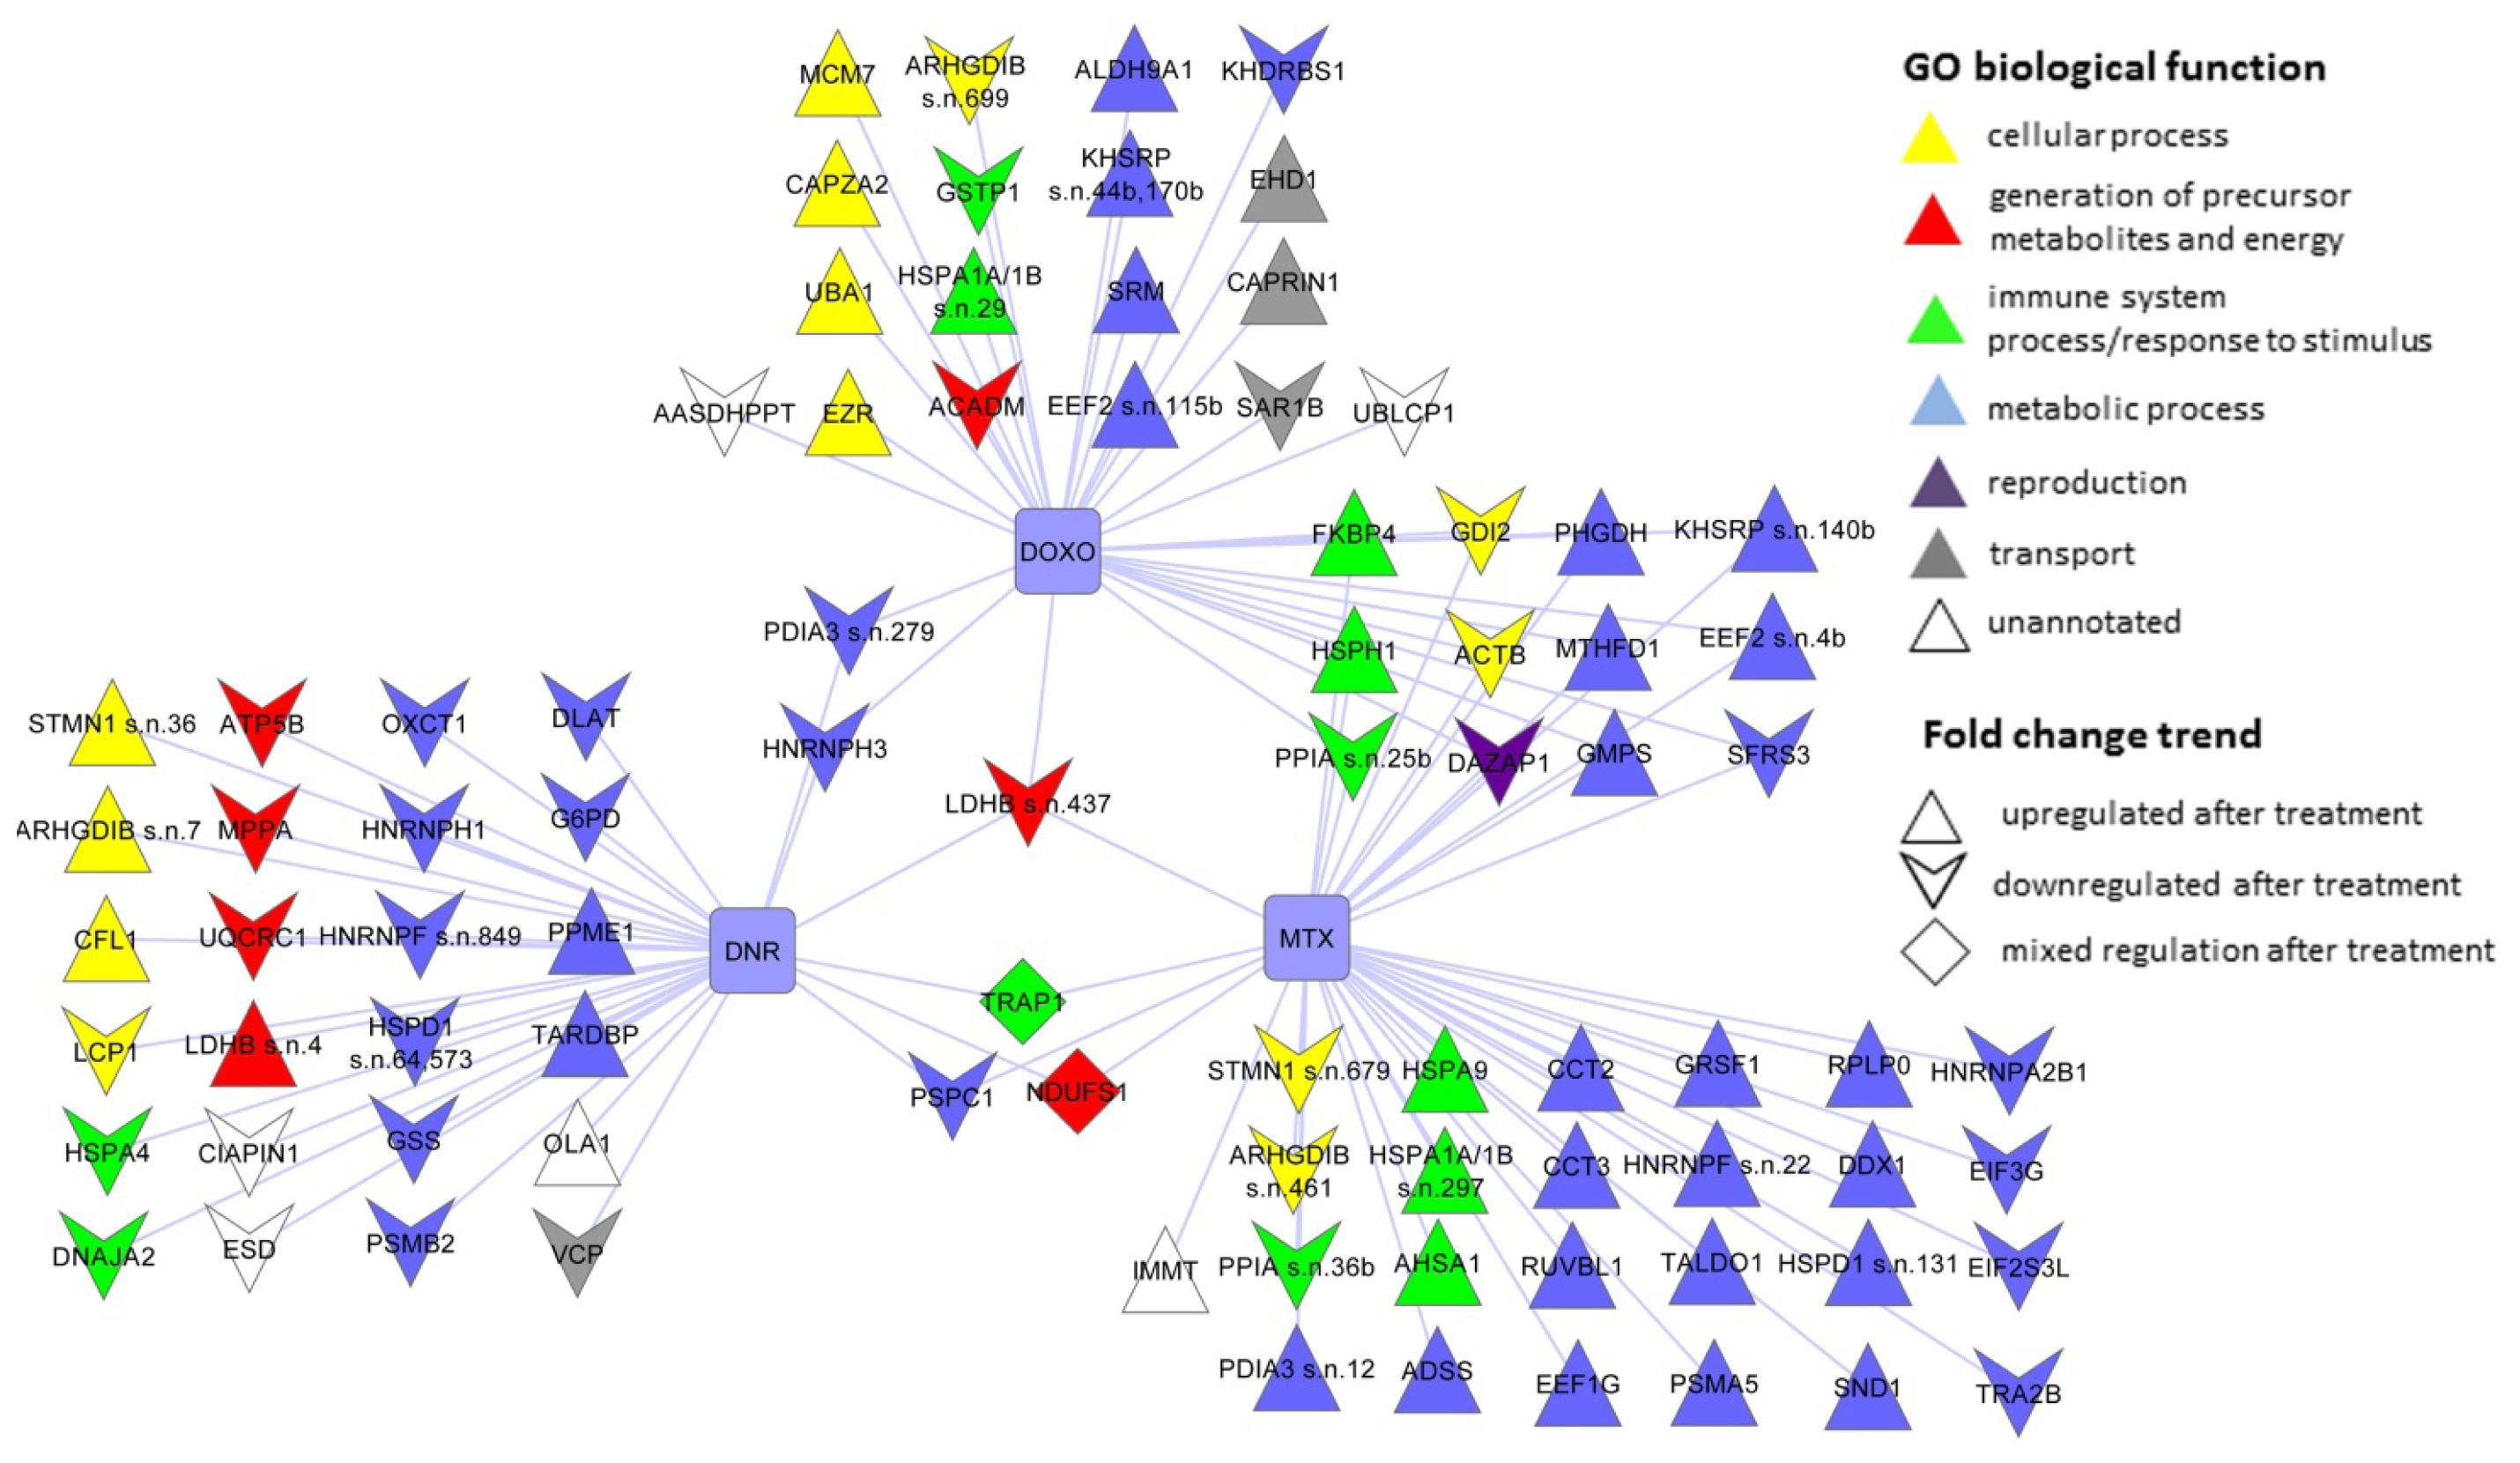
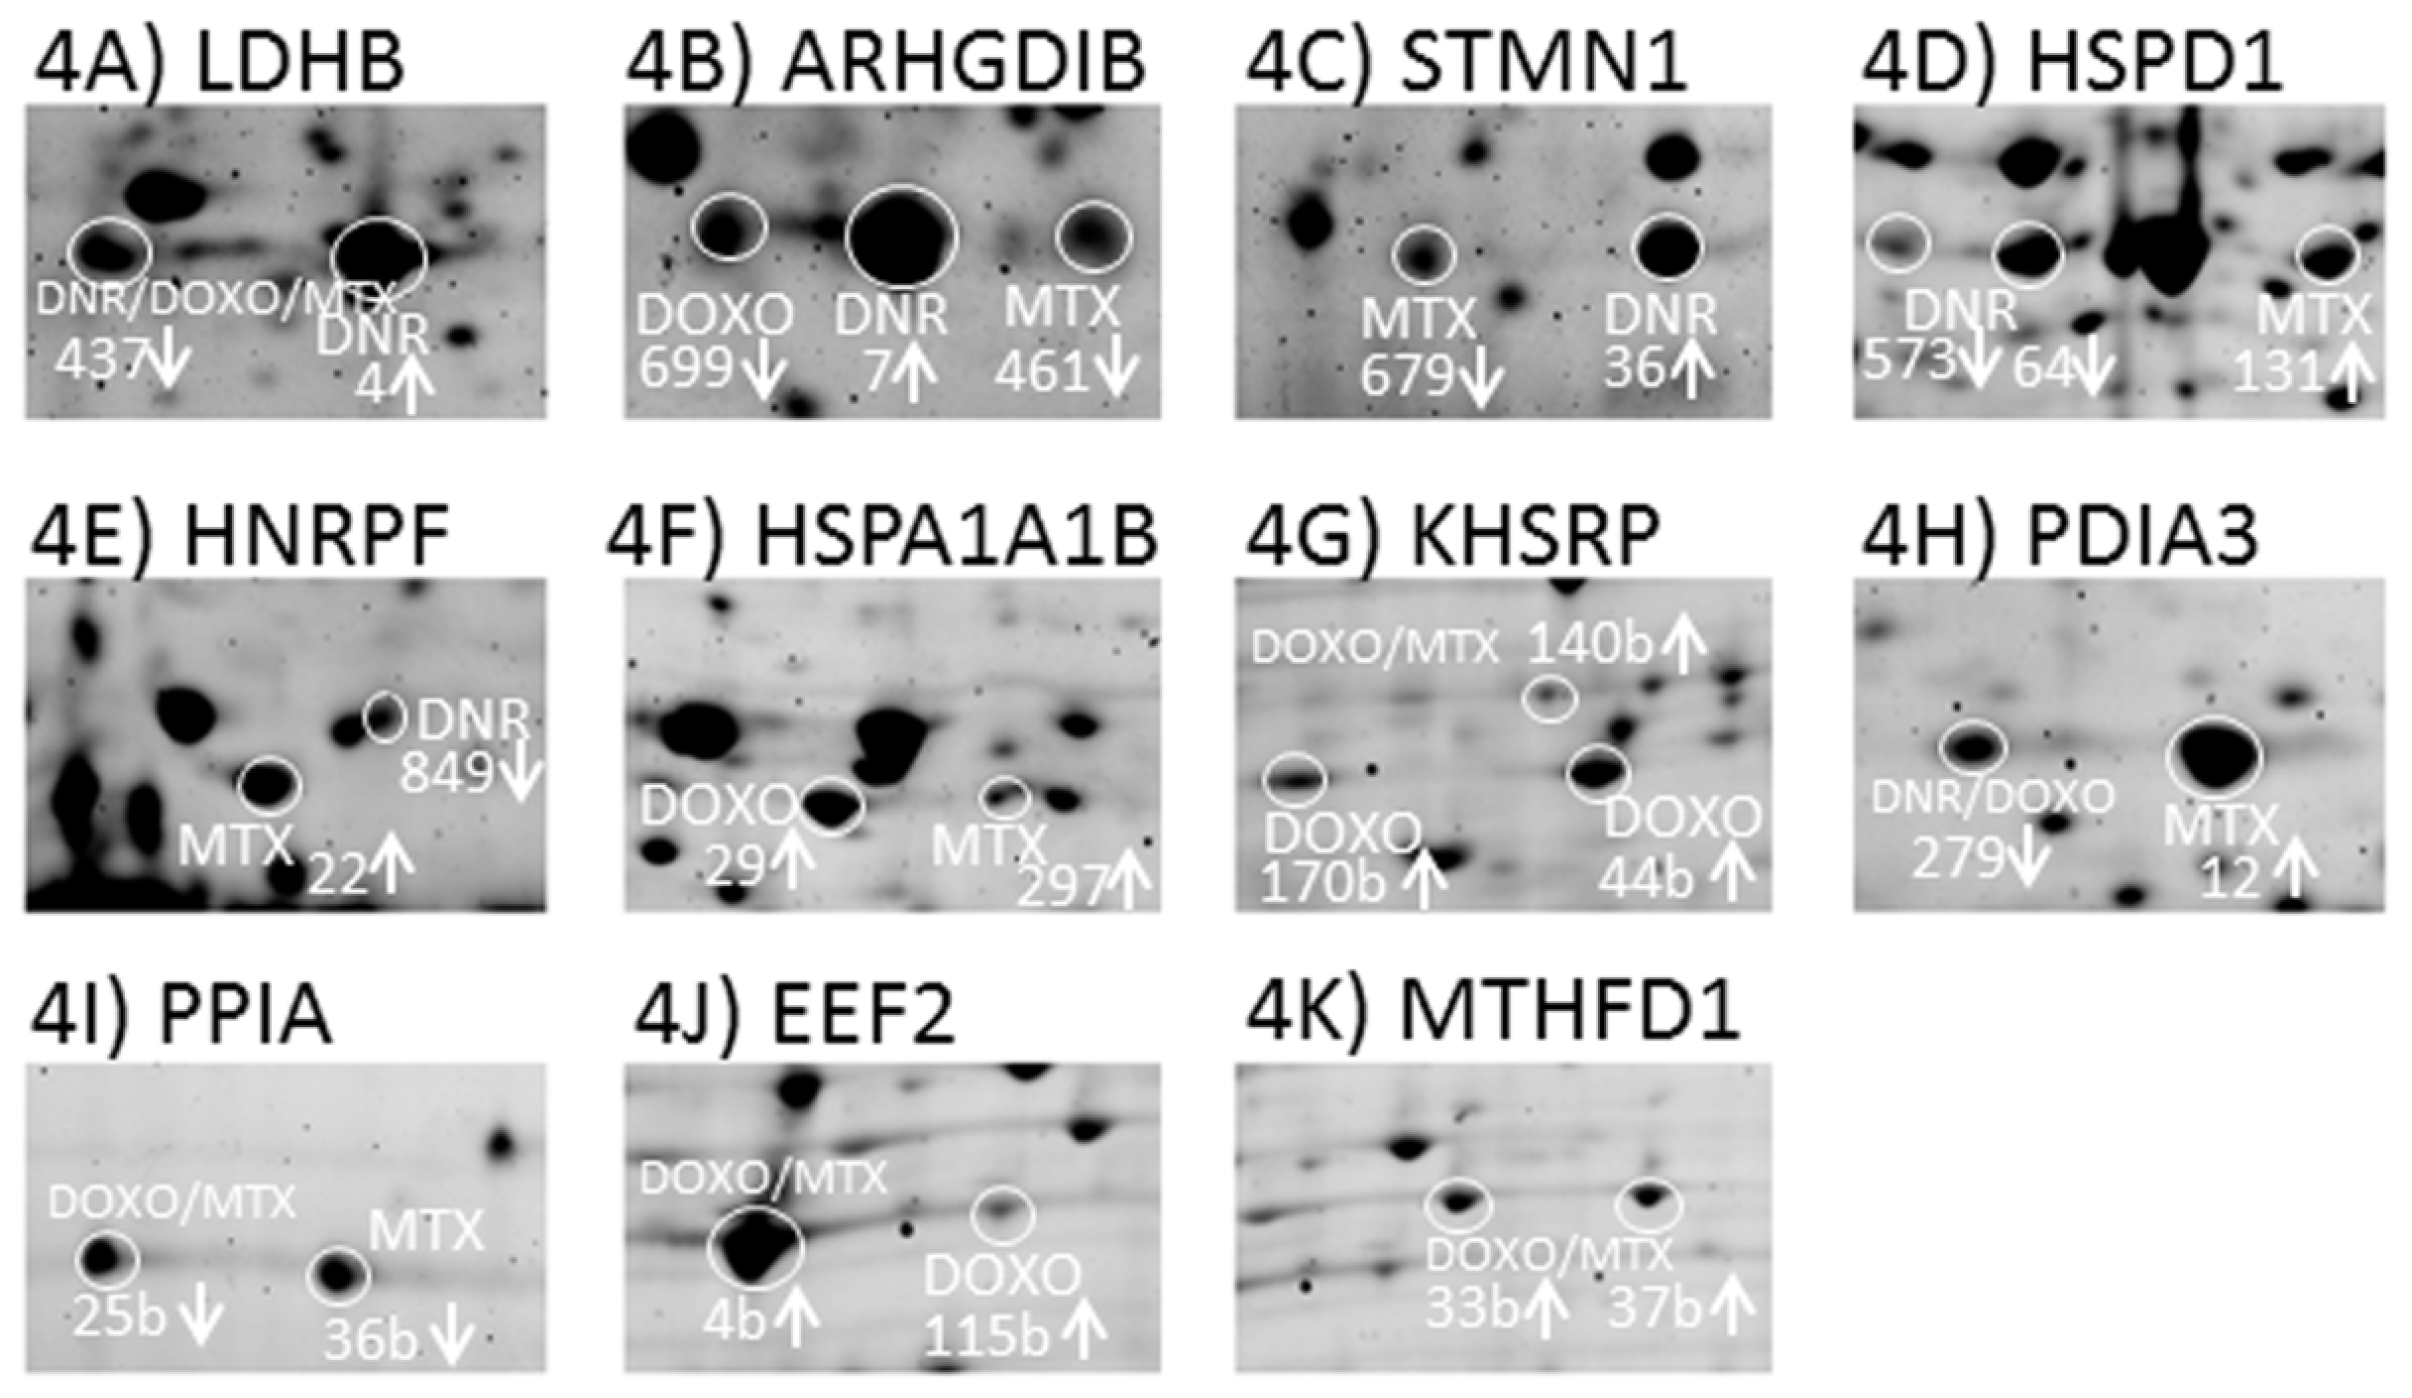
2.3. The Proteins Significantly Changing Their Abundance after Treatment by Individual Anthracycline/Anthracenedione Drugs and Their Distribution by Biological Processes
2.3.1. DNR Induced Protein Changes
2.3.2. DOXO Induced Protein Changes
2.3.3. MTX Induced Protein Changes
2.4. The Protein Changes Linking the Effects of Anthracycline/Anthracenedione Drugs DNR, DOXO, and MTX
2.5. The Proteins Commonly Affected by Five Anti-Cancer Drugs: Anthracycline/Anthracenedione DNR, DOXO, MTX and Distinct Chemotherapeutics CisPt and TAX
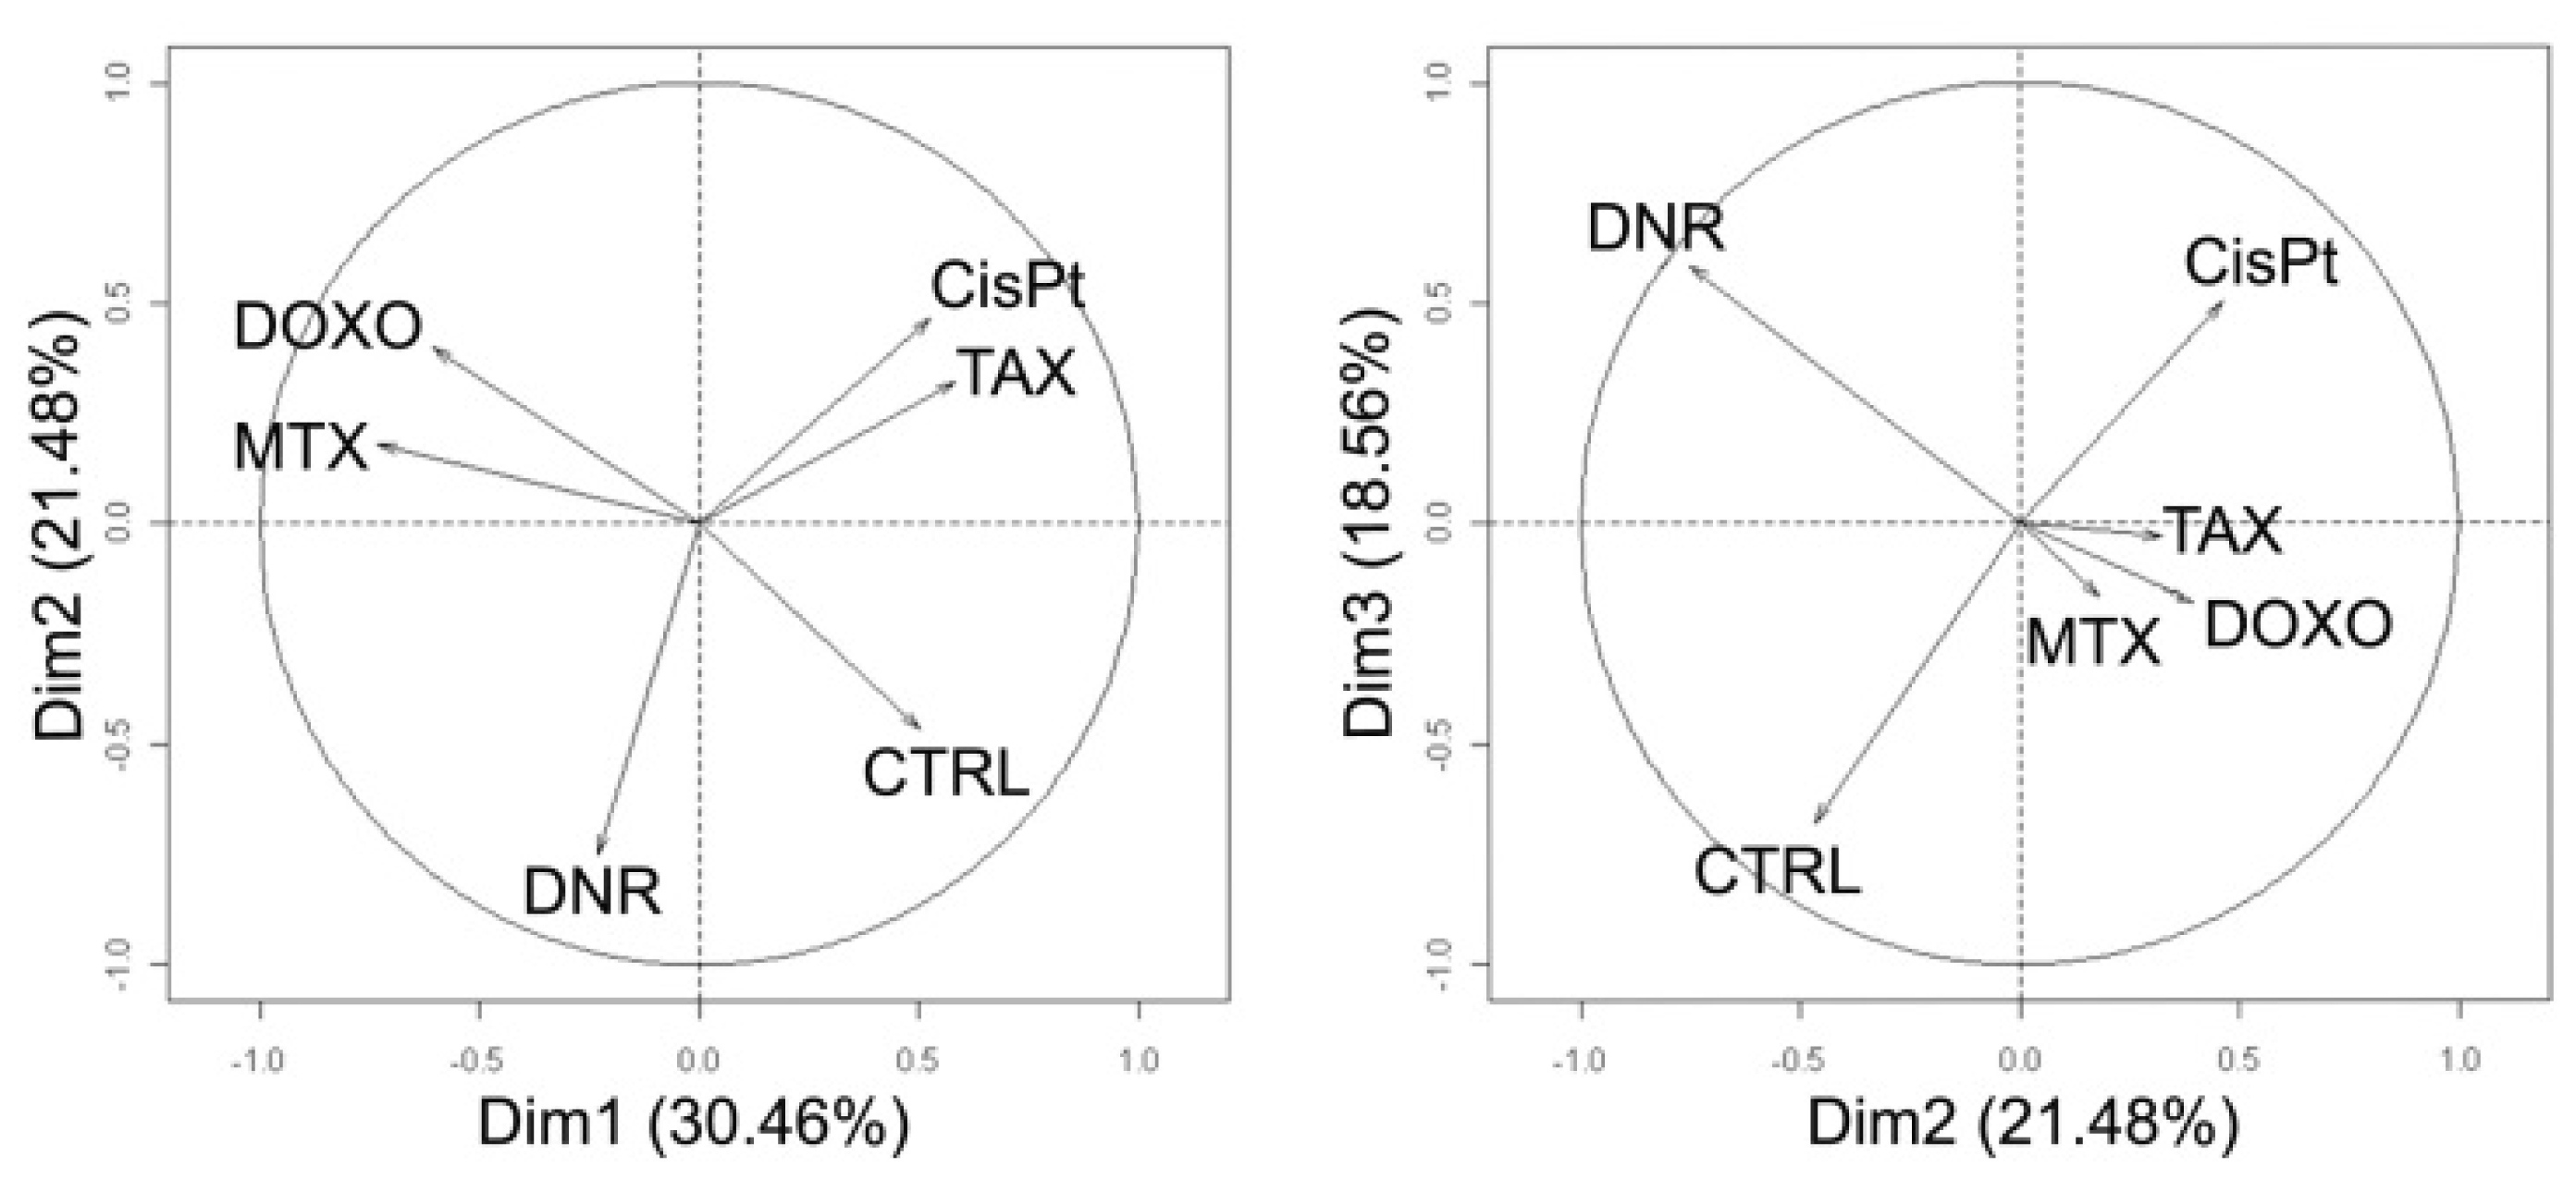
2.6. Principal Component Analysis of Quantitative Data
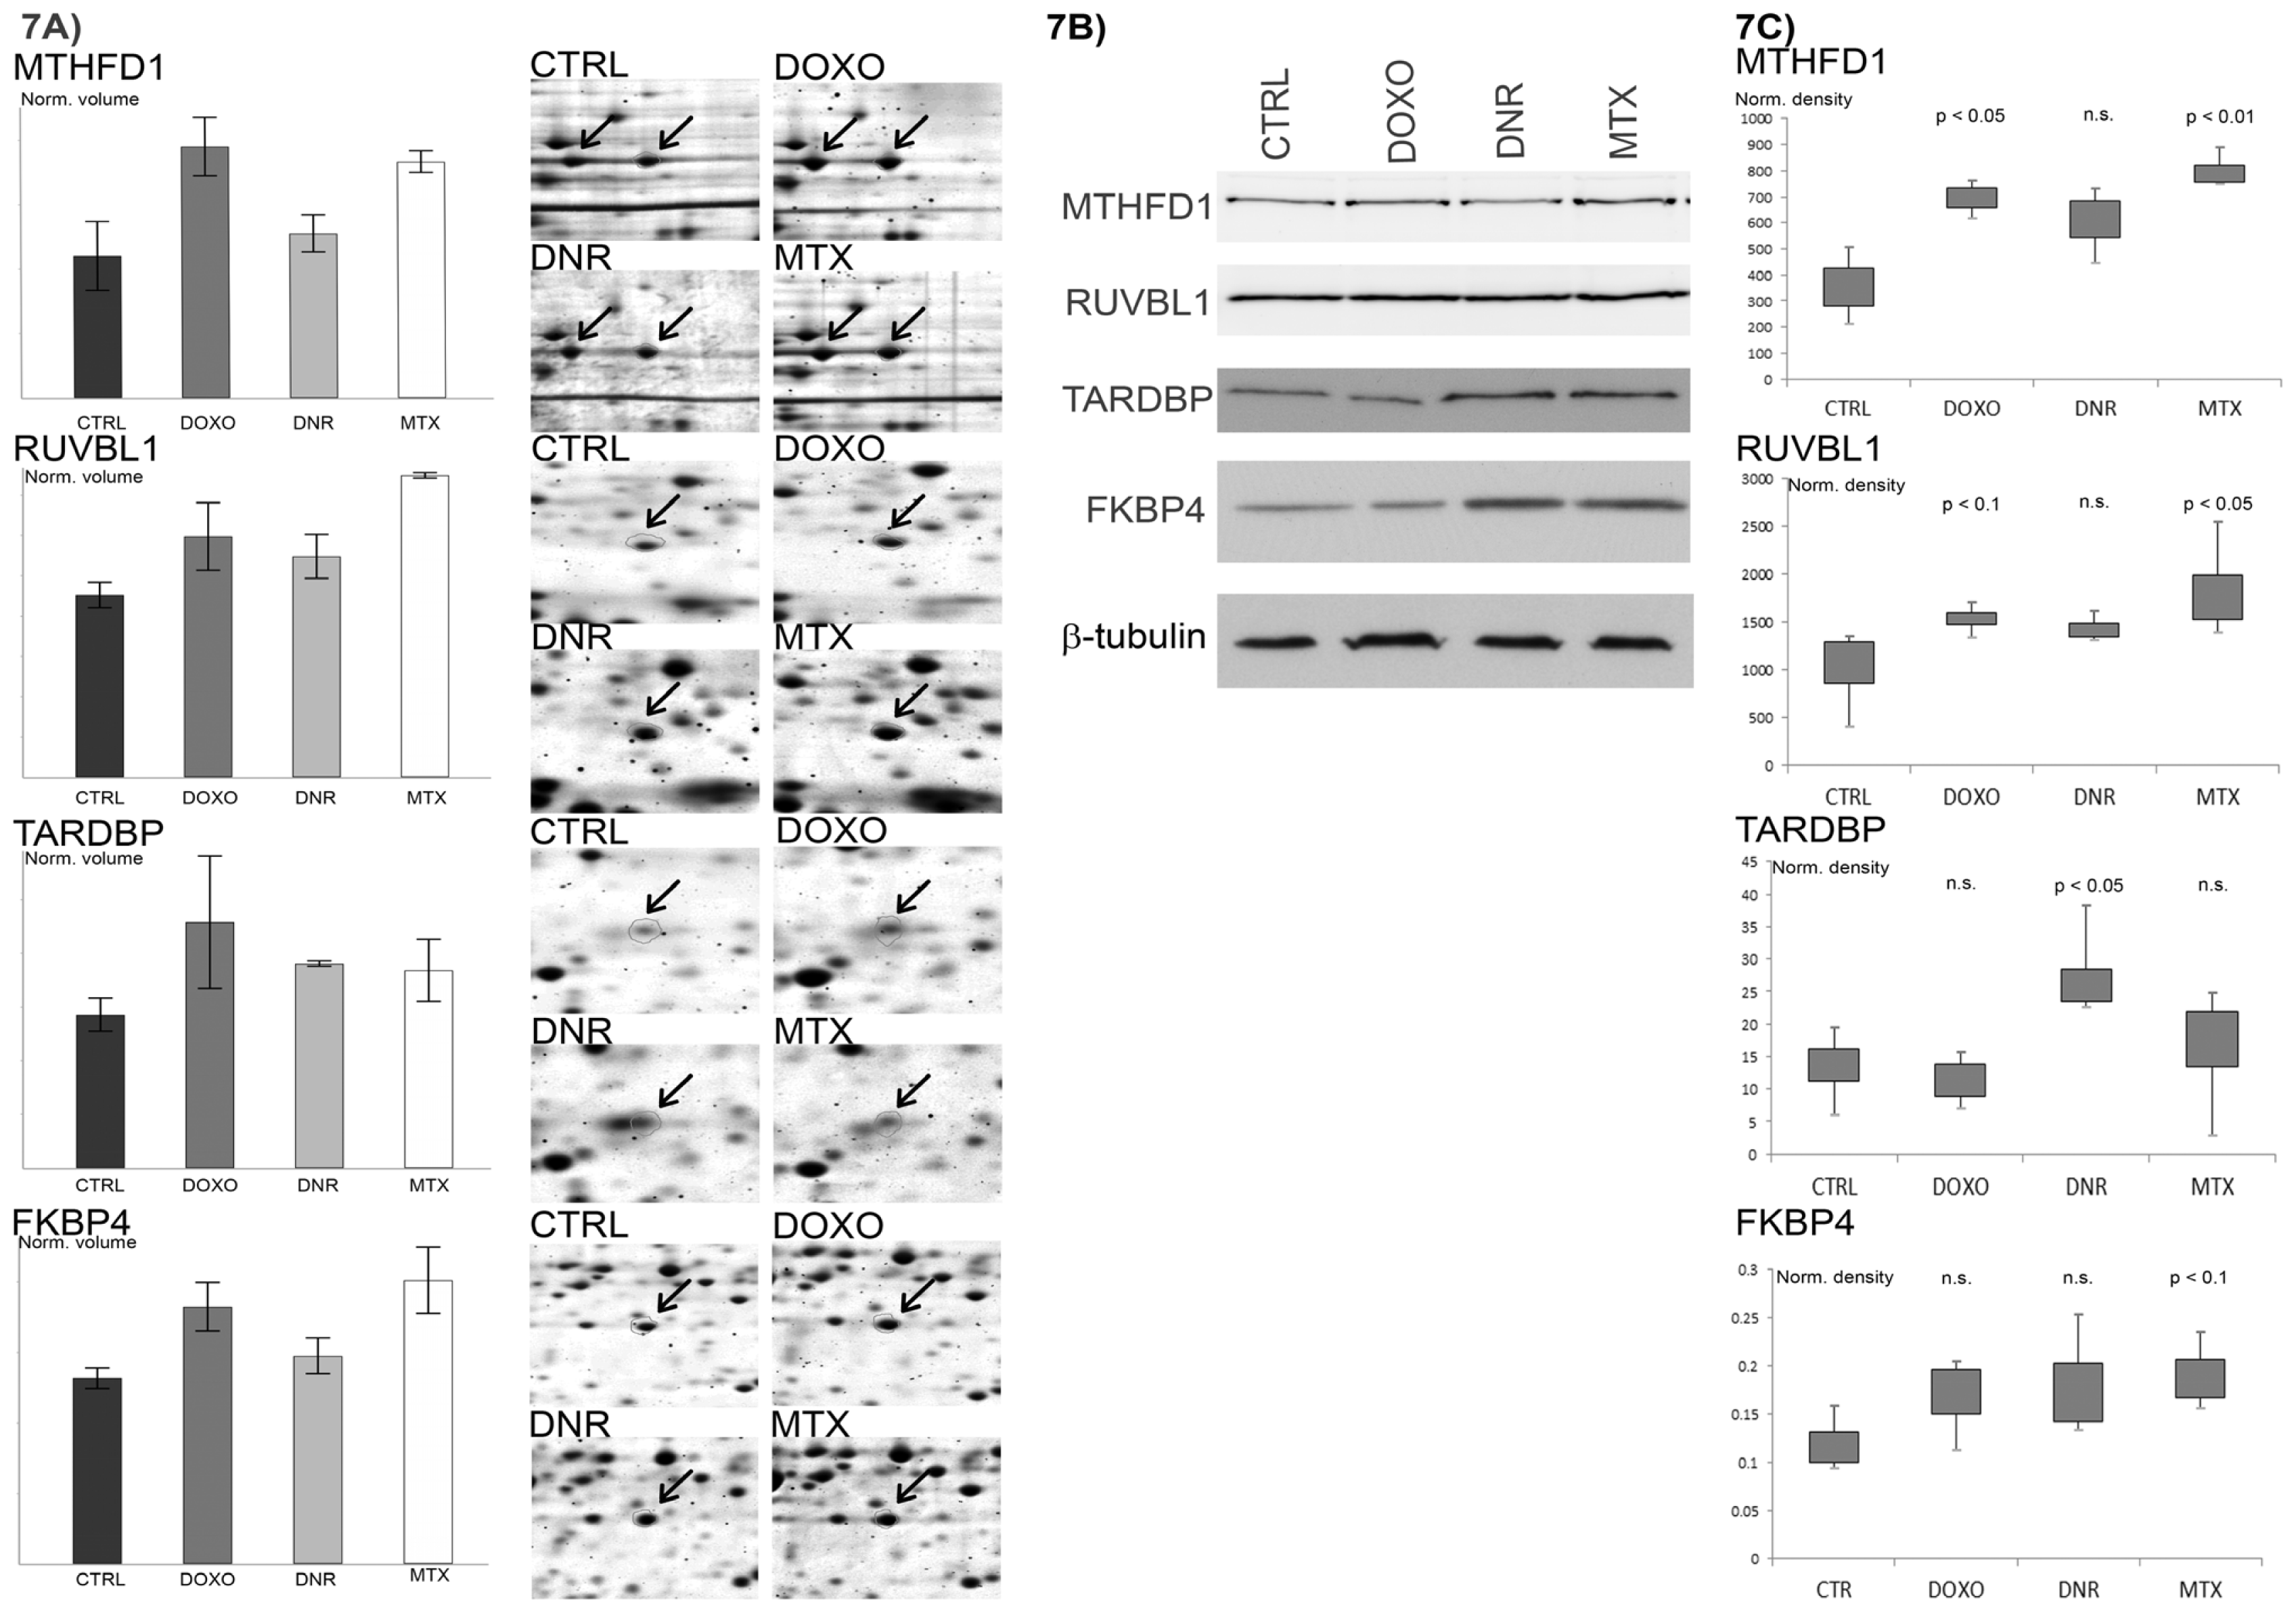
2.7. Verification of Selected Protein Changes Using Immunoblot
3. Discussion
4. Materials and Methods
4.1. Cell Cultures and Sample Preparation—Determination of IC50 and TA50
4.2. Two-Dimensional Gel Electrophoresis (2DE)
4.3. Protein Identification by Mass Spectrometry
4.4. Western Blot Analysis
4.5. Data Analysis Applying Principal Component Analysis (PCA)
4.6. Protein Classification According to Gene Ontology
5. Conclusions
Supplementary Information
ijms-13-15536-s001.pdfAcknowledgments
- Conflict of InterestThe authors declare no conflict of interest.
References
- Carvalho, C.; Santos, R.X.; Cardoso, S.; Correia, S.; Oliveira, P.J.; Santos, M.S.; Moreira, P.I. Doxorubicin: The good, the bad and the ugly effect. Curr. Med. Chem 2009, 16, 3267–3285. [Google Scholar]
- Minotti, G.; Menna, P.; Salvatorelli, E.; Cairo, G.; Gianni, L. Anthracyclines: Molecular advances and pharmacologic developments in antitumor activity and cardiotoxicity. Pharmacol. Rev 2004, 56, 185–229. [Google Scholar]
- Hande, K.R. Clinical applications of anticancer drugs targeted to topoisomerase II. Biochim. Biophys. Acta 1998, 1400, 173–184. [Google Scholar]
- Nitiss, J.L. Targeting DNA topoisomerase II in cancer chemotherapy. Nat. Rev. Cancer 2009, 9, 338–350. [Google Scholar]
- Pommier, Y.; Leo, E.; Zhang, H.; Marchand, C. DNA topoisomerases and their poisoning by anticancer and antibacterial drugs. Chem. Biol 2010, 17, 421–433. [Google Scholar]
- Gewirtz, D.A. A critical evaluation of the mechanisms of action proposed for the antitumor effects of the anthracycline antibiotics adriamycin and daunorubicin. Biochem. Pharmacol 1999, 57, 727–741. [Google Scholar]
- Kremer, L.C.; van Dalen, E.C.; Offringa, M.; Ottenkamp, J.; Voute, P.A. Anthracycline-induced clinical heart failure in a cohort of 607 children: Long-term follow-up study. J. Clin. Oncol 2001, 19, 191–196. [Google Scholar]
- Simunek, T.; Sterba, M.; Popelova, O.; Adamcova, M.; Hrdina, R.; Gersl, V. Anthracycline-induced cardiotoxicity: Overview of studies examining the roles of oxidative stress and free cellular iron. Pharmacol. Rep 2009, 61, 154–171. [Google Scholar]
- Cortes-Funes, H.; Coronado, C. Role of anthracyclines in the era of targeted therapy. Cardiovasc. Toxicol 2007, 7, 56–60. [Google Scholar]
- Hanash, S.; Taguchi, A. The grand challenge to decipher the cancer proteome. Nat. Rev. Cancer 2010, 10, 652–660. [Google Scholar]
- Hammer, E.; Bien, S.; Salazar, M.G.; Steil, L.; Scharf, C.; Hildebrandt, P.; Schroeder, H.W.; Kroemer, H.K.; Volker, U.; Ritter, C.A. Proteomic analysis of doxorubicin-induced changes in the proteome of HepG2cells combining 2-D DIGE and LC-MS/MS approaches. Proteomics 2010, 10, 99–114. [Google Scholar]
- Chen, S.T.; Pan, T.L.; Tsai, Y.C.; Huang, C.M. Proteomics reveals protein profile changes in doxorubicin-treated MCF-7 human breast cancer cells. Cancer Lett 2002, 181, 95–107. [Google Scholar]
- Jiang, Y.J.; Sun, Q.; Fang, X.S.; Wang, X. Comparative mitochondrial proteomic analysis of Rji cells exposed to adriamycin. Mol. Med 2009, 15, 173–182. [Google Scholar]
- Dong, X.; Xiong, L.; Jiang, X.; Wang, Y. Quantitative proteomic analysis reveals the perturbation of multiple cellular pathways in jurkat-T cells induced by doxorubicin. J. Proteome Res 2010, 9, 5943–5951. [Google Scholar]
- Moller, A.; Malerczyk, C.; Volker, U.; Stoppler, H.; Maser, E. Monitoring daunorubicin-induced alterations in protein expression in pancreas carcinoma cells by two-dimensional gel electrophoresis. Proteomics 2002, 2, 697–705. [Google Scholar]
- Keenan, J.; Murphy, L.; Henry, M.; Meleady, P.; Clynes, M. Proteomic analysis of multidrug-resistance mechanisms in adriamycin-resistant variants of DLKP, a squamous lung cancer cell line. Proteomics 2009, 9, 1556–1566. [Google Scholar]
- Murphy, L.; Clynes, M.; Keenan, J. Proteomic analysis to dissect mitoxantrone resistance-associated proteins in a squamous lung carcinoma. Anticancer Res 2007, 27, 1277–1284. [Google Scholar]
- Skalnikova, H.; Halada, P.; Dzubak, P.; Hajduch, M.; Kovarova, H. Protein fingerprints of anti-cancer effects of cyclin-dependent kinase inhibition: identification of candidate biomarkers using 2D liquid phase separation coupled to mass spectrometry. Tech. Cancer Res. Treat 2005, 4, 447–454. [Google Scholar]
- Puustinen, P.; Junttila, M.R.; Vanhatupa, S.; Sablina, A.A.; Hector, M.E.; Teittinen, K.; Raheem, O.; Ketola, K.; Lin, S.; Kast, J.; et al. PME-1 protects extracellular signal-regulated kinase pathway activity from protein phosphatase 2A-mediated inactivation in human malignant glioma. Cancer Res 2009, 69, 2870–2877. [Google Scholar]
- Haley, B.; Paunesku, T.; Protic, M.; Woloschak, G.E. Response of heterogeneous ribonuclear proteins (hnRNP) to ionising radiation and their involvement in DNA damage repair. Int. J. Radiat. Biol 2009, 85, 643–655. [Google Scholar]
- He, Y.; Rothnagel, J.A.; Epis, M.R.; Leedman, P.J.; Smith, R. Downstream targets of heterogeneous nuclear ribonucleoprotein A2 mediate cell proliferation. Mol. Carcinog 2009, 48, 167–179. [Google Scholar]
- Malz, M.; Weber, A.; Singer, S.; Riehmer, V.; Bissinger, M.; Riener, M.O.; Longerich, T.; Soll, C.; Vogel, A.; Angel, P.; et al. Overexpression of far upstream element binding proteins: A mechanism regulating proliferation and migration in liver cancer cells. Hepatology 2009, 50, 1130–1139. [Google Scholar]
- Obchoei, S.; Wongkhan, S.; Wongkham, C.; Li, M.; Yao, Q.; Chen, C. Cyclophilin A: Potential functions and therapeutic target for human cancer. Med. Sci. Monit. 2009, 15, RA221–32. [Google Scholar]
- Wang, W.; Eddy, R.; Condeelis, J. The cofilin pathway in breast cancer invasion and metastasis. Nat. Rev. Cancer 2007, 7, 429–440. [Google Scholar]
- Ren, L.; Hong, S.H.; Cassavaugh, J.; Osborne, T.; Chou, A.J.; Kim, S.Y.; Gorlick, R.; Hewitt, S.M.; Khanna, C. The actin-cytoskeleton linker protein ezrin is regulated during osteosarcoma metastasis by PKC. Oncogene 2009, 28, 792–802. [Google Scholar]
- Skalnikova, H.; Martinkova, J.; Hrabakova, R.; Halada, P.; Dziechciarkova, M.; Hajduch, M.; Gadher, S.J.; Hammar, A.; Enetoft, D.; Ekefjard, A.; et al. Cancer drug-resistance and a look at specific proteins: Rho GDP-dissociation inhibitor 2, Y-box binding protein 1, and HSP70/90 organizing protein in proteomics clinical application. J. Proteome Res 2010, 10, 404–415. [Google Scholar]
- Resendis-Antonio, O.; Checa, A.; Encarnacion, S. Modeling core metabolism in cancer cells: Surveying the topology underlying the Warburg effect. PLoS One 2010, 5, e12383. [Google Scholar]
- Granchi, C.; Roy, S.; De Simone, A.; Salvetti, I.; Tuccinardi, T.; Martinelli, A.; Macchia, M.; Lanza, M.; Betti, L.; Giannaccini, G.; et al. N-Hydroxyindole-based inhibitors of lactate dehydrogenase against cancer cell proliferation. Eur. J. Med. Chem 2011, 46, 5398–5407. [Google Scholar]
- Li, Y.; Ray, P.; Rao, E.J.; Shi, C.; Guo, W.; Chen, X.; Woodruff, E.A., III; Fushimi, K.; Wu, J.Y. A Drosophila model for TDP-43 proteinopathy. Proc. Natl. Acad. Sci. USA 2010, 107, 3169–3174. [Google Scholar]
- Kawahara, Y.; Mieda-Sato, A. TDP-43 promotes microRNA biogenesis as a component of the Drosha and Dicer complexes. Proc. Natl. Acad. Sci. USA 2012, 109, 3347–3352. [Google Scholar]
- Urushitani, M.; Sato, T.; Bamba, H.; Hisa, Y.; Tooyama, I. Synergistic effect between proteasome and autophagosome in the clearance of polyubiquitinated TDP-43. J. Neurosci. Res 2010, 88, 784–797. [Google Scholar]
- Nilsson, J.; Gritli-Linde, A.; Heby, O. Skin fibroblasts from spermine synthase-deficient hemizygous gyro male (Gy/Y) mice overproduce spermidine and exhibit increased resistance to oxidative stress but decreased resistance to UV irradiation. Biochem. J 2000, 352, 381–387. [Google Scholar]
- Chen, Z.; Gopalakrishnan, S.M.; Bui, M.H.; Soni, N.B.; Warrior, U.; Johnson, E.F.; Donnelly, J.B.; Glaser, K.B. 1-Benzyl-3-cetyl-2-methylimidazolium iodide (NH125) induces phosphorylation of eukaryotic elongation factor-2 (eEF2): A cautionary note on the anticancer mechanism of an eEF2 kinase inhibitor. J. Biol. Chem 2011, 286, 43951–43958. [Google Scholar]
- Lukong, K.E.; Larocque, D.; Tyner, A.L.; Richard, S. Tyrosine phosphorylation of sam68 by breast tumor kinase regulates intranuclear localization and cell cycle progression. J. Biol. Chem 2005, 280, 38639–38647. [Google Scholar]
- Lobato, S.; Tafuri, A.; Fernandes, P.A.; Caliari, M.V.; Silva, M.X.; Xavier, M.A.; Vago, A.R. Minichromosome maintenance 7 protein is a reliable biological marker for human cervical progressive disease. J. Gynecol. Oncol 2012, 23, 11–15. [Google Scholar]
- Liu, Y.Z.; Jiang, Y.Y.; Hao, J.J.; Lu, S.S.; Zhang, T.T.; Shang, L.; Cao, J.; Song, X.; Wang, B.S.; Cai, Y.; et al. Prognostic significance of MCM7 expression in the bronchial brushings of patients with non-small cell lung cancer (NSCLC). Lung Cancer 2012, 77, 176–182. [Google Scholar]
- Marnerides, A.; Vassilakopoulos, T.P.; Boltetsou, E.; Levidou, G.; Angelopoulou, M.K.; Thymara, I.; Kyrtsonis, M.C.; Pappi, V.; Tsopra, O.; Panayiotidis, P.; et al. Immunohistochemical expression and prognostic significance of CCND3, MCM2 and MCM7 in Hodgkin lymhoma. Anticancer Res 2011, 31, 3585–3594. [Google Scholar]
- Di Paola, D.; Zannis-Hadjopoulos, M. Comparative analysis of pre-replication complex proteins in transformed and normal cells. J. Cell. Biochem 2012, 113, 1333–1347. [Google Scholar]
- Kumano, M.; Furukawa, J.; Shiota, M.; Zardan, A.; Zhang, F.; Beraldi, E.; Wiedmann, R.M.; Fazli, L.; Zoubeidi, A.; Gleave, M.E. Cotargeting Stress-Activated Hsp27 and Autophagy as a Combinatorial Strategy to Amplify Endoplasmic Reticular Stress in Prostate. Cancer. Mol. Cancer Therapeut. 2012. [Google Scholar] [CrossRef]
- Kaddar, T.; Rouault, J.P.; Chien, W.W.; Chebel, A.; Gadoux, M.; Salles, G.; Ffrench, M.; Magaud, J.P. Two new miR-16 targets: Caprin-1 and HMGA1, proteins implicated in cell proliferation. Biol. Cell 2009, 101, 511–524. [Google Scholar]
- Solomon, S.; Xu, Y.; Wang, B.; David, M.D.; Schubert, P.; Kennedy, D.; Schrader, J.W. Distinct structural features of caprin-1 mediate its interaction with G3BP-1 and its induction of phosphorylation of eukaryotic translation initiation factor 2alpha, entry to cytoplasmic stress granules, and selective interaction with a subset of mRNAs. Mol. Cell Biol 2007, 27, 2324–2342. [Google Scholar]
- Driscoll, J.J.; Woodle, E.S. Targeting the ubiquitin+proteasome system in solid tumors. Semin. Hematol 2012, 49, 277–283. [Google Scholar]
- Rousseau, B.; Menard, L.; Haurie, V.; Taras, D.; Blanc, J.F.; Moreau-Gaudry, F.; Metzler, P.; Hugues, M.; Boyault, S.; Lemiere, S.; et al. Overexpression and role of the ATPase and putative DNA helicase RuvB-like 2 in human hepatocellular carcinoma. Hepatology 2007, 46, 1108–1118. [Google Scholar] [Green Version]
- Luo, B.; Lee, A.S. The critical roles of endoplasmic reticulum chaperones and unfolded protein response in tumorigenesis and anticancer therapies. Oncogene 2012. [Google Scholar] [CrossRef]
- Calderwood, S.K.; Murshid, A.; Gong, J. Heat shock proteins: Conditional mediators of inflammation in tumor immunity. Front. Immunol 2012, 3, 75. [Google Scholar]
- Tsuji, T.; Matsuzaki, J.; Caballero, O.L.; Jungbluth, A.A.; Ritter, G.; Odunsi, K.; Old, L.J.; Gnjatic, S. Heat shock protein 90-mediated peptide-selective presentation of cytosolic tumor antigen for direct recognition of tumors by CD4(+) T cells. J. Immunol 2012, 188, 3851–3858. [Google Scholar]
- Kiyamova, R.; Garifulin, O.; Gryshkova, V.; Kostianets, O.; Shyian, M.; Gout, I.; Filonenko, V. Preliminary study of thyroid and colon cancers-associated antigens and their cognate autoantibodies as potential cancer biomarkers. Biomarkers 2012, 17, 362–371. [Google Scholar]
- Fucikova, J.; Kralikova, P.; Fialova, A.; Brtnicky, T.; Rob, L.; Bartunkova, J.; Spisek, R. Human tumor cells killed by anthracyclines induce a tumor-specific immune response. Cancer Res 2011, 71, 4821–4833. [Google Scholar]
- Jia, R.; Li, C.; McCoy, J.P.; Deng, C.X.; Zheng, Z.M. SRp20 is a proto-oncogene critical for cell proliferation and tumor induction and maintenance. Int. J. Biol. Sci 2010, 6, 806–826. [Google Scholar]
- Passon, D.M.; Lee, M.; Rackham, O.; Stanley, W.A.; Sadowska, A.; Filipovska, A.; Fox, A.H.; Bond, C.S. Structure of the heterodimer of human NONO and paraspeckle protein component 1 and analysis of its role in subnuclear body formation. Proc. Natl. Acad. Sci. USA 2012, 109, 4846–4850. [Google Scholar]
- Mihal, V.; Hajduch, M.; Noskova, V.; Janostakova, A.; Safarova, M.; Orel, M.; Kouzmina, G.; Stary, J.; Blazek, B.; Pospisilova, D. The analysis of correlations between drug resistance and clinical/laboratory measures found in a group of children with all treated by ALL-BFM 90 protocol. Bull. Cancer 2004, 91, 10080–10089. [Google Scholar]
- Lee, B.W.; Johnson, G.L.; Hed, S.A.; Darzynkiewicz, Z.; Talhouk, J.W.; Mehrotra, S. DEVDase detection in intact apoptotic cells using the cell permeant fluorogenic substrate, (z-DEVD)2-cresyl violet. Biotechniques 2003, 35, 1080–1085. [Google Scholar]
- Luche, S.; Diemer, H.; Tastet, C.; Chevallet, M.; van Dorsselaer, A.; Leize-Wagner, E.; Rabilloud, T. About thiol derivatization and resolution of basic proteins in two-dimensional electrophoresis. Proteomics 2004, 4, 551–561. [Google Scholar] [Green Version]
- Hardy, E.; Castellanos-Serra, L.R. “Reverse-staining” of biomolecules in electrophoresis gels: Analytical and micropreparative applications. Anal. Biochem 2004, 328, 1–13. [Google Scholar]
- Gobom, J.; Nordhoff, E.; Mirgorodskaya, E.; Ekman, R.; Roepstorff, P. Sample purification and preparation technique based on nano-scale reversed-phase columns for the sensitive analysis of complex peptide mixtures by matrix-assisted laser desorption/ionization mass spectrometry. J. Mass Spectrom 1999, 34, 105–116. [Google Scholar]
- Jarkovska, K.; Martinkova, J.; Liskova, L.; Halada, P.; Moos, J.; Rezabek, K.; Gadher, S.J.; Kovarova, H. Proteome mining of human follicular fluid reveals a crucial role of complement cascade and key biological pathways in women undergoing in vitro fertilization. J. Proteome Res 2010, 9, 1289–1301. [Google Scholar]
- Team RDevelopment Core, R: A Language and Environment for Statistical Computing; R Foundation for Statistical Computing: Vienna, Austria; p. 2011.
- Thomas, P.D.; Campbell, M.J.; Kejariwal, A.; Mi, H.; Karlak, B.; Daverman, R.; Diemer, K.; Muruganujan, A.; Narechania, A. PANTHER: A library of protein families and subfamilies indexed by function. Genome Res 2003, 13, 2129–2141. [Google Scholar]


| Anti-cancer drug | Abbreviation | Mechanism of action | 10× IC50 (μg/mL) | TA50 (min) |
|---|---|---|---|---|
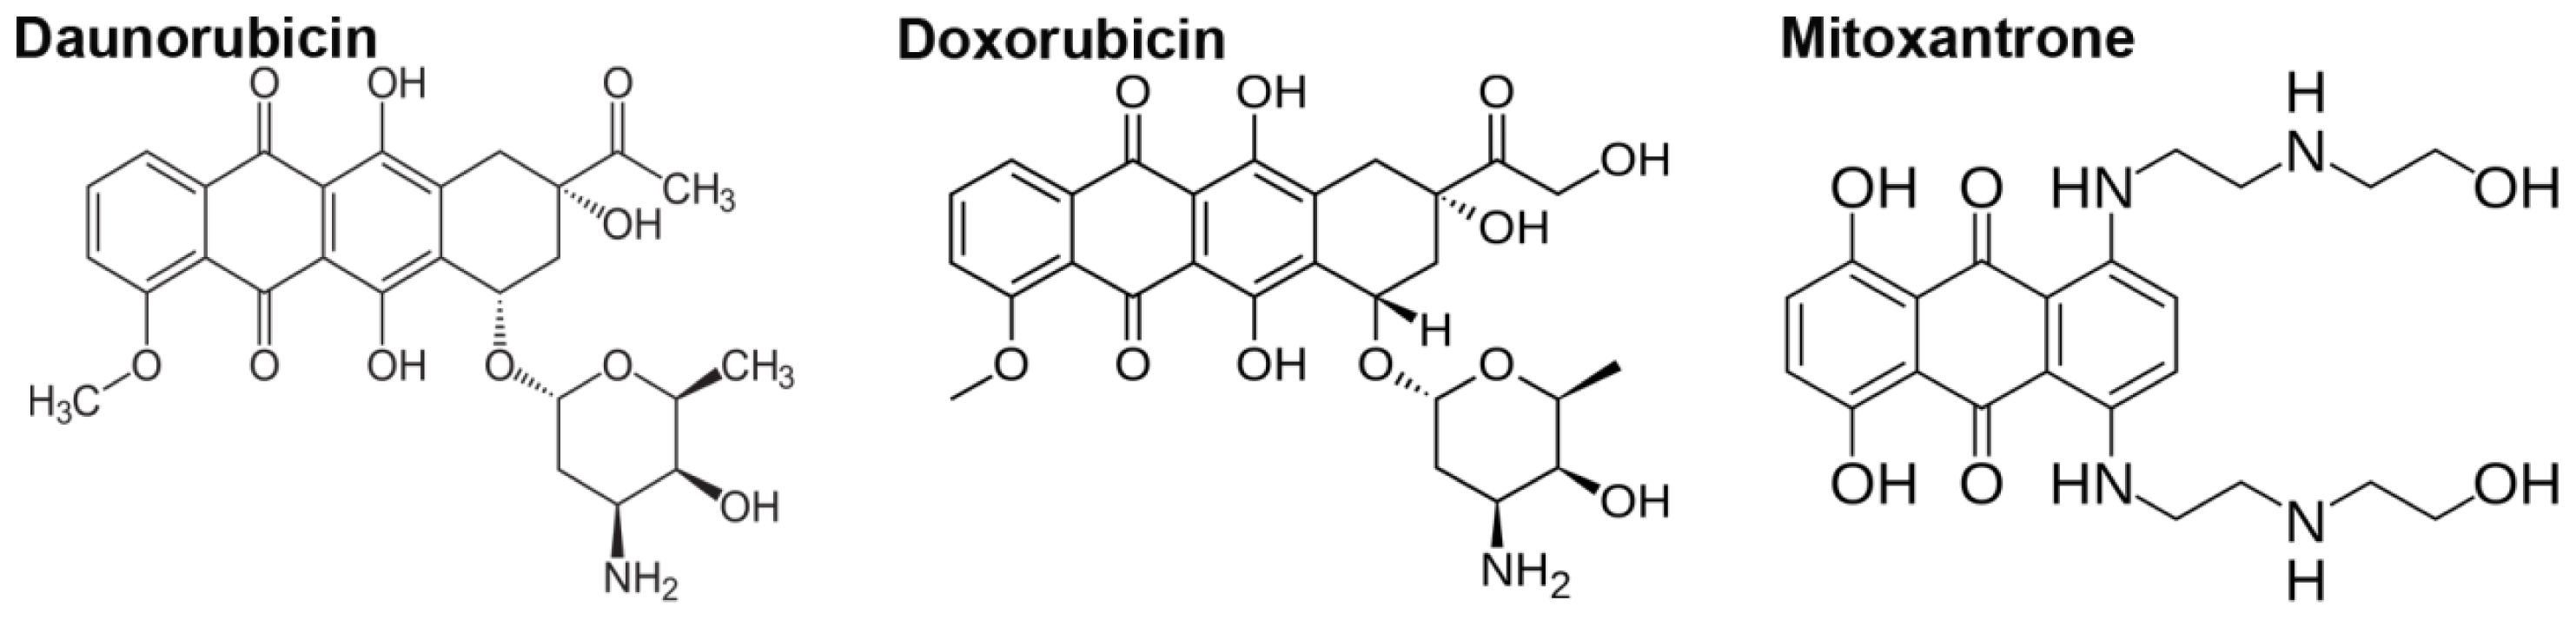
| Daunorubicin | DNR | intercalation, topo II inhibitor | 0.03 | 120 |
| Doxorubicin | DOXO | intercalation, topo II inhibitor | 0.05 | 250 |
| Mitoxantrone | MTX | intercalation, topo II inhibitor | 1.88 × 10⁻³ | 150 |
| Cisplatin | CisPt | alkylating-like | 7.57 | 150 |
| Paclitaxel | TAX | mitotic inhibitor | 9.00 × 10⁻⁵ | 120 |
| Anti-cancer drug | No. Different Spot | 4–7 | No. ID proteins | No. Different Spot | 6–11 | No. ID proteins | No. Different Spot | Total | No. ID proteins | |||
|---|---|---|---|---|---|---|---|---|---|---|---|---|
| Up Down | Up Down | Up Down | ||||||||||
| DNR | 32 | 8 | 24 | 24 | 8 | 1 | 7 | 5 | 40 | 9 | 31 | 29 |
| DOXO | 29 | 15 | 14 | 21 | 18 | 13 | 5 | 10 | 47 | 28 | 19 | 31 |
| MTX | 40 | 24 | 16 | 30 | 14 | 9 | 5 | 10 | 54 | 33 | 21 | 40 |
| CisPt | 24 | 21 | 3 | 18 | 23 | 16 | 7 | 13 | 47 | 37 | 10 | 31 |
| TAX | 29 | 25 | 4 | 21 | 2 | 1 | 1 | 1 | 31 | 26 | 5 | 22 |
| Total | 154 | 93 | 61 | 114 | 65 | 40 | 25 | 39 | 219 | 133 | 86 | 153 |
| 3A | DNR | ||||||||
|---|---|---|---|---|---|---|---|---|---|
| Drug | Spot No. | Protein name | Gene Name | UniProt No. | Biological process | pH | Change | Fold change | p-value |
| DNR | 4 | l-lactate dehydrogenase B chain | LDHB | P07195 | 3 | 4–7 | ↑ | 1.34 | 0.0048 |
| DNR | 7 | Rho GDP-dissociation inhibitor 2 | ARHGDIB | P52566 | 1 | 4–7 | ↑ | 1.69 | 0.008 |
| DNR | 36 | Stathmin | STMN1 | P16949 | 1 | 4–7 | ↑ | 1.75 | 0.0022 |
| DNR | 64 | 60 kD a heat shock protein, mitochondrial | HSPD1 | P10809 | 5 | 4–7 | ↓ | 1.52 | 0.0023 |
| DNR | 72b | Proteasome subunit beta type-2 | PSMB2 | P49721 | 5 | 6–11 | ↓ | 1.70 | 0033 |
| DNR | 96b | Obg-like ATPase 1 | OLA1 | Q9NTK5 | 8 | 6–11 | ↑ | 1.34 | 0.0022 |
| DNR | 97 | Cytochrome b-c1 complex subunit 1, mitochondrial | UQCRC1 | P31930 | 3 | 4–7 | ↓ | 1.36 | 0.0041 |
| DNR | 107b | Glucose-6-phosphate 1-dehydrogenase | G6PD | P11413 | 5 | 6–11 | ↓ | 2.95 | 0.0013 |
| DNR | 124b | S-formylglutathione hydrolase | ESD | P10768 | 8 | 6–11 | ↓ | 2.22 | 0.009 |
| DNR | 125 | Heat shock 70 kDa protein 4 | HSPA4 | P34932 | 4 | 4–7 | ↓ | 2.25 | 0.0076 |
| DNR | 126 | Cofilin-1 | CFL1 | P23528 | 1 | 4–7 | ↑ | 2.01 | 0.0045 |
| DNR | 159 | Succinyl-CoA: 3-ketoacid-coenzyme A transferase 1, mitochondrial | OXCT1 | P55809 | 5 | 4–7 | ↓ | 1.67 | 0.0059 |
| DNR | 166 | Dihydrolipoyllysine-residue acetyltransferase component of pyruvate dehydrogenase complex, mitochondrial | DLAT | P10515 | 5 | 4–7 | ↓ | 2.34 | 0.0004 |
| DNR | 220 | Heterogeneous nuclear ribonucleoprotein H | HNRNPH1 | P31943 | 5 | 4–7 | ↓ | 1.56 | 0.0017 |
| DNR | 221 | Plastin-2 | LCP1 | P13796 | 1 | 4–7 | ↓ | 1.63 | 0.0093 |
| DNR | 287 | DnaJ homolog subfamily A member 2 | DNAJA2 | O60884 | 4 | 4–7 | ↓ | 1.63 | 0.0021 |
| DNR | 346 | Transitional endoplasmic reticulum ATPase | VCP | P55072 | 7 | 4–7 | ↓ | 2.55 | 0.0098 |
| DNR | 360 | Mitochondrial-processing peptidase subunit alpha | PMPCA | Q10713 | 3 | 4–7 | ↓ | 1.66 | 0.0029 |
| DNR | 399 | Anamorsin | CIAPIN1 | Q6FI81 | 8 | 4–7 | ↓ | 1.47 | 0.0049 |
| DNR | 407 | Protein phosphatase methylesterase 1 | PPME1 | Q9Y570 | 5 | 4–7 | ↑ | 1.44 | 0.0083 |
| DNR | 424 | ATP synthase subunit beta, mitochondrial | ATP5B | P06576 | 3 | 4–7 | ↓ | 2.21 | 0.0009 |
| DNR | 573 | 60 kDa heat shock protein, mitochondrial | HSPD1 | P10809 | 5 | 4–7 | ↓ | 1.72 | 0.0009 |
| DNR | 574 | TAR DNA-binding protein 43 | TARDBP | Q13148 | 5 | 4–7 | ↑ | 1.33 | 0.0065 |
| DNR | 768 | Glutathione synthetase | GSS | P48637 | 5 | 4–7 | ↓ | 2.00 | 0.0019 |
| DNR | 849 | Heterogeneous nuclear ribonucleoprotein F | HNRNPF | P52597 | 5 | 4–7 | ↓ | 1.71 | 0.009 |
| 3B | DOXO | ||||||||
| DOXO | 29 | Heat shock 70 kDa protein 1A/1B | HSPA1A/HSPA1B | P08107 | 4 | 4–7 | ↑ | 1.43 | 0.0073 |
| DOXO | 44b | Far upstream element-binding protein 2 | KHSRP | Q92945 | 5 | 6–11 | ↑ | 1.53 | 0.0079 |
| DOXO | 61b | KH domain-containing, RNA-binding, signal transduction-associated protein 1 | KHDRBS1 | Q07666 | 5 | 6–11 | ↓ | 1.78 | 0.0004 |
| DOXO | 63b | EH domain-containing protein 1 | EHD1 | Q9H4M9 | 7 | 6–11 | ↑ | 1.79 | 0.049 |
| DOXO | 91 | DNA replication licensing factor MCM7 | MCM7 | P33993 | 1 | 4–7 | ↑ | 1.56 | 0.0081 |
| DOXO | 115b | Elongation factor 2 | EEF2 | P13639 | 5 | 6–11 | ↑ | 1.54 | 0.0023 |
| DOXO | 141 | Caprin-1 | CAPRIN1 | Q14444 | 7 | 4–7 | ↑ | 1.54 | 0.0008 |
| DOXO | 163b | Medium-chain specific acyl-CoA dehydrogenase, mitochondrial | ACADM | P11310 | 3 | 6–11 | ↓ | 1.45 | 0.0025 |
| DOXO | 170b | Far upstream element-binding protein 2 | KHSRP | Q92945 | 5 | 6–11 | ↑ | 1.89 | 0.0013 |
| DOXO | 278 | Spermidine synthase | SRM | P19623 | 5 | 4–7 | ↑ | 1.64 | 0.0049 |
| DOXO | 282 | Ubiquitin-like modifier-activating enzyme 1 | UBA1 | P22314 | 1 | 4–7 | ↑ | 1.97 | 0.0062 |
| DOXO | 308 | F-actin-capping protein subunit alpha-2 | CAPZA2 | P47755 | 1 | 4–7 | ↑ | 1.45 | 0.0098 |
| DOXO | 364 | 4-trimethylaminobutyraldehyde dehydrogenase | ALDH9A1 | P49189 | 5 | 4–7 | ↑ | 1.51 | 0.0033 |
| DOXO | 592 | Ezrin | EZR | P15311 | 1 | 4–7 | ↑ | 2.59 | 0.0071 |
| DOXO | 595 | l-aminoadipate-semialdehyde dehydrogenase-phosphopantetheinyl transferase | AASDHPPT | Q9NRN7 | 8 | 4–7 | ↓ | 1.54 | 0.0009 |
| DOXO | 630 | Ubiquitin-like domain-containing CTD phosphatase 1 | UBLCP1 | Q8WVY7 | 8 | 4–7 | ↓ | 1.36 | 0.0025 |
| DOXO | 699 | Rho GDP-dissociation inhibitor 2 | ARHGDIB | P52566 | 1 | 4–7 | ↓ | 2.00 | 0.0015 |
| DOXO | 787 | Glutathione S-transferase P | GSTP1 | P09211 | 4 | 4–7 | ↓ | 1.54 | 0.0089 |
| DOXO | 908 | GTP-binding protein SAR1b | SAR1B | Q9Y6B6 | 7 | 4–7 | ↓ | 1.33 | 0.0073 |
| 3C | MTX | ||||||||
| MTX | 11 | Elongation factor 1-gamma | EEF1G | P26641 | 5 | 4–7 | ↑ | 1.32 | 0.0056 |
| MTX | 12 | Protein disulfide-isomerase A3 | PDIA3 | P30101 | 5 | 4–7 | ↑ | 1.48 | 0.0056 |
| MTX | 22 | Heterogeneous nuclear ribonucleoprotein F | HNRNPF | P52597 | 5 | 4–7 | ↑ | 1.37 | 0.0011 |
| MTX | 24 | Stress-70 protein, mitochondrial | HSPA9 | P38646 | 4 | 4–7 | ↑ | 1.47 | 0.007 |
| MTX | 25 | 60 S acidic ribosomal protein P0 | RPLP0 | P05388 | 5 | 4–7 | ↑ | 1.3 | 0.0012 |
| MTX | 30b | Staphylococcal nuclease domain-containing protein 1 | SND1 | Q7KZF4 | 5 | 6–11 | ↑ | 1.53 | 0.024 |
| MTX | 35 | T-complex protein 1 subunit beta | CCT2 | P78371 | 5 | 4–7 | ↑ | 1.47 | 0.0017 |
| MTX | 36b | Peptidyl-prolyl cis-trans isomerase | PPIA | P62937 | 4 | 6–11 | ↓ | 1.75 | 0.0072 |
| MTX | 68 | T-complex protein 1 subunit gamma | CCT3 | P49368 | 5 | 4–7 | ↑ | 1.56 | 0.00014 |
| MTX | 83 | Activator of 90 kDa heat shock protein ATPase homolog 1 | AHSA1 | O95433 | 4 | 4–7 | ↑ | 1.47 | 0.00035 |
| MTX | 109b | Heterogeneous nuclear ribonucleoproteins A2/B1 | HNRNPA2B1 | P22626 | 5 | 6–11 | ↓ | 1.87 | 0.0071 |
| MTX | 110b | ATP-dependent RNA helicase DDX1 | DDX1 | Q92499 | 5 | 6–11 | ↑ | 1.51 | 0.008 |
| MTX | 116 | RuvB-like 1 | RUVBL1 | Q9Y265 | 5 | 4–7 | ↑ | 1.66 | 0.00004 |
| MTX | 128b | Eukaryotic translation initiation factor 2 subunit 3 | EIF2S3L | Q2VIR3 | 5 | 6–11 | ↓ | 1.73 | 0.02 |
| MTX | 131 | 60 kDa heat shock protein, mitochondrial | HSPD1 | P10809 | 5 | 4–7 | ↑ | 1.52 | 0.001 |
| MTX | 136 | Transaldolase | TALDO1 | P37837 | 5 | 4–7 | ↑ | 1.33 | 0.0042 |
| MTX | 223 | Mitochondrial inner membrane protein | IMMT | Q16891 | 8 | 4–7 | ↑ | 1.58 | 0.0028 |
| MTX | 230 | Proteasome subunit alpha type-5 | PSMA5 | P28066 | 5 | 4–7 | ↑ | 2.51 | 0,004 |
| MTX | 297 | Heat shock 70 kDa protein 1A/1B | HSPA1A/HSPA1B | P08107 | 4 | 4–7 | ↑ | 1.36 | 0.0066 |
| MTX | 455 | G-rich sequence factor 1 | GRSF1 | Q12849 | 5 | 4–7 | ↑ | 1.66 | 0.0016 |
| MTX | 461 | Rho GDP-dissociation inhibitor 2 | ARHGDIB | P52566 | 1 | 4–7 | ↓ | 1.46 | 0.0033 |
| MTX | 466 | Eukaryotic translation initiation factor 3 subunit G | EIF3G | O75821 | 5 | 4–7 | ↓ | 1.46 | 0.002 |
| MTX | 615 | Transformer-2 protein homolog beta | TRA2B | P62995 | 5 | 4–7 | ↓ | 1.93 | 0.0025 |
| MTX | 647 | Mitochondrial inner membrane protein | IMMT | Q16891 | 8 | 4–7 | ↑ | 1.34 | 0.0006 |
| MTX | 679 | Stathmin | STMN1 | P16949 | 1 | 4–7 | ↓ | 2.26 | 0.0028 |
| MTX | 1050 | Adenylosuccinate synthetase isozyme 2 | ADSS | P30520 | 5 | 4–7 | ↑ | 1.52 | 0.00005 |
| 3D | DNR + DOXO | ||||||||
| DNR | 15b | Heterogeneous nuclear ribonucleoprotein H3 | HNRNPH3 | P31942 | 5 | 6–11 | ↓ | 1.88 | 0.04 |
| DOXO | 15b | Heterogeneous nuclear ribonucleoprotein H3 | HNRNPH3 | P31942 | 5 | 6–11 | ↓ | 2.25 | 0.025 |
| DNR | 279 | Protein disulfide-isomerase A3 | PDIA3 | P30101 | 5 | 4–7 | ↓ | 1.50 | 0.0056 |
| DOXO | 279 | Protein disulfide-isomerase A3 | PDIA3 | P30101 | 5 | 4–7 | ↓ | 1.59 | 0.004 |
| 3E | DNR + MTX | ||||||||
| DNR | 320 | Heat shock protein 75 kDa, mitochondrial | TRAP1 | Q12931 | 4 | 4–7 | ↓ | 1.66 | 0.001 |
| MTX | 320 | Heat shock protein 75 kDa, mitochondrial | TRAP1 | Q12931 | 4 | 4–7 | ↑ | 1.33 | 0.0045 |
| DNR | 413 | NADH-ubiquinone oxidoreductase 75 kDa subunit, mitochondrial | NDUFS1 | P28331 | 3 | 4–7 | ↓ | 1.37 | 0.0015 |
| MTX | 413 | NADH-ubiquinone oxidoreductase 75 kDa subunit, mitochondrial | NDUFS1 | P28331 | 3 | 4–7 | ↑ | 1.6 | 0.0073 |
| DNR | 642 | Paraspeckle component 1 | PSPC1 | Q8WXF1 | 5 | 4–7 | ↓ | 4.11 | 0.0028 |
| MTX | 642 | Paraspeckle component 1 | PSPC1 | Q8WXF1 | 5 | 4–7 | ↓ | 2.44 | 0.0077 |
| 3F | DOXO + MTX | ||||||||
| DOXO | 4b | Elongation factor 2 | EEF2 | P13639 | 5 | 6–11 | ↑ | 1.47 | 0.00038 |
| MTX | 4b | Elongation factor 2 | EEF2 | P13639 | 5 | 6–11 | ↑ | 1.47 | 0.00035 |
| DOXO | 25b | Peptidyl-prolyl cis-trans isomerase | PPIA | P62937 | 4 | 6–11 | ↓ | 1.85 | 0.0023 |
| MTX | 25b | Peptidyl-prolyl cis-trans isomerase | PPIA | P62937 | 4 | 6–11 | ↓ | 1.7 | 0.0025 |
| DOXO | 33b | C-1-tetrahydrofolate synthase, cytoplasmic | MTHFD1 | P11586 | 5 | 6–11 | ↑ | 1.77 | 0.013 |
| MTX | 33b | C-1-tetrahydrofolate synthase, cytoplasmic | MTHFD1 | P11586 | 5 | 6–11 | ↑ | 1.67 | 0.011 |
| DOXO | 37b | C-1-tetrahydrofolate synthase, cytoplasmic | MTHFD1 | P11586 | 5 | 6–11 | ↑ | 1.69 | 0.0074 |
| MTX | 37b | C-1-tetrahydrofolate synthase, cytoplasmic | MTHFD1 | P11586 | 5 | 6–11 | ↑ | 1.62 | 0.0122 |
| DOXO | 45 | Peptidyl-prolyl cis-trans isomerase FKBP4 | FKBP4 | Q02790 | 4 | 4–7 | ↑ | 1.38 | 0.0066 |
| MTX | 45 | Peptidyl-prolyl cis-trans isomerase FKBP4 | FKBP4 | Q02790 | 4 | 4–7 | ↑ | 1.53 | 0.0052 |
| DOXO | 46b | GMP synthase [glutamine-hydrolyzing] | GMPS | P49915 | 5 | 6–11 | ↑ | 1.6 | 0.014 |
| MTX | 46b | GMP synthase [glutamine-hydrolyzing] | GMPS | P49915 | 5 | 6–11 | ↑ | 1.65 | 0.0038 |
| DOXO | 70 | Actin, cytoplasmic 1 | ACTB | P60709 | 1 | 4–7 | ↓ | 1.38 | 0.0017 |
| MTX | 70 | Actin, cytoplasmic 1 | ACTB | P60709 | 1 | 4–7 | ↓ | 1.47 | 0.0009 |
| DOXO | 85b | DAZ-associated protein 1 | DAZAP1 | Q96EP5 | 6 | 6–11 | ↓ | 1.71 | 0.0011 |
| MTX | 85b | DAZ-associated protein 1 | DAZAP1 | Q96EP5 | 6 | 6–11 | ↓ | 2.22 | 0.0059 |
| DOXO | 140b | Far upstream element-binding protein 2 | KHSRP | Q92945 | 5 | 6–11 | ↑ | 1.68 | 0.035 |
| MTX | 140b | Far upstream element-binding protein 2 | KHSRP | Q92945 | 5 | 6–11 | ↑ | 1.61 | 0.0131 |
| DOXO | 153 | d-3-phosphoglycerate dehydrogenase | PHGDH | O43175 | 5 | 4–7 | ↑ | 1.68 | 0.0068 |
| MTX | 153 | d-3-phosphoglycerate dehydrogenase | PHGDH | O43175 | 5 | 4–7 | ↑ | 1.9 | 0.0097 |
| DOXO | 242 | Splicing factor, arginine/serine-rich 3 | SFRS3 | P84103 | 5 | 4–7 | ↓ | 1.31 | 0.0064 |
| MTX | 242 | Splicing factor, arginine/serine-rich 3 | SFRS3 | P84103 | 5 | 4–7 | ↓ | 1.58 | 0.0034 |
| DOXO | 526 | Rab GDP dissociation inhibitor beta | GDI2 | P50395 | 1 | 4–7 | ↓ | 2.08 | 0.0009 |
| MTX | 526 | Rab GDP dissociation inhibitor beta | GDI2 | P50395 | 1 | 4–7 | ↓ | 1.51 | 0.0052 |
| DOXO | 541 | Heat shock protein 105 kDa | HSPH1 | Q92598 | 4 | 4–7 | ↑ | 1.47 | 0.0028 |
| MTX | 541 | Heat shock protein 105 kDa | HSPH1 | Q92598 | 4 | 4–7 | ↑ | 1.75 | 0.0015 |
| 3G | DNR + DOXO + MTX | ||||||||
| DOXO | 437 | l-lactate dehydrogenase B chain | LDHB | P07195 | 3 | 4–7 | ↓ | 1.83 | 0.0064 |
| MTX | 437 | l-lactate dehydrogenase B chain | LDHB | P07195 | 3 | 4–7 | ↓ | 1.86 | 0.0048 |
| DNR | 437 | l-lactate dehydrogenase B chain | LDHB | P07195 | 3 | 4–7 | ↓ | 2.50 | 0.0032 |
© 2012 by the authors; licensee Molecular Diversity Preservation International, Basel, Switzerland. This article is an open-access article distributed under the terms and conditions of the Creative Commons Attribution license (http://creativecommons.org/licenses/by/3.0/).
Share and Cite
Tyleckova, J.; Hrabakova, R.; Mairychova, K.; Halada, P.; Radova, L.; Dzubak, P.; Hajduch, M.; Gadher, S.J.; Kovarova, H. Cancer Cell Response to Anthracyclines Effects: Mysteries of the Hidden Proteins Associated with These Drugs. Int. J. Mol. Sci. 2012, 13, 15536-15564. https://doi.org/10.3390/ijms131215536
Tyleckova J, Hrabakova R, Mairychova K, Halada P, Radova L, Dzubak P, Hajduch M, Gadher SJ, Kovarova H. Cancer Cell Response to Anthracyclines Effects: Mysteries of the Hidden Proteins Associated with These Drugs. International Journal of Molecular Sciences. 2012; 13(12):15536-15564. https://doi.org/10.3390/ijms131215536
Chicago/Turabian StyleTyleckova, Jirina, Rita Hrabakova, Katerina Mairychova, Petr Halada, Lenka Radova, Petr Dzubak, Marian Hajduch, Suresh J. Gadher, and Hana Kovarova. 2012. "Cancer Cell Response to Anthracyclines Effects: Mysteries of the Hidden Proteins Associated with These Drugs" International Journal of Molecular Sciences 13, no. 12: 15536-15564. https://doi.org/10.3390/ijms131215536
APA StyleTyleckova, J., Hrabakova, R., Mairychova, K., Halada, P., Radova, L., Dzubak, P., Hajduch, M., Gadher, S. J., & Kovarova, H. (2012). Cancer Cell Response to Anthracyclines Effects: Mysteries of the Hidden Proteins Associated with These Drugs. International Journal of Molecular Sciences, 13(12), 15536-15564. https://doi.org/10.3390/ijms131215536