2.2.1. Fitting the Model
In the present study, central composite rotatable design (CCRD) was used to optimize the extraction parameters with response surface methodology. All the response values obtained from the 30-run-experiment and predicted data were shown in
Table 1. The similarity between the experimental and predicted values shows the accuracy of the model. Maximum yield of TFC was recorded during Run No. 26 at 6.28 mg RE/g, and maximum radical-scavenging capacity of ABTS and DPPH was recorded at 87.04% and 81.09% during Run No. 24 and Run No. 10, respectively.
Table 1.
Coded and real levels of the operational parameters and experimental and predicted values for different levels of experiment design.
Table 1.
Coded and real levels of the operational parameters and experimental and predicted values for different levels of experiment design.
| Run | X1(Rls) a | X2(Et) b | X3(T) c | X4(Ec) d | TFC (mg RE/g) | ABTS (%) | DPPH (%) |
|---|
| exp | pred | exp | pred | exp | pred |
|---|
| 1 | 40(−1) | 50(−1) | 40(−1) | 30(−1) | 4.76 | 4.81 | 76.30 | 77.60 | 68.98 | 69.00 |
| 2 | 60(1) | 50(−1) | 40(−1) | 30(−1) | 5.40 | 5.46 | 78.85 | 79.01 | 75.03 | 74.96 |
| 3 | 40(−1) | 70(1) | 40(−1) | 30(−1) | 4.98 | 5.01 | 78.96 | 79.08 | 75.15 | 74.57 |
| 4 | 60(1) | 70(1) | 40(−1) | 30(−1) | 5.39 | 5.45 | 79.57 | 76.69 | 74.07 | 73.93 |
| 5 | 40(−1) | 50(−1) | 80(1) | 30(−1) | 4.98 | 4.98 | 80.04 | 80.12 | 70.38 | 70.79 |
| 6 | 60(1) | 50(−1) | 80(1) | 30(−1) | 5.25 | 5.28 | 84.38 | 84.51 | 73.57 | 73.05 |
| 7 | 40(−1) | 70(1) | 80(1) | 30(−1) | 4.94 | 4.92 | 80.76 | 80.98 | 76.15 | 76.85 |
| 8 | 60(1) | 70(1) | 80(1) | 30(−1) | 5.00 | 5.01 | 83.99 | 84.57 | 72.94 | 72.49 |
| 9 | 40(−1) | 50(−1) | 40(−1) | 50(1) | 5.35 | 5.41 | 83.10 | 82.85 | 71.86 | 72.24 |
| 10 | 60(1) | 50(−1) | 40(−1) | 50(1) | 6.07 | 6.06 | 82.02 | 82.06 | 81.09 | 80.04 |
| 11 | 40(−1) | 70(1) | 40(−1) | 50(1) | 5.89 | 5.82 | 84.36 | 84.50 | 75.70 | 75.87 |
| 12 | 60(1) | 70(1) | 40(−1) | 50(1) | 6.19 | 6.26 | 82.68 | 82.92 | 77.55 | 77.06 |
| 13 | 40(−1) | 50(−1) | 80(1) | 50(1) | 5.84 | 5.75 | 81.13 | 81.28 | 72.46 | 72.25 |
| 14 | 60(1) | 50(−1) | 80(1) | 50(1) | 6.00 | 6.04 | 83.27 | 83.47 | 75.83 | 76.33 |
| 15 | 40(−1) | 70(1) | 80(1) | 50(1) | 5.88 | 5.89 | 82.15 | 82.31 | 76.36 | 76.35 |
| 16 | 60(1) | 70(1) | 80(1) | 50(1) | 6.05 | 5.97 | 84.41 | 83.70 | 74.20 | 73.82 |
| 17 | 30(−2) | 60(0) | 60(0) | 40(0) | 5.24 | 5.27 | 79.40 | 78.89 | 73.36 | 72.71 |
| 18 | 70(2) | 60(0) | 60(0) | 40(0) | 6.08 | 6.01 | 81.77 | 81.69 | 75.06 | 76.14 |
| 19 | 50(0) | 40(−2) | 60(0) | 40(0) | 5.53 | 5.48 | 82.29 | 81.85 | 73.20 | 73.25 |
| 20 | 50(0) | 80(2) | 60(0) | 40(0) | 5.61 | 5.62 | 83.71 | 83.56 | 75.94 | 76.32 |
| 21 | 50(0) | 60(0) | 20(−2) | 40(0) | 5.51 | 5.41 | 77.83 | 77.35 | 75.13 | 75.79 |
| 22 | 50(0) | 60(0) | 100(2) | 40(0) | 5.23 | 5.30 | 80.77 | 80.66 | 74.59 | 74.35 |
| 23 | 50(0) | 60(0) | 60(0) | 20(−2) | 4.80 | 4.71 | 83.88 | 82.97 | 70.73 | 70.83 |
| 24 | 50(0) | 60(0) | 60(0) | 60(2) | 6.23 | 6.28 | 87.04 | 87.35 | 75.09 | 75.41 |
| 25 | 50(0) | 60(0) | 60(0) | 40(0) | 6.06 | 6.15 | 85.52 | 86.07 | 80.03 | 70.83 |
| 26 | 50(0) | 60(0) | 60(0) | 40(0) | 6.28 | 6.15 | 86.47 | 86.07 | 79.14 | 75.41 |
| 27 | 50(0) | 60(0) | 60(0) | 40(0) | 6.18 | 6.15 | 85.76 | 86.07 | 79.95 | 79.73 |
| 28 | 50(0) | 60(0) | 60(0) | 40(0) | 6.11 | 6.15 | 86.13 | 86.07 | 80.13 | 79.73 |
| 29 | 50(0) | 60(0) | 60(0) | 40(0) | 6.16 | 6.15 | 86.23 | 86.07 | 79.23 | 79.73 |
| 30 | 50(0) | 60(0) | 60(0) | 40(0) | 6.10 | 6.15 | 86.32 | 86.07 | 79.90 | 79.73 |
Multiple regression analysis was applied on the experiment data, and the software generated three regression equations which demonstrated the empirical relationship between the response variables and the test variables (
Table 2), where Y is the response values of TFC, ABTS, and DPPH; X
1, X
2, X
3, and X
4 are the coded values of the ratio of solid to liquid, extraction temperature, extraction time, and ethanol concentration, respectively.
Table 2.
Regression models fitted to the experimental data of response variables.
Table 2.
Regression models fitted to the experimental data of response variables.
| | Response | Model Equation a |
|---|
| Y1 | TFC(mg RE/g) | Y1 = 6.15 + 0.18X1 + 0.034X2 − 0.027X3 + 0.39X4 − 0.053X1X2 − 0.090X1X3 − 0.001724X1X4 − 0.066X2X3 + 0.052X2X4 + 0.040X3X4 − 0.13X12 − 0.15X22 − 0.2X32 − 0.16X42 |
| Y2 | ABTS radical-scavenging capability (%) | Y2 = 225.29 + 11.75X1 + 4.41X2 + 16.40X3 + 28.77X4 + 0.64X1X2 + 8.87X1X3 + 4.80X1X4 + 0.38X2X3 + 0.031X2X4 + 16.73X3X4 + 57.38X12 + 19.46X22 + 85.62X32 + 1.42X42 |
| Y3 | DPPH radical-scavenging capability (%) | Y3 = 277.99 + 17.73X1 + 14.15X2 + 3.10X3 + 31.50X4 + 43.73X1X2 + 13.82X1X3 + 3.36X1X4 + 0.23X2X3 + 3.79X2X4 + 3.21X3X4 + 48.28X12 + 41.95X22 + 37.23X32 + 74.86X42 |
The ANOVA results, goodness-of-fit and the adequacy of the fitted models are summarized in
Table 3 and
Table 4. For any terms in the model, a large regression coefficient and a small
p-value indicate a more significant effect of that term on the respective response variable [
47].
Table 3.
Analysis of variance results for the multiple regression to predict flavonoids.
Table 3.
Analysis of variance results for the multiple regression to predict flavonoids.
| Source | Sum of Squares | Degree of Freedom | Mean Square | f-Value | p-Value | Significant b |
|---|
| Y1 | Model a | 6.93 | 14 | 0.50 | 69.03 | ˂0.0001 | ** |
| | X1 | 0.82 | 1 | 0.82 | 115.29 | ˂0.0001 | ** |
| | X2 | 0.029 | 1 | 0.029 | 4.02 | 0.0634 | |
| | X3 | 0.018 | 1 | 0.018 | 2.55 | 0.1309 | |
| | X4 | 3.7 | 1 | 3.70 | 522.30 | ˂0.0001 | ** |
| | X1X2 | 0.045 | 1 | 0.045 | 6.37 | 0.0234 | * |
| | X1X3 | 0.13 | 1 | 0.13 | 18.20 | 0.0007 | ** |
| | X1X4 | 4.758 × 10⁻⁵ | 1 | 4.758 × 10⁻⁵ | 6.708 × 10⁻³ | 0.9358 | |
| | X2X3 | 0.069 | 1 | 0.069 | 9.79 | 0.0069 | ** |
| | X2X4 | 0.044 | 1 | 0.044 | 6.15 | 0.0255 | * |
| | X3X4 | 0.026 | 1 | 0.026 | 3.66 | 0.0749 | |
| | X12 | 0.45 | 1 | 0.45 | 63.11 | ˂0.0001 | ** |
| | X22 | 0.61 | 1 | 0.61 | 85.71 | ˂0.0001 | ** |
| | X32 | 1.09 | 1 | 1.09 | 153.67 | ˂0.0001 | ** |
| | X42 | 0.74 | 1 | 0.74 | 103.82 | ˂0.0001 | ** |
| | Residual | 0.11 | 15 | 7.092× 10⁻³ | | | |
| | Lack of fit | 0.076 | 10 | 7.552× 10⁻³ | 1.22 | 0.4360 | |
| | Pure error | 0.031 | 5 | 6.172× 10⁻³ | | | |
| | R2 = 0.9849; Adj R2 = 0.9708; Pred R2 = 0.9319; Adeq Precision = 26.390; C.V.% = 1.49 | |
Table 4.
Analysis of variance results for the multiple regressions to predict ABTS and DPPH radical scavenging capacity of extracts.
Table 4.
Analysis of variance results for the multiple regressions to predict ABTS and DPPH radical scavenging capacity of extracts.
| Source | Degree of Freedom | ABTS Radical Scavenging Capacity (%) | DPPH Radical Scavenging Capacity (%) |
|---|
| Sum of Squares | Mean Square | f-Value | p-Value | Significant b | Sum of Squares | Mean Square | f-Value | p-Value | Significant b |
|---|
| Y2 Model a | 14 | 225.29 | 16.09 | 54.25 | ˂0.0001 | ** | Y3 277.99 | 19.86 | 44.25 | ˂0.0001 | ** |
| X1 | 1 | 11.75 | 11.75 | 39.62 | ˂0.0001 | ** | 17.73 | 17.73 | 39.51 | ˂0.0001 | ** |
| X2 | 1 | 4.41 | 4.41 | 14.86 | 0.0016 | * | 14.15 | 14.15 | 31.53 | ˂0.0001 | ** |
| X3 | 1 | 16.40 | 16.40 | 55.29 | ˂0.0001 | ** | 3.10 | 3.10 | 6.90 | 0.0190 | * |
| X4 | 1 | 28.77 | 28.77 | 97.01 | ˂0.0001 | ** | 31.50 | 31.50 | 70.21 | ˂0.0001 | ** |
| X1X2 | 1 | 0.64 | 0.64 | 2.16 | 0.1626 | | 43.73 | 43.73 | 97.46 | 0.0234 | * |
| X1X3 | 1 | 8.87 | 8.87 | 29.91 | ˂0.0001 | ** | 13.82 | 13.82 | 30.80 | 0.0007 | ** |
| X1X4 | 1 | 4.80 | 4.80 | 16.19 | 0.0011 | ** | 3.36 | 3.36 | 7.48 | 0.9358 | |
| X2X3 | 1 | 0.38 | 0.38 | 1.29 | 0.2732 | | 0.23 | 0.23 | 0.50 | 0.0069 | ** |
| X2X4 | 1 | 0.031 | 0.031 | 0.10 | 0.7508 | | 3.79 | 3.79 | 8.44 | 0.0255 | * |
| X3X4 | 1 | 16.73 | 16.73 | 56.40 | ˂0.0001 | ** | 3.21 | 3.21 | 7.15 | 0.0749 | |
| X12 | 1 | 57.38 | 57.38 | 193.46 | ˂0.0001 | ** | 48.28 | 48.28 | 107.60 | ˂0.0001 | ** |
| X22 | 1 | 19.46 | 19.46 | 65.60 | ˂0.0001 | ** | 41.95 | 41.95 | 93.49 | ˂0.0001 | ** |
| X32 | 1 | 85.62 | 85.62 | 288.68 | ˂0.0001 | ** | 37.23 | 37.23 | 82.98 | ˂0.0001 | ** |
| X42 | 1 | 1.42 | 1.42 | 4.78 | 0.0451 | * | 74.86 | 74.86 | 166.84 | ˂0.0001 | ** |
| Residual | 15 | 4.45 | 0.30 | | | | 6.73 | 0.45 | | | |
| Lack of fit | 10 | 3.79 | 0.38 | 2.87 | 0.1279 | | 5.81 | 0.58 | 3.17 | 0.4527 | |
| Pure error | 5 | 0.66 | 0.13 | | | | 0.92 | 0.18 | | | |
| | R2 = 0.9806; Adj R2 = 0.9626; Pred R2 = 0.9009; Adeq Precision = 25.970; C.V.% = 0.66 | R2 = 0.9764; Adj R2 = 0.9543; Pred R2 = 0.8788; Adeq Precision = 23.316; C.V.% = 0.89 | | |
ANOVA for the quadratic regression models indicated that the three models were very significant (p ˂ 0.01). The quality of fit of the model is usually evaluated by the determination coefficient (R2), predicted determination coefficient (R2pred), and adjusted determination coefficient (R2adj). The values of the determination coefficient (R2 =0.9849, 0.9806, and 0.9764 for TFC, ABTS, and DPPH radical-scavenging activity, respectively) of the quadratic regression model indicated that only 1.61%, 1.94%, and 2.36% of the total variations could not be explained by the model, respectively. The adjusted determination coefficient (R2adj = 0.9708, 0.9626, 0.9543) showed the high degree of correlation between the experimental and predicted values. The models also showed statistically-insignificant lack of fit, as is evident from the computed f-values of 0.4360, 0.1279, and 0.4527 for TFC, ABTS and DPPH methods, respectively. Based on the factors above, it was deduced that the model was appropriate to predict the responses.
For the extraction yield of TFC and antioxidants assayed by ABTS and DPPH methods, each response can be assigned a significance degree relative to the other responses. The results indicated that all the quadratic terms and liner terms as the ratio of liquid and solid (X
1) and ethanol concentration (X
4) and the interaction between X
1X
3, X
2X
3, were highly significant (
p ˂ 0.01) on the total flavonoids yield (Y
1), whereas the linear and quadratic effects of all independent variables were found to be significant (
p ˂ 0.05) on ABTS (Y
2) and DPPH (Y
3) radical-scavenging capacity of extracts from alfalfa (
Table 3). Moreover, three interactions of X
1X
3, X
1X
4, and X
3X
4 were significant (
p ˂ 0.01) on ABTS radical-scavenging capacity, while only two interactions of X
1X
3, X
2X
3 were significant (
p ˂ 0.01) on DPPH radical-scavenging capacity.
2.2.2. Analysis of Response Surfaces
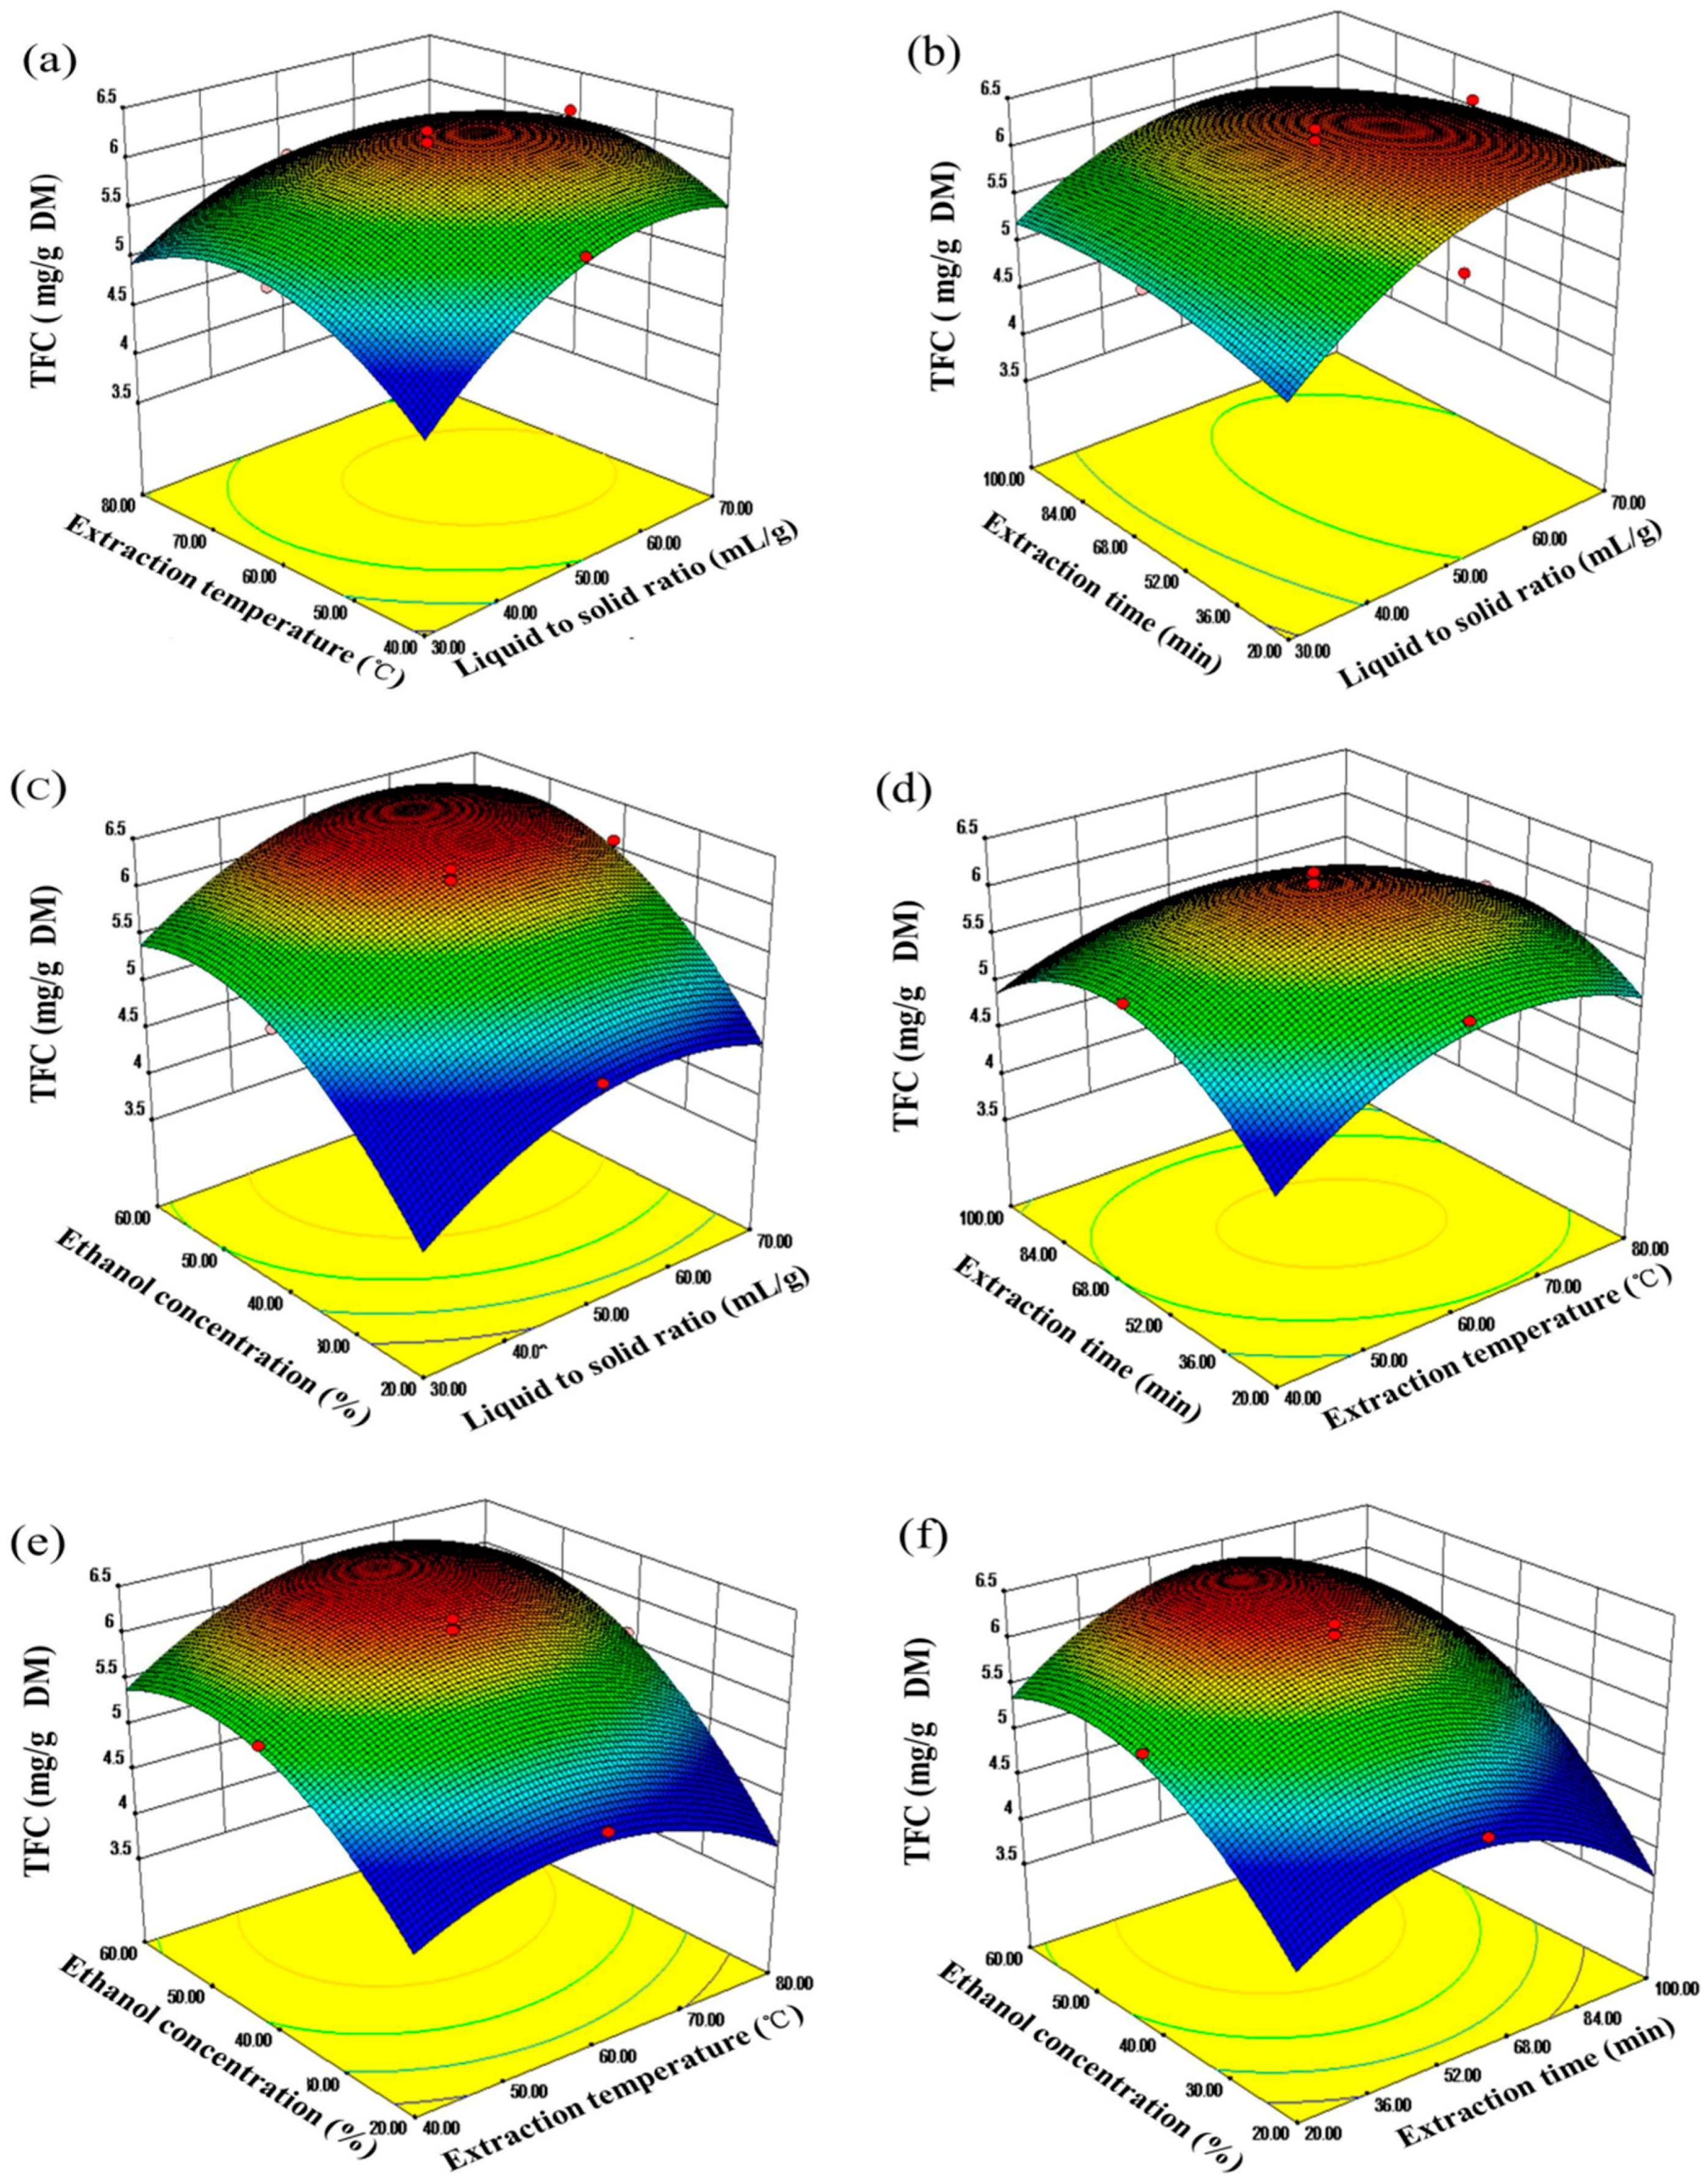
Three-dimensional response surface plots drawn by Design Expert Software (Version 8.0.5, Stat-Ease Inc., Minneapolis, MN, USA) were constructed to investigate the main and the interactive effects on the recoveries of TFC and scavenging capacities of ABTS and DPPH radicals. The surface plots were generated by holding two variables at zero level, while varying the other two variables within the experiment range under investigation.
The effects of the liquid to solid ratio interaction with the other factors on the recovery of TFC, ABTS, and DPPH radical-scavenging antioxidants are shown in
Figure 5a–c,
Figure 6a–c, and
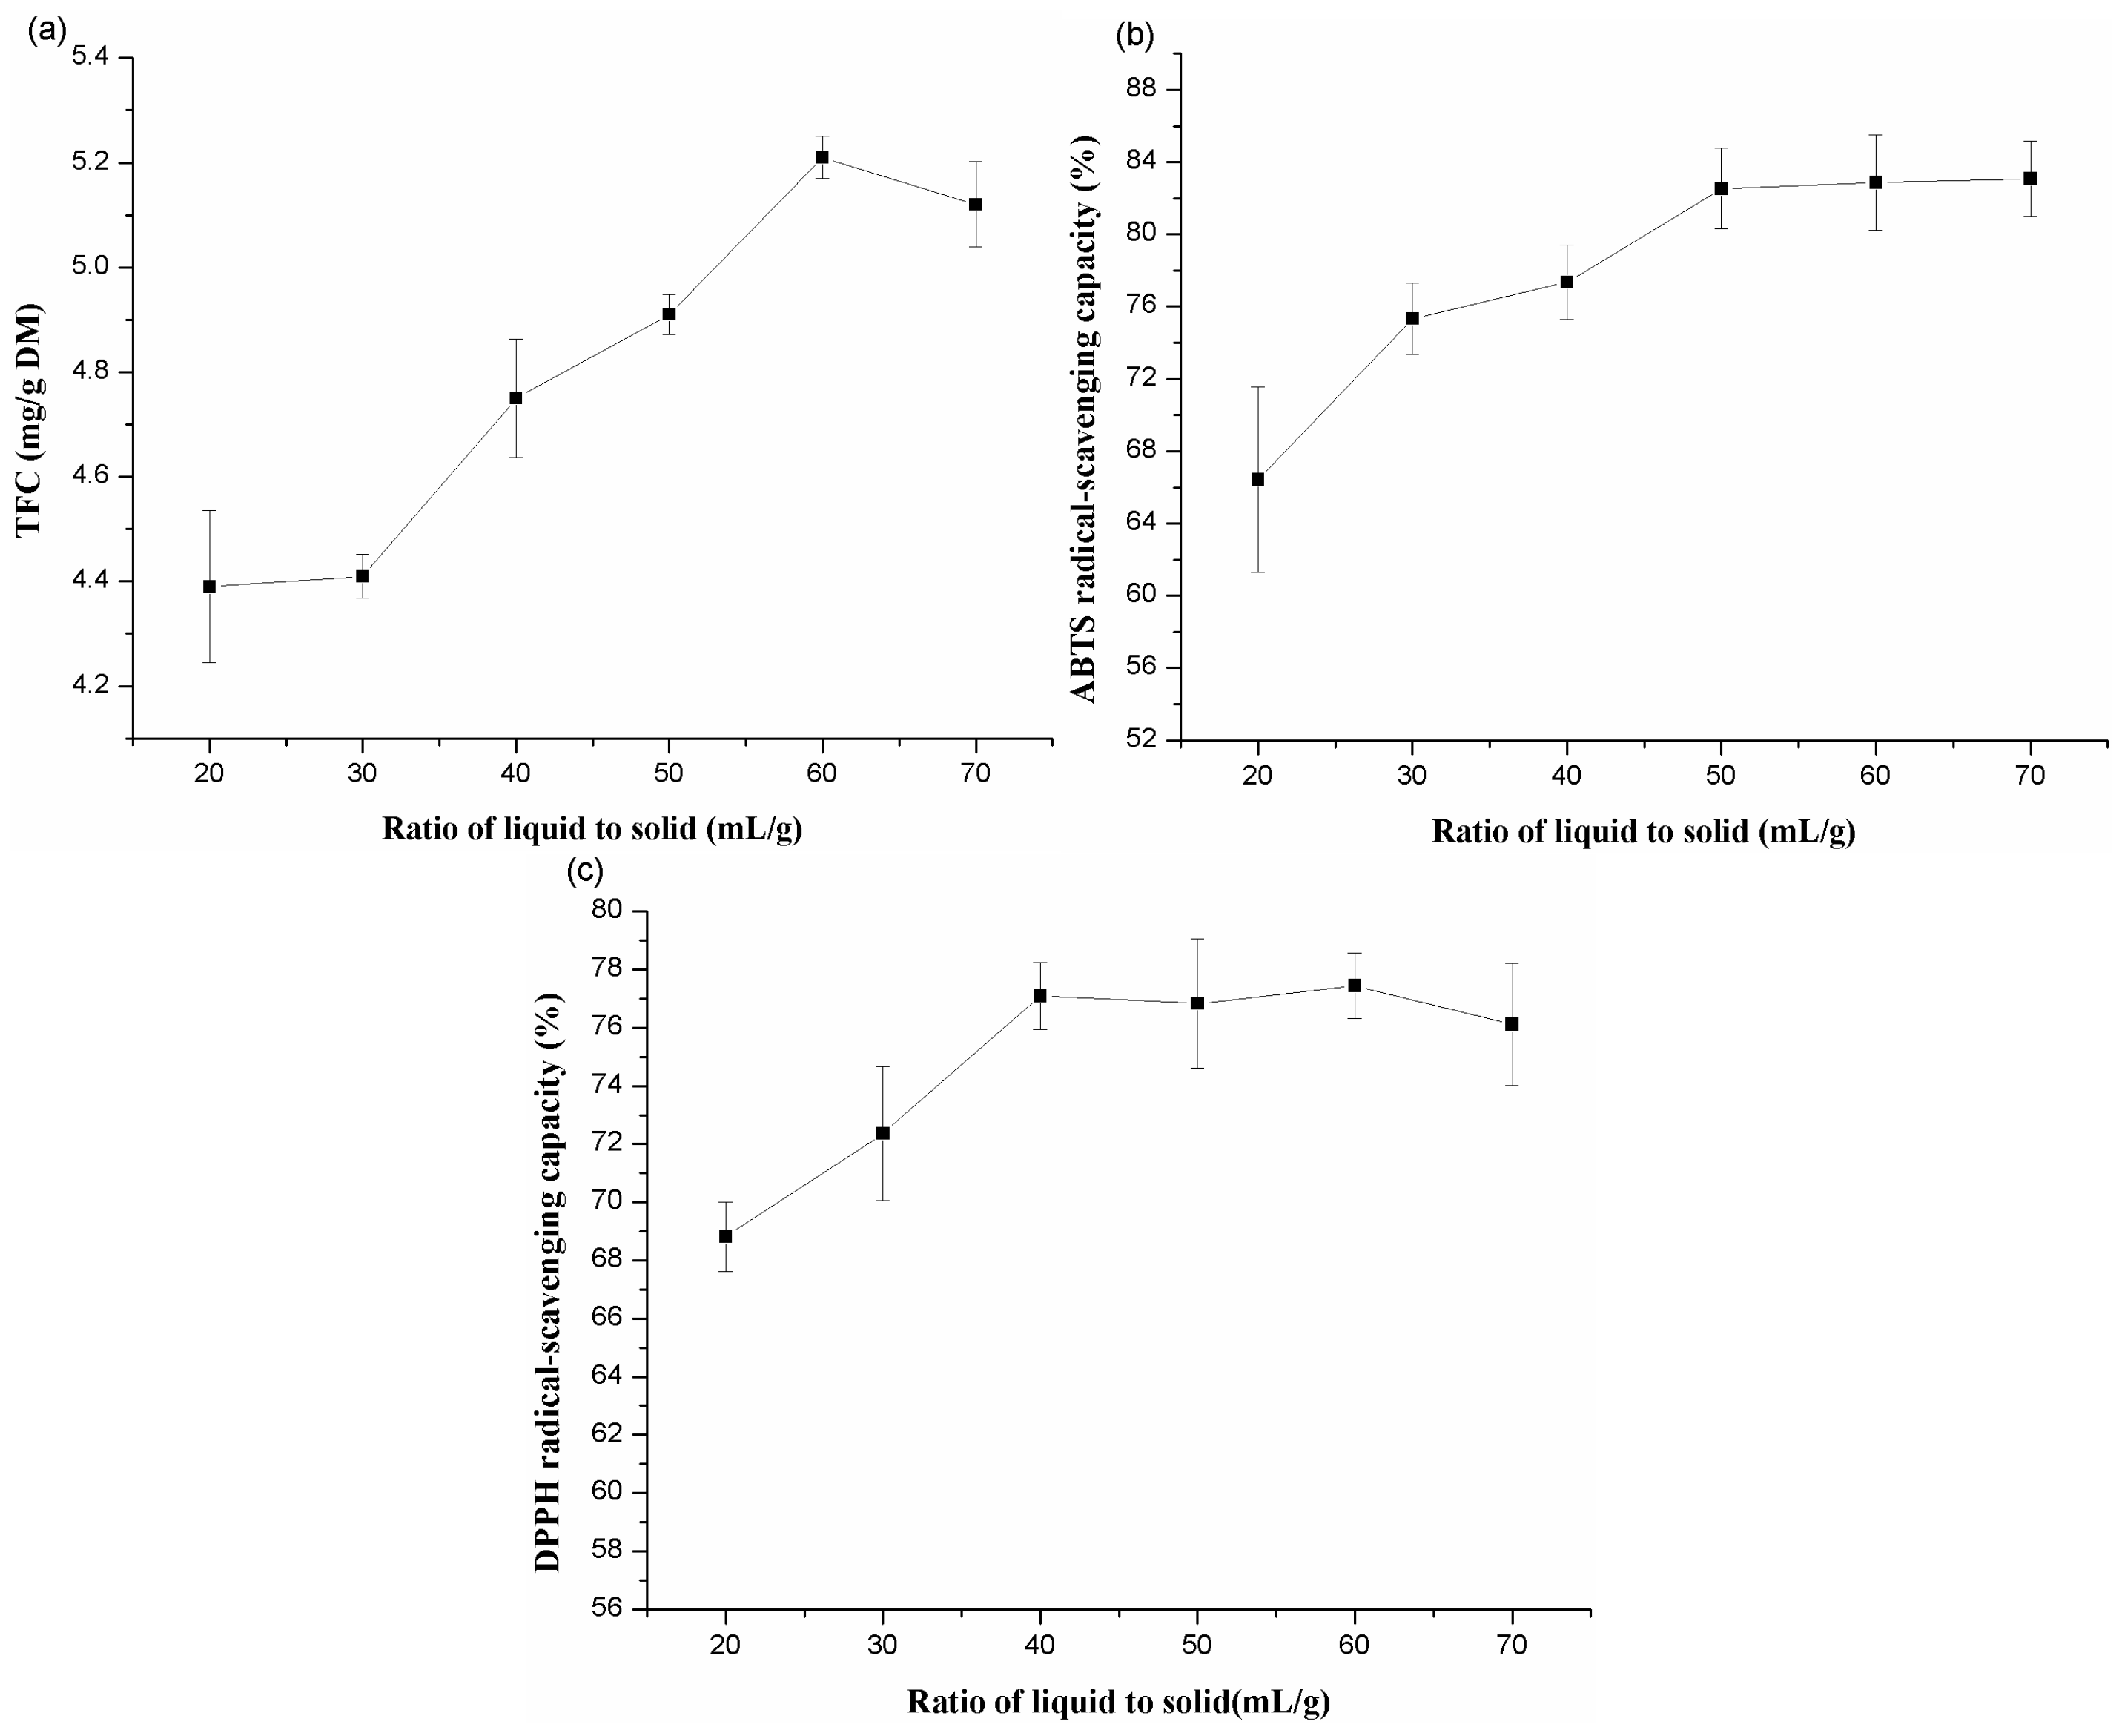
Figure 7a–c. It was obvious that the lower recovery in the lower solvent volume, and extraction recoveries increased with an increase the ratio from 30:1 (mL/g) to 50:1 (mL/g), but the ratio over 60:1 (mL/g) appeared to diminish extraction yield.
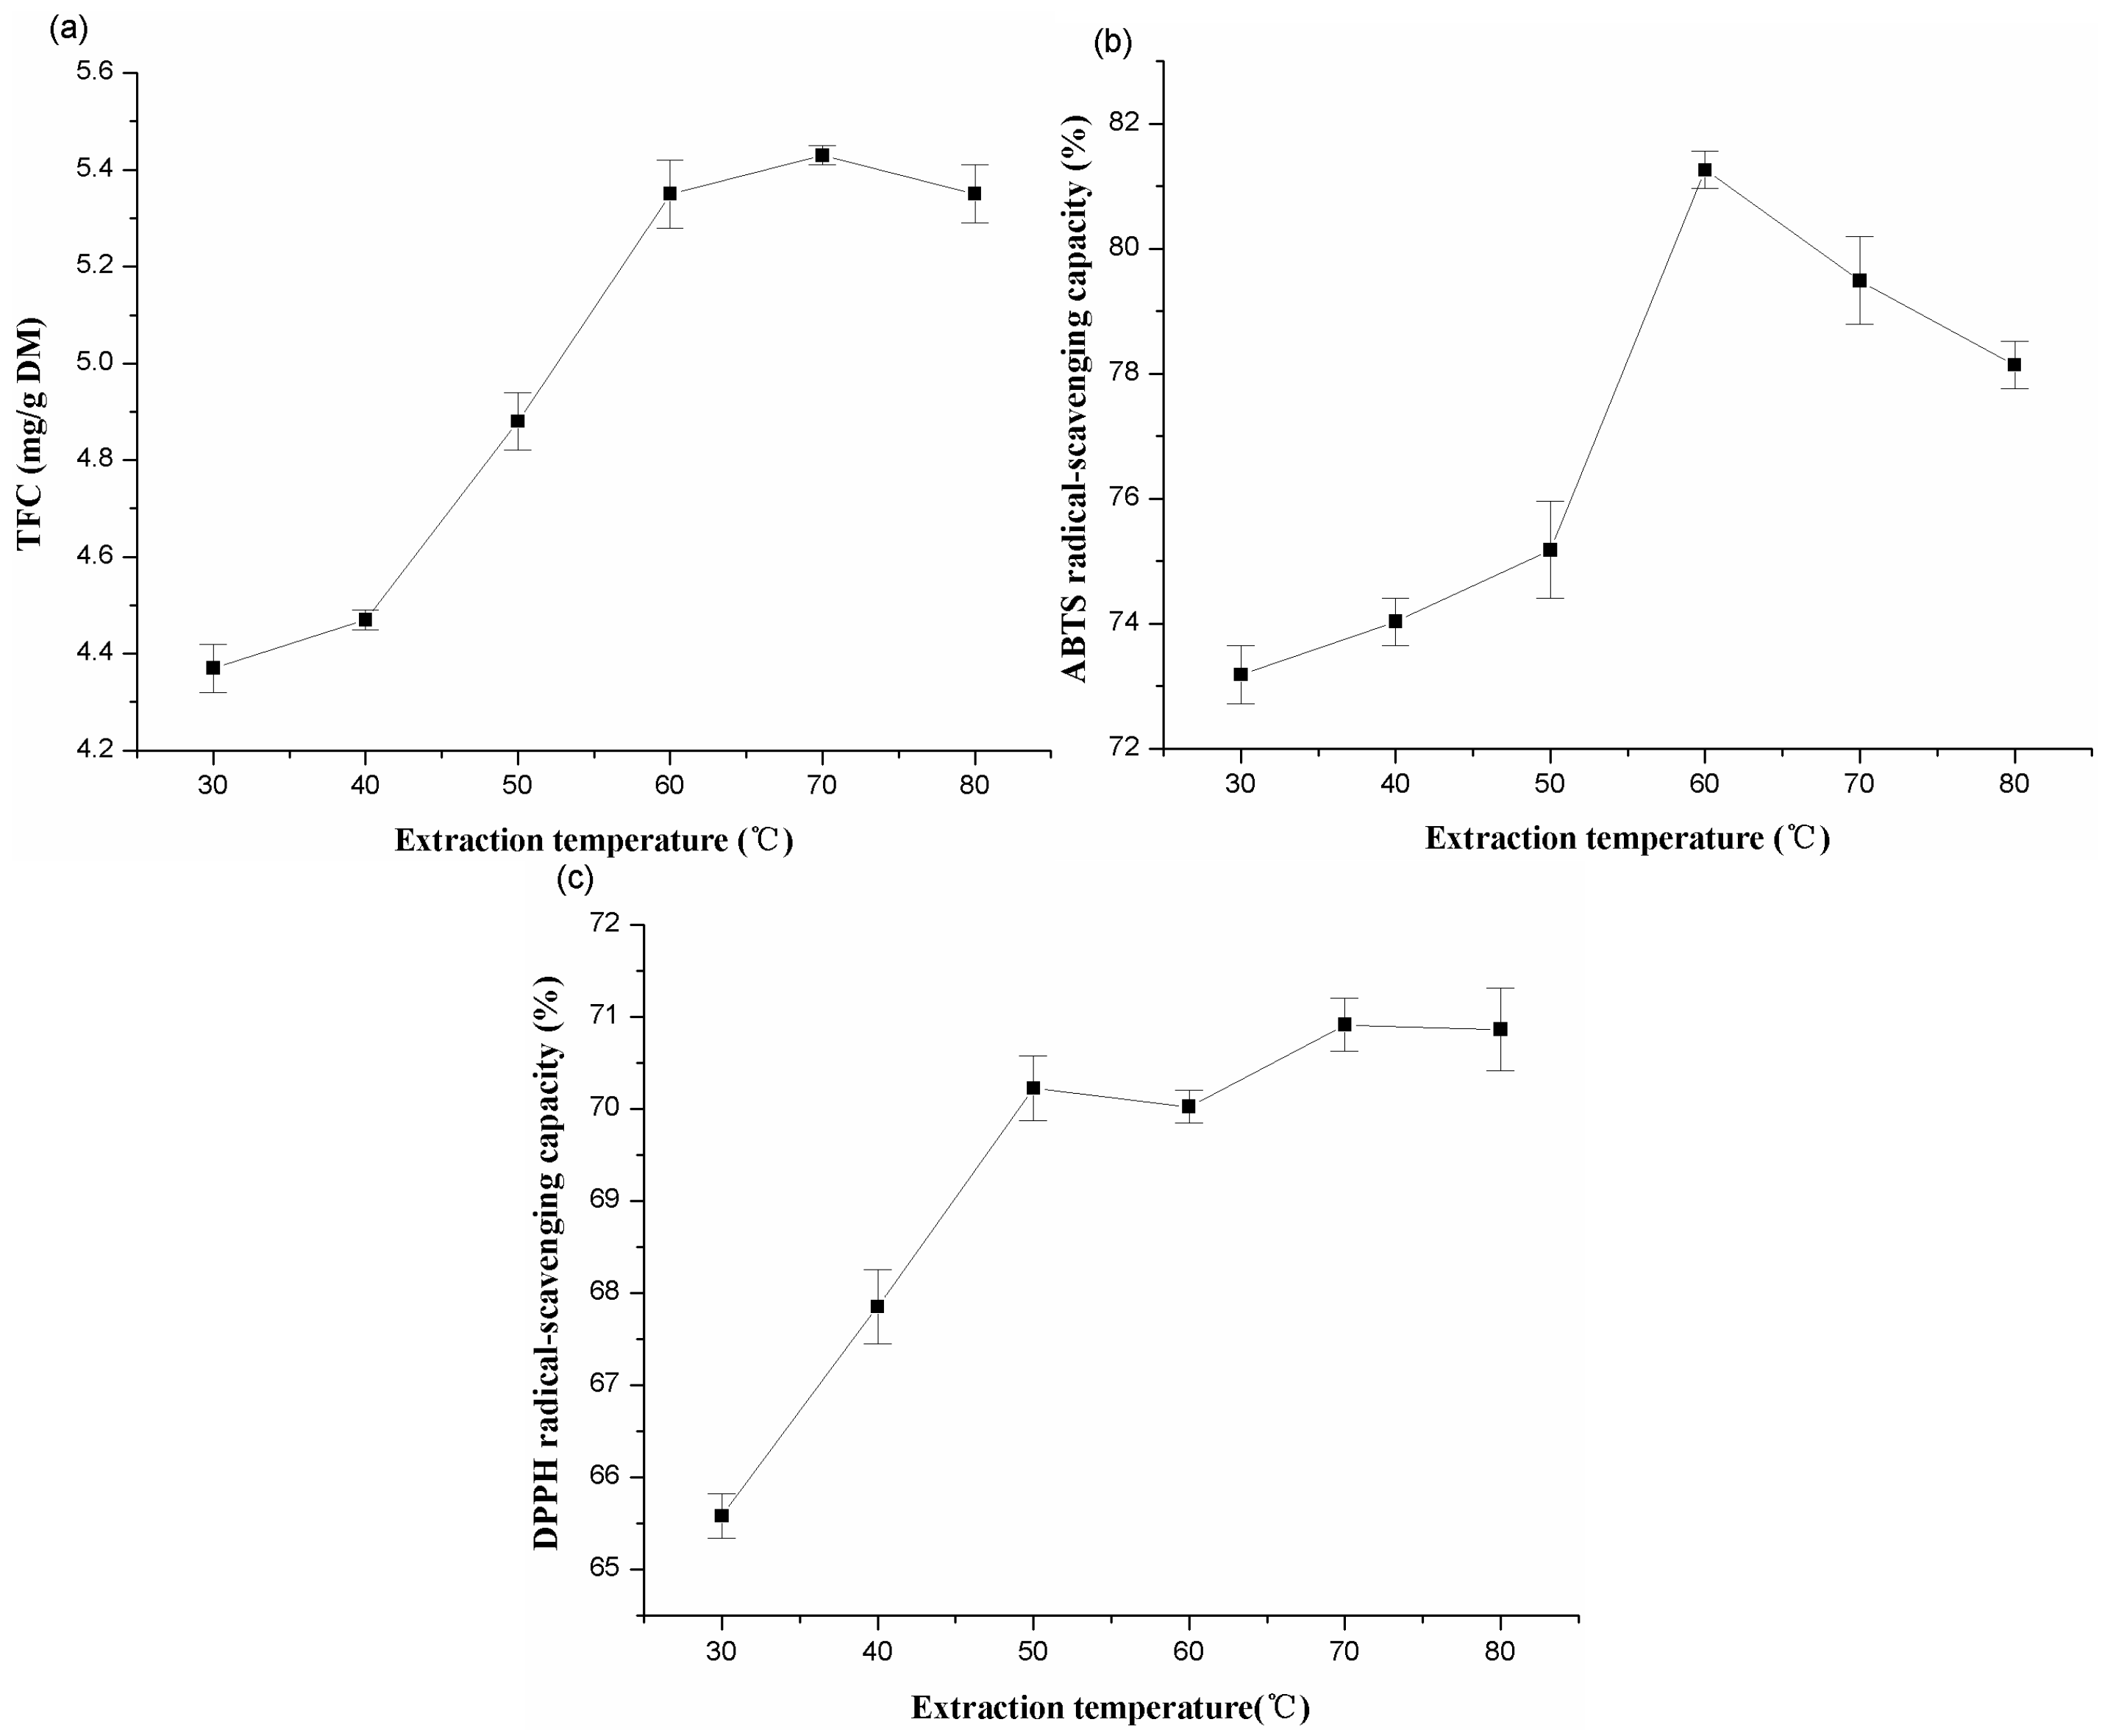
For the extraction temperature, as can be seen from
Figure 5a,d,e, a quadratic effect was detected for all response variables, and the extraction yield of flavonoids increased from 40 to 60 °C. This might be due to the increase in temperature accelerating the mass transfer. Similar results have also been reported for the extraction of flavonoids from other materials [
48,
49].
Figure 6a,d,e and
Figure 7a,d,e shows the effects of extraction temperature with each of the three other factors on the recovery of ABTS and DPPH radical-scavenging antioxidants. In all situations, scavenging capacity of ABTS and DPPH radicals increased with increasing extraction temperature from 40°C to 55 °C, while more than 60 °C appeared to be disadvantaged on the extraction of antioxidants.
In
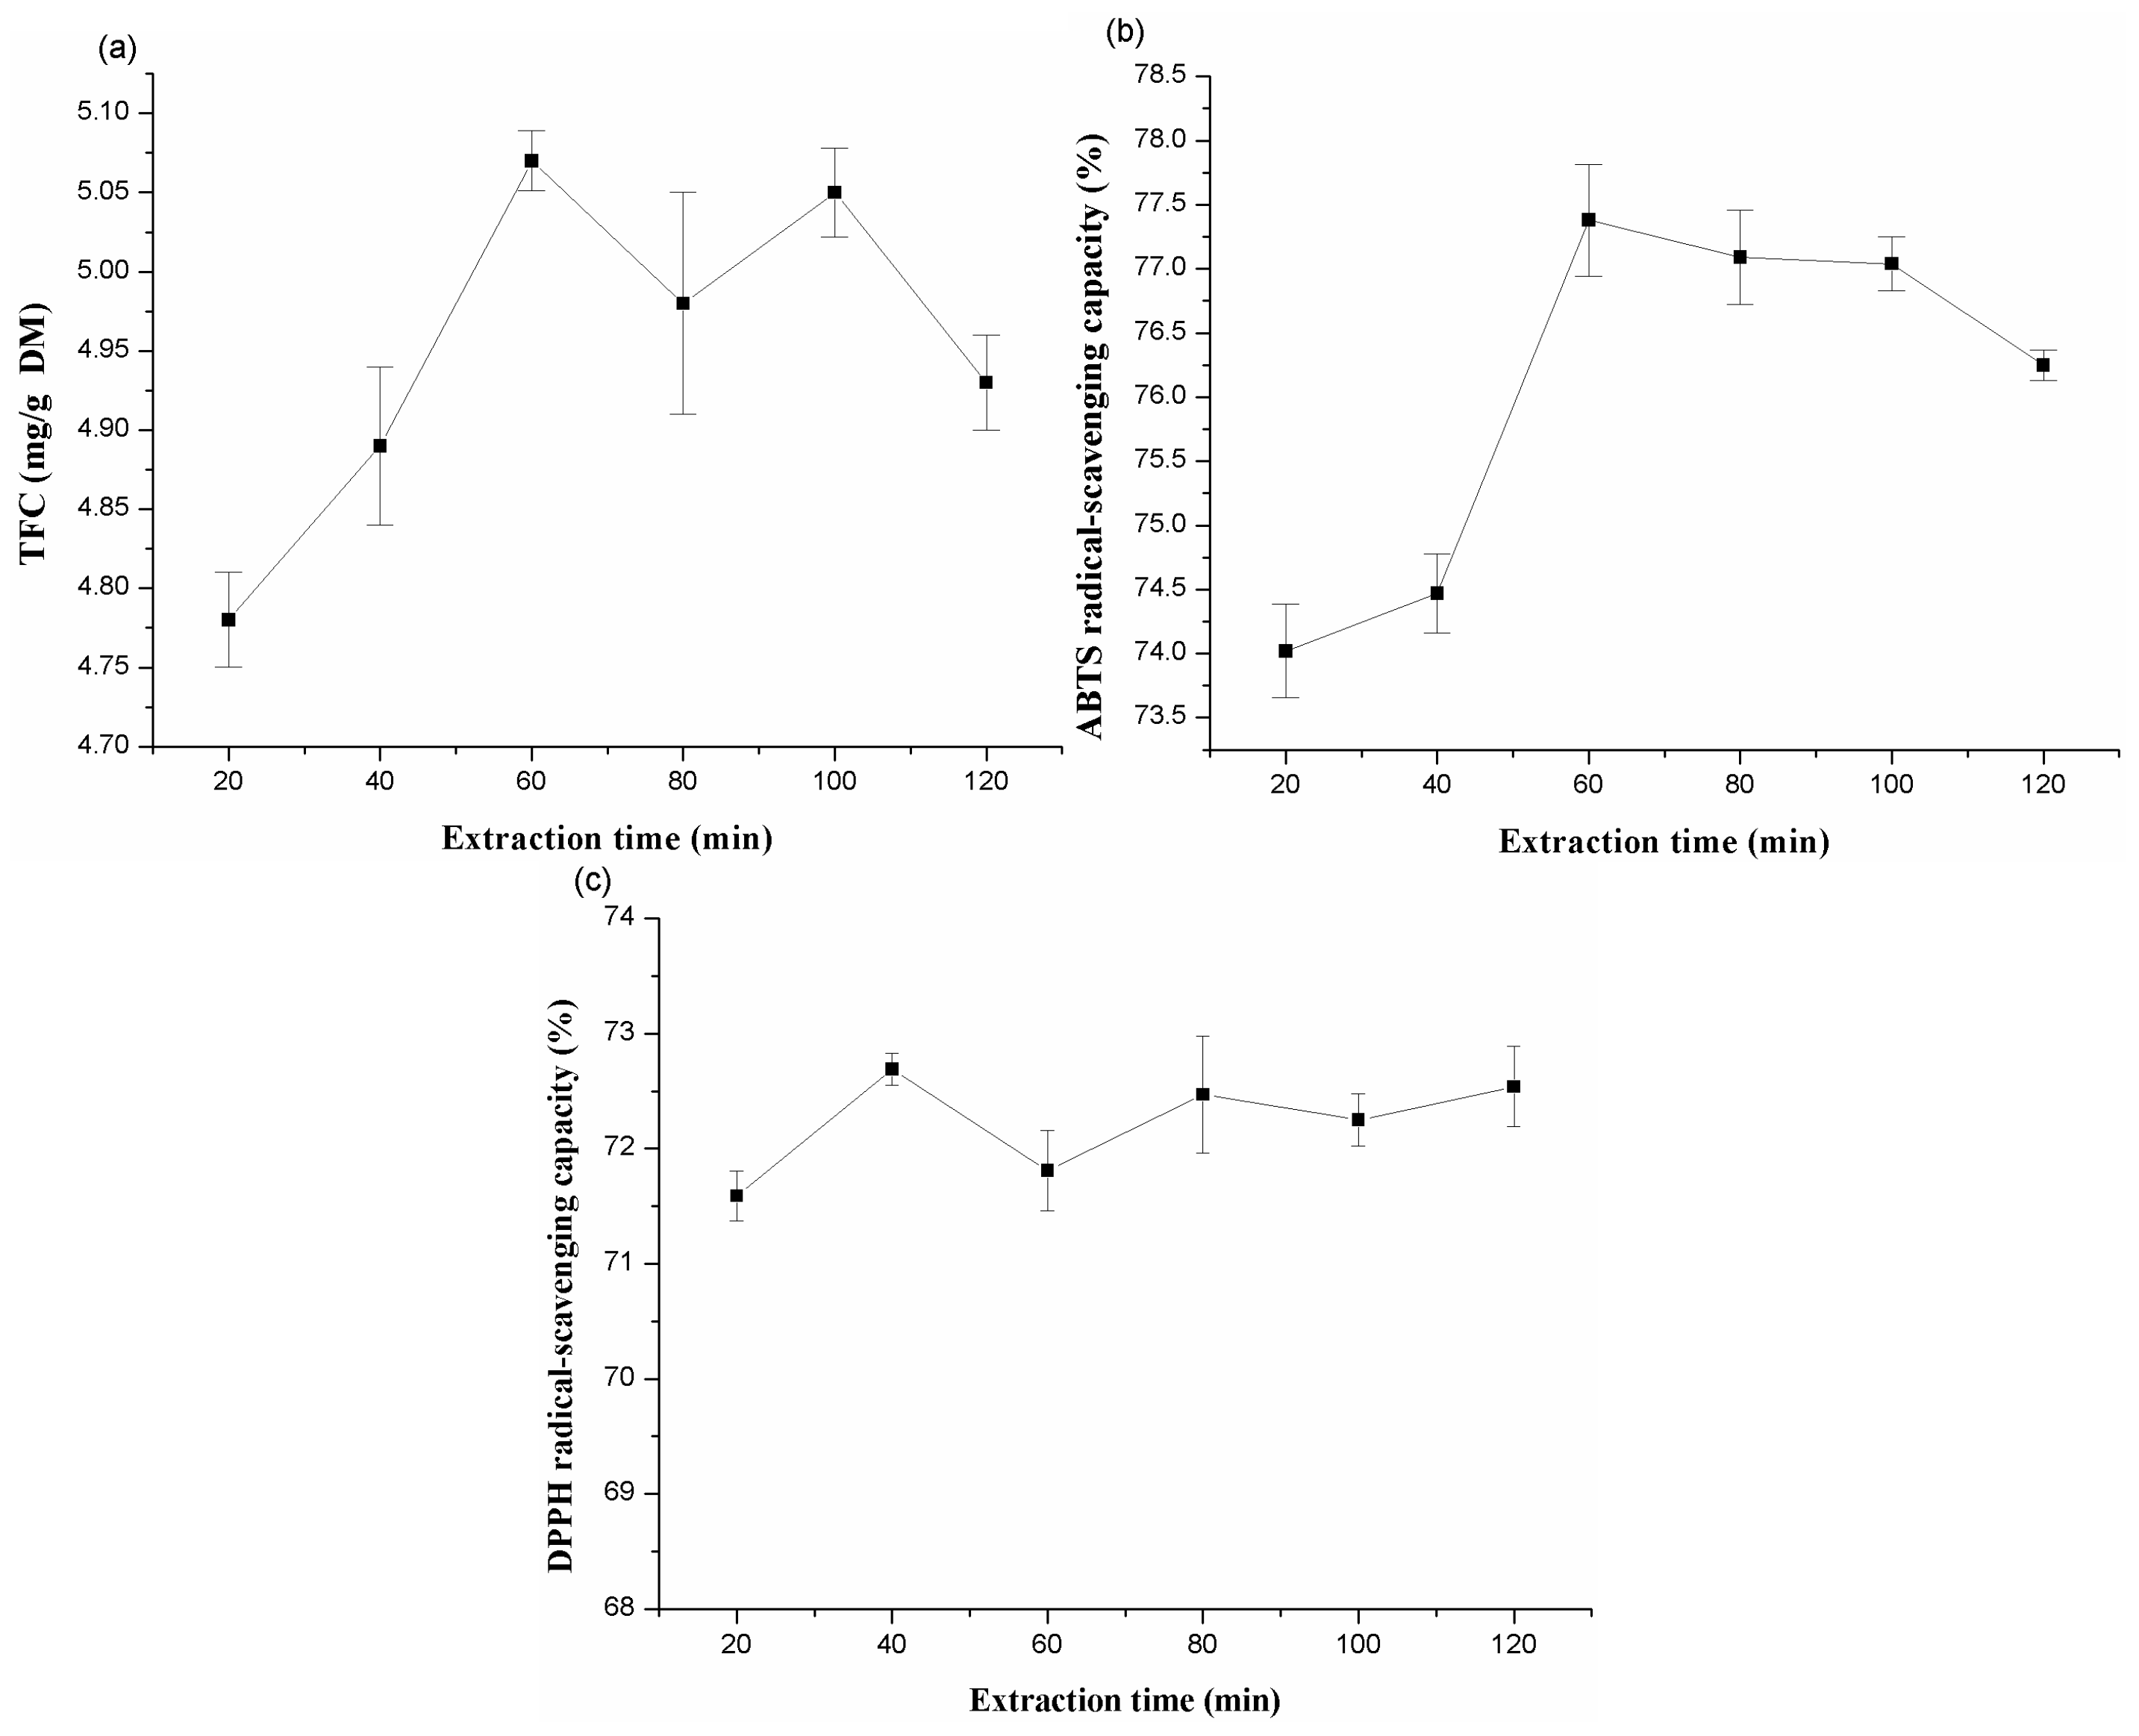
Figure 6, when the response surface plots were developed for the extraction time interaction with the other three factors, it can be seen that the maximum extraction yield could be achieved when the extraction time around 60 min. As shown in
Figure 6b,d,f and
Figure 7b,d,f, it indicated that the maximum scavenging capacity of ABTS and DPPH radicals appeared when the extraction time reached 60 min and 45 min, respectively.
Figure 5.
Response surface plots (3D) showing the effects of variables on total flavonoid extraction. (a) liquid to solid ratio and temperature; (b) liquid to solid ratio and time; (c) liquid to solid ratio and Ethanol concentration; (d) time and temperature; (e) temperature and ethanol concentration; (f) time and ethanol concentration.
Figure 6.
Response surface plots (3D) showing the effects of the extraction parameters on ABTS radical-scavenging capacity of alfalfa extracts. (a) liquid to solid ratio and temperature; (b) liquid to solid ratio and time; (c) liquid to solid ratio and Ethanol concentration; (d) time and temperature; (e) temperature and ethanol concentration; (f) time and ethanol concentration.
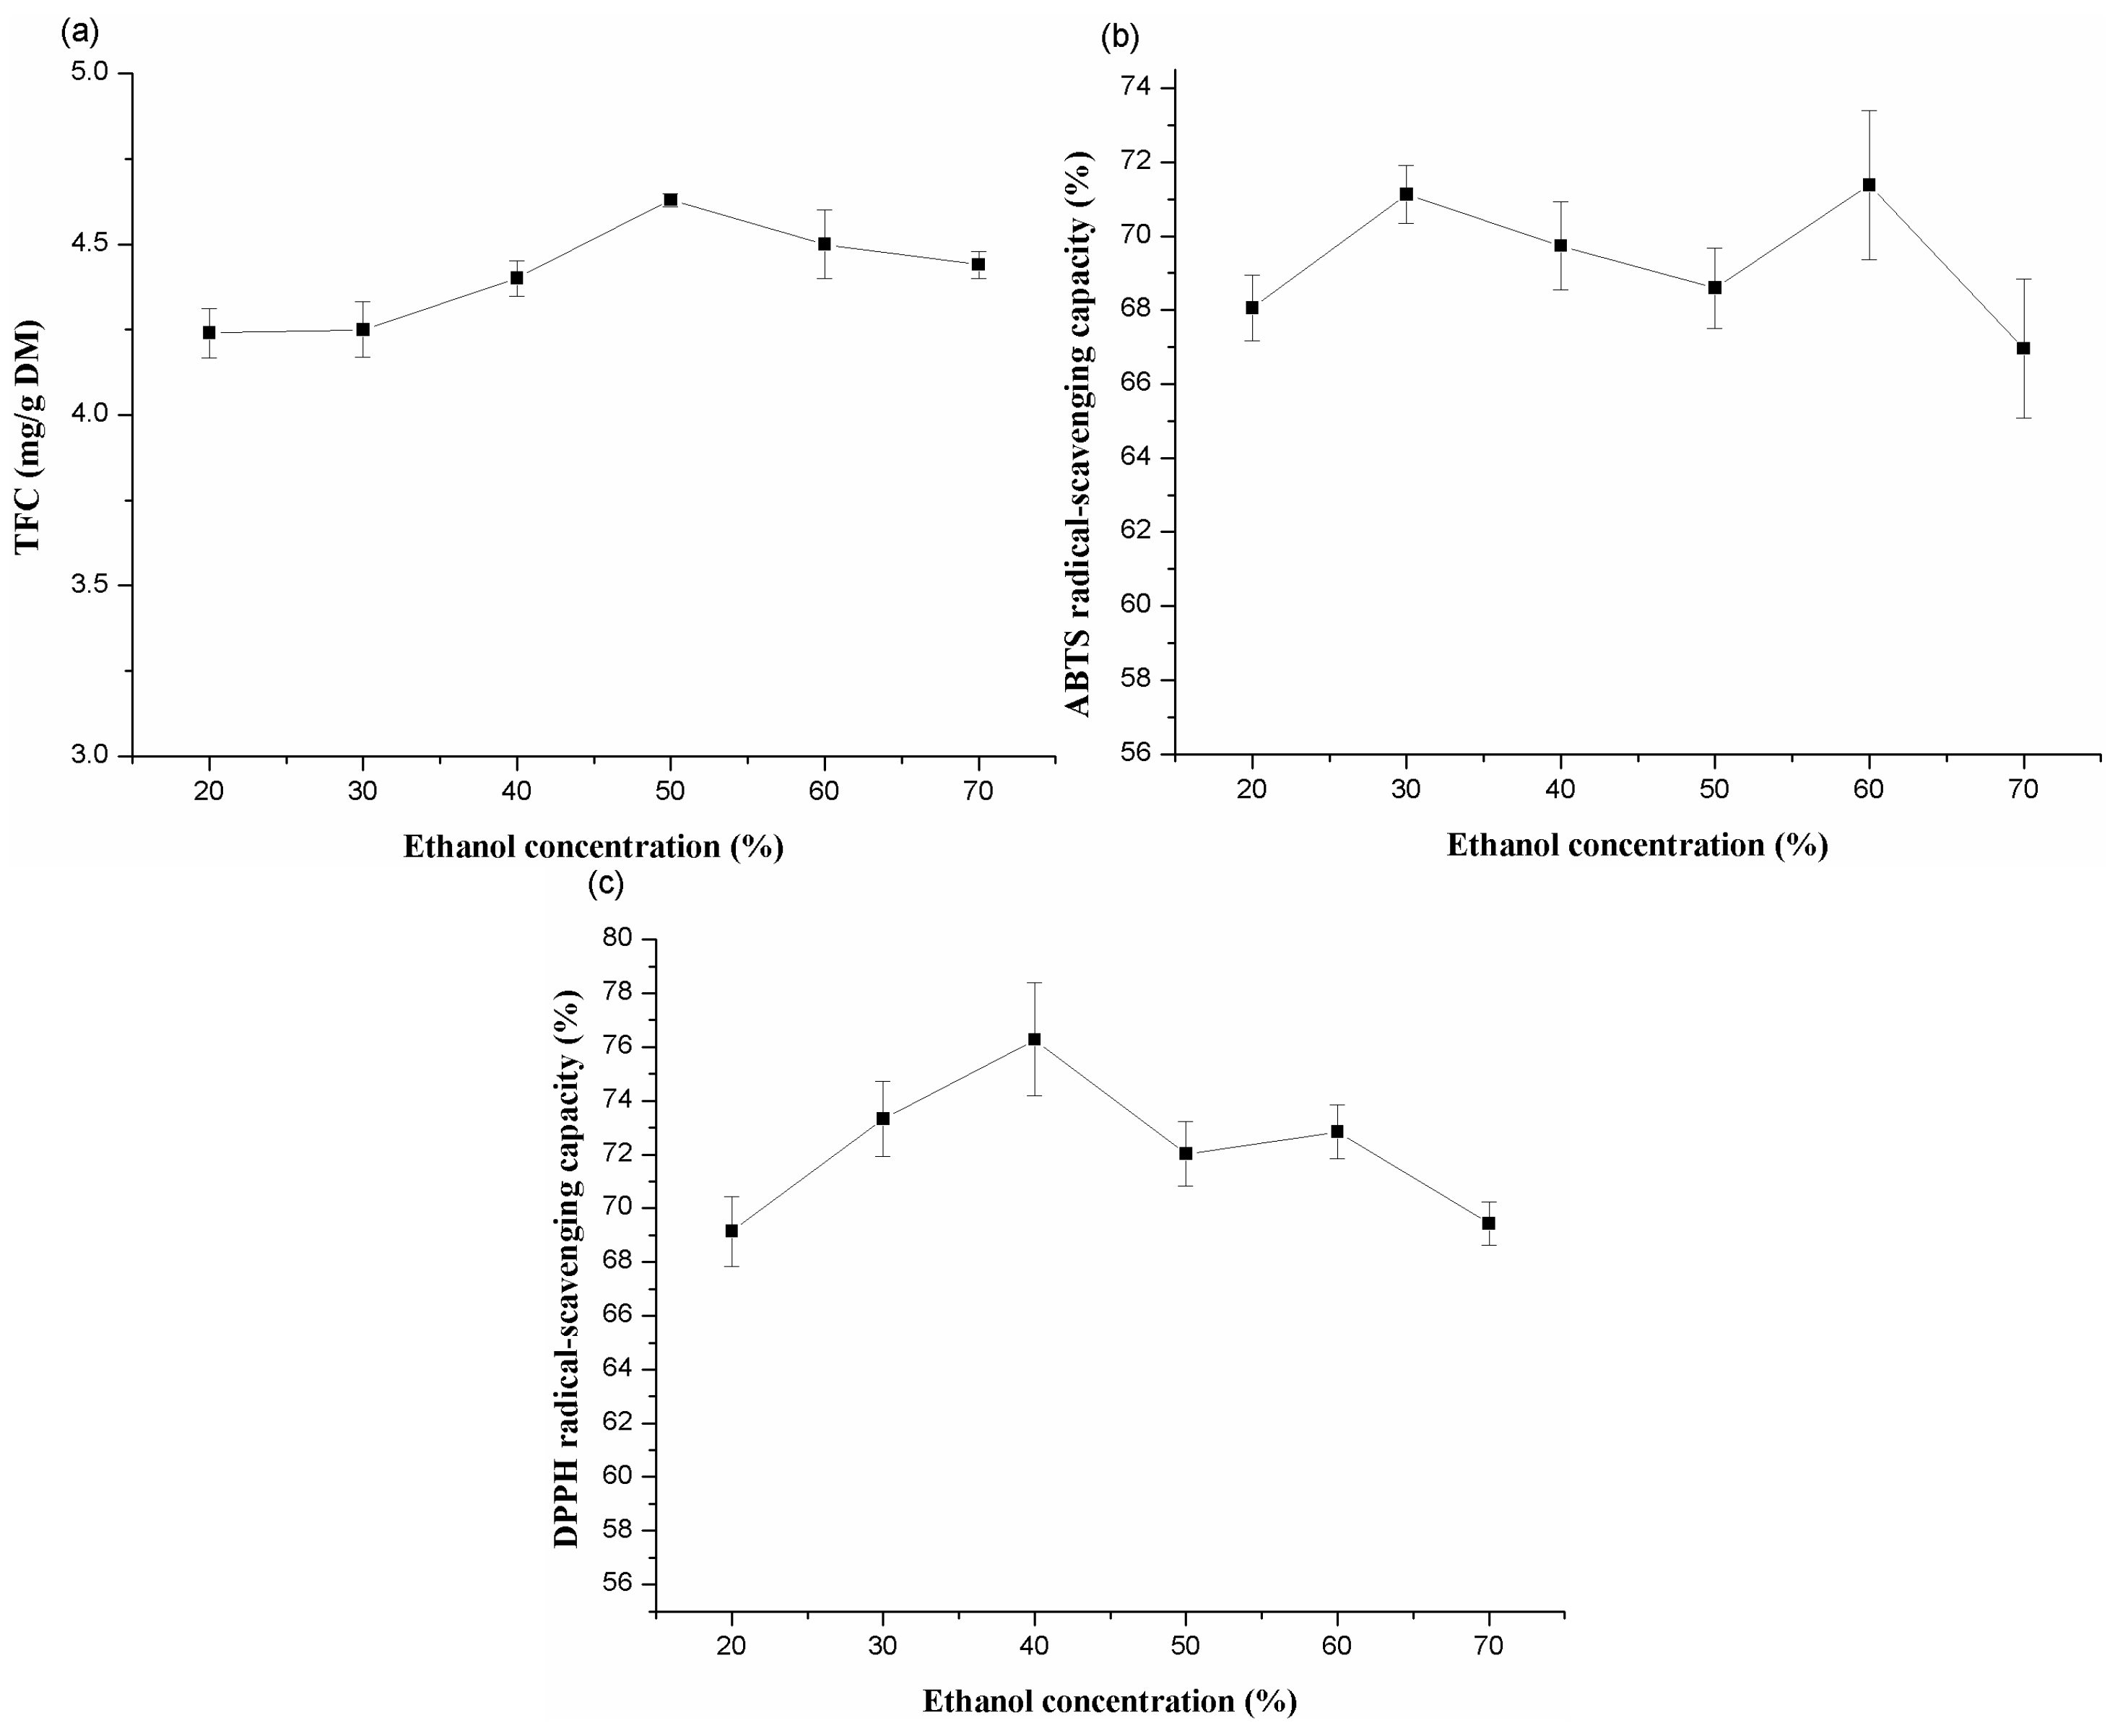
As expected, ethanol concentration exerted a quadratic effect on the recovery of TFC, ABTS, and DPPH radical-scavenging capacity antioxidants. The yield of flavonoids increased to the highest value with an ethanol concentration around 50% (
Figure 5c,e,f). Likewise, a greater value of the scavenging capacity of DPPH radicals was obtained when the ethanol concentration increased from 20% to 46% (
Figure 7c,e,f), and decreased thereafter. However, the capacity of ABTS radical-scavenging decreased when the concentration was above 60% (
Figure 6c,e,f).
Figure 7.
Response surface plots (3D) showing the effects of the extraction parameters on DPPH radical-scavenging capacity of alfalfa extracts. (a) liquid to solid ratio and temperature; (b) liquid to solid ratio and time; (c) liquid to solid ratio and Ethanol concentration; (d) time and temperature; (e) temperature and ethanol concentration; (f) time and ethanol concentration.
2.2.4. Comparison with Conventional Extraction
In order to compare extraction efficiency, UAE, which was performed at the optimum conditions by RSM, was applied to compare with conventional method. TFC, total phenolic content (TPC), and antioxidant activity of extracts obtained from alfalfa using UAE and conventional extraction methods are presented in
Table 6. Compared with the conventional extraction method, TFC and TPC of the crude extracts by UAE were higher than that by conventional extraction method. The results indicated that TFC was highest in E
1 (39.15 mg RE/g) among the four samples. However, the TPC determined by Folin-Ciocalteau procedure in E
1 (66.51 mg GAE/g) and E
2 (68.02 mg GAE/g) was higher than E
3 (58.35 mg GAE/g) and E
4 (48.36 mg GAE/g), and there were no significant differences between E
1 and E
2. The result was supported by the results of [
50], who stated that 60% (
v/
v) ethanol provided the highest total phenolic extraction.
Table 6.
The content of total flavonoids, phenolic, and antioxidant capacity of extracts prepared under three optimal UAE conditions and conventional methods.
Table 6.
The content of total flavonoids, phenolic, and antioxidant capacity of extracts prepared under three optimal UAE conditions and conventional methods.
| Methods | TFC | TPC | ABTS | DPPH | FRAP |
|---|
| Ultrasonic-assisted extraction | E1 | 39.15 ± 0.63 a | 66.51 ± 1.52 a | 86.55 ± 0.07 a,b | 79.23 ± 0.68 a | 33.18 ± 0.14 b |
| E2 | 36.13 ± 0.68 b | 68.02 ± 0.43 a | 87.38 ± 0.68 a | 71.98 ± 0.13 b | 36.24 ± 0.11 a |
| E3 | 34.88 ± 0.35 b | 58.35 ± 0.11 b | 85.58 ± 0.54 b | 80.72 ± 0.67 a | 32.68 ± 0.28 c |
| Conventional | E4 | 29.73 ± 1.20 c | 48.36 ± 0.29 c | 70.85 ± 0.68 c | 66.73 ± 3.66 c | 32.65 ± 0.19 c |
Meanwhile, it can be seen that UAE demonstrated a positive influence on antioxidant extraction than the conventional method. The antioxidant activity of extracts power was determined using ABTS, DPPH radical scavenging and FRAP assay. The antioxidant capacities determined by ABTS assay were 86.55%, 87.38%, 85.58%, and 70.85%, respectively, and the values of E1, E2, and E3 which extracted with UAE is higher than that of E4. Using DPPH assay, the antioxidant activities of E1 and E3 is significantly higher than E2 and E4. The antioxidant capacity assayed by FRAP was 33.18 mg AA/g, 36.24 mg AA/g, 32.68 mg AA/g, and 32.65 mg AA/g for the four samples, respectively, and value in E2 is higher than the other three samples. The high efficiency of UAE found in the present study might result from strong surface damage on alfalfa so that the flavonoid and antioxidant compounds dissolved more easily in the solvent. Hence, UAE is a promising extraction technique for flavonoid extraction, which has a high efficiency and reduced the extraction time, compared to conventional extraction.


