1. Introduction
Elemental speciation in biological fluids, particularly human plasma, implies investigation of the association between the trace element and available bioligands: proteins and compounds with relatively low molecular weight (LMW). These investigations constitute a basis of metabolic and kinetic studies and are also used to explain the mobility, storage retention and toxicity of metal ions [
1]. Chemical speciation of trace metals in human blood plasma has been discussed in several review articles [
2,
3], but the literature on speciation of metal ions in biological fluids, as a whole, is rather limited. There were two general approaches to the problem of metal speciation: the experimental one and by computer simulation. The experimental approach is focused on developing the instrumental methods for the determination of total and free metal ion concentrations, fraction bond to proteins and fraction of total metal distributed between various LMW ligands. However, since the most of the developed experimental methods considerably disturb the labile equilibria between metal ions and LMW ligands, they are not capable of accurately determining the very low levels of complex species concentrations existing in biological matrices [
4]. Thus, biospeciation of trace metal ions is commonly studied by computer simulation. Two approaches are common: (a) minimization of total Gibbs-free energy of the multi-component system, subjected to the constraints of the elemental mass balance. This approach is used in geochemical and chemical engineering simulations; and (b) equilibrium calculations based on calculation of concentrations by solving the system of mass balance equations. This approach is often used in solution chemistry and requires knowledge of the identity and stability of all metal complexes presented in biological compartment (e.g. human plasma). The aim of the computer simulation of trace element distribution in human blood plasma is to calculate the relative percentages of all presented LMW complexes of metal ions and to assess their distribution under various conditions. This task is of great significance owing to the important role of these complexes in many physiological processes taking place in blood plasma. According to May
et al. [
5], trace metals in blood plasma may be classified into four fractions: (a) non-exchangeable
i.e. tightly bound to the metaloproteins; (b) exchangeable, loosely bound by proteins; (c) complexed by LMW ligands; (d) free (hydrated) metal ions. To calculate the concentration of LMW complexes the binding constants of metal–protein complexes are required, but the relative percentage distribution of trace metal ions amongst the LMW ligands is not controlled by protein binding and so the metal protein equilibria can be bypassed in the plasma model [
6].
Metal ions enter human body mainly from food and drink but their sources may also include industrial particulate matter, medicines,
etc. In blood plasma, they are transported through specific intestinal and/or gastric channels in the form of free (aquated ions) or complexed species with various types of endogenous or exogenous ligands [
7].
Copper is an essential element which plays a critical role in human metabolism. Although, copper exists in both of its common oxidation states Cu
2+ and Cu
+, so far reported models of copper speciation in human blood plasma have mainly focused on Cu
2+ speciation. In blood plasma, 65% of the copper is irreversibly bond to ceruloplasmin (non-exchangeable), ~12% to transcuprein, ~12% is loosely bond to albumin, and a small amount is distributed amongst LMW complexes [
8]. It is well established that mixed ligand ternary complexes with histidine are predominant. It was assumed by Ho
at al. [
9] and May
et al. [
5] that the total Cu
2+ concentration in plasma is 1.6× 10
−11 mol/L and free concentration is 5.1 × 10
−16 mol/L.
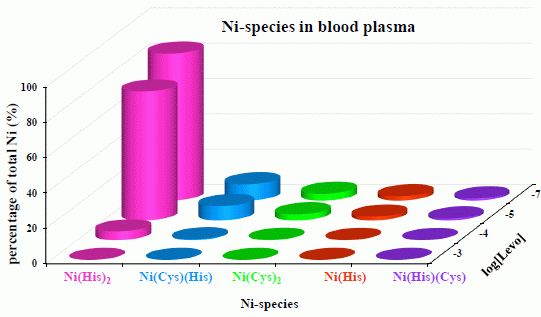
Nickel is an essential constituent of methyl-CoM reductase, CO dehydrogenase and hydrogenase in some strains of bacteria. Its physiological role in human organism is not yet fully elucidated. It is capable of activating or inhibiting a number of enzymes, altering cell membrane properties and influencing various redox processes. The main carrier proteins of nickel in serum are albumin and nickeloplasmin, but it can also be bound to α-2-macroglobulin. Plasma concentration is 10
−7–10
−9 mol/L and free concentration in plasma is ~1.0 × 10
−11 mol/L. Of all LMW ligands, nickel is most strongly bound to histidine [
10].
Zinc is an essential trace element whose total concentration in blood plasma is 1.6 × 10
−5 mol/L and free concentration 10
−9 mol/L. Zn
2+ is rigidly bound to α-2-macroglobulin and as exchangeable fraction to albumin and serum transferrin. Its main LMW complex is with cysteine and ternary complexes with cysteine and histidine [
11].
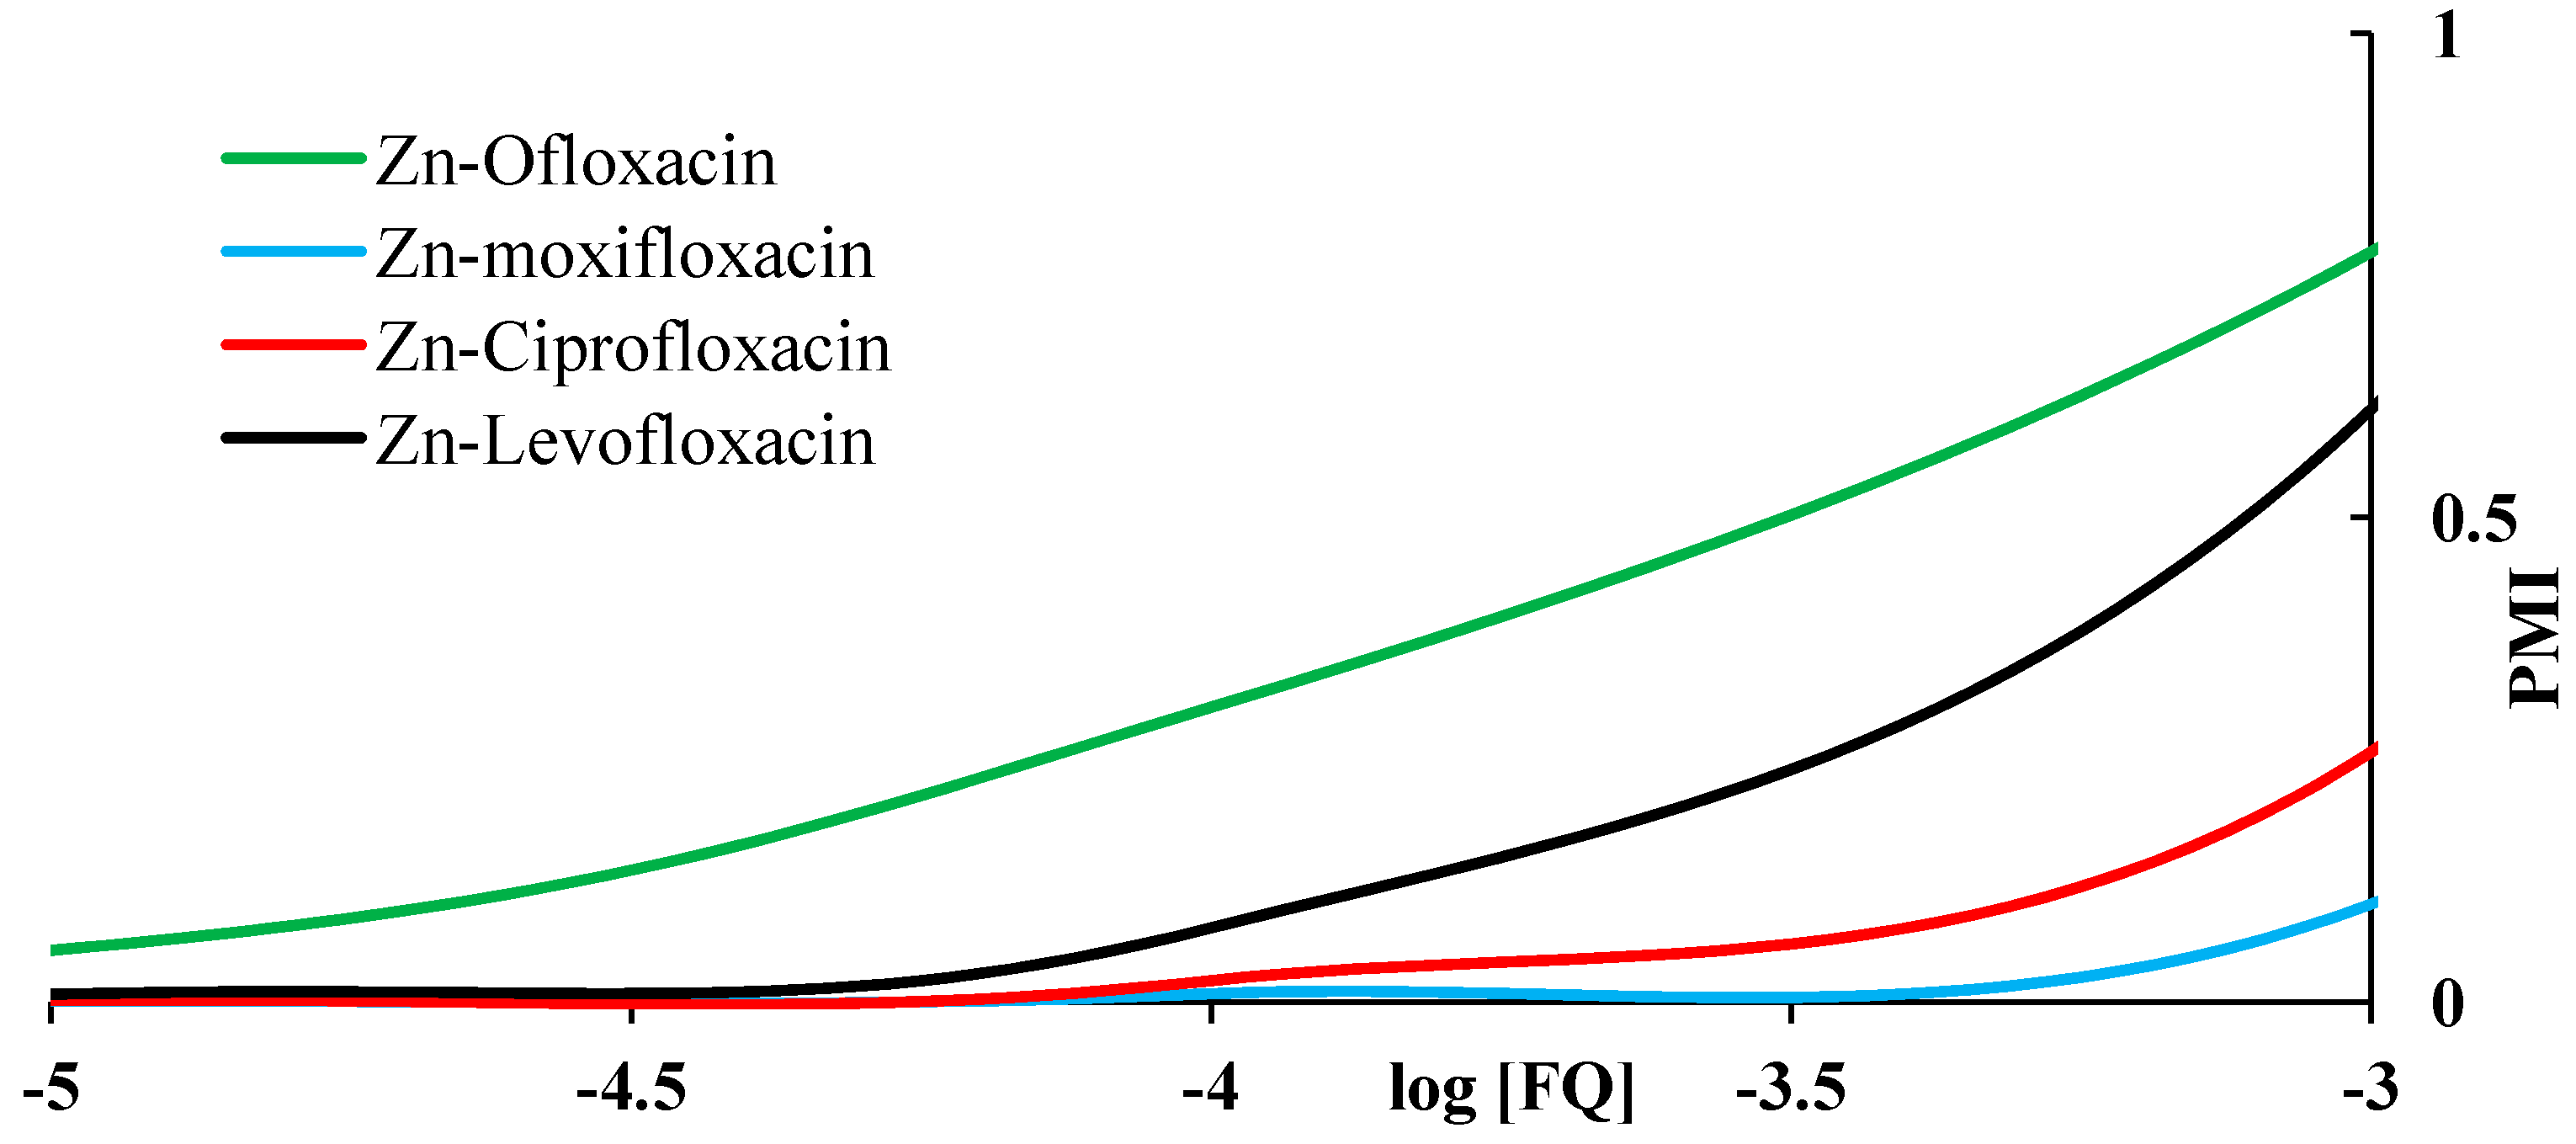
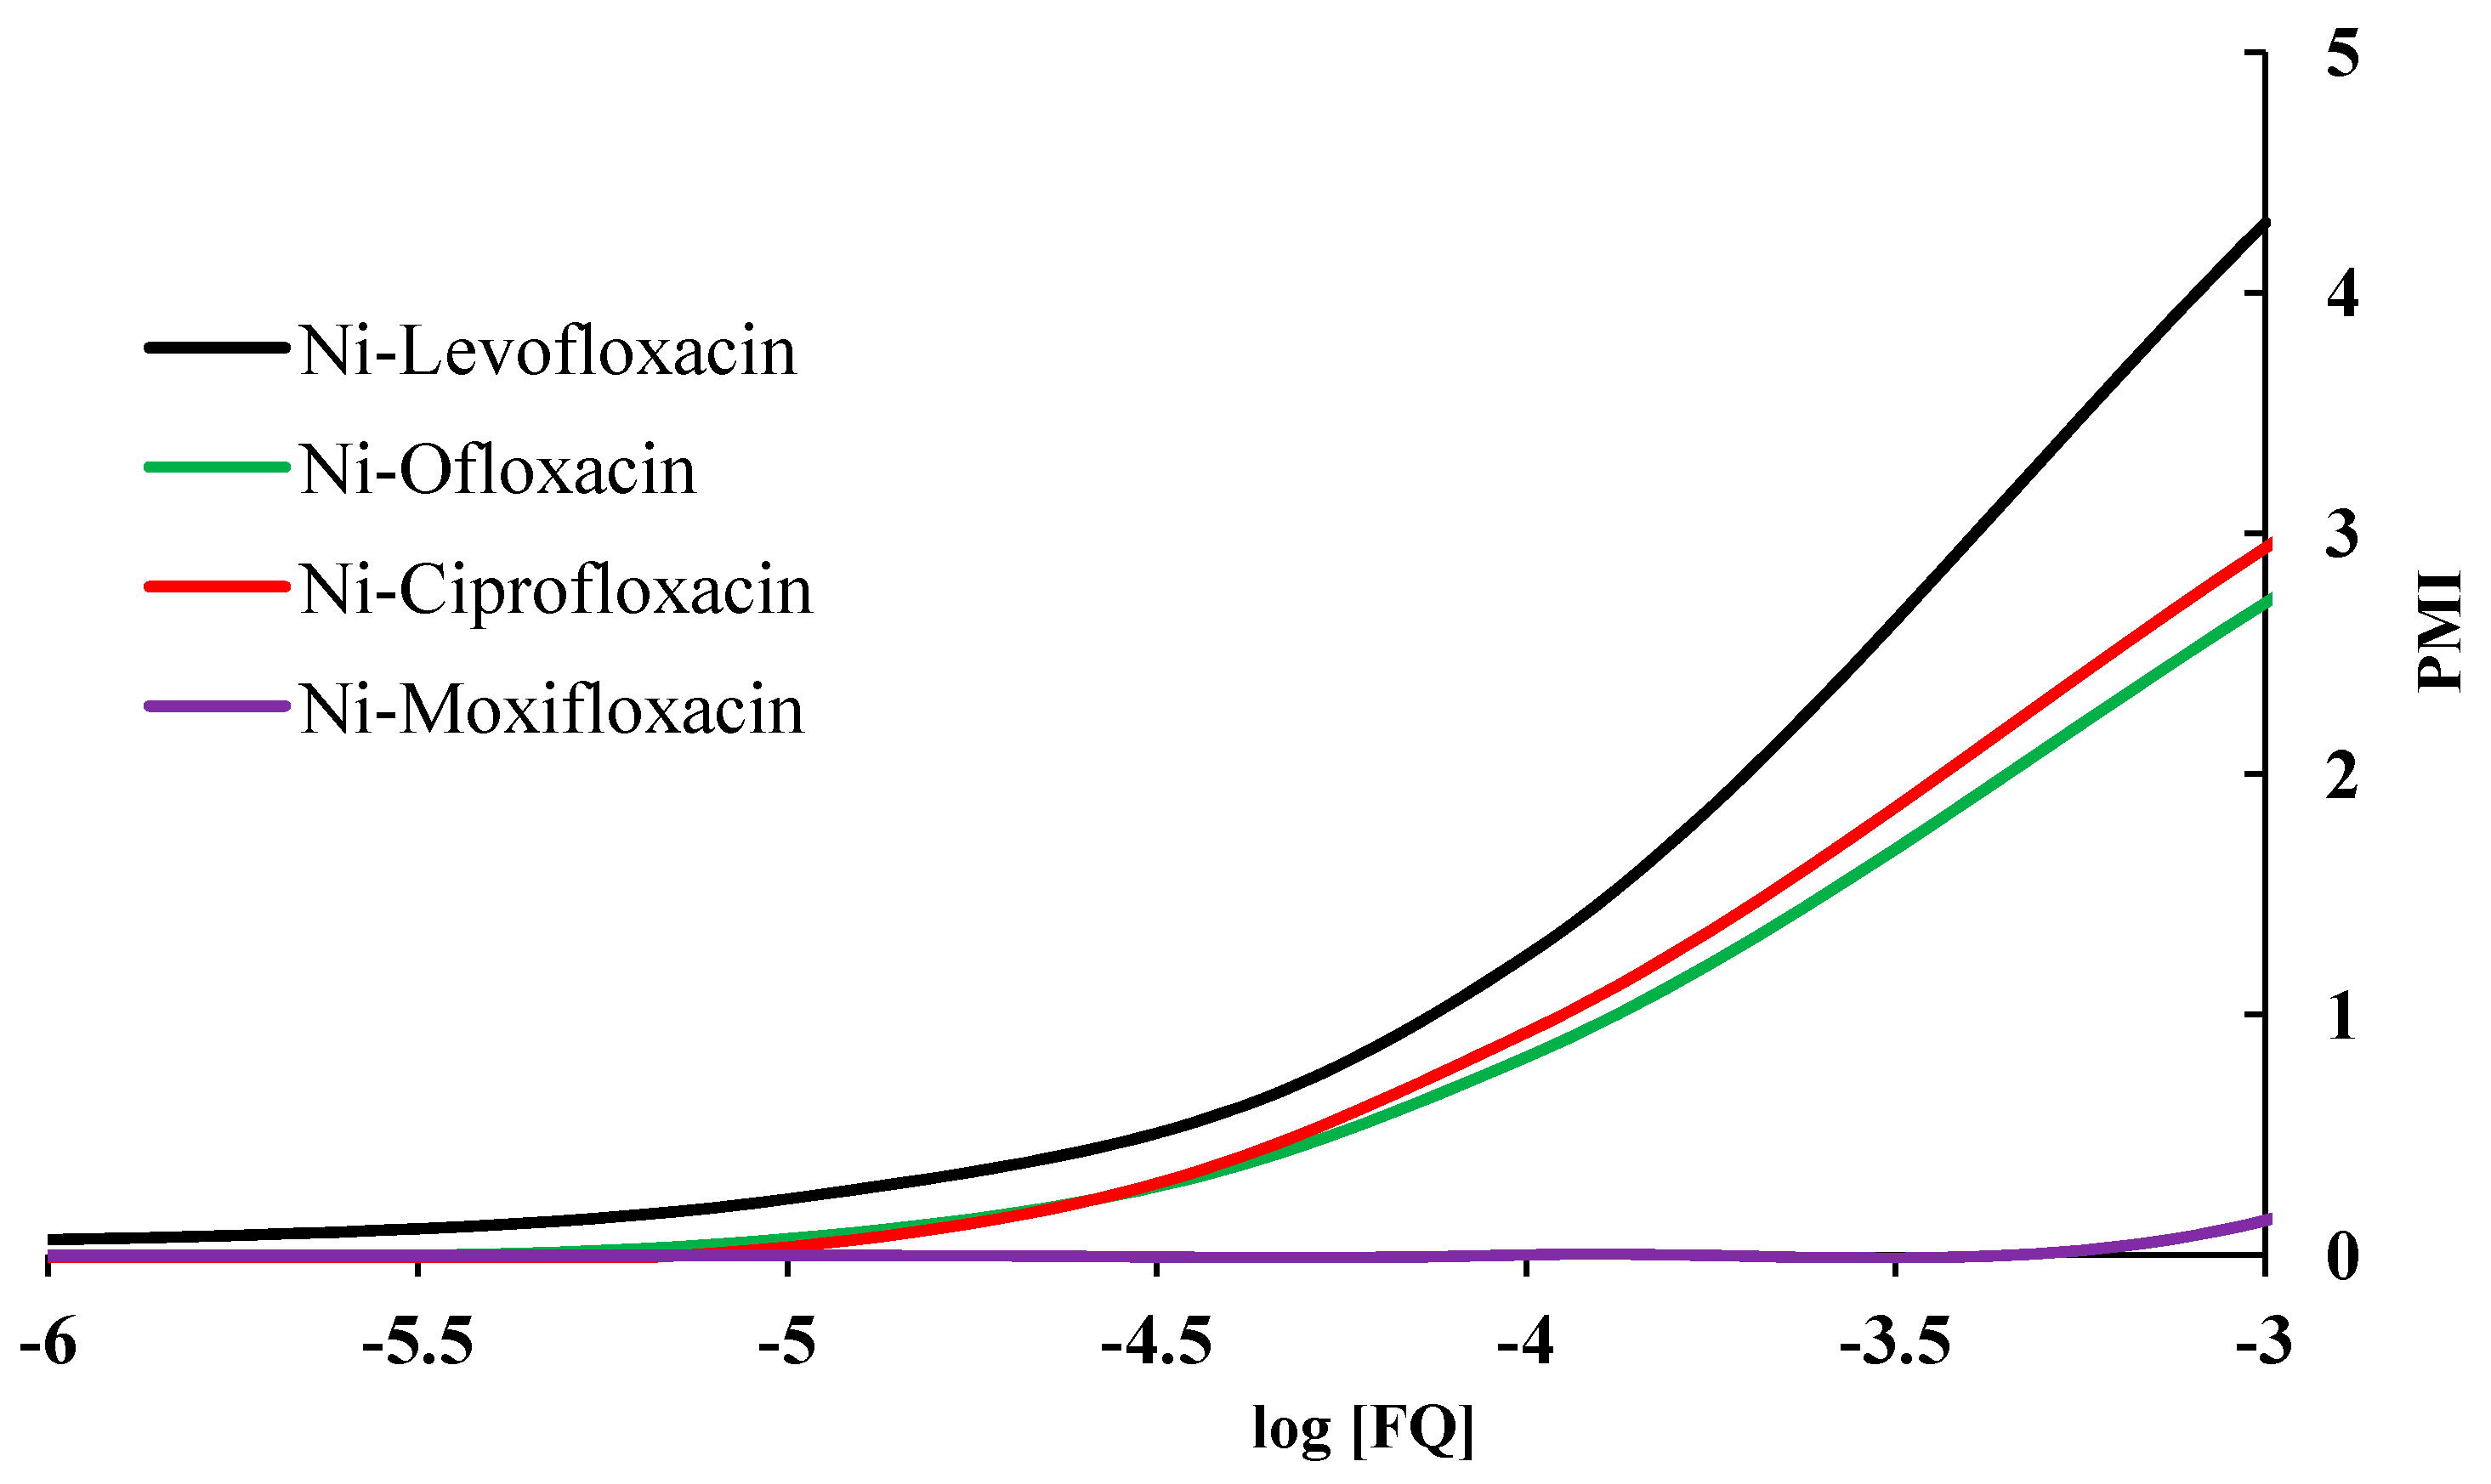
Fluoroquinolones (FQ) are synthetic antibacterial agents which could act as the competitive LMW ligands for trace metal ions in blood plasma [
12,
13,
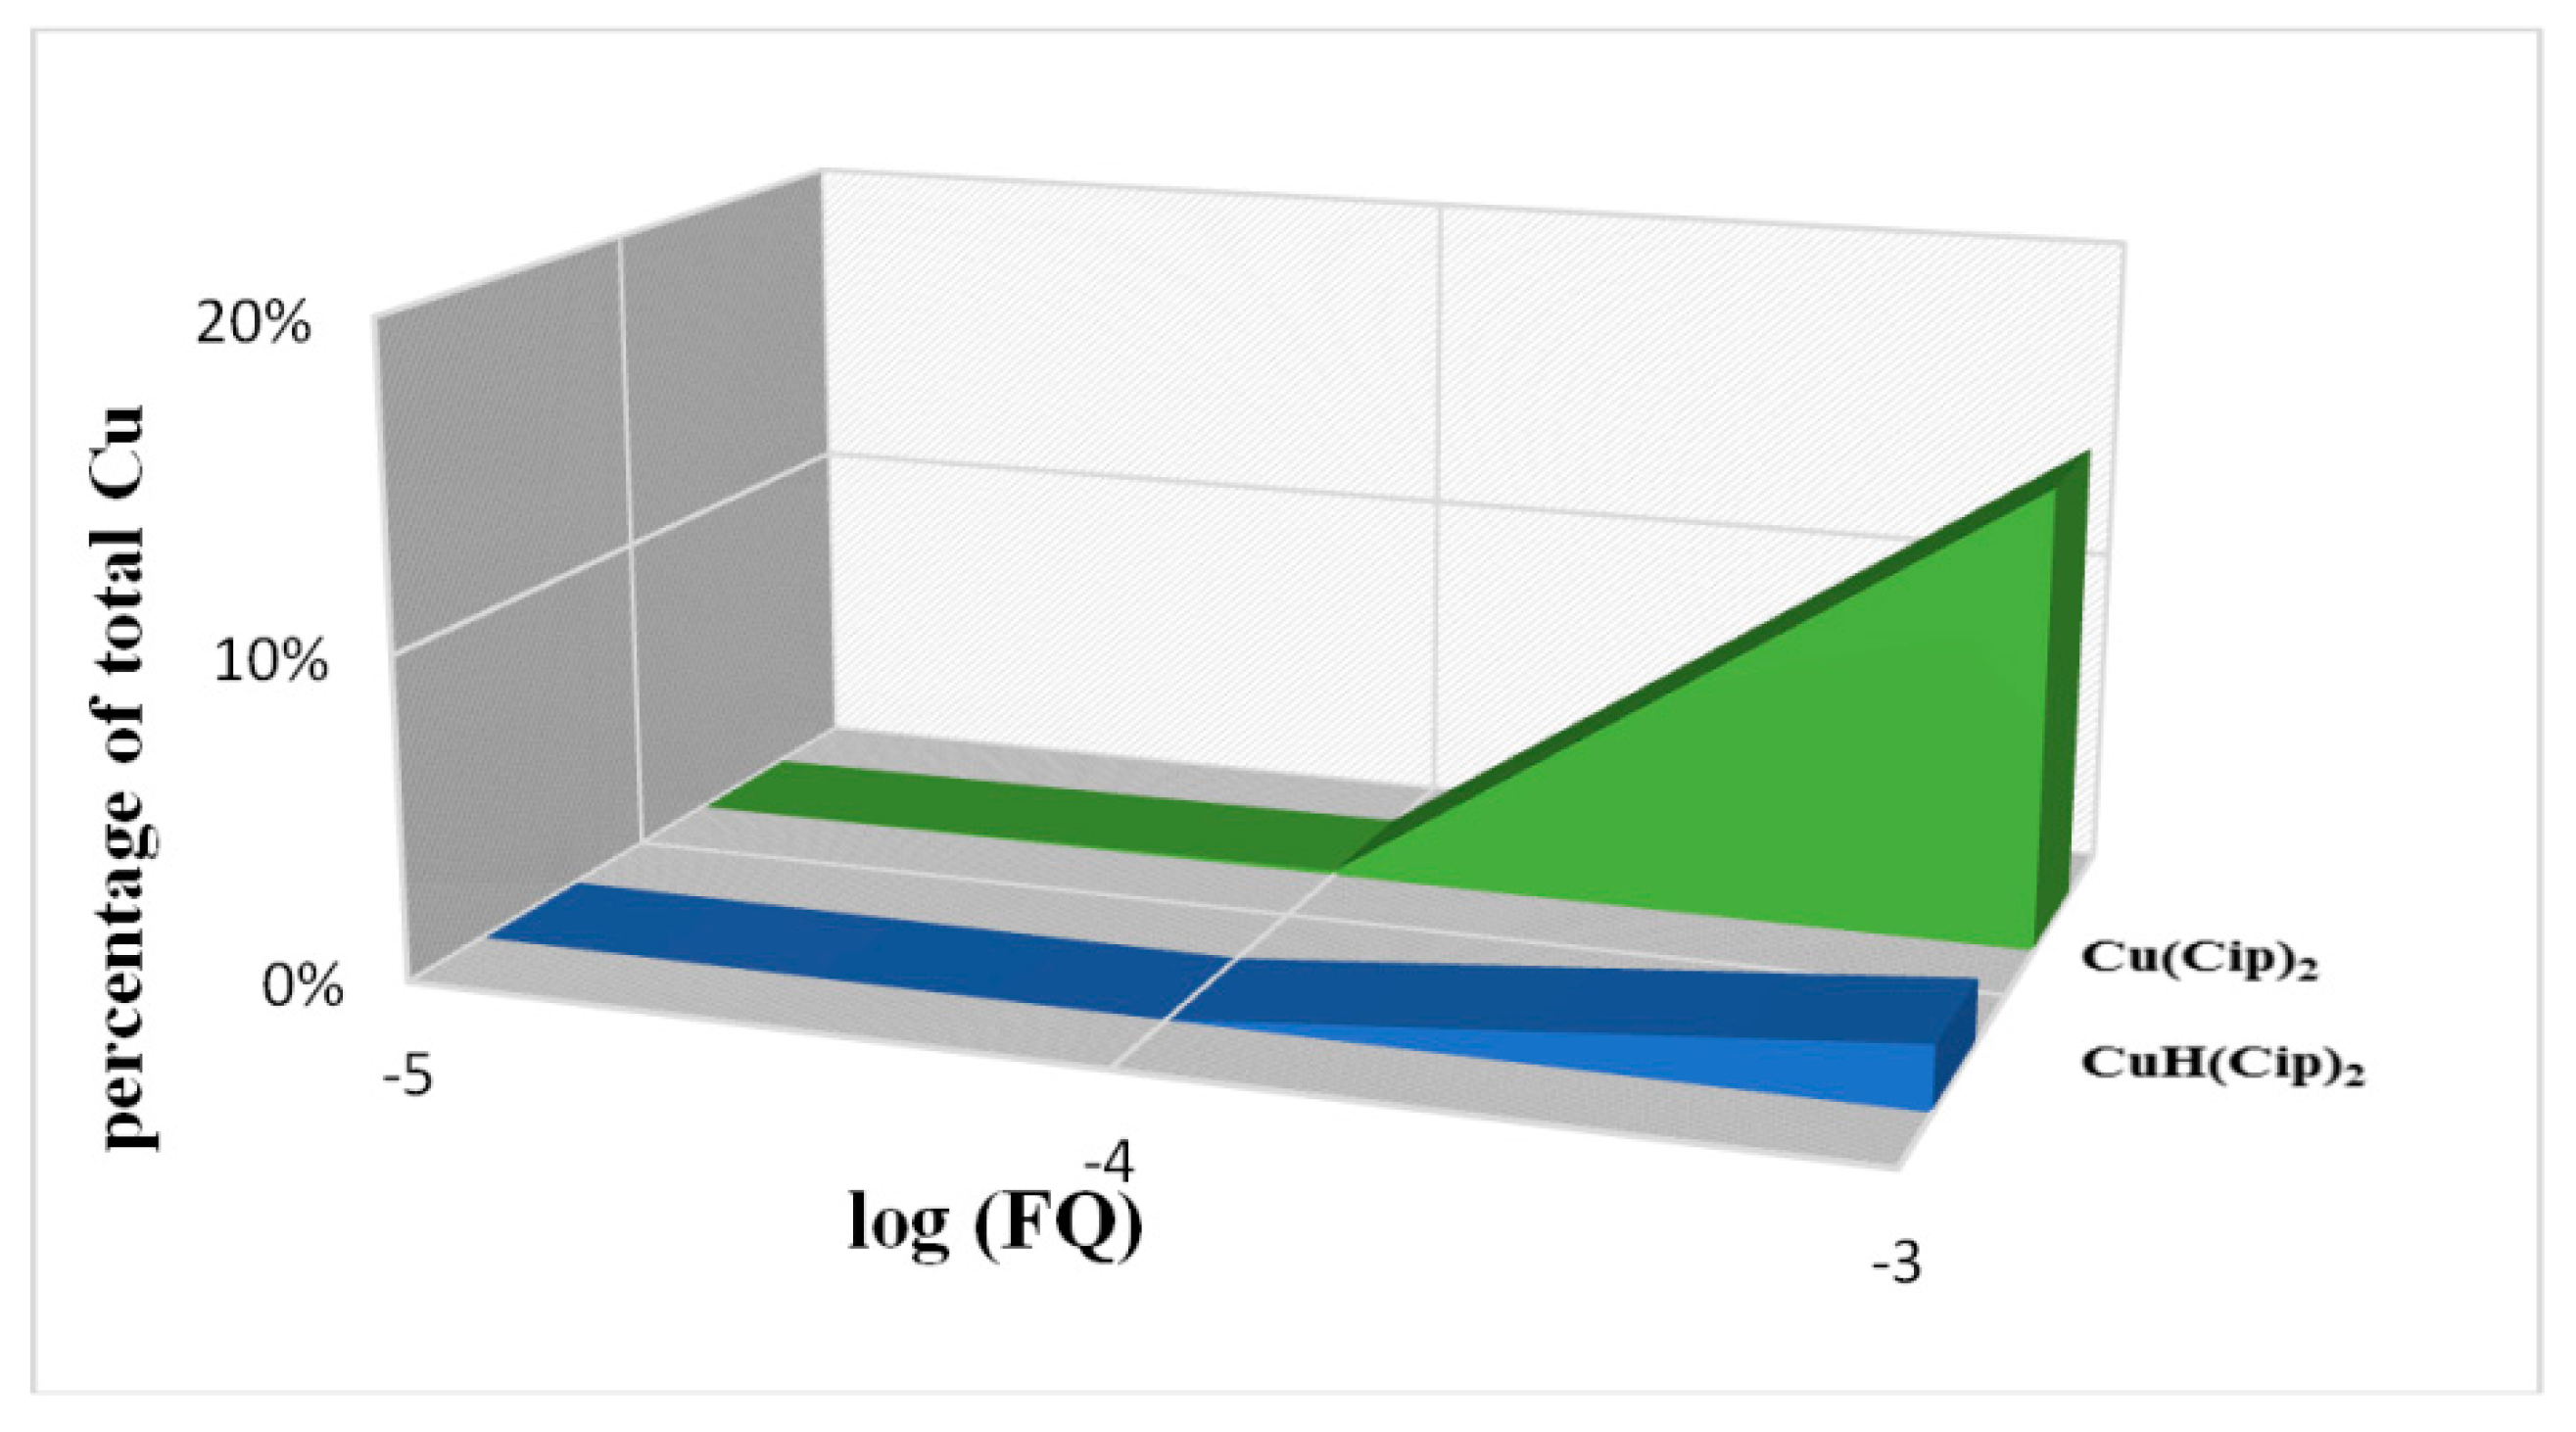
14]. They may remove metal ions from their protein complexes and compete with other naturally occurred ligands in blood plasma for metal binding. Its relative ability to compete for metal ions in blood plasma can be assessed in terms of the plasma mobilizing index (PMI) proposed by May and Williams [
15]. The PMI may be used to determine fluoroquinolone effectiveness at mobilizing Cu
2+, Ni
2+ or Zn
2+ in blood plasma. PMI is defined as:
where
![Molecules 19 12194 i003]()
is the total concentration of the LMW metal ion fraction in the presence of exogenously administered chelating agents and
TLMW is the total concentration of the LMW metal ion fraction in normal plasma. The PMI may serve to compare mobilizing power of various ligands toward particular metal ion. It permits assessment of the capacity of exogenous ligand to increase the amount of the LMW metal ion fraction at the expense of the protein bound metal. The percentage distribution of metal ions in the LMW fraction is computed assuming that the metal-protein complex is buffer free metal ion concentrations in plasma.
Based on our previously described blood plasma model [
16], the aim of the present work was to establish the ability of some members of fluoroquinolone antibacterial agents to mobilize trace metal ions from blood plasma. The obtained data are essential for elucidating the mechanism of action of fluoroquinolones and the influence of metal ions on this mechanism. In addition the obtained results may be used to assess the safety of FQs toward mobilization of metal ions and consequent change of their metabolic pathways.
In this work we studied the effect of a number of FQs (ciprofloxacin-Cipro, ofloxacin-Oflo, levofloxacin-Levo and moxifloxacin-Moxi) on the biodistribution of Cu2+, Ni2+ and Zn2+ ions using the equilibrium calculations method. The goal of this investigation was to evaluate the capacity of some fluoroquinolone antibacterial agents to influence the LMW metal ions fraction in plasma and rationalize their ability to compete for metal ions with endogenous plasma ligands.
3. Experimental Section
3.1. Reagents
Moxifloxacin, (1-cyclopropyl-6-fluoro-8-methoxy-7-[(4aS,7aS)-octahydropyrolo[3,4-b]pyridine-6-yl]- 4-oxo-1,4-dihydroquinoline-3-carboxylic acid hydrochloride) and ciprofloxacin (1-cyclopropyl-6-fluoro-4-oxo-7-(piperazin-1-yl)-quinoline-3-carboxylic acid) (declared purities ˃99.9%) were obtained from Bayer Pharma AG (Berlin, Germany); ofloxacin (9-fluoro-3-methyl-10-(4-methyl-1-piperazinyl)-7-oxo-2,3-dihydro-7H-pyrido-(1,2,3-de)1,4-benzoxazine-6-carboxylic acid) and levofloxacin ((S)-9-fluoro-2,3-dihydro-3-methyl-10-(4-methylpiperazin-1-yl)-7-oxo-7H-pyrido[1,2,3-de]-1,4-benzoxaz-ine-6-carboxylic acid) (≥99.9% pure) were purchased from Sigma Aldrich (St. Louis, MO, USA). Nickel(II) chloride hexahydrate (≥98%, Sigma Aldrich), copper(II) chloride dihydrate (≥99.9%, Sigma Aldrich) and zinc(II) chloride hydrate (≥98%, Sigma Aldrich) were utilized. Doubly distilled water was used for preparation of all solutions (conductivity less a 0.1 µS cm−1).The solutions of fluoroquinolones (5 × 10⁻³ mol/L) were prepared by direct weighing of standard substances.Metal salts were disolved in water with the addition of appropriate amount of HCl to avoid initial hydrolysis of metal ions. The concentration were determined by complexometric titration using EDTA and by electrogravimetry. The excess of HCl in the metal chloride stock solution was determined potentiometrically using Gran’s method. A sodium hydroxide solution was prepared from concentrated volumetric solutions (p.a., Merck, NJ, USA), diluted with freshly boiled doubly distilled water followed by cooling under a constant flow of purified nitrogen. The alkali concentration was checked by titration against potassium hydrogen phthalate. Hydrochloric acid solution was made from HCl “Suprapure” (Merck) and standardized against tris(hydroxymethyl) aminomethane. A sodium chloride solution was prepared from NaCl, (p.a., Merck), by dissolving the re-crystallized salt in twice-deionized water. The concentration of this solution was determined by evaporation of a known volume of solution to dryness at 573 K and weighing the residue. Nitrogen gas, used for stirring solutions and providing an inert atmosphere during the titrations, was purified by passing it through 10% NaOH then 10% H2SO4, alkaline solution of pyrogallol, 0.1 mol/Lsolution of KCl and finally distilled water.
3.2. Instruments
Potentiometric measurements were made on a Tacussel Isis 20000 pH meter (Courthezon, Vaucluse, France, precision ± 0.1 mV or ± 0.001 pH units) equipped with a Radiometer combined electrode. A Metrohm Dosimat model 665 automatic burette with anti-diffusion tip (Herisau, Switzerland), was used for delivery of the titrant.
UV spectral measurements were performed on a double beam UV-Vis spectrophotometer model Lambda 35 (PerkinElmer, Waltham, MA, USA). Operational parameters were: scan speed, 2 nm/s, slit width, 0.3 nm, photometric sensitivity, 0.2 abs. units. Matching pair of 1 cm quartz cuvettes was used for measuring the spectra.
Fluorescence spectra were collected on Shimadzu RF-1501 spectrofluorimeter (Kyoto, KYT, Japan) with a 150 W xenon lamp and 1.0 × 1.0 cm quartz cells. The slit width was set to 10 nm on both the excitation and emission monochromators. To ensure reproducible experimental conditions instrument performance was checked daily using quinine sulphate solution (4 g/L quinine in 0.5 mol/LH2SO4).
ESI MS spectra were collected on an LCQ Fleet 3D Ion Trap Mass Spectrometer (Thermo Fisher Scientific, Waltham, MA, USA). 1H-NMR spectra were recorded on Varian Gemini 200 spectrometer (Palo Alto, CA, USA).
3.3. Procedure
3.3.1. Potentiometric Titrations
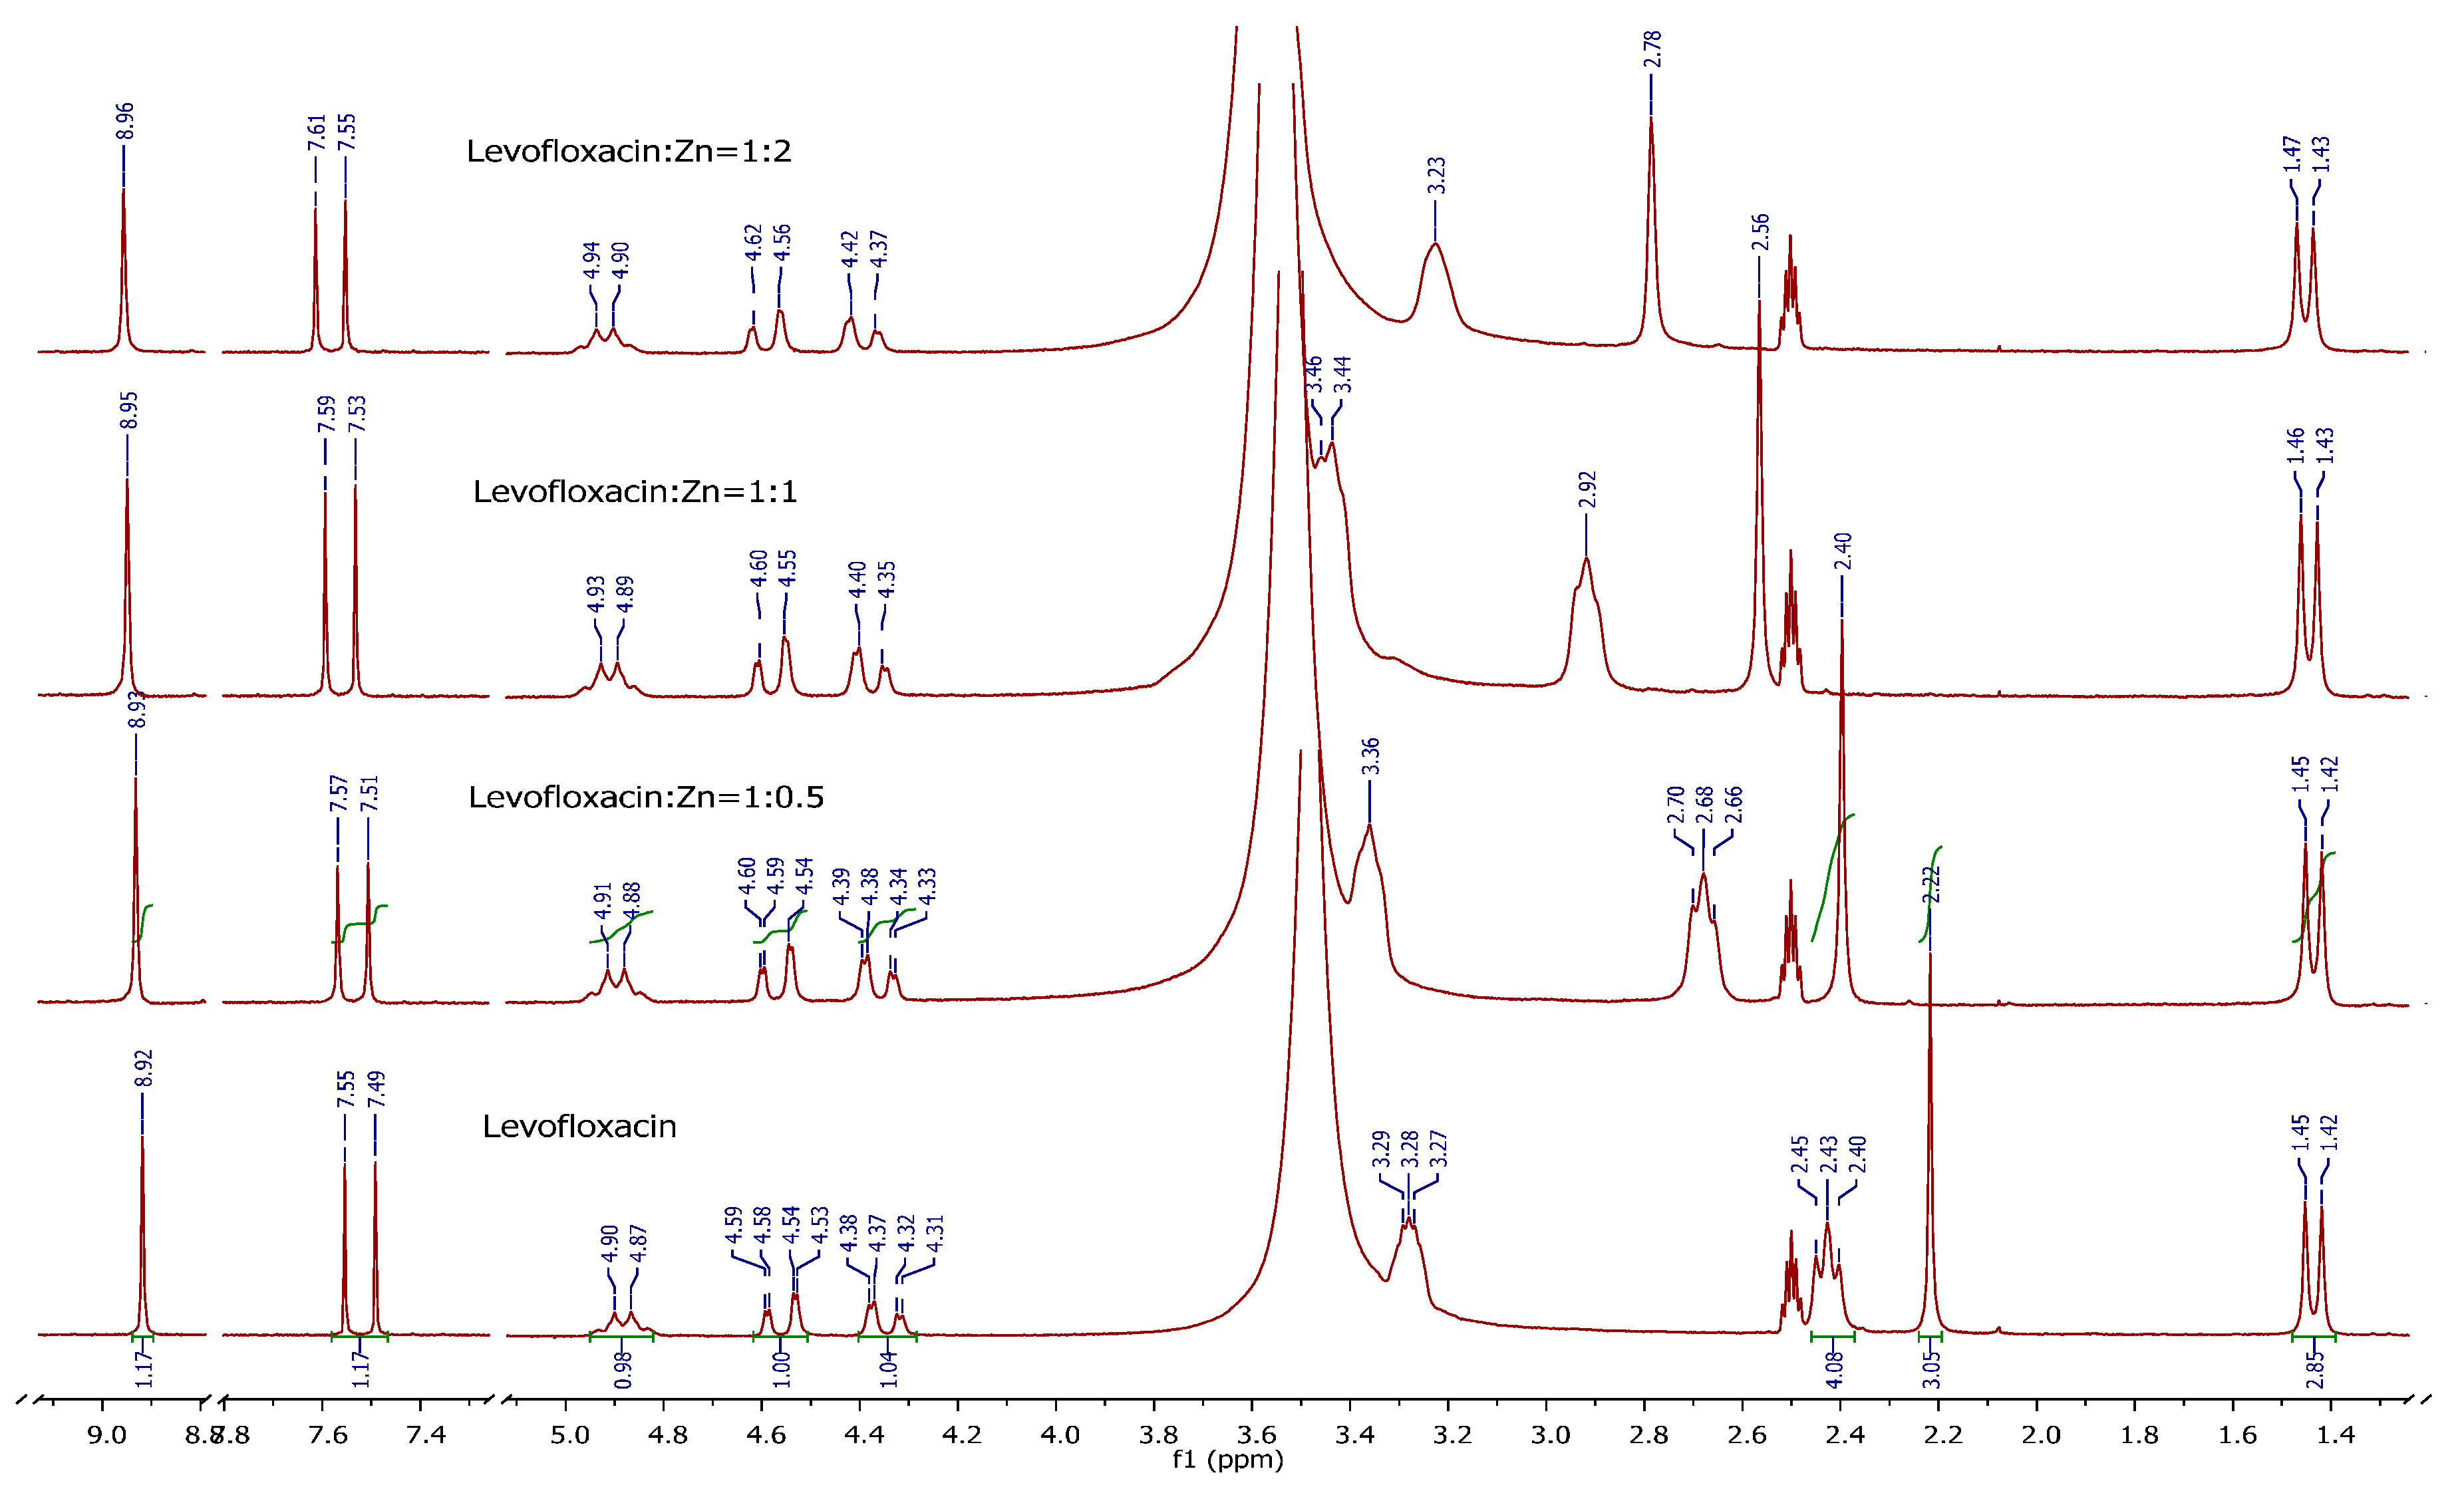
Potentiometric titrations were carried out in a double-walled glass vessel, thermostatted at 310 K. The ionic strength of all test solutions was adjusted to 0.15 mol/Lwith sodium chloride. All measurements were performed under a nitrogen atmosphere. The titration protocol was chosen in such a way that the protonation, hydrolysis and complexation reactions would proceed in the conditions as close to true equilibrium as possible. Usually stable potential readings were obtained in 3–5 min after addition of the titrant. If equilibrium could not be established within specified time interval the point was discarded. The electrode parameters, E0, Q and Ej from Nernst equation: E = E0 + Q logh + Ej were determined by strong acid-strong base titration to check the system suitability. During the titrations of the test solutions the E0 and Ej were determined using the data in the acidic region where no hydrolysis or complexation takes place (assuming that h is equal to the analytical concentration of proton), by plotting E–Q log h against h and extrapolating the straight line so obtained to h = 0. The free proton concentration was then calculated through the equation: logh = (E – E0 – Ej)/Q which was applied to the whole titration curve. All titrations were carried in duplicate. The agreement between duplicate titration was better than 1%. The samples of FQ + metal ion solutions were titrated with sodium hydroxide and all titration were performed in the pH range from 2 to 11 with constant ionic strength (I = 0.15 mol/LNaCl) and under purified nitrogen atmosphere at 310 K. Molar ratios between metal ions and fluoroquinolones ranged from 1:1 to 1:2 for all M-FQ systems.
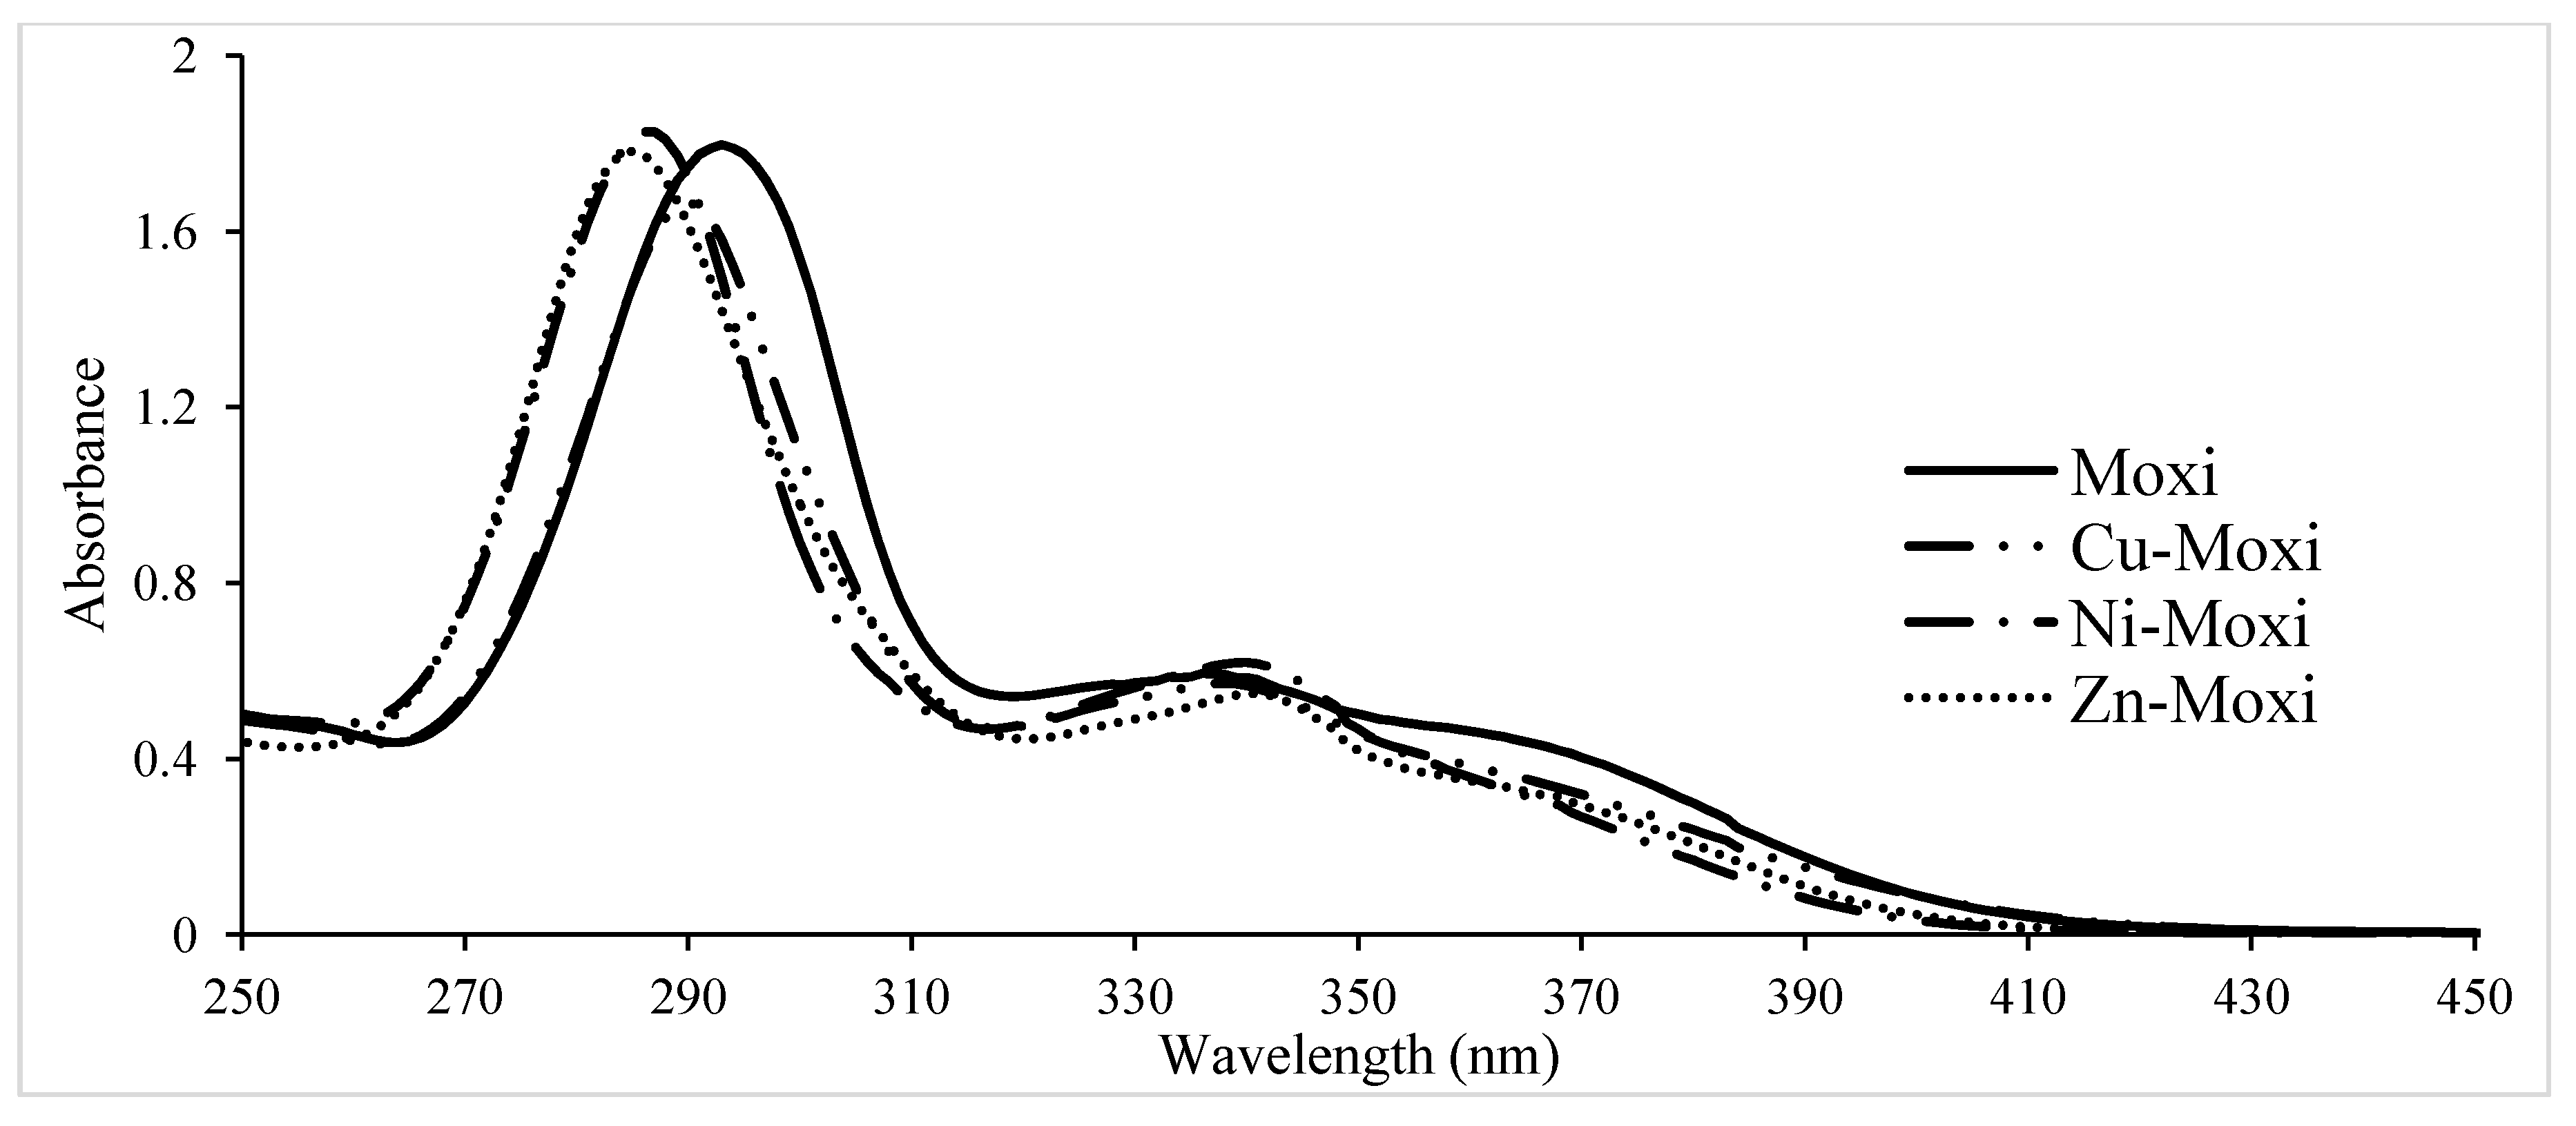
3.3.2. Spectrophotometric Measurements
Spectra of solutions of FQ alone (5 × 10⁻⁵ mol/L) and FQ+metal ion in the pH range 2.0–11.0 in 0.15 mol/LNaCl ionic medium, at 310 K were taken in the wavelength range 250–450 nm. Metal concentration was held constant (2.5 × 10⁻⁵ mol/L). The pH of all solution was adjusted by the addition of 0.1 mol/LHCl or 0.1 mol/LNaOH. Solutions were left for 0.5 h before scanning. Another set of spectrophotometric data was performed as spectrophotometric titration. The solution from the titration cell was pumped after each addition of alkali to spectrophotometer flow through 10 mm quartz cuvette using peristaltic pump.
3.3.3. Spectrofluorimetric Measurements
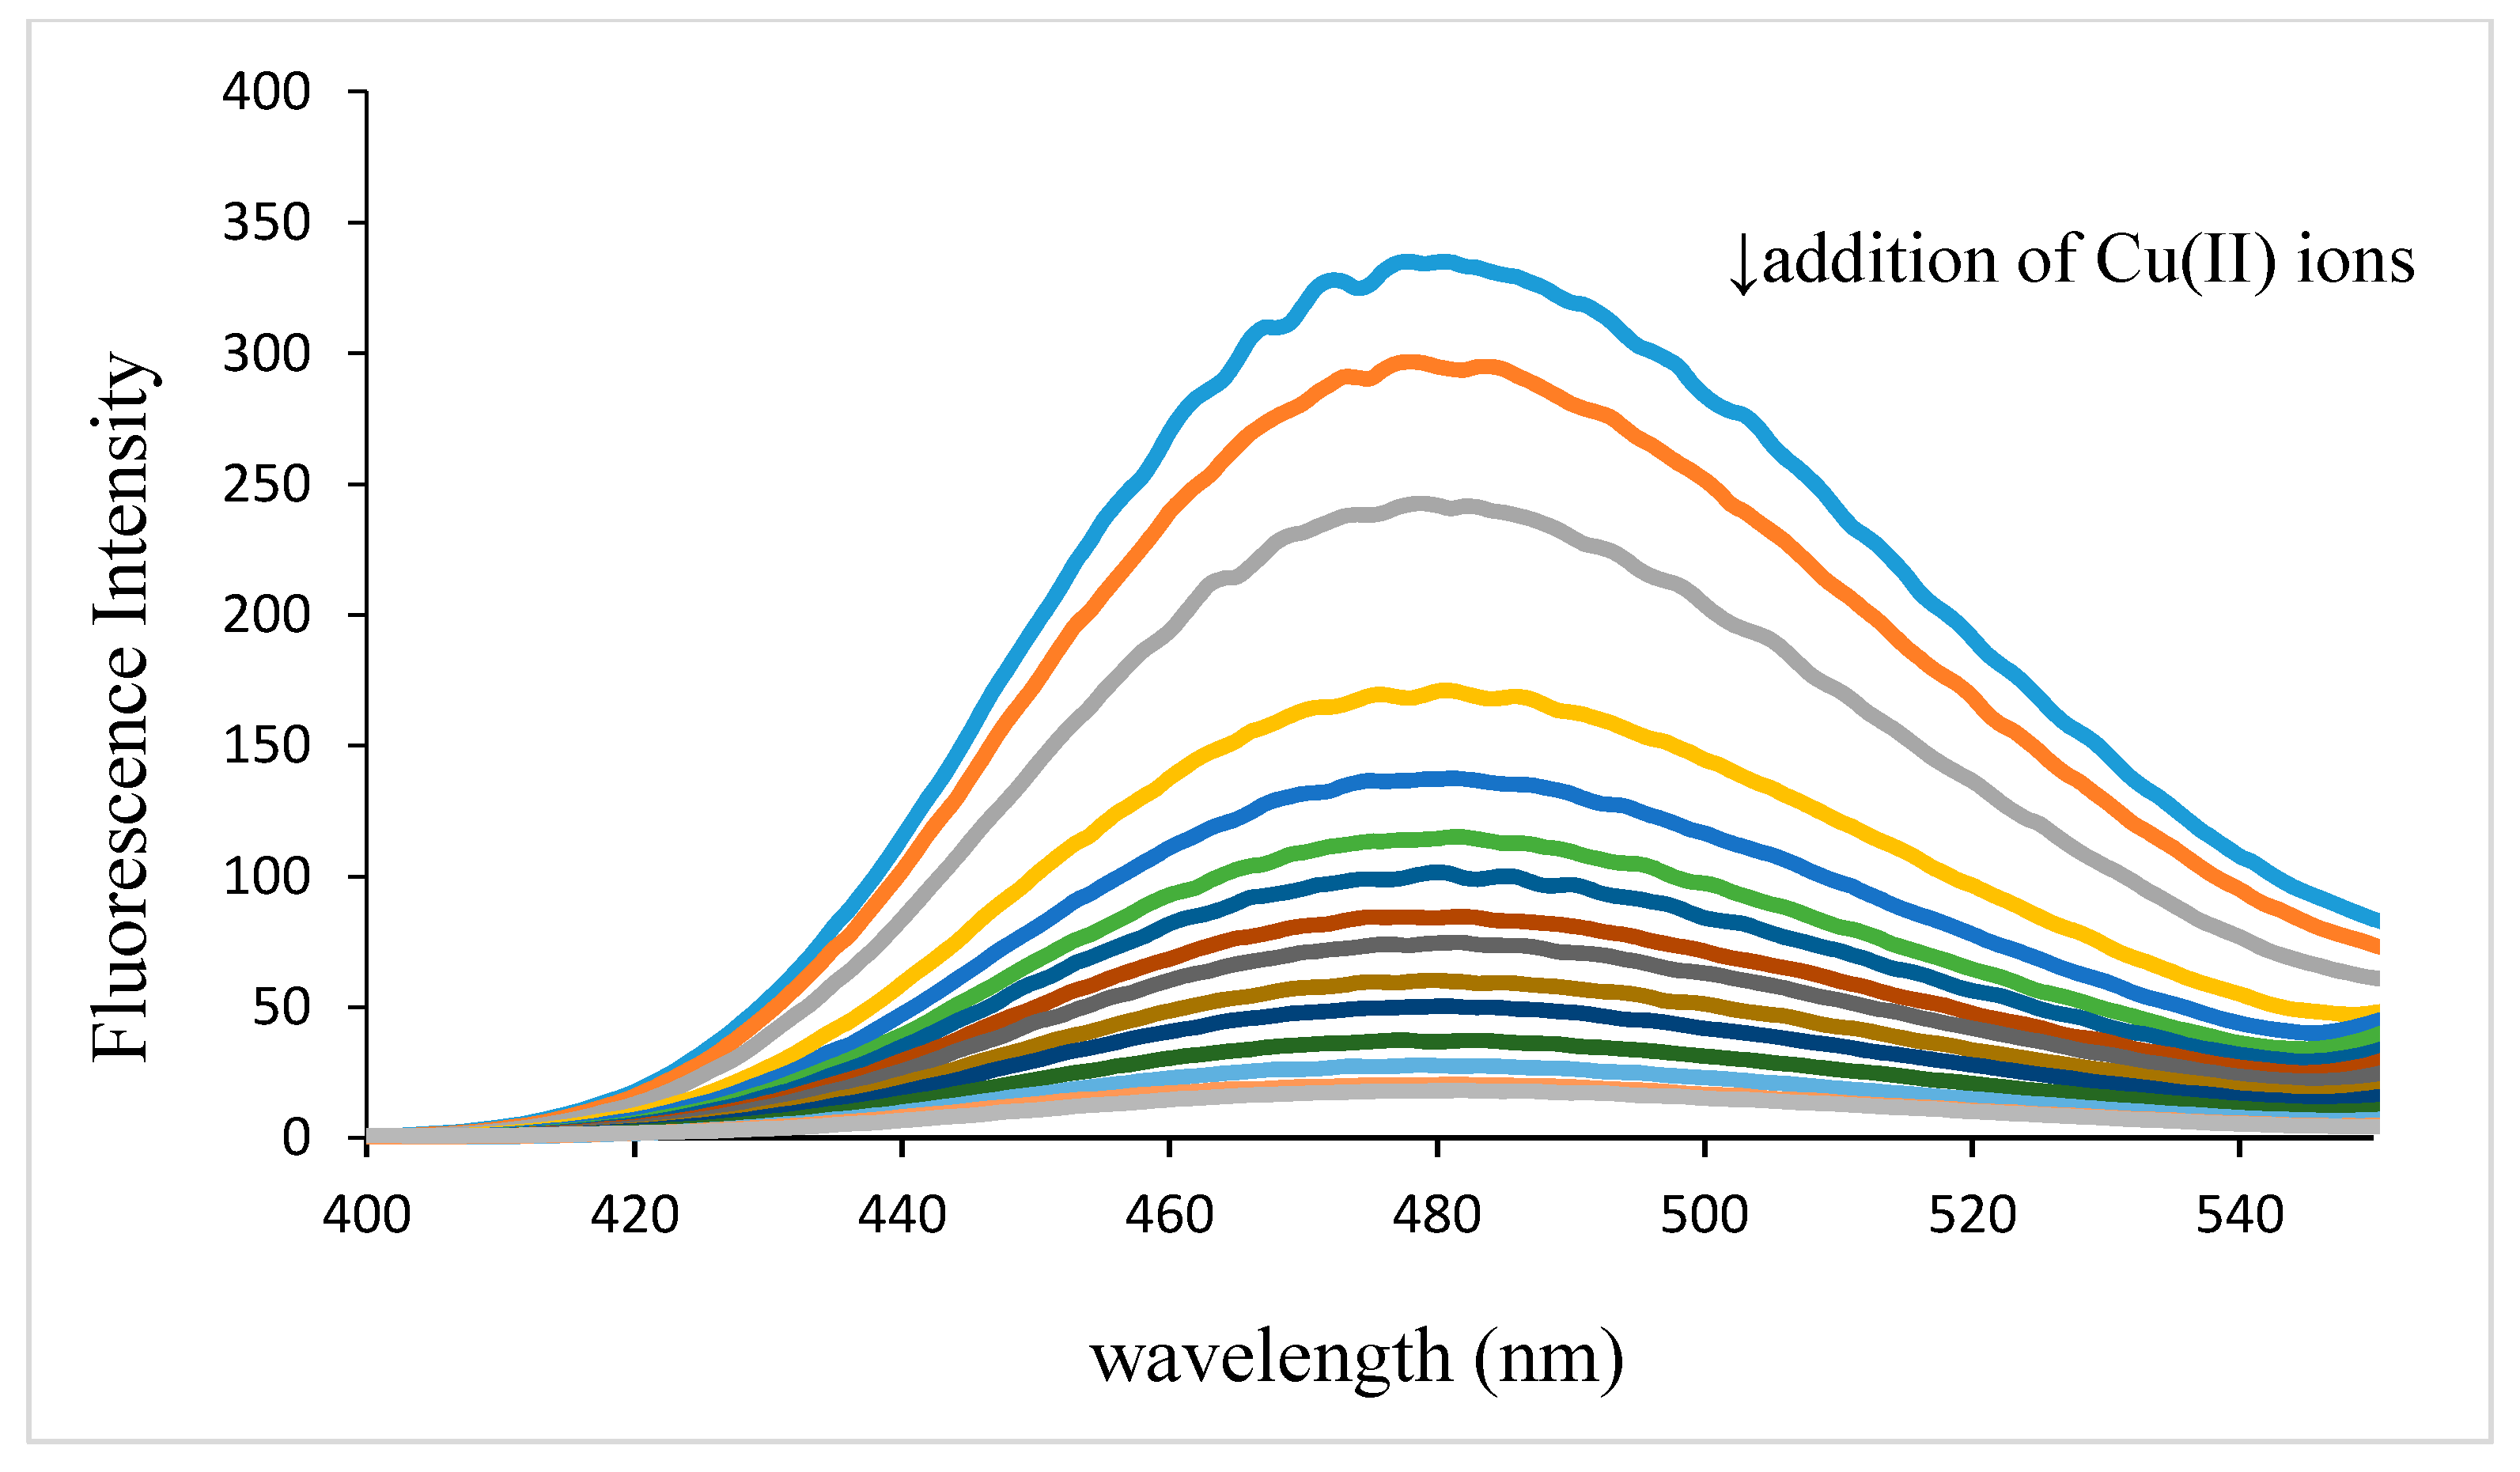
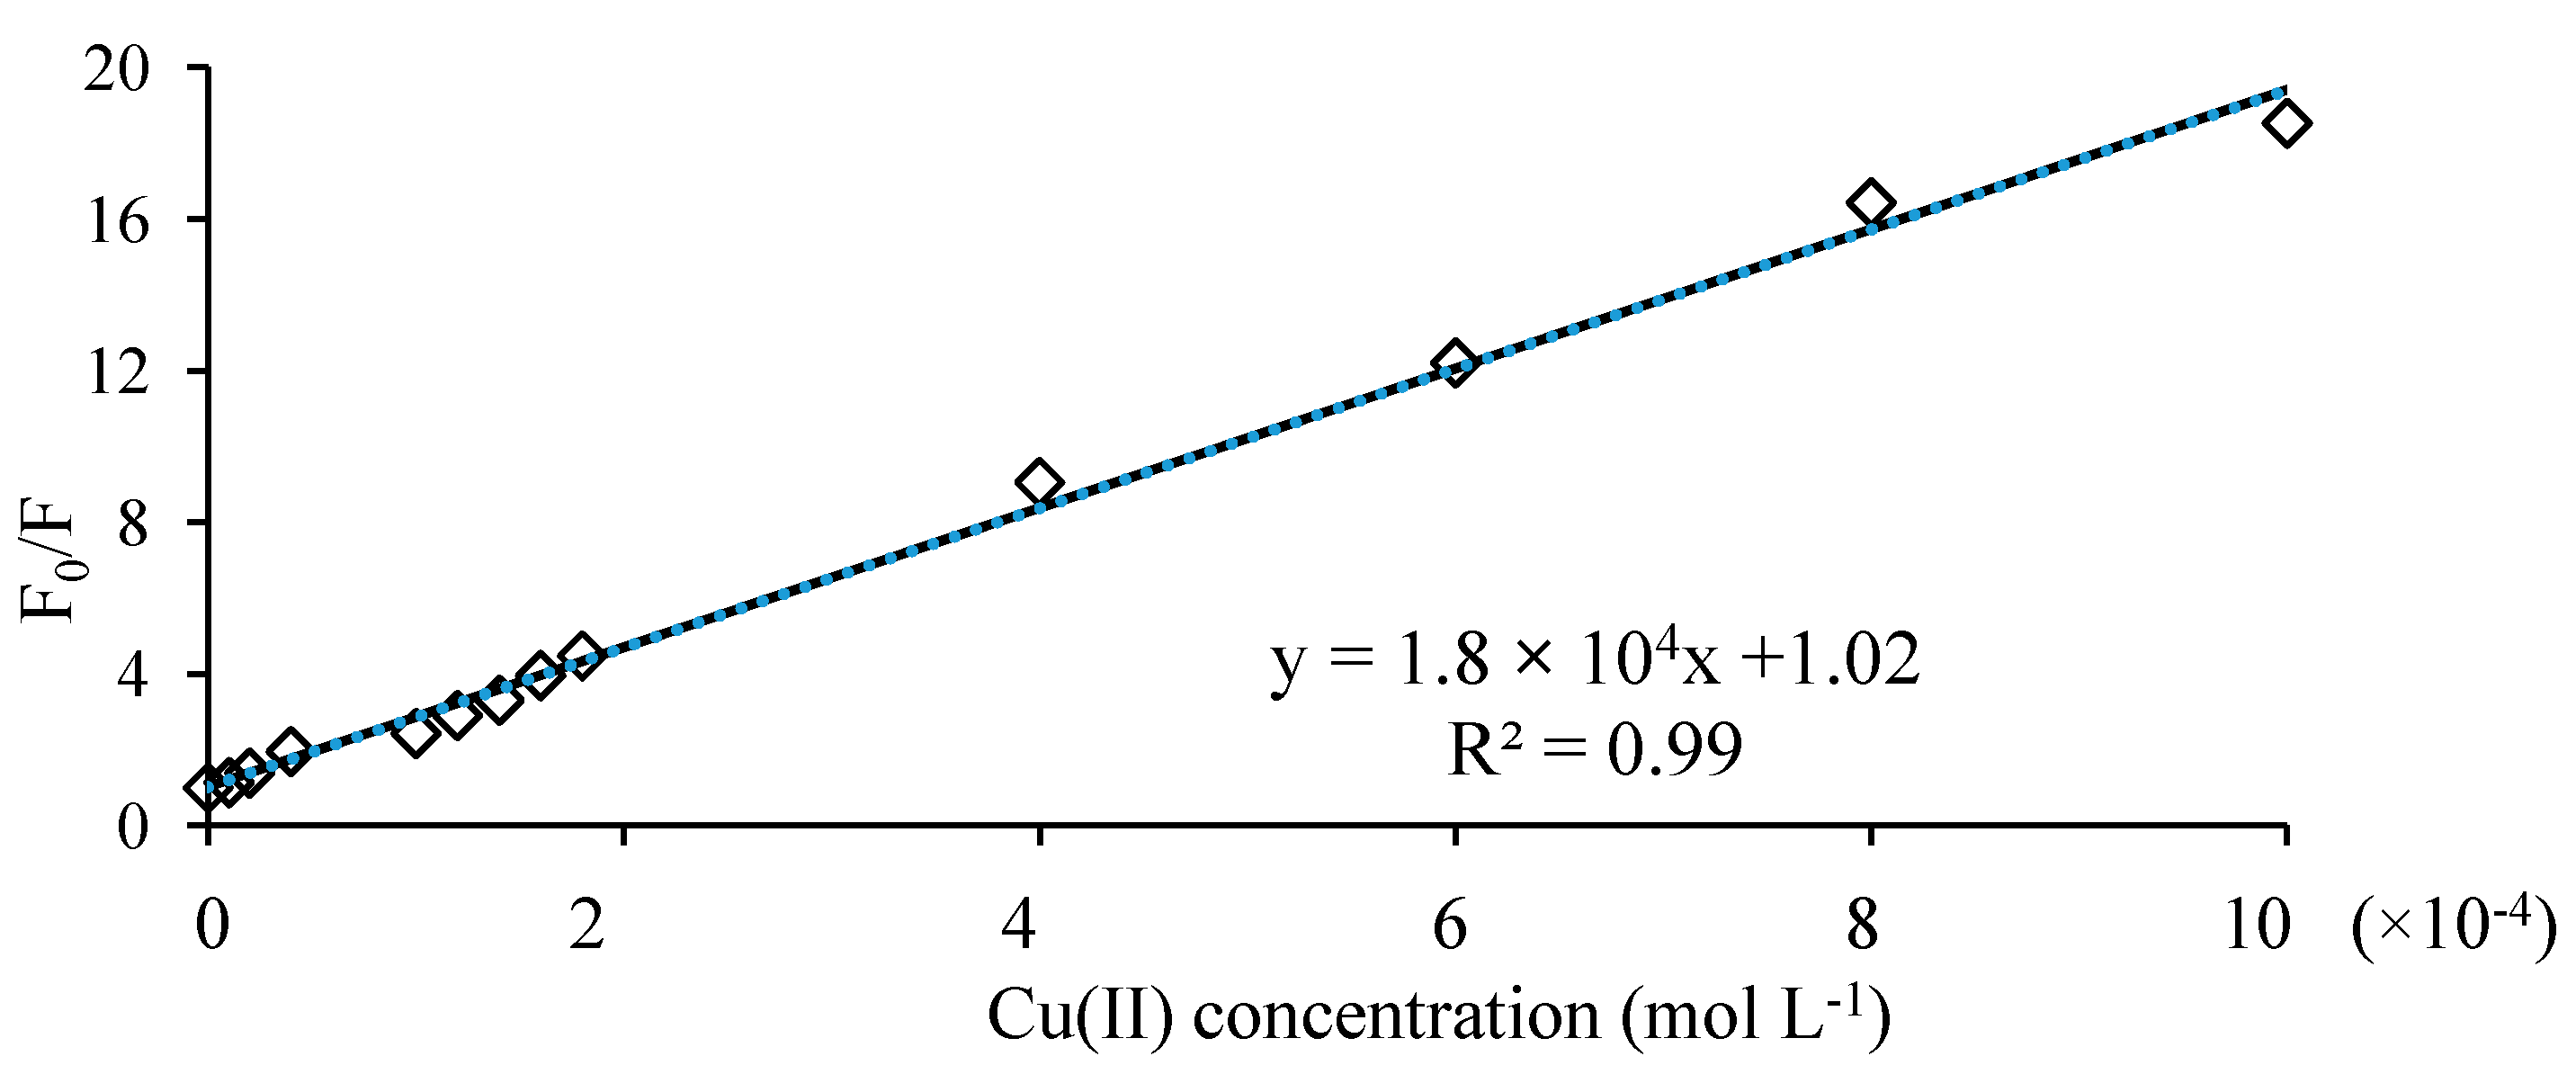
The excitation and emission spectra were taken for either levofloxacin or ofloxacin (2.0 mmol/L) with and without presence of copper ion. Aliquots of 0.1 mL of standard solution of either levofloxacin or ofloxacin were transferred into 10 mL volumetric flask, using Ependorf pipette and in each flask 2 mL of phosphate buffer (pH 7.40) and different volumes (0–0.3 mL) of copper ion solution (10 mmol/L)) were added. After dilution to the mark with water and thorough mixing, the fluorescence intensity of each spectrum was measured in wavelength range 400–650 nm with excitation at 292 nm.
3.3.4. ESI-MS Measurements
For ESI-MS measurements FQ-metal solutions were prepared in the FQ to metal ion concentration ratio 2:1 at the pH 4.5 adjusted with ammonium formate buffer. Concentration of fluoroquinolone in solutions was 2 × 10⁻⁴ mol/L. The ESI–source parameters were as follows: source voltage 4.7 kV, capillary voltage 23 V, tube lens voltage 90 V, capillary temperature 220 °C, sheath gas flow (N2) 32 (arbitrary units). ESI-MS spectra were acquired by full range acquisition of m/z 200–2000. The normalized collision energy of the CID cell was set at 8–20 eV.
3.3.5. NMR Measurements
All 1H-NMR spectra were recorded in DMSO-d6 and in D2O solutions. Typical conditions for 1H-NMR measurements were: spectral width 3,500 Hz, pulse delay time 1 s, no of scans 72. Chemical shifts (δ, ppm) were obtained for 3-trimethylsilylpropionic acid-d4 sodium salt as an internal standard (δ = 0.000 ppm).
3.4. Data Treatment
The species formed in the studied systems were characterized by the general equilibrium:
and the corresponding constants are given by:
where FQ
− is the deprotonated molecule of the ligand. Fully protonated fluoroquinolone is donated as H
2FQ
+. The concentration stability constants of complexes
βp,q,r were calculated with the aid of the suite of computer programs Hyperquad2006 [
17]. In Hyperquad calculations the identity and stability of complexes which give the best fit to the experimental data, were determinated by minimizing the error squares sum of the potentials,
U: U = ∑wi(Eobs − Ecalc)2 where
wi represents a statistical weight assigned to each point of titration curve,
Eobs and
Ecalc refer to the measured potential of the cell and the calculated one assuming the specific model and trial constants, respectively. Quality of fit was judged by usual statistical parameters: Pearsons test,
χ2, standard deviation in potential residuals,
s, and the difference between experimentally determined and calculated standard EMF of the cell. If this difference was higher than 1 mV the titration was discarded. The spectrophotometric data were evaluated with Hyperquad2006 and pHab2006 programs. The composition, stability and molar absorptivities,
εp,q,r of complexes were determinated by minimizing the sum, S, defined as: S =
∑(Aobs − Acalc)2 where
Aobs and
Acalc refer to measured absorbance and that calculated according to equation:
Acalc =
∑ βp,q,r[M]p [FQ]q [H]r εp,q,r. Acceptance criteria for each particular model were: S lower than 1.0 × 10
−2 and standard deviation of the fit of the spectrum (SD) less than 0.08 units. For Hyperquad calculations the spectra were digitized at 2 nm intervals. The final model obtained in Hyperquad calculations was optimized.
3.5. The Human Blood Plasma Model and Speciation Calculation
In developing the computer model of blood plasma, we updated the May
et al. model of blood plasma and constructed a model including nine metals, 43 ligands and over 6,100 complexes [
5]. The free concentration of all metal ions (component) was calculated by solving a mass balance equation written for each component:
where
Ci is the total analytical concentration of component
i, [
Xi] the concentration of free component
i, and
Xji the stoichiometric factor of component
i in species
Sj. The species
Sj is formed from the components A, B, C… according to equations:
where {} denotes activity, and a,b,c… are stoichiometric factors of components A, B, C in species
Sj, respectively, and
βj is the stability constant of
Sj.
Total concentrations of all components were taken from published papers and Geigy tables [
53,
54,
55,
56,
57,
58,
59,
60,
61,
62,
63]. The stability constants were extracted from the literature and were necessary adjusted to 310 K and ionic strength of 0.15 mol/L [
64,
65,
66]. The equilibrium constants not available in the literature were measured in this work or estimated using LFER approach. A complete list of complexes of components and constants was described in detail in our previous work [
16].


 is the total concentration of the LMW metal ion fraction in the presence of exogenously administered chelating agents and TLMW is the total concentration of the LMW metal ion fraction in normal plasma. The PMI may serve to compare mobilizing power of various ligands toward particular metal ion. It permits assessment of the capacity of exogenous ligand to increase the amount of the LMW metal ion fraction at the expense of the protein bound metal. The percentage distribution of metal ions in the LMW fraction is computed assuming that the metal-protein complex is buffer free metal ion concentrations in plasma.
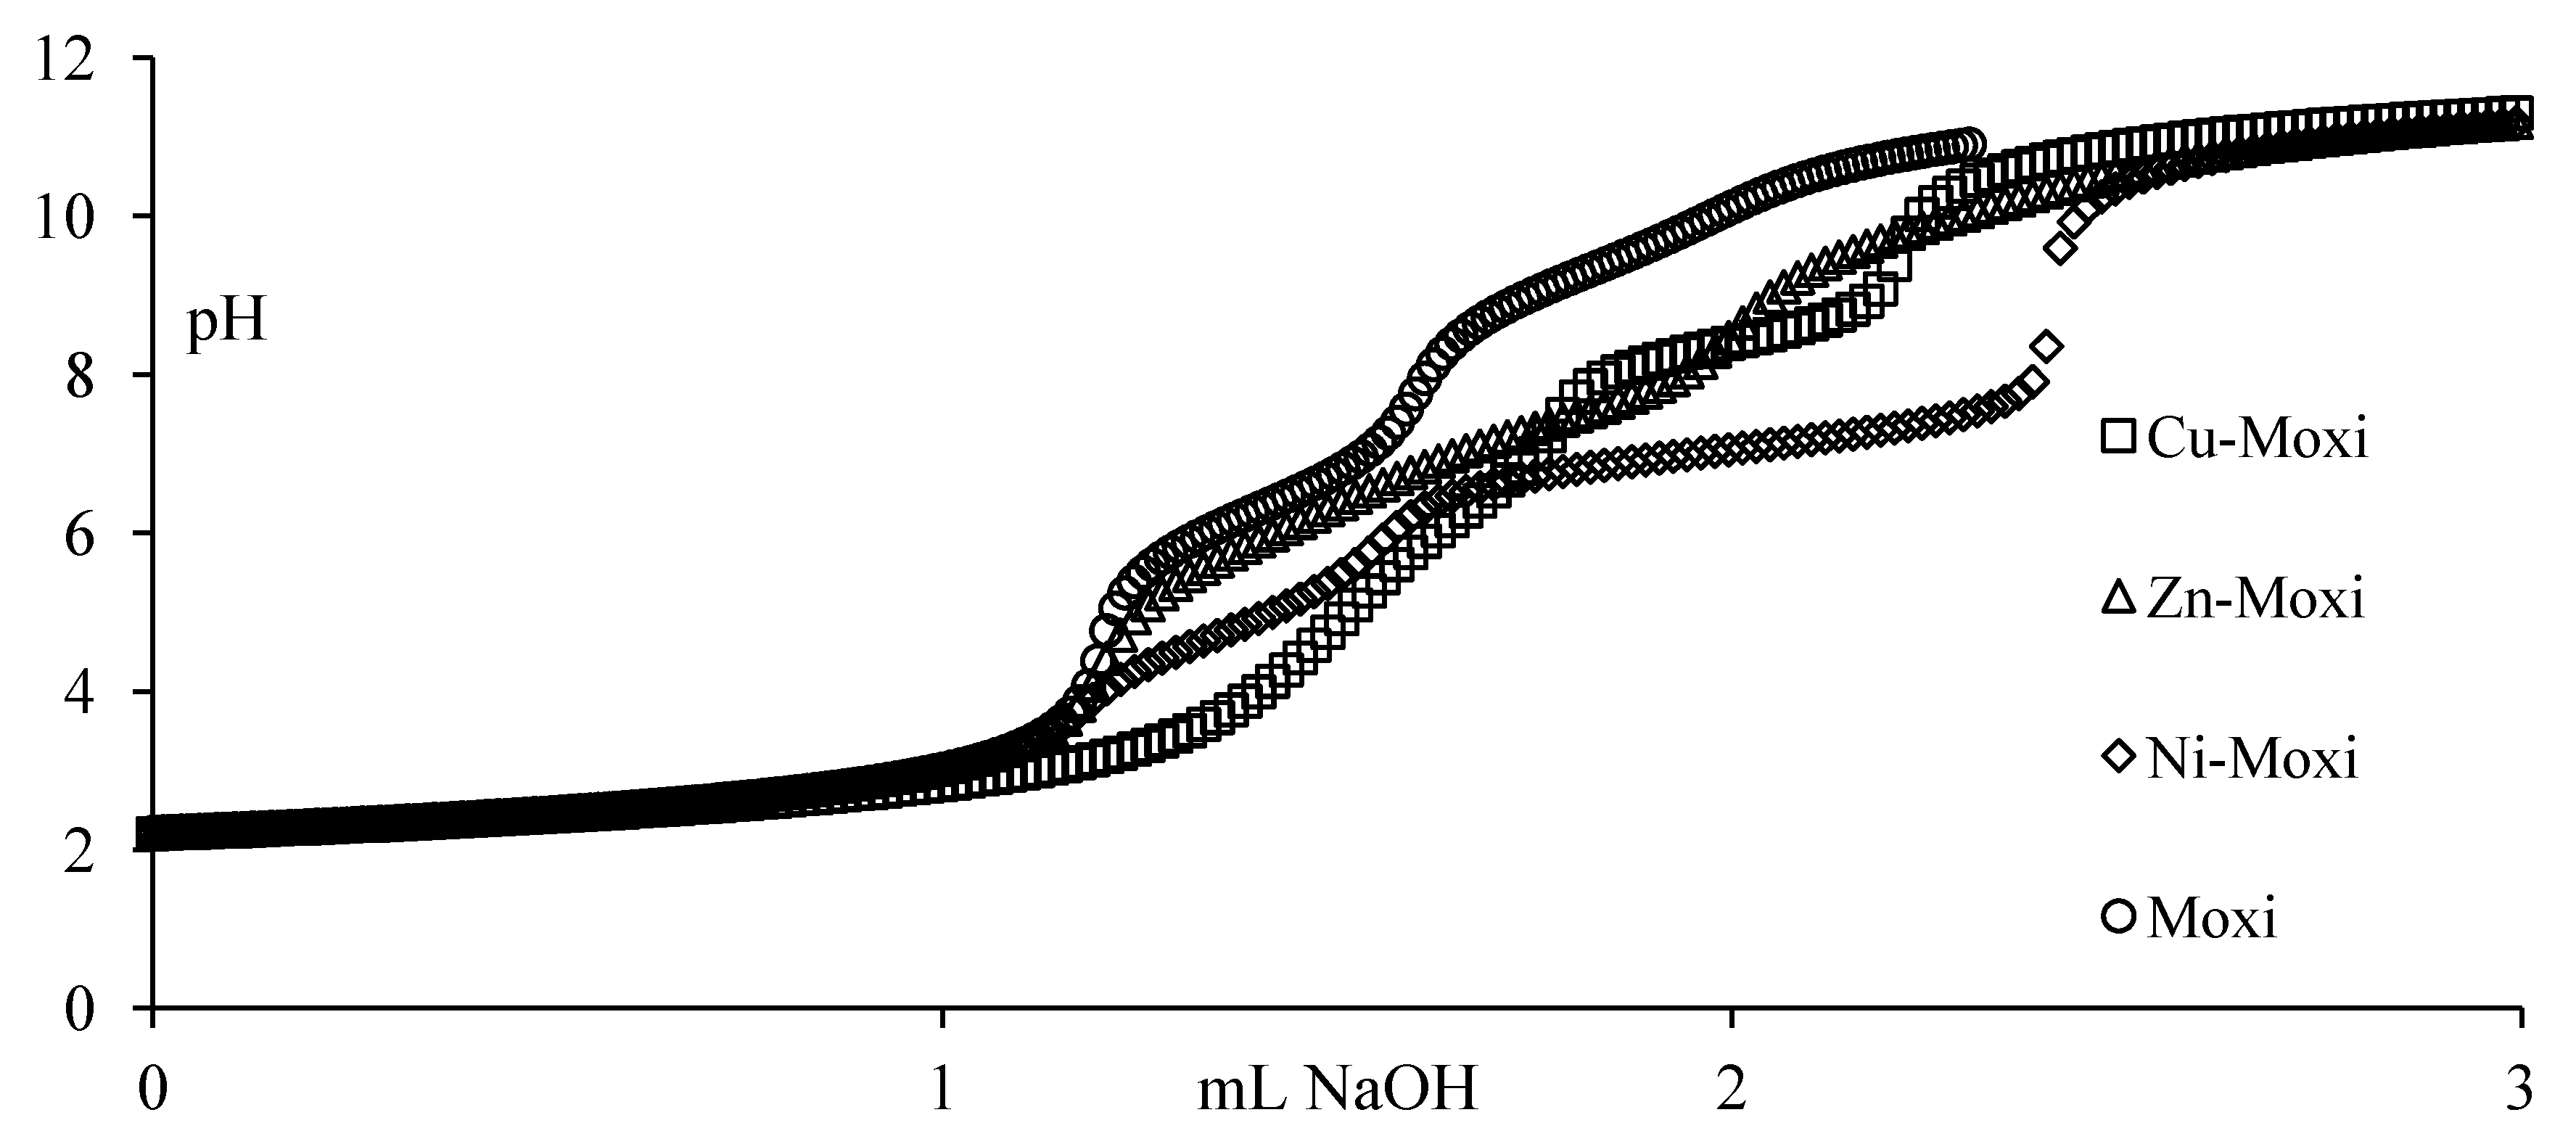


