Article

Entropy and Phase Coexistence in Clusters: Metals vs. Nonmetals

1
Department of Chemistry, University of Chicago, 929 East 57th Street, Chicago, IL 60637, USA
2
Joint Institute for High Temperatures, Izhorskaya 13/19, Moscow 127412, Russia
*
Author to whom correspondence should be addressed.
Entropy 2010, 12(5), 1303-1324; https://doi.org/10.3390/e12051303
Submission received: 10 March 2010 / Revised: 18 May 2010 / Accepted: 19 May 2010 / Published: 25 May 2010
(This article belongs to the Special Issue Configurational Entropy)

Abstract

:
Small clusters violate the Gibbs phase rule by exhibiting two or more phases in thermodynamic equilibrium over bands of temperature and pressure. The reason is the small number of particles comprising each system. We review recent results concerning the size ranges for which this behavior is observable. The principal characteristic determining the coexistence range is the transitions entropy change. We review how this happens, using simulations of 13-atom Lennard-Jones and metal clusters to compare dielectric clusters with the more complex clusters of metal atoms. The dominating difference between the narrower coexistence bands of dielectrics and the wider bands of metal clusters is the much higher configurational entropy of the liquid metal clusters.

1. Introduction

Simulations established that small clusters can exhibit bands of temperature and pressure within which two, or more than two, phases may coexist in dynamic, as well as thermodynamic, equilibrium [1,2,3,4,5,6,7,8,9,12,13]. The reason is simply that for systems comprised of small numbers of particles, the free energy difference between favored and unfavored phases, under conditions near but not at those of equal chemical potentials, can be small enough that observable amounts of the unfavored phase are present in observable quantities under equilibrium conditions. The situation is precisely analogous to the simultaneous coexistence of structural isomers. In contrast, systems made of large numbers of particles, e.g., ca. 10 20 , have vast differences in the free energies between favored and unfavored phases even if the conditions are barely away from equal chemical potentials. Hence thermodynamically unfavored phases cannot be present in observable amounts so macroscopic systems exhibit sharp phase changes, while small systems exhibit coexistence analogous to that of chemical isomers. For small systems, the actual limits of coexistence are set at the conditions at which the local free energy minimum disappears for that phase. More strictly, the unfavored form disappears under the conditions at which the local minimum of the potential energy surface of the system system cannot sustain a zero-point quantum state for that form.
Experiments have demonstrated the coexistence of solid and liquid phases over finite bands of temperature, e.g., [14,16] and of liquid and vapor phases [15]. (In these experiments, being done in beams, the pressure is ill-defined and may be considered nearly zero.) Moreover the role of the energy and entropy changes in the transition have also been subject to study from various points of view [17,18,19]. Most of the examinations of entropy and energy behavior with phase changes of clusters have dealt with issues such as the temperature dependence of the melting region and the occurrence of especially stable solid structures, the “magic numbers” which result from shell-closings, either of geometric or electronic structure [20]. However one aspect of the phase changes of clusters that has not been investigated extensively is the question of the observability of coexisting phases, and specifically of the conditions under which such coexistence can actually be seen in experiments. That such ranges exist was demonstrated both in early simulations and in the experiments cited above. However, apart from one early discussion based on a continuum-capillarity model [21], the conditions and constraints that allow the coexistence ranges to be wide enough to be detectable had not been identified until very recently [22,23].
The essential conclusion of the study so far of observability of coexisting phases over ranges of temperature and pressure is derived from a heuristic criterion, that the minority phase must be at least ten percent of the total composition. From this, one can derive the relation that the ratio of the temperature range δ T to the melting temperature T m within which that condition is met is
δ T / T m 5 / Δ S m
(The numerical value of the constant is determined by the choice of the heuristic criterion limiting the coexistence range.) That relation was initially based on the assumption that the cluster could be described by a single potential surface, a model valid for dielectric species whose electronic excitation energies are large compared with the energy required to melt the cluster. That is not a valid assumption for many metal clusters, for which there are low-lying electronic excitations. Many clusters of metal atoms, moreover, exhibit metal-insulator transitions as functions of cluster size, so one can even suspect that there might be very sharp changes in the phase coexistence and melting behavior with size of cluster, for systems that exhibit such behavior. The goal of this work is to compare, at least in a limited way, the behavior of clusters of dielectric and metal atoms, with respect to their melting and freezing behavior, and specifically with regard to their observable coexistence regions, both of size and of temperature range. The previous results just cited already indicated why it seems that the coexistence range of Lennard-Jones or rare gas cluster sizes goes up only to about 100 atoms, while metal clusters apparently can show coexistence at considerably larger sizes. And, of course, metal clusters melt at much higher temperatures than do rare gas clusters.
To carry out our analysis and comparison of the two kinds of systems, we define an aggregate state of a cluster as the set of configurational states, the states associated with local minima on the multidimensional internal energy surface or surfaces, that lie within a relatively narrow energy band [2]. The aggregate state may be a single isomer, a set of solid isomeric states, a liquid or some other form in which multiple minima are dynamically accessible to the system. For a typical excited state occupied at moderately high temperature, the ratio g of its statistical weight to that of the ground state is much greater than 1, while at low temperatures or energies, g is likely to be much closer to 1.
We carry out our analysis using 13-atom clusters as the vehicle for the study, both dielectric and metal. Virtually all such clusters have as their lowest-energy structure an icosahedron, twelve atoms at the vertices, surrounding a central atom. The archetype for dielectric clusters is the system in which the atoms interact pairwise, through the well-known Lennard-Jones potential, a 6th-power attraction and a 12th-power repulsion [24,25]. Such clusters have long been known to have a number of locally stable structures [26,27,28]. It is convenient to think of these as local minima on an energy surface with all the 3 · 13 - 6 or 33 independent structural coordinates as the independent variables and the electronic energy of each configuration as the dependent variable. This is, of course, just the Born-Oppenheimer approximation, separating electronic and nuclear energies. The minima and saddles can be found by a number of algorithms, of which the first systematic one was the quenching procedure introduced by Stillinger and Weber [29,30,31]. Other, even more efficient methods now enable one to locate stationary points on such multidimensional surfaces [32,33,34]. A second separation also proves very useful, that between local vibrational equilibration and the slower configurational equilibration. The validity of this second kind of separation has been well-established, e.g., [35], and provides a basis for describing the evolving motion of a system in terms of the kinetics of well-to-well passages in time, for example in terms of a master equation [34,36,37]. The physical justification for this is simply that the time spent by the cluster in the vicinity of almost every local minimum is significantly longer than the time required for the vibrations to equilibrate and define an effective temperature in the vicinity of each local minimum.

2. Dielectric Cluster Behavior

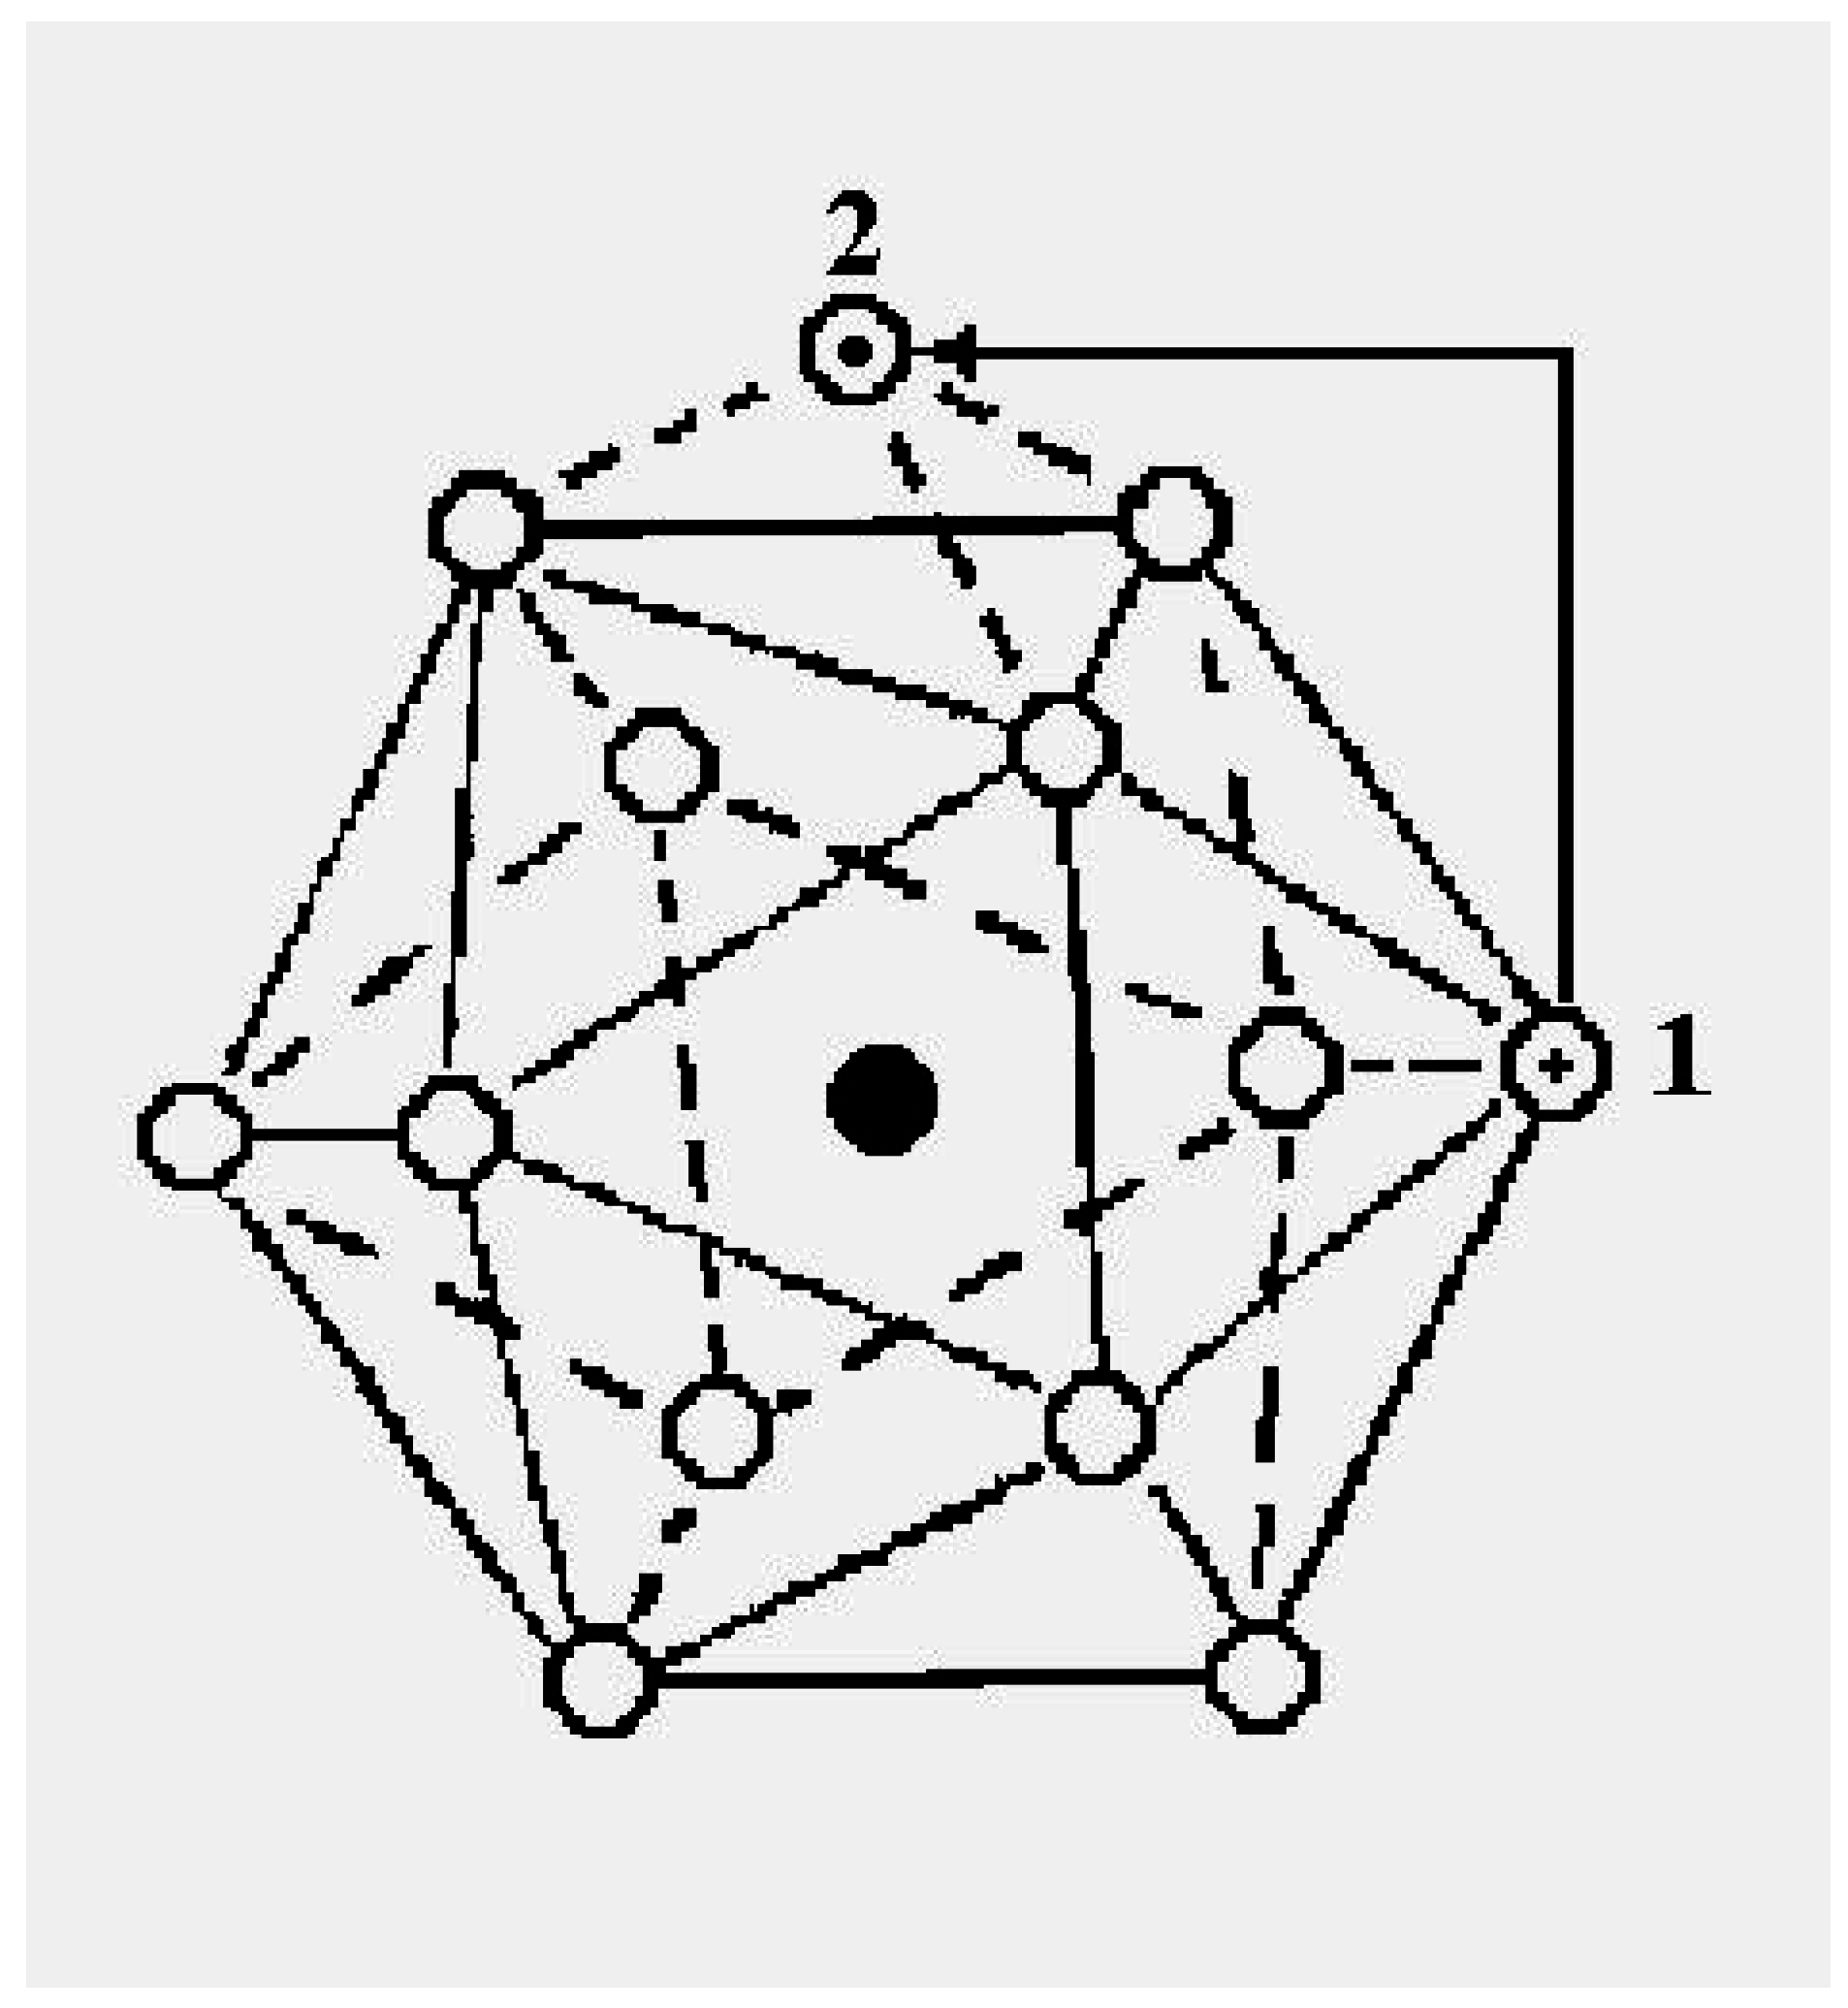
The 13-atom cluster with atoms bound by Lennard-Jones interactions provides a particularly simple model for studying properties of dielectric clusters. Its elementary configurational excitations, from the closed-shell icosahedral global energy minimum, begin with the simple promotion of one particle from the icosahedral shell to the surface. The promoted particle is relatively free to move about on the surface, and presumably the vacancy it leaves also has significant but lower mobility. One can estimate the barrier between stable configurations simply by counting the number of nearest-neighbor contacts in the initial, final and transition state. Thus, when a particle promoted to the surface moves from one face of the icosahedron to another, it moves from a site with three contacts to another with three contacts, through a transition state with only two contacts. Hence the height of the energy barrier for the passage is essentially equal to the energy of a single contact, i.e., the dissociation energy of one pair of these atoms. Figure 1 illustrates the promotion process.
Figure 1. Configurational excitation of a cluster of 13 atoms bound by short-range pair interactions.
Entropy 12 01303 g001
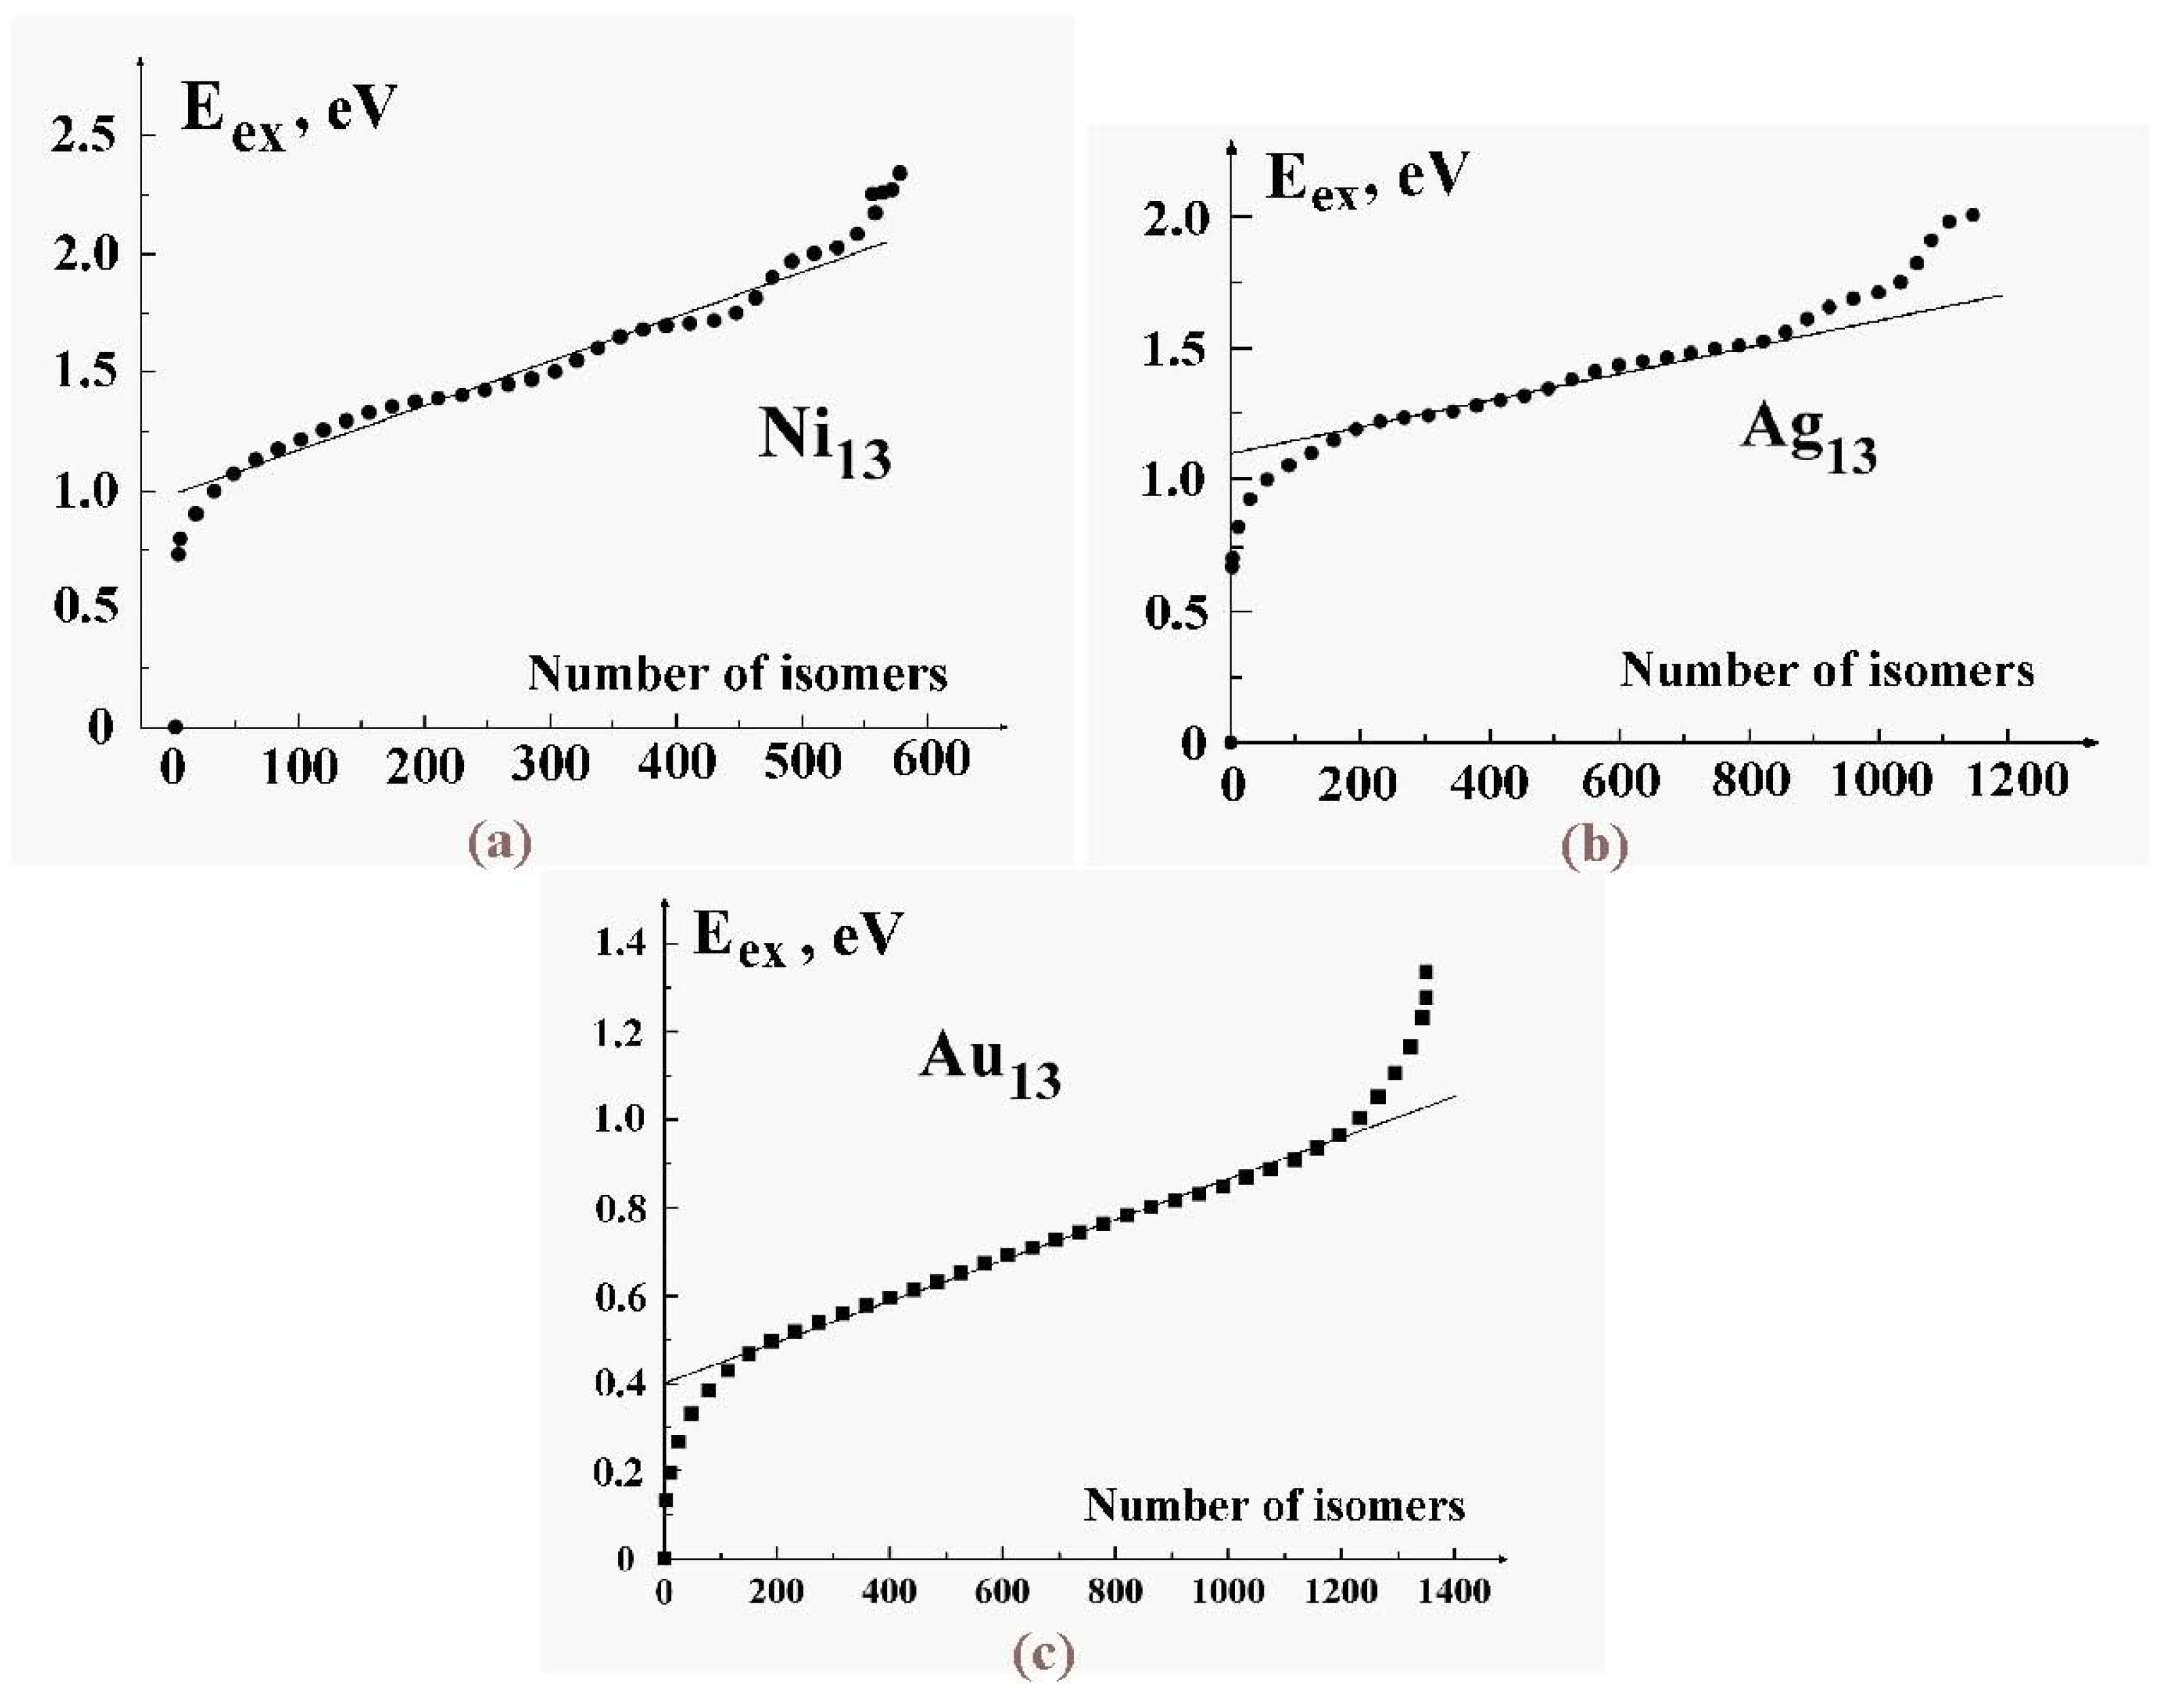
There are of course many other locally stable structures of a cluster of 13 atoms. The current estimate is 1,509 geometrically distinct structures, each of which has roughly 13! permutational forms [34]. (The number is of course actually less than 13! because of symmetries of many of the structures, which allows some permutations to be achieved by rigid-body rotations.) Figure 2 shows a few of the stable structures and their energies for this 13-particle system [38].
Figure 2. Structures of the lowest configurationally stable states for the 13-particle Lennard-Jones cluster at zero temperature [38].
Entropy 12 01303 g002
At energies at which only one or perhaps two particles are promoted to the cluster’s surface, the dominant motion is of course that of the promoted particles around the surface. This has lower barriers for passage than exchange or motion within the icosahedral shell. In that sense, the promoted structure of Figure 1 can be considered liquid-like, at least in a restricted way. Several structures, including some shown in Figure 2, are accessible at relatively low energies and temperatures. 
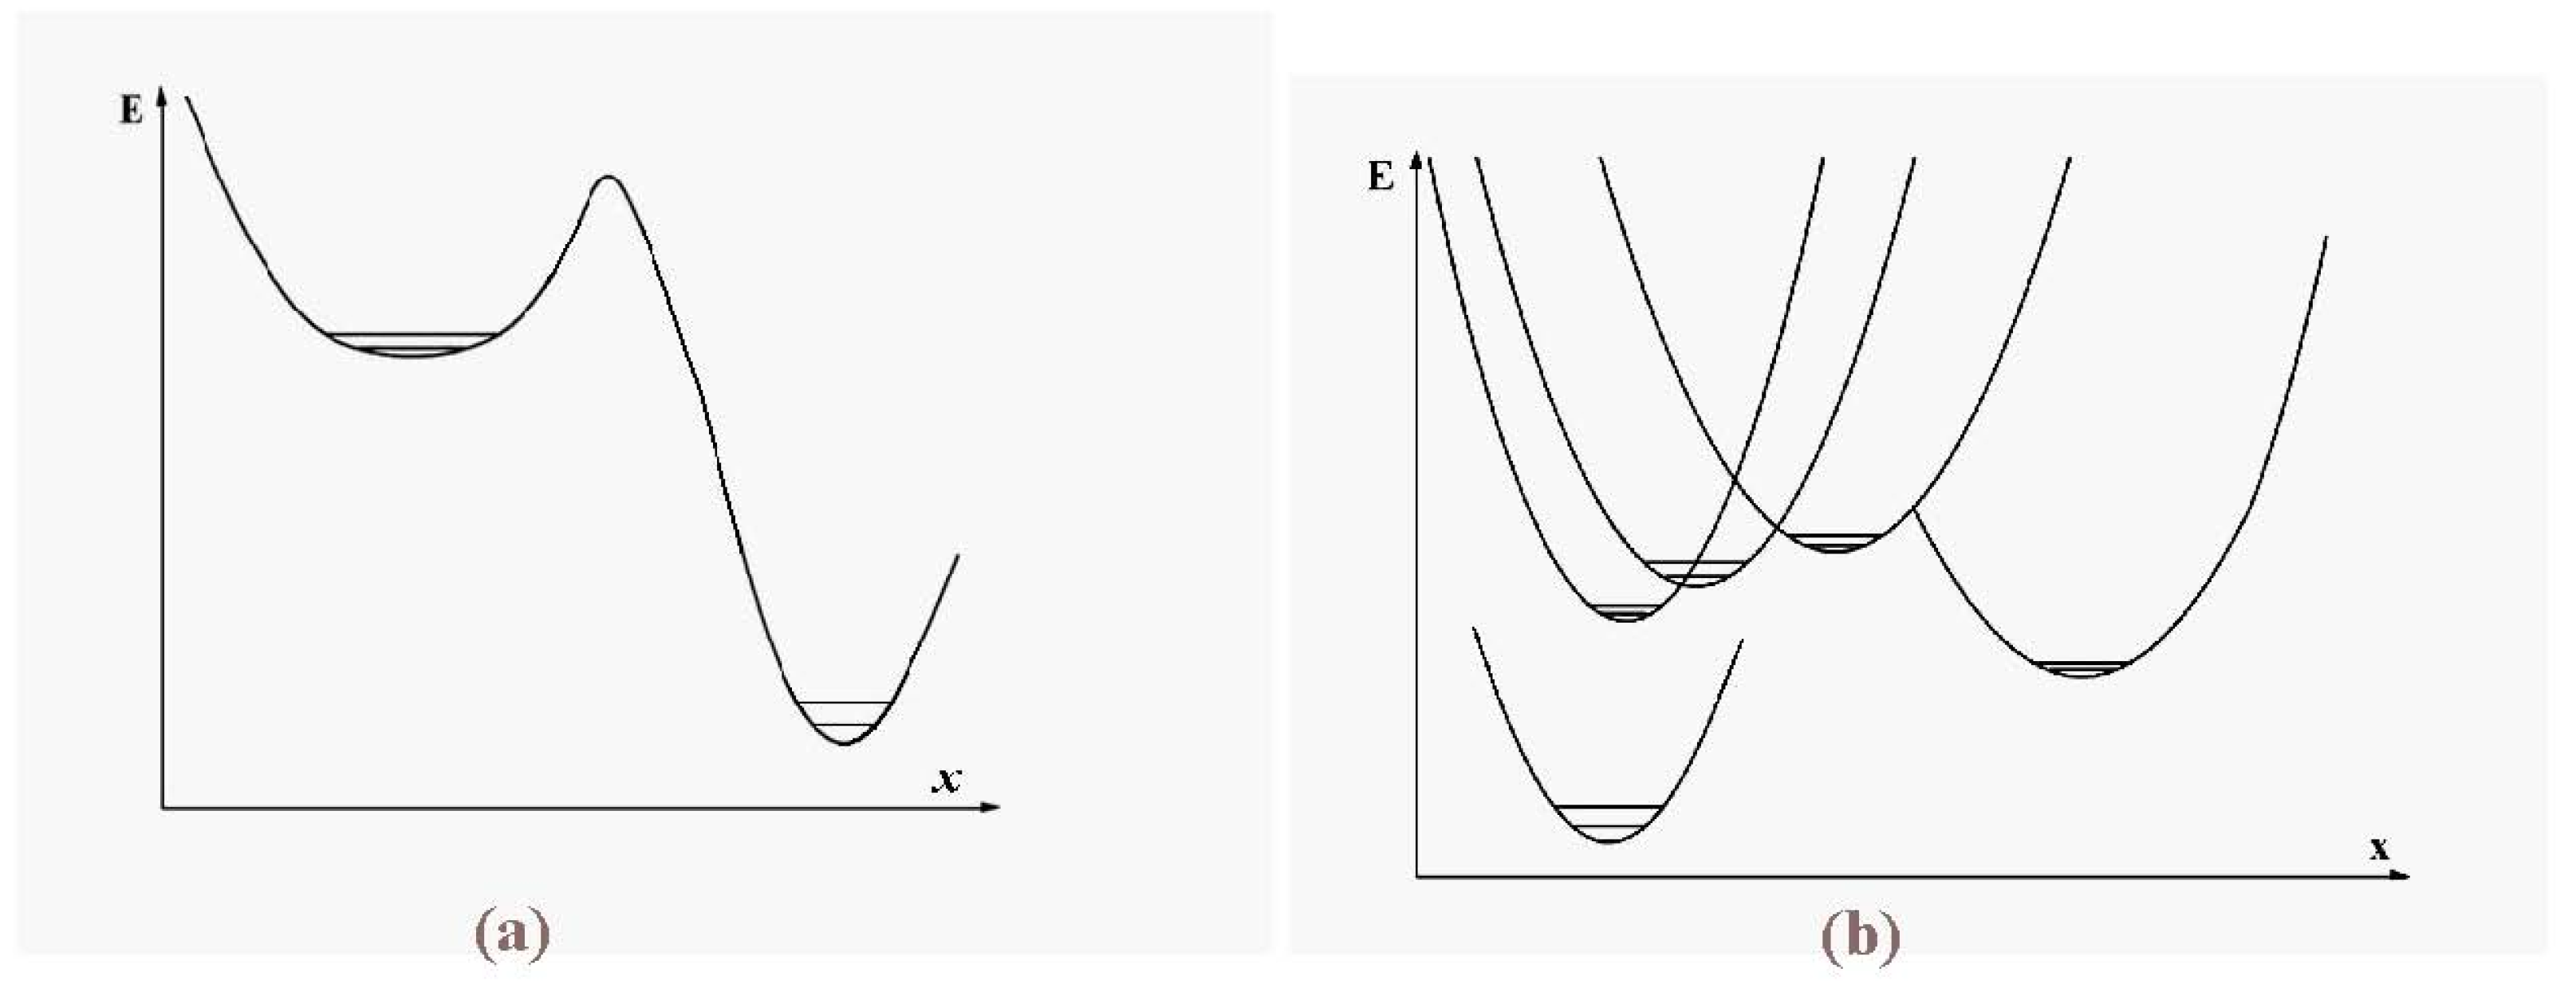
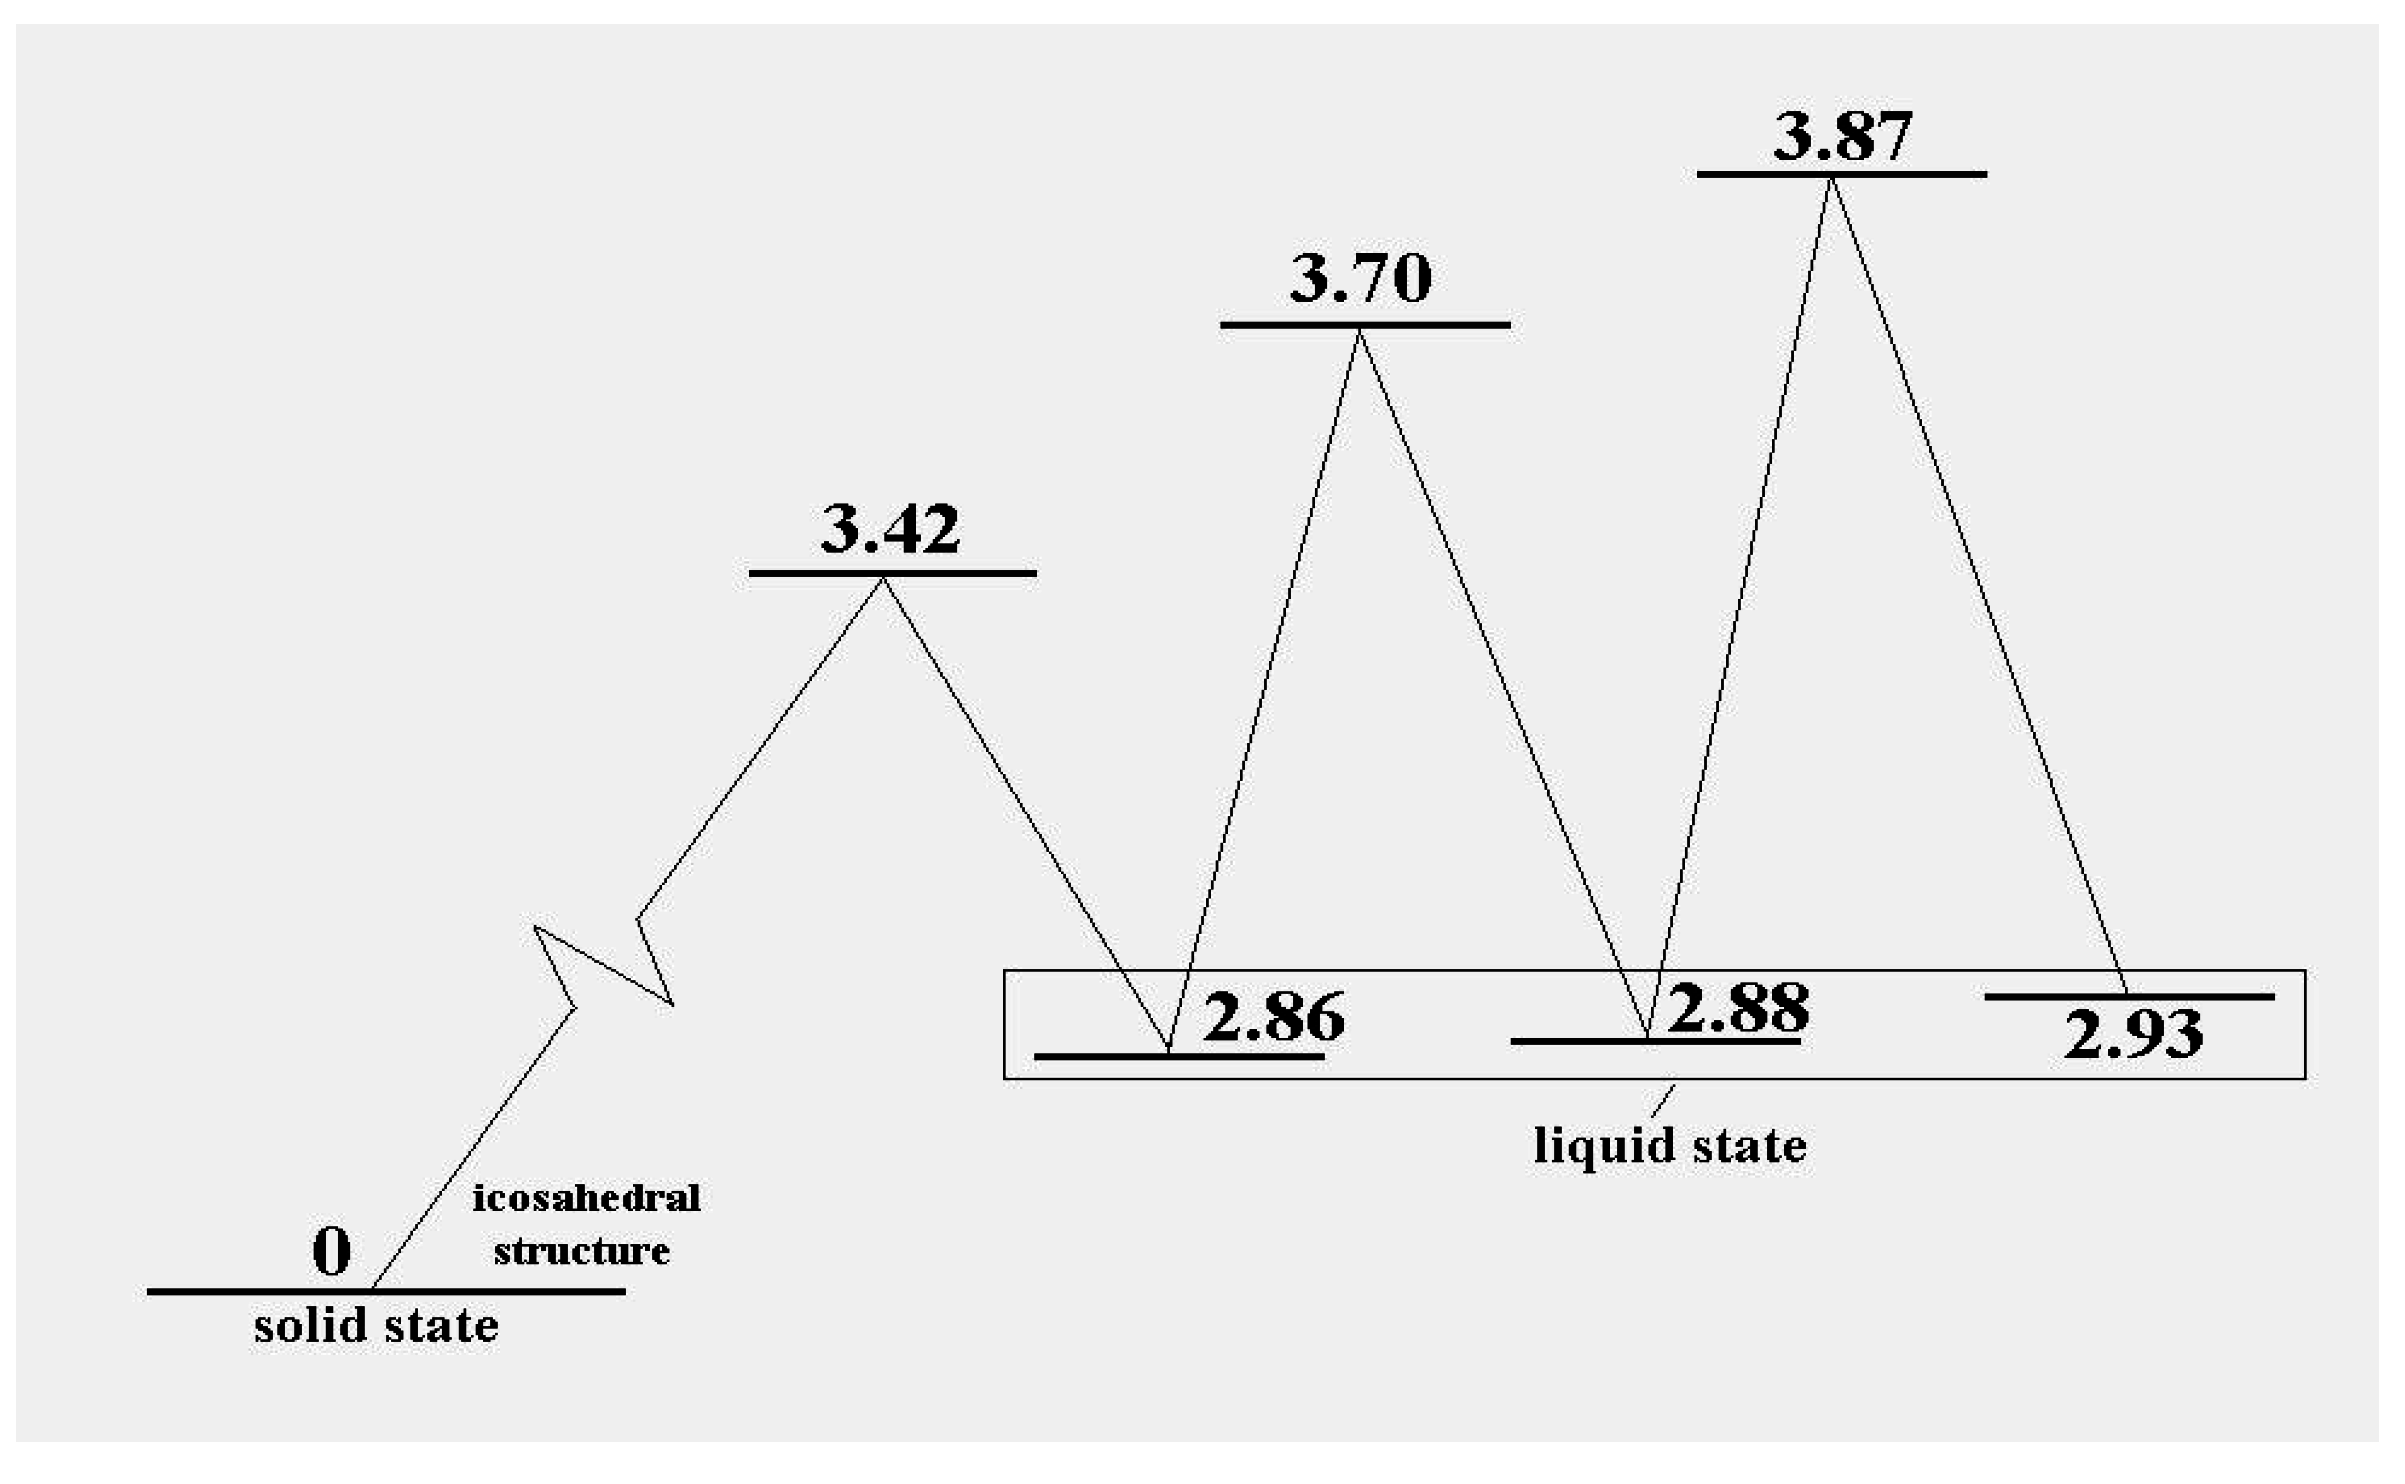
Figure 3 shows the energy pattern linking some of these with the icosahedral global minimum.
Figure 3. The excitation energies and barrier energies for the lowest configuration excitations of the 13-atom Lennard-Jones cluster, according to [38].
Entropy 12 01303 g003
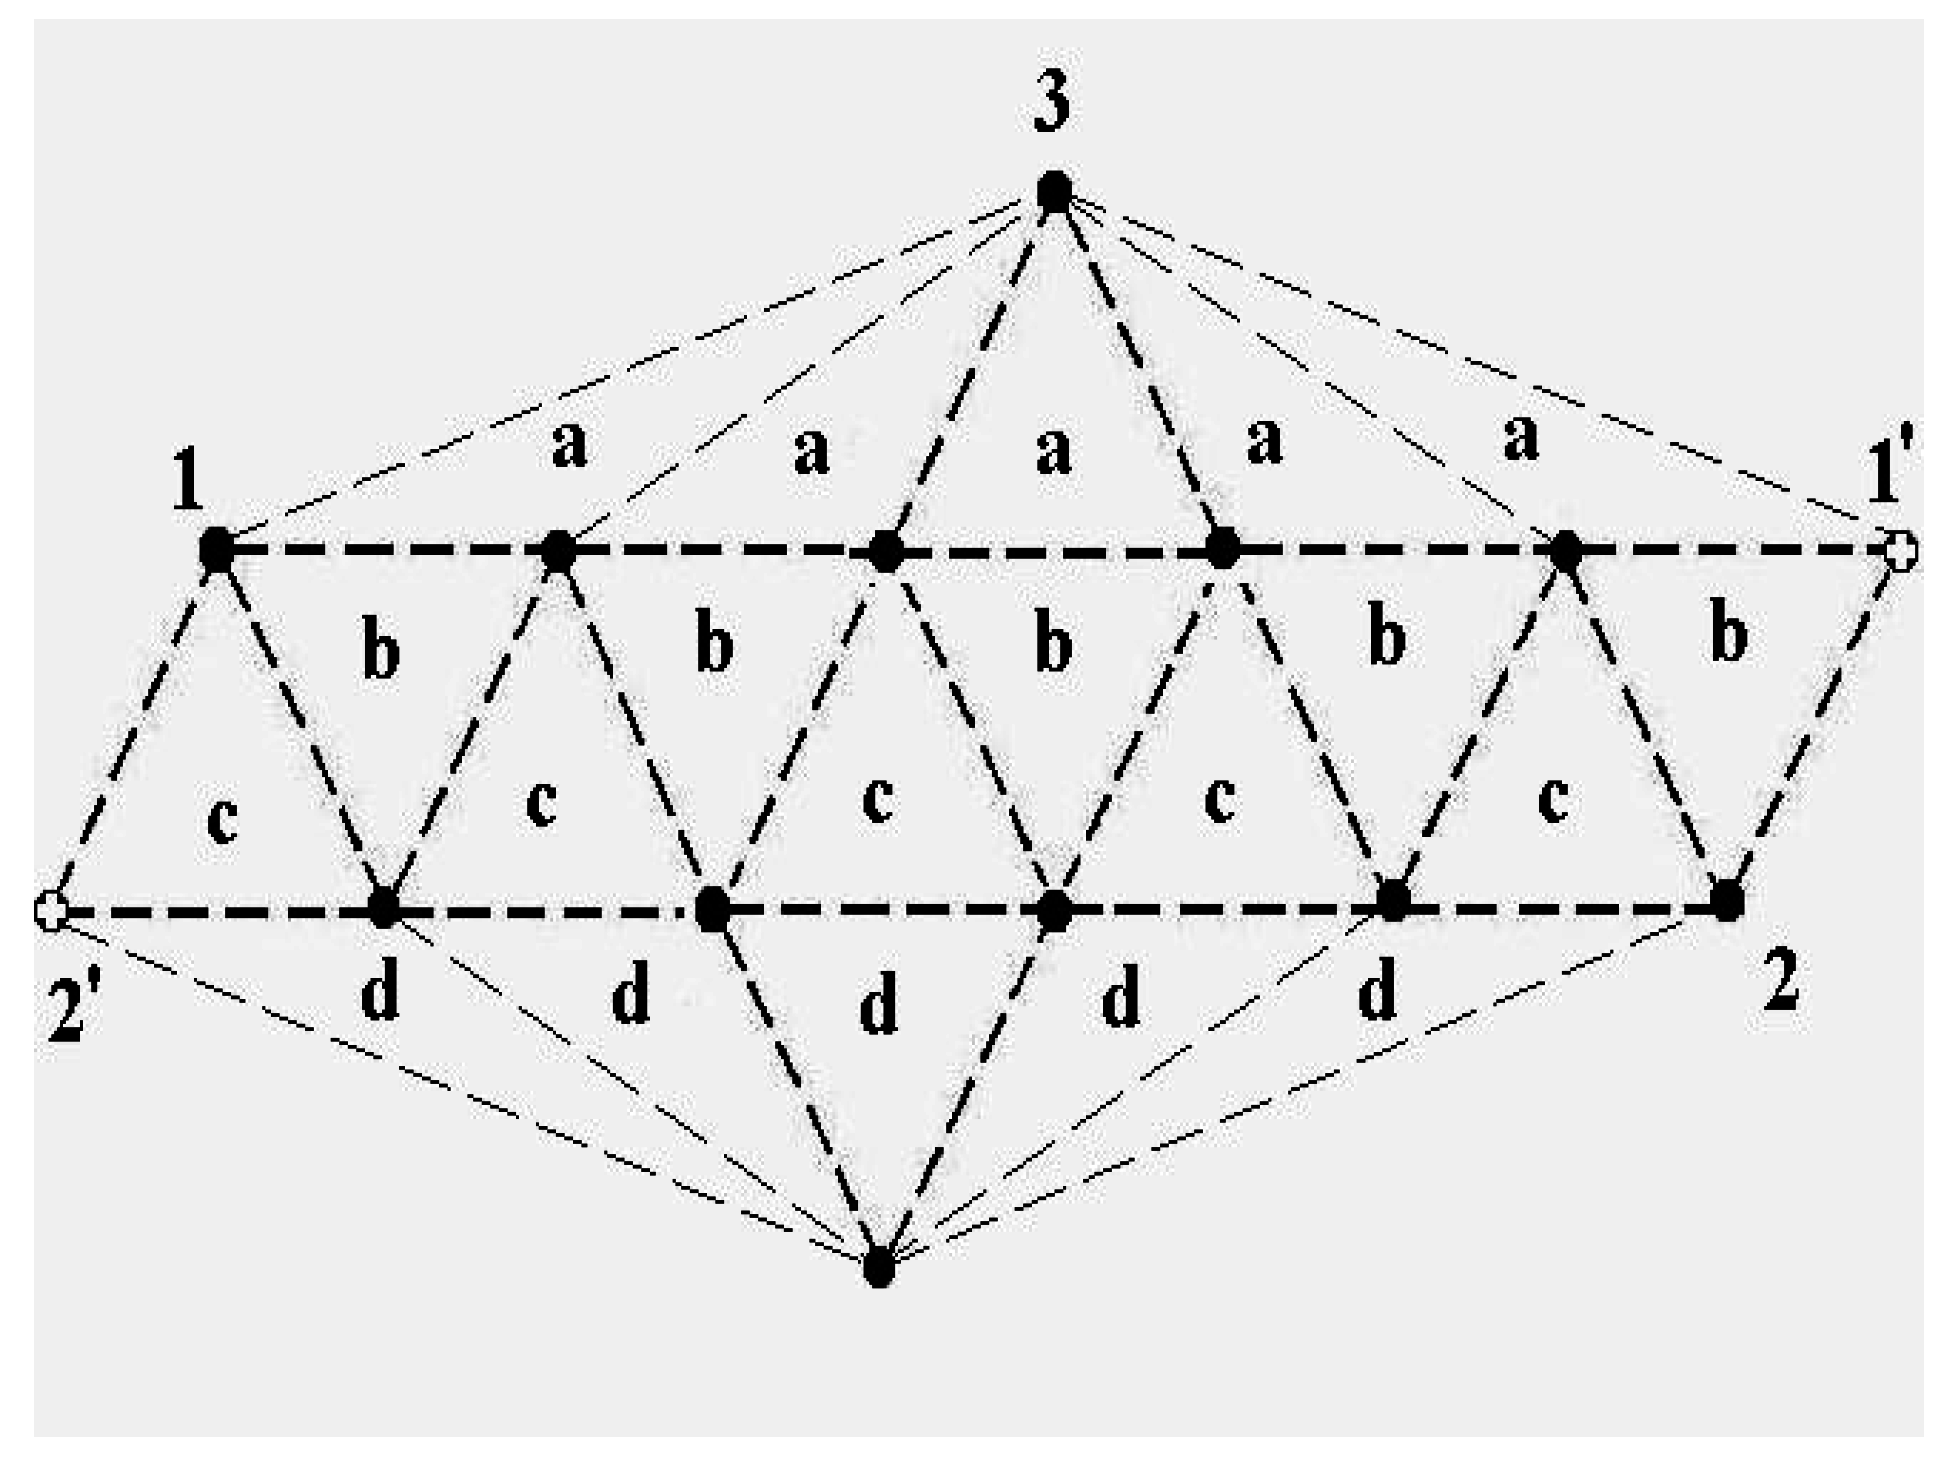
The schematic representation of Figure 4 illustrates the relations among the single-particle excitations of the 13-atom cluster. We suppose that atom 3 moves to the cluster surface; there are then four kinds of transitions corresponding to the different triangular faces on which atom 3 may rest. The excitation energy to positions “a” is 4 D (in terms of the pair dissociation energy D) and to positions “b”, “c” and “d”, just 3 D , at the level of this schema. As we see in Figure 3, the precise energies of positions “b”, “c” and “d” are 2.86D, 2.88D and 2.93D.
To get a simple picture of the solid-liquid phase transition in the 13-atom dielectric cluster, we first use the separation of configurational and vibrational degrees of freedom [39]. However we can assume here (but not generally) that the vibrations are harmonic for both solid and liquid (but of course with different frequencies). Taking the excitation energy in accordance with Figure 3 to be Δ E 2 . 9 D and the transition entropy Δ S to be equal to that at zero temperature, Δ S = ln 180 ( g = 15 · 12 = 180 is the statistical weight for configurational excited states of Figure 1b), we obtain a value for the hypothetical cluster melting point T m of a harmonic model,
T m = Δ E Δ S = 0 . 56 D
This differs from the more realistic value T m = ( 0 . 30 ± 0 . 01 ) D found in a variety of simulations. This difference reveals the role of anharmonicity in the phase transitions of clusters.
Let us now introduce the average anharmonicity parameter as
η = K E e
where K is the average total kinetic energy of cluster atoms, and E e is the total excitation energy of cluster atoms from the state at zero temperature. So defined, η falls below 0.5 if the vibrations are softer than harmonic as most stretching modes are, and is greater than 0.5 if they are stiffer, as often occurs in bending modes. It is useful to think of a cluster as a member of a microcanonical ensemble if it does not exchange energy with an environment, i.e., it is under adiabatic conditions, and as a member of a canonical ensemble under isothermal conditions, e.g., if this cluster is in a thermostat. In this analysis we assume that the time for energy exchange and equilibration among neighboring atoms is brief compared with the time that a cluster resides in each aggregate state. This allows us to introduce the concept of vibrational temperatures of the cluster atoms that are different for the solid and liquid states when the cluster is in a microcanonical ensemble but of course is the thermostat temperature when the cluster is in a canonical ensemble.
Figure 4. A schematic representation of the single-particle excitations of a 13-atom cluster with short-range interparticle forces. When this schema is converted into an energy space surface structure, positions 1 and 1’ and also the positions 2 and 2’ are joined, and the cluster surface consists of 20 equilateral triangles.
Entropy 12 01303 g004
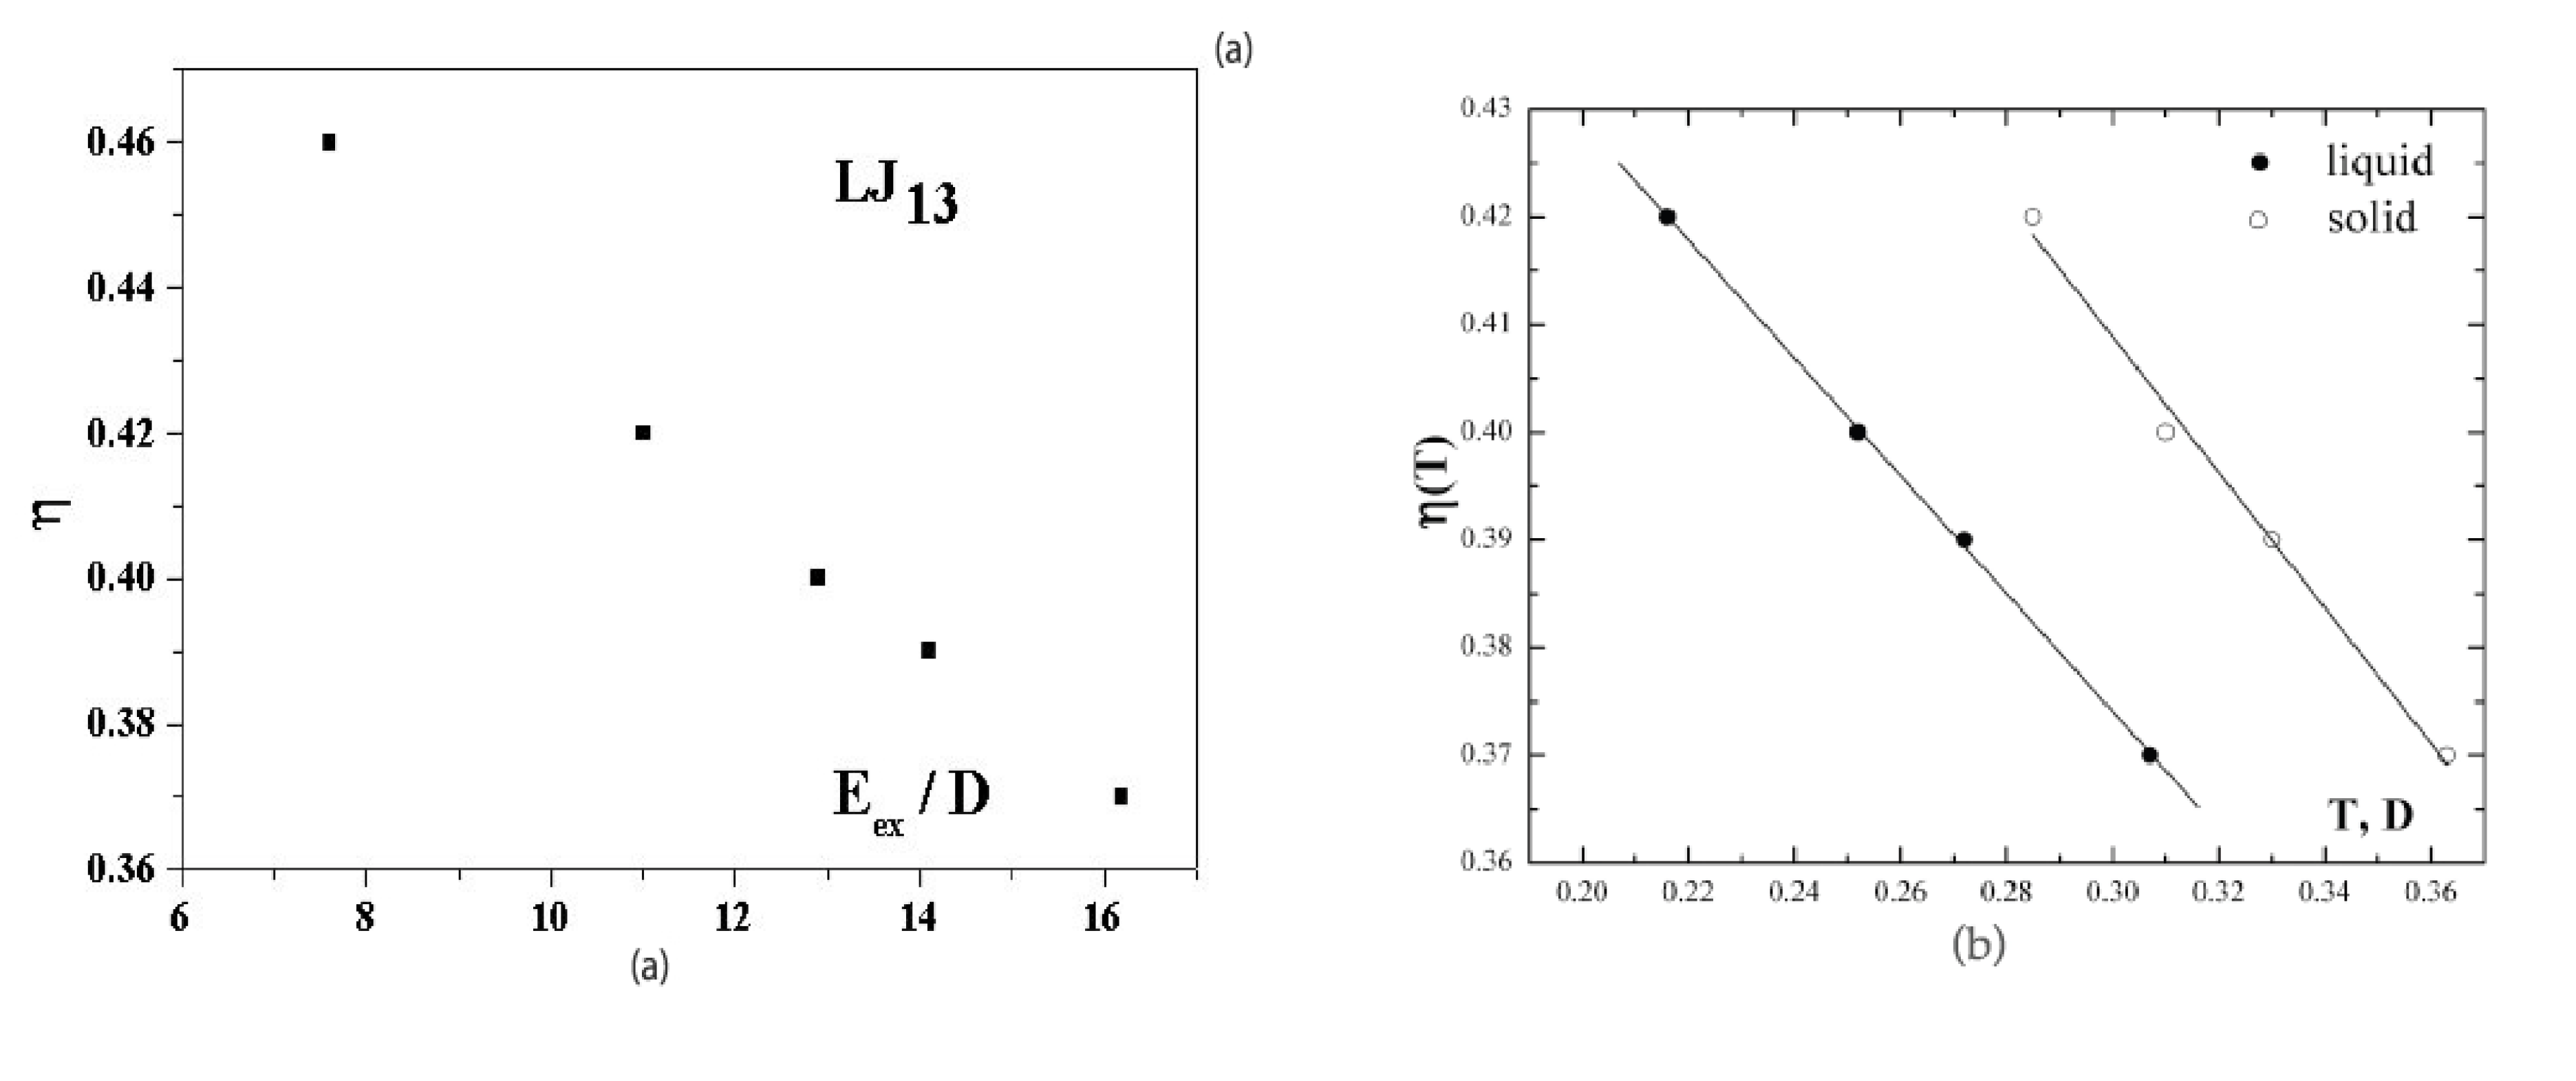
Figure 5a shows the dependence of the anharmonic parameter (3) of the 13-atom Lennard-Jones cluster on the excitation energy η ( E e x ) when cluster is under microcanonical conditions. This dependence is given for a range of effective temperatures in which the solid and liquid phases coexist. At E e x = 13 . 8 D the probabilities for the cluster to be in the solid and liquid states are equal. The dependence of Figure 5a was obtained [40,41] on the basis of computer simulation [6] for an isolated 13-atom Lennard-Jones cluster. The higher temperature of the solid form, due to its lower average potential energy, is compensated in this case by its smaller anharmonic parameter, so that η s o l ( E e x ) = η l i q ( E e x ) within the accuracy limits. Figure 5b also shows the anharmonic parameters (3) as temperature functions separately for the solid and liquid cluster states [22]. These are also derived from the data of computer simulations [6,7] for the Lennard-Jones cluster under microcanonical and canonical conditions. It follows from Figure 5 that atomic motion in the cluster is close to harmonic with η = 0 . 5 for an unexcited cluster, i.e., η ( E e x = 0 ) = 0 . 5 , but the role of anharmonicity of atomic motion in the cluster becomes very significant when the system is excited. Figure 5b exhibits the stronger deviation from harmonic motion for the liquid aggregate state.
Figure 5. (a) The dependence on the excitation energy of the anharmonic parameter (3)for an isolated Lennard-Jones cluster of 13 atoms [40,41] obtained from computer simulation [6]; (b), the temperature dependence of the anharmonic parameter (3) for the solid and liquid states [2,43] obtained on the basis of the results of computer simulation [6].
Entropy 12 01303 g005
One of the best parameters for determining the cluster’s melting point T m from computer simulations by the method of molecular dynamics is the root mean square of the interparticle distance fluctuation that is introduced as
δ = 2 n ( n - 1 ) i < j r i j 2 - r i j 2 r i j 2 2
where r i j is a distance between atoms i and j. So defined, the parameter δ takes into account the correlations in atomic positions [6,9,42]. It is a variant on the parameter of the “Lindemann criterion” [44]. This original formulation used the displacement of each particle from its equilibrium position as the key quantity. Later, two groups used the interparticle distances rather than displacements from equilibrium [4,5,9]. There is, it turns out, some advantage to the latter [45]. For the solid state, in which atoms are fixed in lattice sites, the value of this parameter is typically smaller than 0 . 1 , considerably smaller than that for the liquid state with its mobile atoms. This parameter corresponds to a time scale in which atomic transitions between sites for the solid cluster state are improbable, while these transitions for the liquid cluster state are effective. 
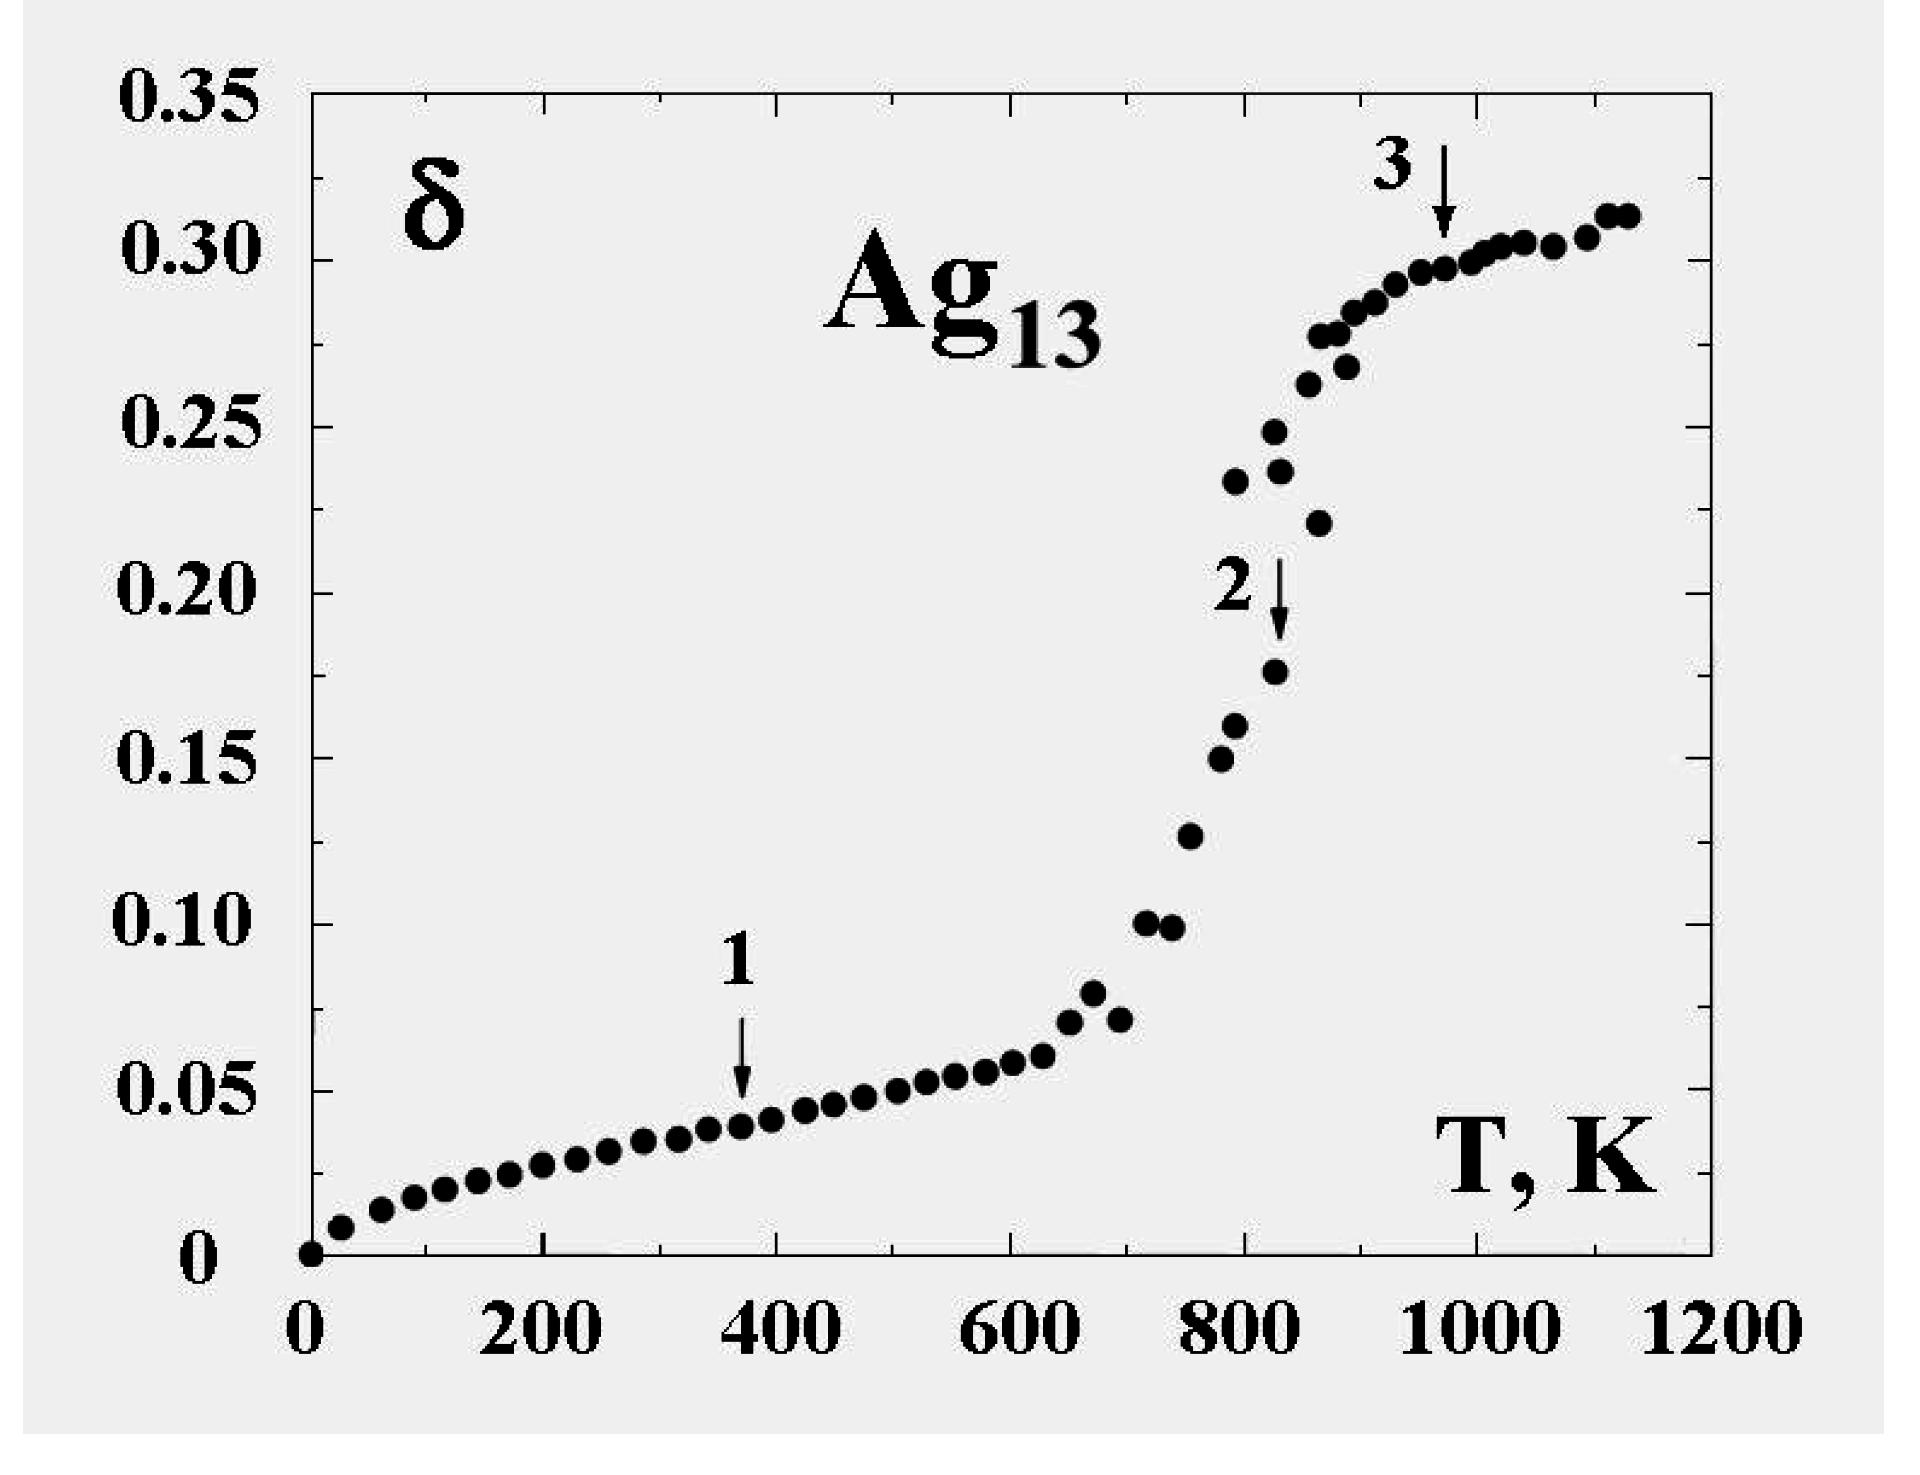
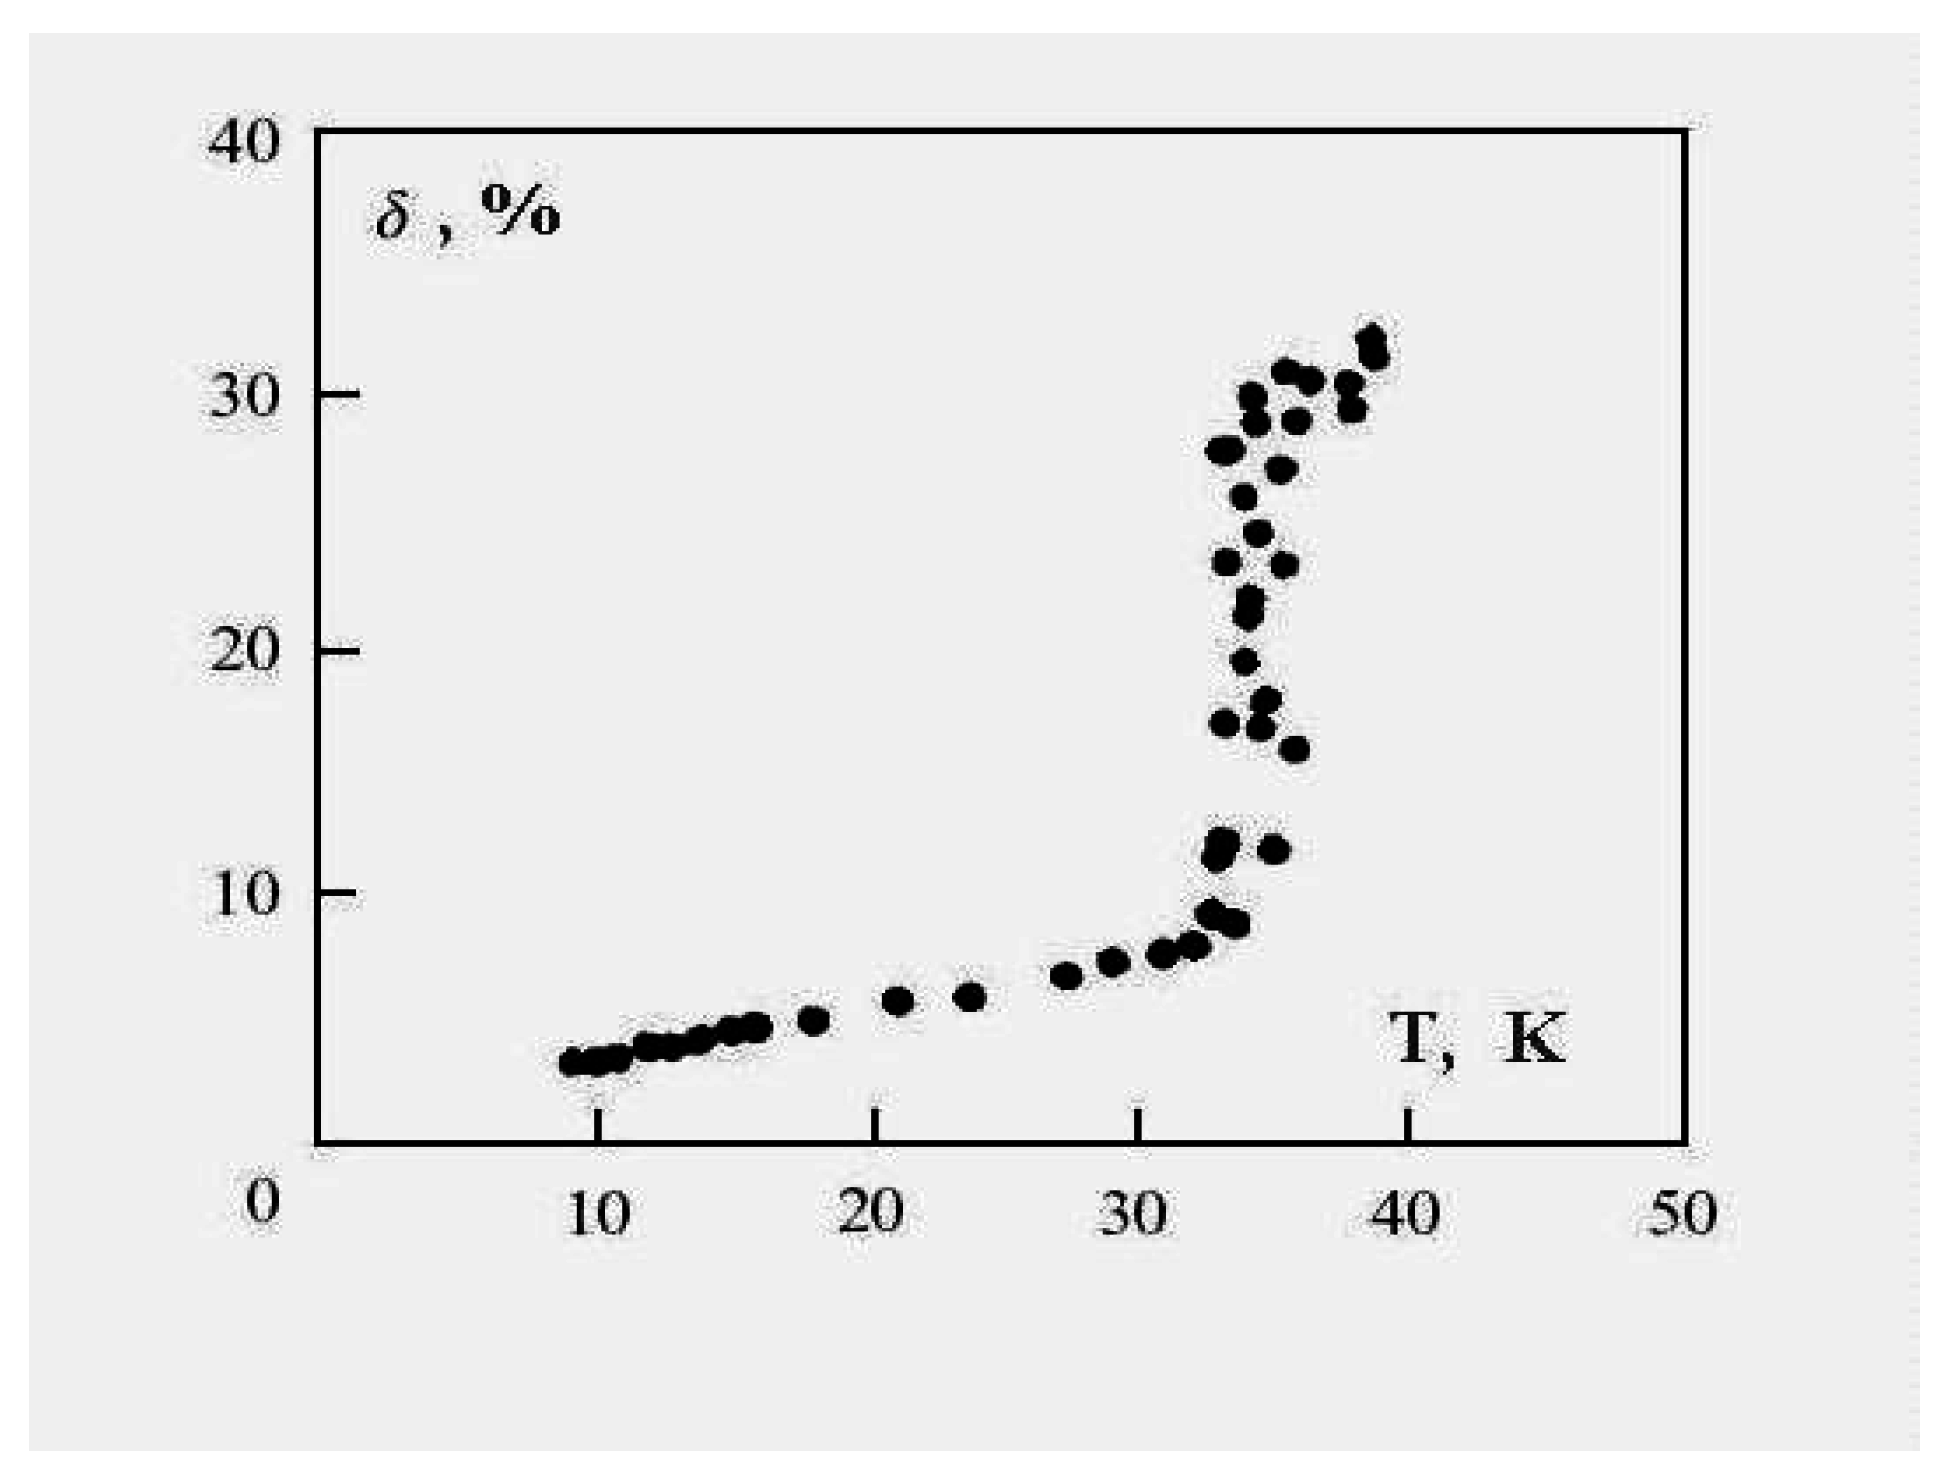
Figure 6 demonstrates this for the 13-atom Lennard-Jones cluster with the argon pair interaction parameters. One can see that the parameter δ has a jump in the vicinity of the cluster melting point, and the point of inflection of this jump may be used as the definition of the melting point. But because the “jump” clearly takes place over a finite temperature interval, the meaning of the cluster’s melting point becomes one of one’s choice of definition, e.g., the point of inflection of this curve, or the point of equal chemical potentials of the two phase-like forms. Often, the term “melting point” of a cluster is taken to be the condition at which the free energies of the two phases are equal.
Figure 6. The square of the length of fluctuations of the bond length defined by formula (4) averaged over a long period for the 13-atom Lennard-Jones “argon" cluster [6].
Entropy 12 01303 g006
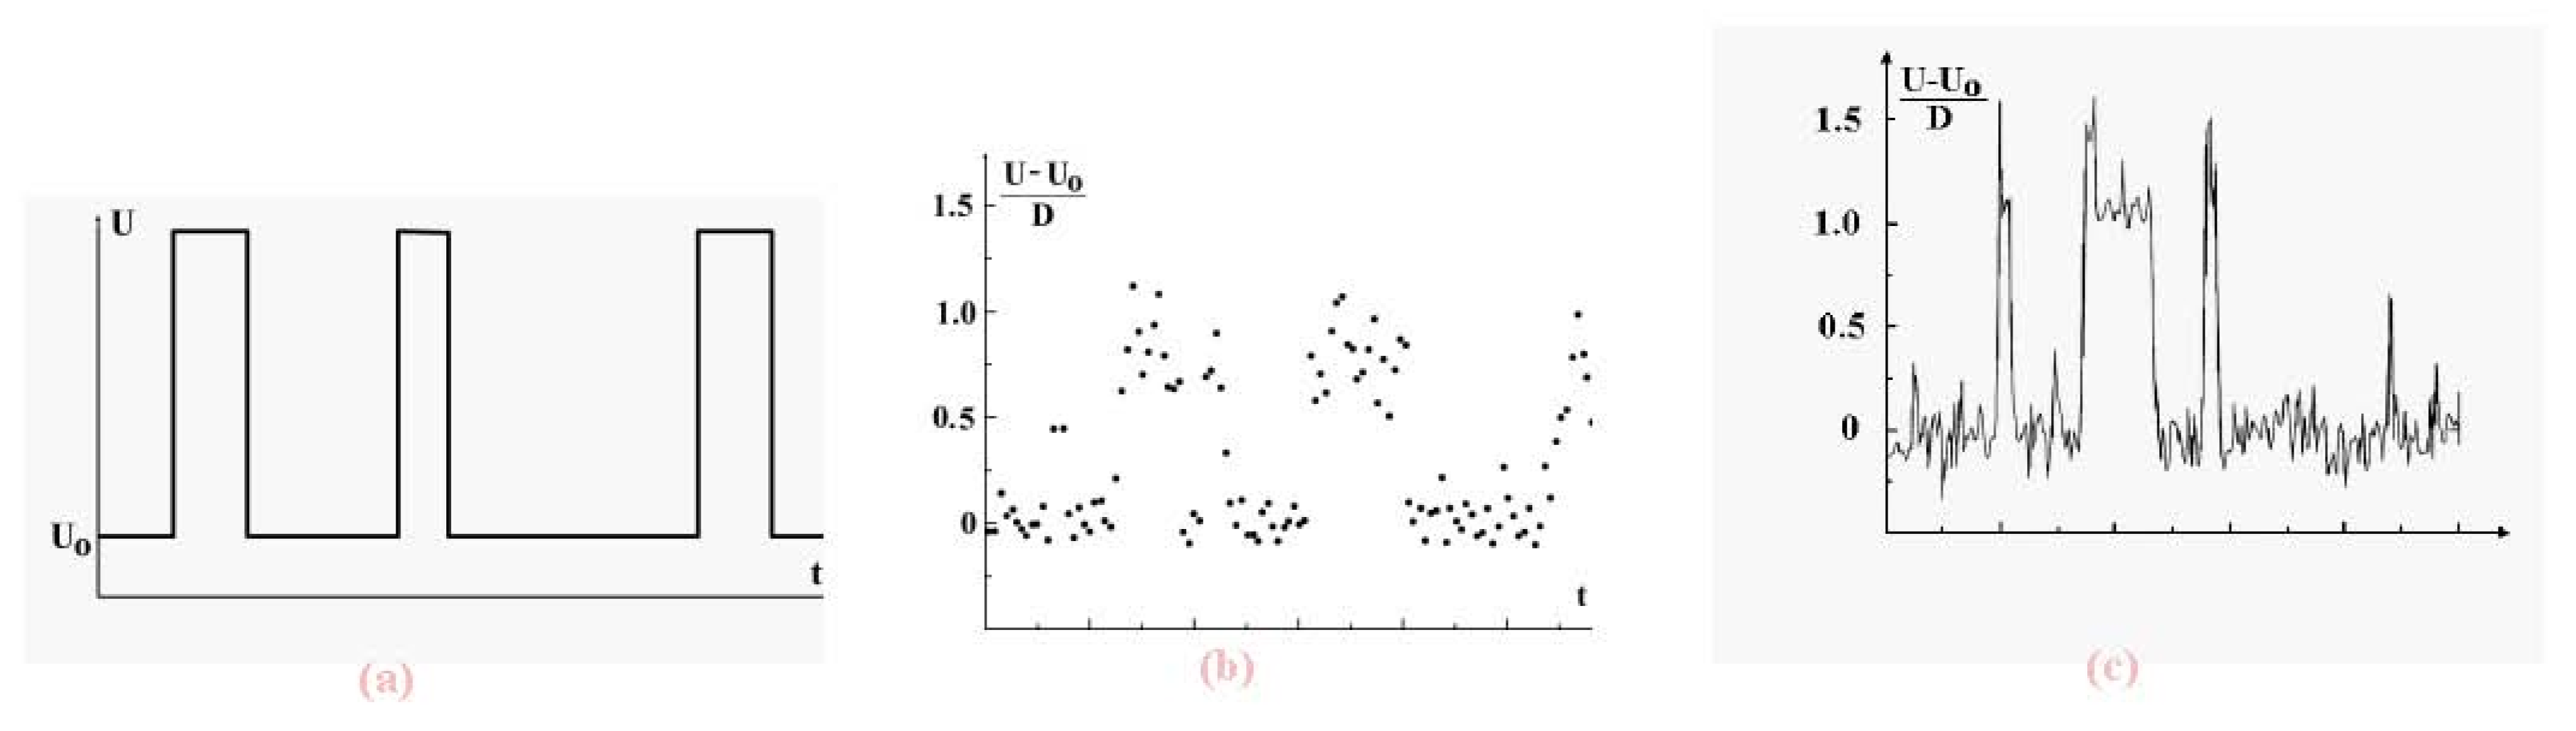
We now examine the dynamic coexistence of phases in the Lennard-Jones cluster when, part of the time, a cluster is found in the solid aggregate state, and the rest, in the liquid aggregate state. The character of phase coexistence is demonstrated in Figure 7 which shows the time evolution of the atomic potential energy. The data are based on short-time average values of that potential energy. Indeed, let us ignore fluctuations and determine the potential energy U of interacting atoms in a cluster on the basis of the relation
Figure 7. Evolution in time of the total potential energy of cluster atoms with short-time fluctuations averaged (a), for the 13-atom Lennard-Jones cluster under isothermal conditions [7] (b) and under adiabatic conditions [8] at the excitation energy of 10.8D (the melting point, i.e., the point of equal chemical potentials, corresponds to the excitation energy of 13.8D) (c). The data (b) and (c) results from computer simulations, time is measured in arbitrary units.
Entropy 12 01303 g007
E e = K + U
where K is the total kinetic energy of the atoms, and E e is the excitation energy from the state of zero temperature. For an isolated cluster, when it is under microcanonical conditions, we have, using the definition (3) of the anharmonic parameter,
U = E e ( 1 - η )
Under canonical conditions, i.e., if the cluster is in a thermostat, the temperature of the atoms T is fixed, as is their total mean kinetic energy K = 3 v T / 2 , where v is a number of vibrational degrees of freedom. In this case the mean potential energy of cluster atoms is given by
U = K ( 1 - η ) η
We see that in both cases, canonical and microcanonical, the potential energy of cluster atoms in the liquid state is higher than that in the solid, and evolution of the total atomic potential energy has the form given in Figure 7a when the cluster is below the melting point (which we take as the point of equal chemical potentials). There, the probability that the cluster be liquid is lower than that of being a solid. In reality, fluctuations complicate this picture, as shown in the computer simulation results of Figure 7b and Figure 7c [7,8] These figures demonstrate the dynamic character of equilibrium phase coexistence in clusters.
Our analysis of the cluster phase transition assumes the two-state approximation, i.e., that just two aggregate phase-like states coexist [10,11,40,42]. However this assumption does not follow from general considerations. In systems of small numbers of particles, the free energies of two–or more than two–phases may differ and yet be close enough that unfavored forms may be present in observable amounts [22]. This is precisely the origin of the absence of sharp, bulk-like phase transitions in small clusters. The coexistence phenomenon first appeared clearly in computer simulations which exhibited the bimodal character of the atomic parameters over finite ranges [3,4,5]. Using these results and comparing the results of computer simulations under various conditions, one can find the parameters for the model of two aggregate states. In particular, for the 13-atom Lennard-Jones cluster the excitation energy of the excited aggregate state (the liquid state) in the range of coexistence is [2,40,41]
Δ E = ( 2 . 40 ± 0 . 05 ) D
We note the limited accuracy of this value and its difference from that at zero temperature ( Δ E = 2 . 9 D ) that is given in Figure 3.
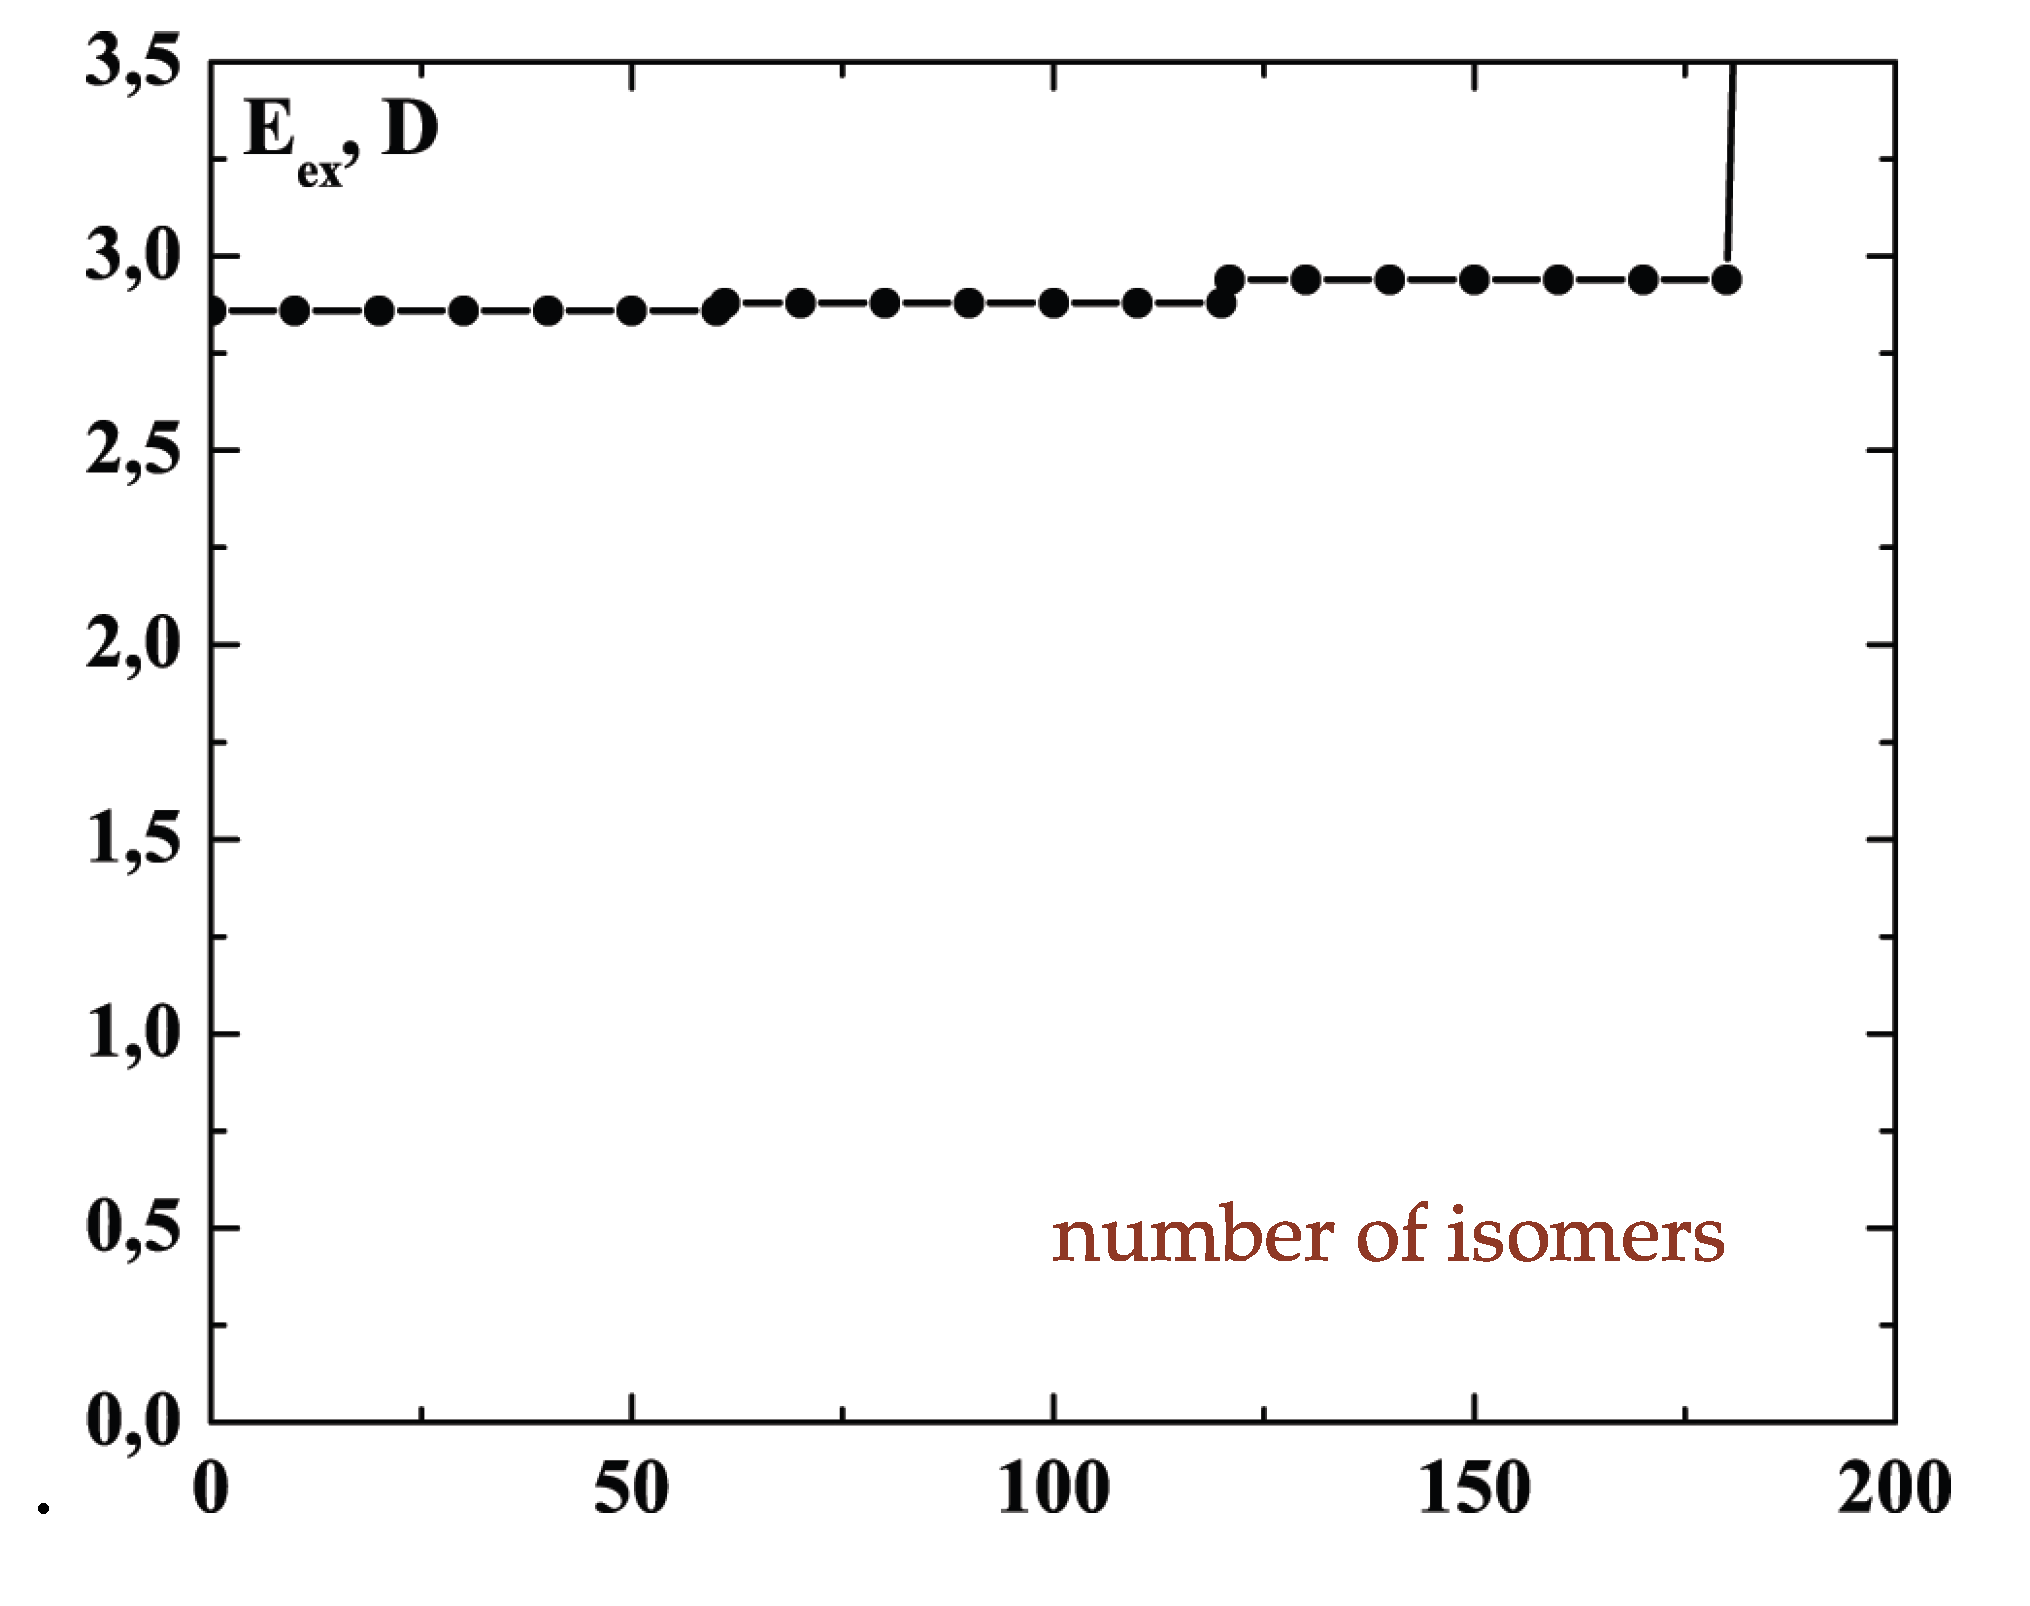
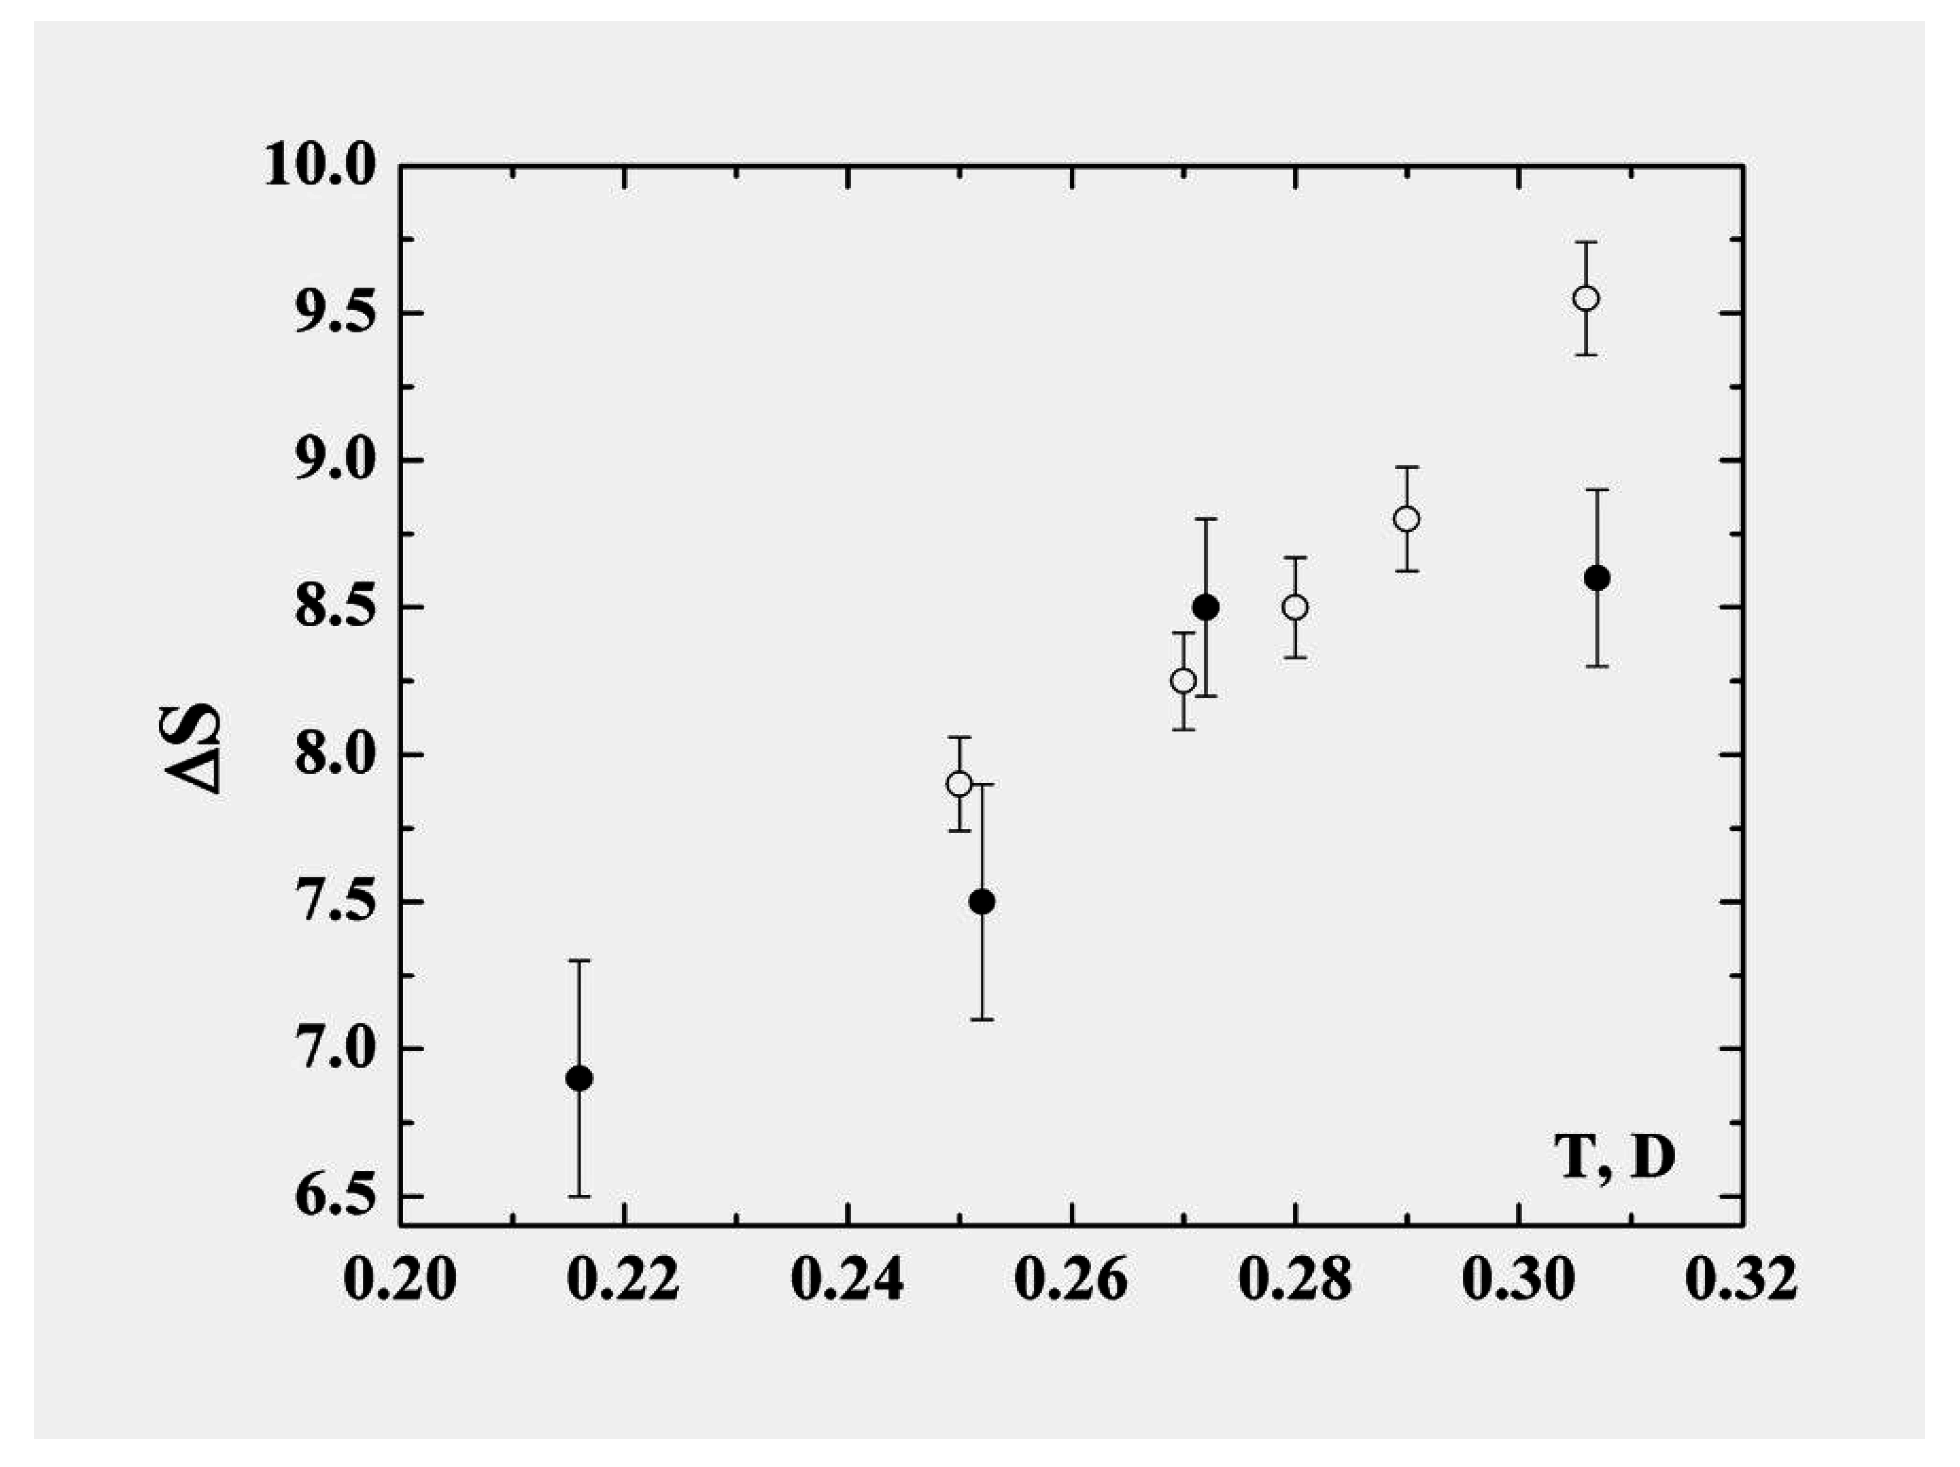
In describing the cluster within the framework of the model of two aggregate states in the coexistence phase range, we recognize that the liquid state is “looser” in the sense that the particles are not confined to specific sites and also that the accessible volume in phase space is larger and increases faster with temperature than for the solid. The liquid is therefore characterized by parameters with stronger temperature dependence than those of the solid state. Consequently some parameters of the cluster vary within the coexistence range; the character of this variation may be expressed through the anharmonicity parameter. In particular, in contrast to the phase transitions in macroscopic atomic systems with their extremely narrow—virtually infinitesimal—ranges of equilibrium coexistence, within which the entropy jump varies very little, the entropy jump at the phase transition of clusters varies significantly within the range of phase coexistence. The largest contribution to the variation of the entropy is determined by thermal motion of atoms in the liquid aggregate state. The entropy jump for the 13-atom Lennard-Jones cluster under isothermal conditions is given in Figure 8 [22,23]. These values are obtained on the basis of probabilities that a cluster is located in the liquid or solid states; these, in turn, emerge from molecular dynamics simulations of this cluster under adiabatic [6] and isothermal [7] conditions.
Figure 8. The entropy jump at melting of the 13-atom Lennard-Jones cluster [22,23]. Closed circles are obtained from the results of computer simulation of the isolated 13-atom Lennard-Jones cluster [6], and open circles correspond to the isothermal 13-atom Lennard-Jones cluster [7].
Entropy 12 01303 g008
In particular, taking the entropy jump at the melting point to be Δ S 8 and using the energy change in the phase transition in accordance with formula (8), we obtain, instead of formula (2) for the melting point of the 13-atom Lennard-Jones cluster, T m = Δ E / Δ S = ( 0 . 282 ± 0 . 004 ) D . This is one half of that given by formula (2) which ignores the anharmonic character of atom oscillations. This demonstrates that the anharmonic character of atomic motion in the cluster is very important for its properties. In this operation we nevertheless do not take into account the temperature dependence of the entropy jump.
We can also find the range of observable phase coexistence for the 13-atom Lennard-Jones cluster. Let us introduce the probabilities w s o l and w l i q for cluster to be in the solid and liquid aggregate states, respectively, and the ratio of these probabilities is
p = w l i q w s o l
For definiteness, we arbitrarily take the range of observable phase coexistence to be [23]
10 p 0 . 1
On the other hand, this ratio for an isothermal cluster is
p ( T ) = w l i q ( T ) w s o l ( T ) = exp - Δ E T + Δ S
Taking Δ S = 8 . 5 at the melting point and the transition energy according to formula (8), we find that the relation (9) is fulfilled in the temperature range T = 0 . 22 D - 0 . 39 D . To account for the temperature dependence of the entropy jump, we take, according to Figure 8, d Δ S / d T = 25 / D . Then the relation (9) leads to a narrower coexistence range, that is T = 0 . 24 D - 0 . 32 D .
Note that in the analysis of the phase transitions of dielectric clusters, we generally used the Lennard-Jones interaction potential [24,25] as the pair interaction potential between atoms, and the most of cluster simulations are based on Lennard-Jones clusters. But the only real systems which correspond closely to this description for dielectric clusters are clusters of inert gases, and even macroscopic condensed inert gases are not described accurately by the Lennard-Jones interaction potential [2,46,47]. A short-range interaction potential or a truncated Lennard-Jones potential in which interaction between nearest neighbors dominates, is more suitable for this purpose. Hence, the analysis of the Lennard-Jones systems must be recognized as only a model with respect to real condensed inert gases. Nevertheless, comparison of various characteristics of the phase transition for the Lennard-Jones clusters gives an overall semiquantitative understanding of this phenomenon despite its model character.
Thus, we can get considerable insight into the nature of the cluster phase transition on the basis of computer simulations of 13-atom Lennard-Jones clusters by molecular dynamics. This experience allows us to use a partially-traditional thermodynamic description of the cluster, but the real behavior of clusters is richer than that of macroscopic systems of the same composition, whose properties we traditionally derive from direct application of traditional thermodynamics of macroscopic systems. The principal difference between small clusters and macroscopic atomic systems is a simple consequence of the difference between large and small numbers, with the most dramatic result (to date) being the phase coexistence of clusters over finite bands of temperature and pressure, thus seeming to violate the Gibbs phase rule. This leads to other peculiarities of the cluster phase transitions. Many of these properties reveal themselves in the analysis of the 13-atom cluster with pair interactions between atoms, explicitly for the Lennard-Jones interaction. We refer to this cluster for several reasons. First, this cluster has a completed atomic shell, and the statistical weight of configurational excited states is more than that for the ground state, which allows this cluster to locate in a specific excited configurational state with the probability of one, if it has a suitable specific excitation energy. Second, there are molecular dynamics simulations that reveal detailed information about this cluster. Third, because this cluster is small, the lower configurational excitations are separated by large energy gaps from the ground state and from configurationally excited states at still higher energies. Fourth, fluctuations are relatively small for this cluster, and the properties of the solid and liquid aggregate states may be analyzed separately in the range of phase coexistence.
The discussion of the 13-atom cluster has, thus far, identified melting with promotion of a single particle from the icosahedral shell to the cluster surface. The mobilities of both the promoted “floater" particle and the vacancy in the icosahedral shell are sufficient to allow liquid-like mobility and other liquid-like properties. One might ask whether some kind of phase-transition-like phenomenon might occur when the system has enough energy or a high enough temperature that more particles could be promoted. None of the simulations cited show anything but smooth behavior in caloric curves or other properties, so it seems that the passage to states of higher excitation is smooth for the 13-particle cluster. However larger clusters do exhibit such successive transitions. Lennard-Jones clusters of more than about 45 particles show a clear phase-like form with a liquid-like surface layer and a solid core, in a temperature band between those of the solid and liquid. In fact there are three different coexistence bands for the 55-atom cluster: at the lowest temperatures of coexisting phases, e.g., about 33 K, the solid coexists with the surface-melted phase. Then, around 35 K, the solid, the surface-melted and the fully liquid phases coexist. Then there is a range in which only the surface-melted and liquid phases coexist, and above about 40K, only the liquid is stable [13,48,49,50,51,52,53]. By examining such systems, we learn the limitations of using only a cluster of a single size, and a magic number size at that, as the basis of drawing general conclusions. We might well see phases with high surface mobility and solid cores in clusters with half or fewer of the surface sites occupied. Another kind of phase that has been conjectured but not yet observed, either in experiments or simulations, would appear in systems whose liquid form has a higher density that the solid, e.g., gallium or water. In clusters of these substances, one might see a phase with a liquid core and solid outer shell, like partly-frozen ice cubes.

3. The Phase Transition in Metal Clusters

3.1. Entropy of Melting for Small Metal Clusters

We now consider the peculiarities of the phase transition of metal clusters that are consistent with the general principles for small systems, as discussed in the previous section. One can expect that special characteristics of the phase transitions in metal clusters are due to the readily excited electronic degrees of freedom. In fact, the high density of configurationally excited states of metal clusters that is a consequence of electronic properties, is very important for the phase transitions in metal clusters. Indeed, let us measure cluster energetic parameters in units of the pairwise atomic binding energy ε o . Then, on this scale the melting points T m of metal clusters are lower than those of dielectric clusters of the same size. Of course, this difference applies also for bulk systems, and in Table 1 we compare the relative values of the fusion energies Δ H f u s per atom and the melting point for bulk argon and some metals, so that according to the data in this Table, the ratios of the fusion energies to the atomic binding energies for metals are smaller than that for condensed argon.
Table 1. Melting parameters for bulk argon and metals. The fourth column gives the melting point temperature per atomic binding energy in the cluster, ε 0 .
Bulk ε o , e V T m , K T m / ε o Δ H f u s , e V Δ H f u s / ε o , %
Ar0.06883.70.1060.012318
Ni4.1317280.0360.1814.4
Cu3.4013580.0340.1384.1
Ag2.8712350.0370.1204.2
Au3.6513370.0320.1303.6
Figure 9a is a schematic picture of the typical PES of a dielectric cluster relevant for the melting transition, showing that the amplitude of motion is greater for the liquid (upper) region of the single surface than for the lower, solid region. This is compared with the analogous schematic picture for metal clusters clusters, with many potential surfaces, in Figure 9b. The upper surfaces in this schematic diagram are roughly as steep as that of the lowest state but, implied here, is the relatively easy passage from one of the excited surfaces to another. In reality, some of those surfaces may well also have broad minima that themselves allow large-amplitude motion.
Figure 9. Schematic representation of the potential energy surface for configurational excitation of a dielectric cluster (a) and for a metal cluster (b) with its many intersecting PES’s.
Entropy 12 01303 g009
Figure 10 gives the cluster’s configurational excitation energies E e x for the 13-atom metal clusters as functions of the number of isomers, i.e., here the number of configurational states, whose excitation energy does not exceed the indicated value. This dependence emerges from computer simulations [54] carried out with the Sutton-Chen interaction potential between metal atoms [55]. Although this simple form of the atomic interaction potential in metal systems has a somewhat limited accuracy, evaluating various cluster parameters within the framework of this limited scheme allows one to understand the peculiarities of the phase transition in metal clusters and to consider more realistic methods of its description.
Each electronic state is characterized by one or more configurational states, each corresponding to a local minimum on the PES of that state. Because of the profusion of electronic states, each with its own PES, the total density of available states incorporates a sharp increase of the number of configurational states with an increase of the cluster’s excitation energy. This characteristic reveals the different natures of the phase transitions in metal and dielectric clusters. The number of accessible configurational states of the liquid aggregate state of a dielectric simply does not vary a great deal with energy, and we demonstrate this in Figure 11, analogous to Figure 10 for metal clusters and constructed on the basis of data in Figure 3. Comparing these figures shows that the number of accessible atomic configurations for the liquid aggregate state of dielectric clusters varies slightly in the course of their excitation. (This is of course particularly the case for closed-shell systems such as the 13-particle cluster.) In contrast, in the case of metal clusters, the systems can reach more and more configurational states as new electronic states and potential surfaces become accessible.
Figure 10. The numbers of isomers for metal clusters of 13 atoms as functions of the excitation energy–in effect, the density of configurational states. a) N i 13 , b) A g 13 , c) A u 13 [54].
Entropy 12 01303 g010
Figure 11. The number of configurational states or isomers for the 13-atom Lennard-Jones cluster..
Entropy 12 01303 g011
We now construct a model for the phase transition in metal clusters based on what we have learned about dielectric clusters and on the behavior of the density of the configurational states with energy for the 13-atom metal clusters in Figure 10. Table 2 contains parameters of 13-atom metal clusters by analogy with the data in Table 1 for bulk metals and gives the values of the total binding energy E b of cluster atoms and configurational excitation energy Δ ε for clusters of coinage metals, and also the ratios of these values. Note that this ratio for the Lennard-Jones cluster is about 6 % and exceeds that for metal clusters. Table 2 also contains parameters of the approximate cluster configurational excitation energies E e x as functions of the number n of configurational states that is expressed in the form
E ( n ) = Δ E + d E d n n
where Δ E is the excitation energy to the lowest excited configuration or, more usually for these clusters, the lowest group of excited configurations. This is a form valid in the range in which one observes the phase transition when only a few configurations are excited.
Table 2. The binding energy E b of cluster atoms and configurational excitation Δ ε for 13-atom clusters of coinage metals. Here, the vibrational or thermal contributions δ S t to the entropy change in the phase change and the configurational contributions Δ S c o n are given separately, as well as their sum, Δ S and the percentage of that total due to configurational excitation.
Cluster N i 13 A g 13 A u 13
E b , e V 44.1127.8741.96
Δ ε , e V 0.730.660.11
Δ ε / E b , % 1.62.40.26
Δ E , e V 1.01.10.4
d E / d n , m e V 1.90.520.46
T m , K 860820440
δ S t 9.810.66.1
Δ S c o n 3.14.33.8
Δ S 131510
Δ S c o n / Δ S , %242938
In constructing the model of the phase transition of metal atoms by analogy with that for dielectric clusters, we must account for the large number of configurational states which contribute to the liquid aggregate state of metal clusters. Then we take the ratio of the populations for the liquid and solid states using the following expression instead of formula (10):
p ( T ) = exp - E T g ( E , T ) d n
in which E is the excitation energy given by formula (11), n ( E ) is the number of configurational states with the excitation energy below E, the factor g ( E , T ) characterizes the part of the statistical weight due to translation motion of atoms, so that at zero temperature with harmonic oscillations of atoms g ( E , 0 ) = 1 . According to formula (11) we obtain
p ( T ) = g ( T ) T d n d E exp - Δ E T
where for simplicity we ignore the dependence of the vibrational statistical weight on each configurational state. Defining the melting point T m as the temperature at which p ( T m ) = 1 , we determine the contribution to the total entropy jump δ S t at the melting point due to the difference between atomic thermal motion in the liquid and solid states as
δ S t = ln g ( T m ) = Δ E T m - T m d E / d n
As we discussed earlier, the melting point of clusters T m may be determined by another method, in particular, on the basis of the behavior of the root mean square of the bond length fluctuation that is given by formula (4). This quantity is given in Figure 12 for the 13-atom silver cluster [54]. The values of the melting points for 13-atom metal clusters under consideration are given in Table 2 [54]. Next, the values the entropy jump δ S t at the melting point due to anharmonicity of atomic motions in the liquid and solid states are evaluated by formula (14) and are given in in Table 2.
Figure 12. The the root mean square of the bond length fluctuation for the cluster A g 13 [54]. 1 - the solid state, 2 - the melting range, 3 - the liquid cluster state.
Entropy 12 01303 g012
One can find also the entropy jump Δ S c o n associated with melting due to configurational excitation; by definition, that is given by the following formula
Δ S c o n = ln n ¯ = ln n d p p = 0 ln T m x d E / d n e - x d x = ln T m d E / d n - C
where C = 0 . 577 is the Euler constant. Calculated on the basis of this formula, values of Δ S c o n at the melting point are given in Table 2. Table 2 contains also the values of the total entropy jump according to formula
Δ S = δ S t + Δ S c o n = Δ E T m - C
As follows from Table 2, the different character of atomic thermal motion in the solid and liquid states gives the dominant contribution to the entropy jump at melting, whereas this contribution for the 13-atom Lennard-Jones clusters is only approximately 40%. But these comparisons contain an error because we have used the energy density of Figure 10 at zero temperature. Let us estimate this error returning to the 13-atom Lennard-Jones cluster. Then the energy of configurational excitation is approximately 2 . 9 D above that at zero temperature. If we use this value instead of that given by formula (8), we obtain the contribution of thermal motion of atoms to the entropy jump at melting to be 50 % instead of the value 40 % based on formula (8). One can expect from this that the anharmonicity in atomic thermal motion raises the contribution by approximately 50 % for the 13-atom metal clusters under consideration. Comparison with the dielectric cluster shows also that the results of Table 2 have only the character of an estimate.

3.2. Phase Coexistence in Small Metal Clusters

To account for the temperature dependence for cluster parameters, one can use the caloric curves to examine the dependence of the cluster’s internal energy on the temperature. Figure 13 gives the temperature of the A g 13 cluster as a function of the binding energy ε 0 per atom [54]. In this figure a temperature range “a" corresponds to the solid cluster state, ‘b", the point of inflection, is the melting point, and “c" lies in the liquid region.
Figure 13. The caloric curve for the A g 13 cluster [54]. a - the solid state, b - the melting range, c - the liquid cluster state.
Entropy 12 01303 g013
Note that the binding energy of the A g 13 cluster is ε 0 = 2 . 144 e V per atom at zero temperature and is less than that, ε b = E b / n = 2 . 87 e V , the value for bulk silver. According to the caloric curve the energy of excitation of the lowest configurational state at the melting point T m = 820 K is E e x = 2 . 85 e V and is small compared to the atomic binding energy at zero temperature, E b = 27 . 87 e V . Next, the kinetic energy of atoms at the melting point according to the kinetic definition of the temperature is E k i n = 33 T m / 2 = 1 . 17 e V ; this gives us the value of the anharmonicity parameter (3) as η = 0 . 41 . This slightly exceeds that for the 13-atom Lennard-Jones cluster (see Figure 5b). One can expect that the anharmonicity parameter is lower for metal clusters because of their large numbers of configurational states with effective transitions between them. This argument is right, but melting for dielectric clusters proceeds at higher temperatures than that for metal clusters, when based on the atomic binding energies. Indeed, the ratio T m / E b ( E b is the total binding energy of atoms at zero temperature and for the Lennard-Jones cluster of 13 atoms it is E b = 44 . 34 D ) is equal to 6 . 3 · 10 - 3 for the 13-atom Lennard-Jones cluster and is only 2 . 5 · 10 - 3 for the A g 13 cluster.
Note also that the energy jump at the solid-liquid phase transition of metal clusters is relatively small. For the A g 13 cluster one can estimate this on the basis of the caloric curve of Figure 13 as Δ E 0 . 2 e V , and the ratio Δ E / E b is approximately 7 · 10 - 3 , while for the 13-atom Lennard-Jones cluster this ratio is much larger, 5 . 4 · 10 - 2 . For this reason although the solid and liquid aggregate states might be separated for the 13-atom Lennard-Jones cluster, this is impossible for 13-atom metal clusters. However simulations indicate that the rates of passage between solid and liquid phases for all these clusters is on a scale of a few hundred or thousand vibrational periods.
We now analyze the character of the phase transition in metal clusters and phase coexistence from general considerations. We base our analysis on computer simulation of 13-atom metal clusters [54,56,57,58], and consider the metal cluster as a thermodynamic object, so that we describe the cluster by some thermodynamic parameters, such as its temperature and entropy. This description may be carried further when we apply a statistical interpretation to the cluster. We do not discuss the accuracy of the data given in Table 1 and Table 2, and consider the results of these Tables as estimates. This allows us to escape the analysis of the accuracy of the approximation (11). Then we have the difference between the dielectric and metal clusters. Indeed, the two-state approximation is valid for dielectric clusters, i.e., the cluster liquid state is characterized by a certain value of the entropy jump that depends on the temperature. In this manner one can divide the entropy jump Δ S into those parts related to configurational and thermal excitations. In the case of metal clusters, the liquid aggregate state includes many configurational excitations and separation of the entropy jump into the configurational and thermal parts has a more complex, conditional character.
Let us analyze the algorithm for determining the entropy jump of metal clusters. Along with the density of configurational states described by formula (11) and is given in Figure 10 at zero temperature, we determine separately the melting point from the behavior of the correlation parameter represented in Figure 12 and also use information from the caloric curve given in Figure 13. Our assumption is that formula (11) holds at finite, nonzero temperatures, and then we adjust this formula’s parameters on the basis of the cluster’s melting point. We note also that because of the small value of the fusion energy for metal clusters, the solid and liquid aggregate states are not well separated in the phase coexistence range in computer simulations of these clusters, in contrast to dielectric clusters. This restricts information about the phase transitions of metal clusters.
Nevertheless, we observe similar behavior for dielectric and metal clusters in their phase transitions. First, in both cases a part of the entropy jump at the phase transition is determined by configurational excitation of the cluster and another part arises from the anharmonicity of the atomic oscillations in the solid and especially in the liquid aggregate states. That anharmonicity depends on the temperature. Second, coexistence of the solid and liquid phases takes place in both cases in the neighborhood around the traditional melting point. Although for metal clusters the relative energy parameters describing the phase transition are smaller than those for dielectric clusters, the character of the phase transition is virtually identical for dielectric and metal clusters.

4. Conclusions

The analysis presented here exhibits the similar character of phase transitions in dielectric and metal clusters, but emphasizes the differences in the natures of the liquid aggregate states of these two kinds of clusters. Specifically, the structure of configurational states of dielectric clusters constituting the liquid aggregate state varies only slightly with increasing cluster temperature or excitation, whereas in metal clusters this variation is significant and new configurational states come into play in the liquid state as the cluster is excited. This is accompanied by a small energy gap between the solid and liquid aggregate states for the metal clusters in comparison with dielectric ones, when the excitation energy to reach the liquid state is measured in units of the total binding energies of the cluster atoms. This leads to a difference in the character of computer simulations for metal and dielectric clusters, so that one can extract separately the solid and liquid states of small dielectric clusters (at least, consisting of 13 atoms), while it is impossible for metal clusters. For these reasons information about phase transitions of dielectric clusters including parameters of the solid and liquid aggregate states is more detailed than that for metal clusters. Nevertheless, the qualitative character of the phase transitions in metal and dielectric clusters is identical, and, in particular, phase coexistence takes place near the melting point.

References

  1. Berry, R.S. Theory of Atomic and Molecular Clusters; Jellinek, J., Ed.; Springer: Berlin, Germany, 1999; pp. 1–26. [Google Scholar]
  2. Smirnov, B.M.; Berry, R.S. Phase Transitions of Simple Systems; Springer: Heidelberg, Germany, 2007. [Google Scholar]
  3. Briant, C.L.; Burton, J.J. Molecular dynamics study of the structure and thermodynamic properties of argon microclusters. J. Chem. Phys. 1975, 63, 2045–2058. [Google Scholar] [CrossRef]
  4. Etters, R.D.; Kaelberer, J.B. Thermodynamic properties of small aggregates of rare-gas atoms. Phys. Rev. A 1975, 11, 1068–1079. [Google Scholar] [CrossRef]
  5. Etters, R.D.; Kaelberer, J.B. On the character of the melting transition in small atomic aggregates. J. Chem. Phys. 1977, 66, 5112–5116. [Google Scholar] [CrossRef]
  6. Jellinek, J.; Beck, T.L.; Berry, R.S. Solid-liquid phase changes in simulated isoenergetic Ar13. J. Chem. Phys. 1986, 84, 2783–2794. [Google Scholar] [CrossRef]
  7. Davis, H.L.; Jellinek, J.; Berry, R.S. Melting and freezing in isothermal Ar13. J. Chem. Phys. 1987, 86, 6456–6469. [Google Scholar] [CrossRef]
  8. Beck, T.L.; Jellinek, J.; Berry, R.S. Rare gas clusters: Solids, slush and magic numbers. J. Chem. Phys. 1987, 87, 545–554. [Google Scholar] [CrossRef]
  9. Berry, R.S.; Beck, T.L.; Davis, H.L.; Jellinek, J. Solid-liquid phase behavior in microclusters. Adv. Chem. Phys. 1988, 90, 75–138. [Google Scholar]
  10. Natanson, G.; Amar, F.; Berry, R.S. Melting and surface tension in microclusters. J. Chem. Phys. 1983, 78, 399–408. [Google Scholar] [CrossRef]
  11. Berry, R.S.; Smirnov, B.M. Two-state approximation for aggregate states of clusters. J. Chem. Phys. 2001, 114, 6816–6823. [Google Scholar] [CrossRef]
  12. Berry, R.S. Potential surfaces and dynamics: What clusters tell us. Chem. Rev. 1993, 93, 2379–2394. [Google Scholar] [CrossRef]
  13. Kunz, R.E.; Berry, R.S. Multiple phase coexistence in finite systems. Phys. Rev. E 1994, 49, 1895–1908. [Google Scholar] [CrossRef]
  14. Schmidt, M.; Kusche, R.; Kronmller, W.; von Issendorff, B; Haberland, H. Experimental determination of the melting point and heat capacity for a free cluster of 139 sodium atoms. Phys. Rev. Lett. 1997, 79, 99–102. [Google Scholar] [CrossRef]
  15. Schmidt, M.; Hippler, T.; Donges, J.; Kronmller, W.; von Issendorf, B.; Haberland, H. Caloric curve across the liquid-to-gas change for sodium clusters. Phys. Rev. Lett. 2001, 87, 203402. [Google Scholar] [CrossRef] [PubMed]
  16. Breaux, G.A.; Benirschke, R.C.; Jarrold, M.F. Melting, freezing, sublimation, and phase coexistence in sodium chloride nanocrystals. J. Chem. Phys. 2004, 121, 6502–6507. [Google Scholar] [CrossRef] [PubMed]
  17. Schmidt, M.; Donges, J.; Hippler, Th.; Haberland, H. Influence of energy and entropy on the melting of sodium clusters. Phys. Rev. Lett. 2003, 90, 103401. [Google Scholar] [CrossRef] [PubMed]
  18. Eryrek, M.; Gven, M.H. Negative heat capacity of Ar55. Physica A 2007, 377, 514–522. [Google Scholar] [CrossRef]
  19. Berry, R.S.; Smirnov, B.M. Entropy behavior in cluster melting. J. Chem. Phys. 2009, 130, 064302. [Google Scholar] [CrossRef] [PubMed]
  20. Martin, T.P. Shells of atoms. Physics Repts. 1996, 273, 199–242. [Google Scholar] [CrossRef]
  21. Reiss, H.; Mirabel, P; Whetten, R.L. Capillarity theory for the “Coexistence” of liquid and solid clusters. J. Phys. Chem. 1988, 92, 7241–7246. [Google Scholar]
  22. Berry, R.S.; Smirnov, B.M. Observability of coexisting phases of clusters. Int. J. Mass Spectrometry 2009, 280, 204–208. [Google Scholar] [CrossRef]
  23. Berry, R.S.; Smirnov, B.M. Phase transitions in clusters. Fizika Nizkikh Temperatur 2009, 35, 339–349. [Google Scholar] [CrossRef]
  24. Lennard-Jones, J.E. On the determination of molecular fields. II. From the equation of state of a gas. Proc. Roy. Soc. A 1924, 106, 463–477. [Google Scholar] [CrossRef]
  25. Lennard-Jones, J.E.; Ingham, A.E. On the calculation of certain crystal potential constants, and on the cubic crystal of least potential energy. Proc. Roy. Soc. A 1925, 107, 636–653. [Google Scholar] [CrossRef]
  26. Hoare, M.R.; Pal, P. Physical cluster mechanics: Statics and energy surfaces for monatomic systems. Adv. Phys. 1971, 20, 161–196. [Google Scholar] [CrossRef]
  27. Hoare, M.R.; Pal, P. Physical cluster mechanics: Statistical thermodynamics and nucleation theory for monatomic systems. Adv. Phys. 1975, 24, 645–678. [Google Scholar] [CrossRef]
  28. Hoare, M.R. Structure and dynamics of simple microclusters. Adv. Chem. Phys. 1979, 40, 49–135. [Google Scholar]
  29. Stillinger, F.H.; Weber, T.A. Hidden structure in liquids. Phys. Rev. A 1982, 25, 978–989. [Google Scholar] [CrossRef]
  30. Stillinger, F.H.; Weber, T.A. Dynamics of structural transitions in liquids. Phys. Rev. A 1983, 28, 2408–2416. [Google Scholar] [CrossRef]
  31. Corti, D.S.; Debenedetti, P.G.; Sastry, S.; Stillinger, F.H. Constraints, metastability, and inherent structures in liquids. Phys. Rev. E 1977, 55, 5522–5534. [Google Scholar] [CrossRef]
  32. Li, Z.; Scheraga, H.A. Monte carlo-minimization approach to the multiple-minima problem in protein folding. Proc. Nat’l. Acad. Sci. USA 1987, 84, 6611–6615. [Google Scholar] [CrossRef]
  33. Wales, D.J.; Doye, J.P.K. Global optimization by Basin-Hopping and the lowest energy structures of Lennard-Jones Clusters containing up to 110 atoms. J. Phys. Chem. A 1997, 101, 5111–5116. [Google Scholar] [CrossRef]
  34. Wales, D.J. Energy Landscapes; Cambridge University Press: Cambridge, UK, 2003. [Google Scholar]
  35. Vekhter, B.; Ball, K.D.; Rose, J.; Berry, R.S. Vibrational relaxation of clusters: Relation to potential surface topography. J. Chem. Phys. 1997, 106, 4644–4650. [Google Scholar] [CrossRef]
  36. Wales, D.J.; Doye, J.P.K.; Miller, M.A.; Mortenson, P.N.; Walsh, T.R. Energy landscapes from clusters to biomolecules. Adv. Chem. Phys. 2000, 115, 1–111. [Google Scholar]
  37. Lu, J.; Zhang, C.; Berry, R.S. Kinetics of model energy landscapes: An approach to complex systems. Phys. Chem. Chem. Phys. 2005, 7, 3443–3456. [Google Scholar] [CrossRef] [PubMed]
  38. Wales, D.J.; Berry, R.S. Melting and freezing of small argon clusters. J. Chem. Phys. 1990, 92, 4283–4295. [Google Scholar] [CrossRef]
  39. Bixon, M.; Jortner, J. Energetic and thermodynamic size effects in molecular clusters. J. Chem. Phys. 1989, 91, 1631–1642. [Google Scholar] [CrossRef]
  40. Smirnov, B.M. Melting of clusters with pair interaction of atoms. Phys. Uspekhi 1994, 37, 1079–1096. [Google Scholar] [CrossRef]
  41. Smirnov, B.M. Surface melting of clusters. Phys. Scripta 1994, 50, 427–431. [Google Scholar] [CrossRef]
  42. Berry, R.S.; Jellinek, J.; Natanson, G. Melting of clusters and melting. Phys. Rev. A 1984, 30, 919–931. [Google Scholar] [CrossRef]
  43. Berry, R.S.; Smirnov, B.M. Phase transitions and adjacent phenomena in simple atomic systems. Phys. Usp. 2005, 48, 345–388. [Google Scholar] [CrossRef]
  44. Lindemann, F.A. ber die Berechnung molekularer Eigenfrequenzen. Phys. Z. 1910, 11, 609–612. [Google Scholar]
  45. Zhou, Y.; Karplus, M.; Ball, K.D.; Berry, R.S. The distance fluctuation criterion for melting: Comparison of square-well and Morse potential models for clusters and homopolymers. J. Chem. Phys. 2002, 116, 2323–2329. [Google Scholar] [CrossRef]
  46. Smirnov, B.M. Scaling method in atomic and molecular physics. Phys. Usp. 2001, 44, 1229–1253. [Google Scholar] [CrossRef]
  47. Smirnov, B.M. Principles of Statistical Physics; Wiley: Berlin, Germany, 2006. [Google Scholar]
  48. Labastie, P.; Whetten, R.L. Statistical thermodynamics of the cluster solid-liquid transition. Phys. Rev. Lett. 1990, 65, 1567–1570. [Google Scholar] [CrossRef] [PubMed]
  49. Braier, P.A.; Berry, R.S.; Wales, D.J. How the range of pair interactions governs features of multidimensional potentials. J. Chem. Phys. 1990, 93, 8745–8756. [Google Scholar] [CrossRef]
  50. Cheng, H.-P.; Berry, R.S. Surface melting and surface diffusion on clusters. Mat. Res. Soc. Symp. Proc. 1991, 206, 241–252. [Google Scholar] [CrossRef]
  51. Cheng, H.-P.; Berry, R.S. Surface melting of clusters and implications for bulk matter. Phys. Rev. A 1992, 45, 7969–7980. [Google Scholar] [CrossRef] [PubMed]
  52. Kunz, R.E.; Berry, R.S. Coexistence of multiple phases in finite systems. Phys. Rev. Lett. 1993, 71, 3987–3990. [Google Scholar] [CrossRef] [PubMed]
  53. Doye, J.P.K.; Wales, D.J. Calculation of thermodynamic properties of small Lennard-Jones clusters incorporating anharmonicity. J. Chem. Phys. 1995, 102, 9659–9572. [Google Scholar] [CrossRef]
  54. Arslan, H.; Güven, M.H. Melting dynamics and isomer distributions of small metal clusters. New J. Phys. 2005, 7, 60. [Google Scholar] [CrossRef]
  55. Sutton, A.P.; Chen, J. Long-range Finnis-Sinclair potentials. Phil. Mag. Lett. 1990, 61, 139–146. [Google Scholar] [CrossRef]
  56. Arslan, H.; Güven, M.H. Melting of AuN (N=12, 13, 14) Microclusters. Acta Phys. Slovac. 2006, 56, 511–520. [Google Scholar]
  57. Yildirim, E.K.; Atis, M.; Guvenc, Z.B. Molecular dynamics simulation of melting behaviour of small gold clusters: AuN (N-12-14). Phys. Scripta 2007, 75, 111–118. [Google Scholar] [CrossRef]
  58. Sebetci, A; Guvenc, Z.B. Molecular dynamics simulation of the melting behaviour of 12-, 13-, 14-atom platinum clusters. Model. Simul. Mater. Sci. Eng. 2004, 12, 1131–1138. [Google Scholar] [CrossRef]

