by
Jesús Polo 1,* and Redlich J. García 2
and Redlich J. García 2
1
Photovoltaic Solar Energy Unit, Renewable Energy Division, CIEMAT, Avda. Complutense 40, 28040 Madrid, Spain
2
Department of Mechanical and Metallurgial Engineering, Pontificia Universidad Católica de Chile, Santiago 7820436, Chile
Remote Sens. 2023, 15(3), 567; https://doi.org/10.3390/rs15030567 - 17 Jan 2023
Cited by 15 | Viewed by 3173
Abstract
Solar cadasters are excellent tools for determining the most suitable rooftops and areas for PV deployment in urban environments. There are several open models that are available to compute the solar potential in cities. The Solar Energy on Building Envelopes (SEBE) is a
[...] Read more.
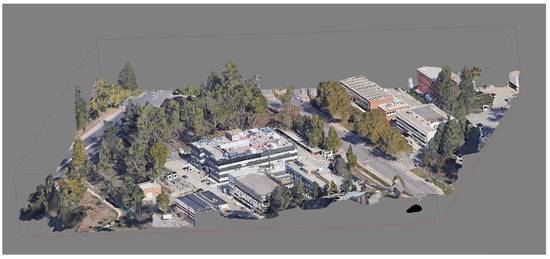
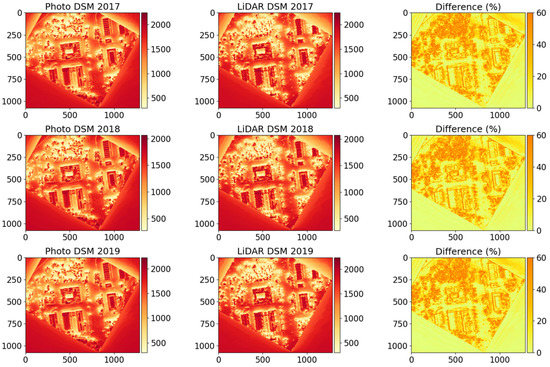
Solar cadasters are excellent tools for determining the most suitable rooftops and areas for PV deployment in urban environments. There are several open models that are available to compute the solar potential in cities. The Solar Energy on Building Envelopes (SEBE) is a powerful model incorporated in a geographic information system (QGIS). The main input for these tools is the digital surface model (DSM). The accuracy of the DSM can contribute significantly to the uncertainty of the solar potential, since it is the basis of the shading and sky view factor computation. This work explores the impact of two different methodologies for creating a DSM to the solar potential. Solar potential is estimated for a small area in a university campus in Madrid using photogrammetry from google imagery and LiDAR data to compute different DSM. Large differences could be observed in the building edges and in the areas with a more complex and diverse topology that resulted in significant differences in the solar potential. The RSMD at a measuring point in the building rooftop can range from 10% to 50% in the evaluation of results. However, the flat and clear areas are much less affected by these differences. A combination of both techniques is suggested as future work to create an accurate DSM.
Full article
(This article belongs to the Special Issue New Challenges in Solar Radiation, Modeling and Remote Sensing)
▼
Show Figures

Figure 1


