Remote Sens. 2021, 13(4), 806; https://doi.org/10.3390/rs13040806 - 22 Feb 2021
Cited by 24 | Viewed by 6204
Abstract
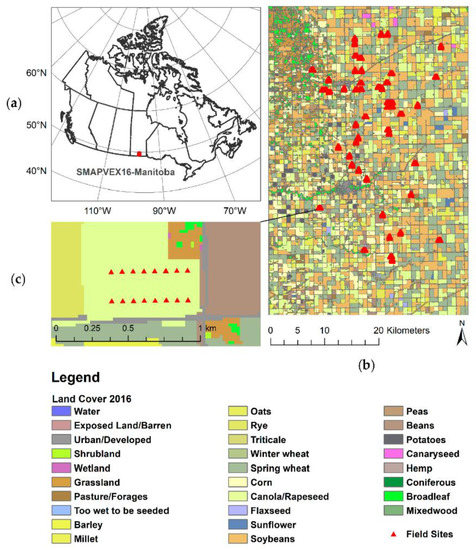
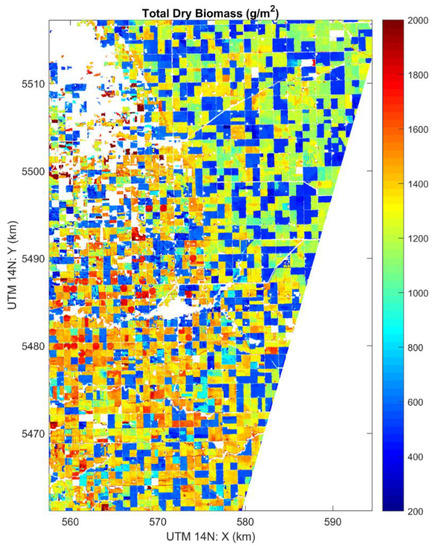
We evaluate the potential of using a process-based ecosystem model (BEPS) for crop biomass mapping at 20 m resolution over the research site in Manitoba, western Canada driven by spatially explicit leaf area index (LAI) retrieved from Sentinel-2 spectral reflectance throughout the entire
[...] Read more.
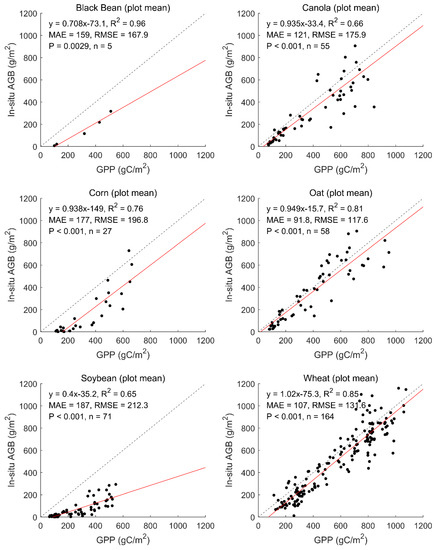
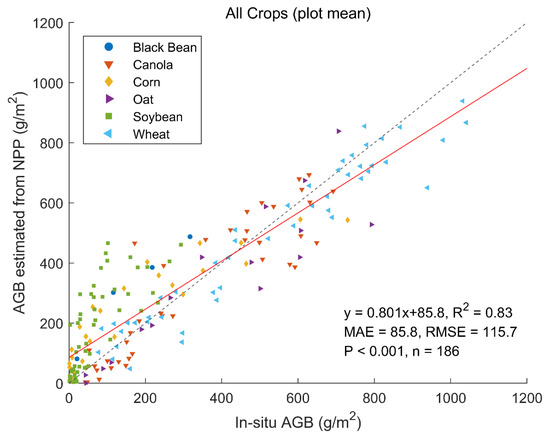
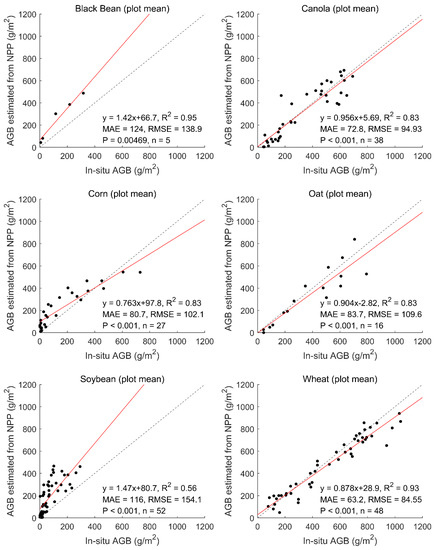
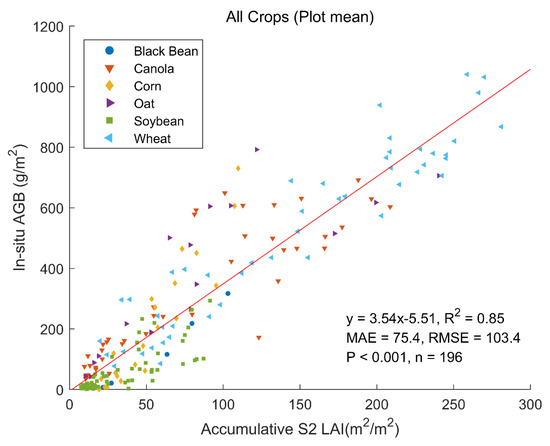
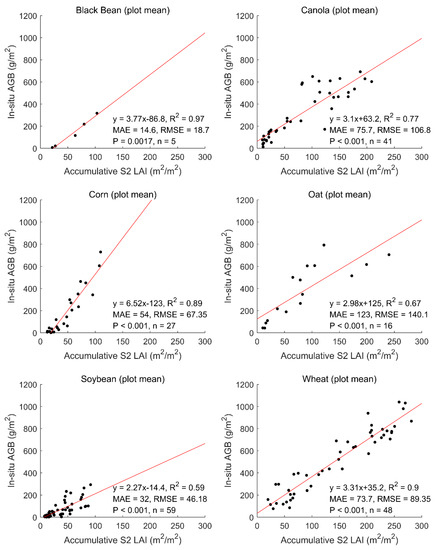
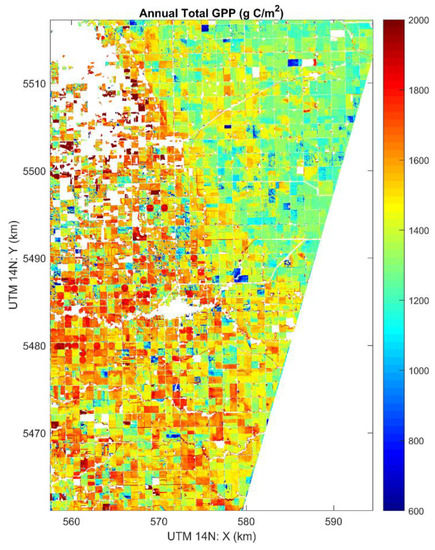
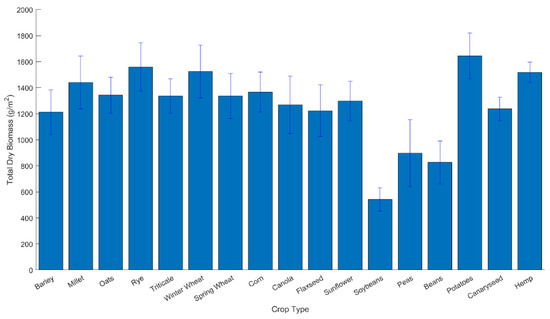
We evaluate the potential of using a process-based ecosystem model (BEPS) for crop biomass mapping at 20 m resolution over the research site in Manitoba, western Canada driven by spatially explicit leaf area index (LAI) retrieved from Sentinel-2 spectral reflectance throughout the entire growing season. We find that overall, the BEPS-simulated crop gross primary production (GPP), net primary production (NPP), and LAI time-series can explain 82%, 83%, and 85%, respectively, of the variation in the above-ground biomass (AGB) for six selected annual crops, while an application of individual crop LAI explains only 50% of the variation in AGB. The linear relationships between the AGB and these three indicators (GPP, NPP and LAI time-series) are rather high for the six crops, while the slopes of the regression models vary for individual crop type, indicating the need for calibration of key photosynthetic parameters and carbon allocation coefficients. This study demonstrates that accumulated GPP and NPP derived from an ecosystem model, driven by Sentinel-2 LAI data and abiotic data, can be effectively used for crop AGB mapping; the temporal information from LAI is also effective in AGB mapping for some crop types.
Full article
(This article belongs to the Special Issue Recent Advances for Crop Mapping and Monitoring Using Remote Sensing Data)
►
Show Figures

Graphical abstract


