by
Xiaoyong Zhu 1,2,* , Xinming Tang 1,2,3, Guo Zhang 1,2, Bin Liu 4 and Wenmin Hu 5
, Xinming Tang 1,2,3, Guo Zhang 1,2, Bin Liu 4 and Wenmin Hu 5
1
The State Key Laboratory of Information Engineering in Surveying, Mapping and Remote Sensing, Wuhan University, Wuhan 430079, China
2
The Land Satellite Remote Sensing Application Center, Ministry of Natural Resources, Beijing 100094, China
3
College of Geomatics, Shandong University of Science and Technology, Qingdao 266590, China
4
State Key Laboratory of Remote Sensing Science, Aerospace Information Research Institute, Chinese Academy of Sciences, Beijing 100101, China
5
The National Joint Engineering Laboratory of Internet Applied Technology of Mines, China University of Mining and Technology, Xuzhou 221116, China
Remote Sens. 2021, 13(23), 4791; https://doi.org/10.3390/rs13234791 - 26 Nov 2021
Cited by 19 | Viewed by 3241
Abstract
Digital Surface Model (DSM) derived from high resolution satellite imagery is important for various applications. GFDM is China’s first civil optical remote sensing satellite with multiple agile imaging modes and sub-meter resolution. Its panchromatic resolution is 0.5 m and 1.68 m for multi-spectral
[...] Read more.
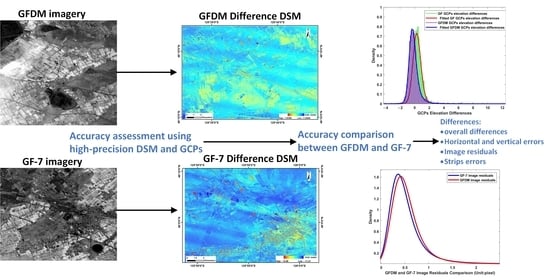
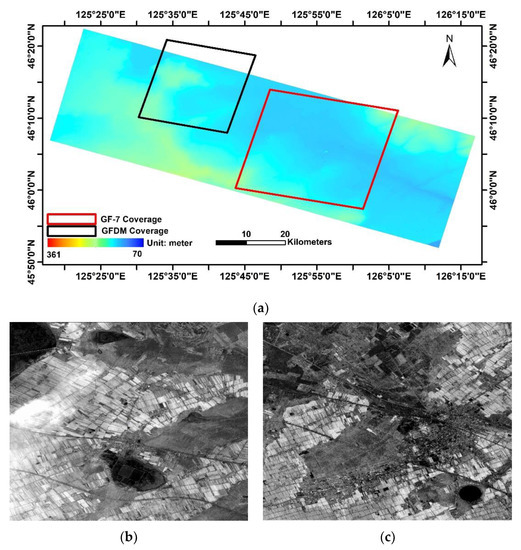
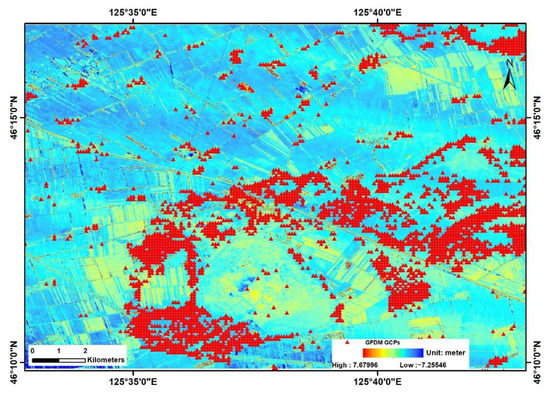
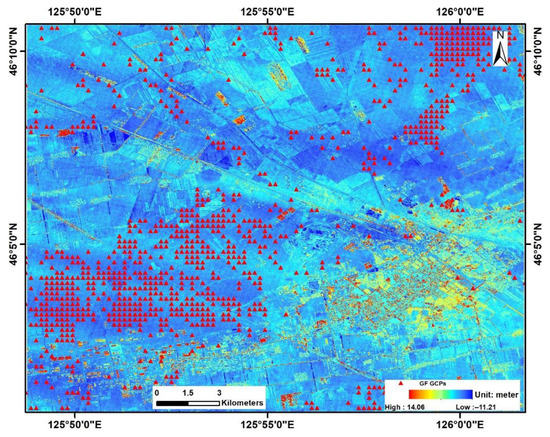
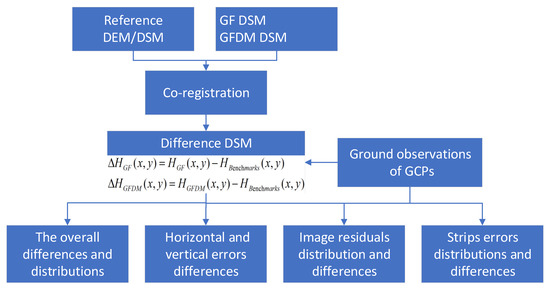
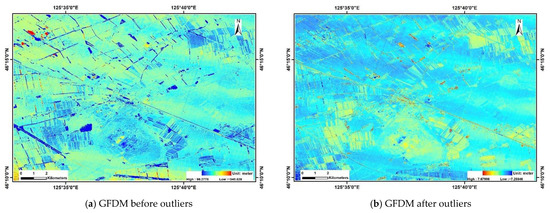
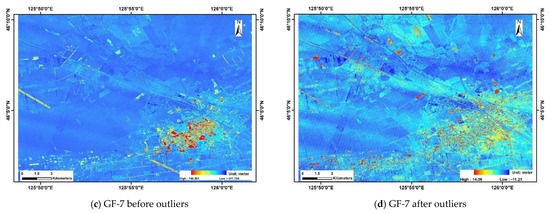
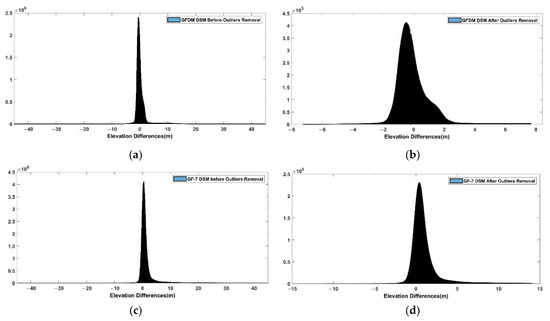
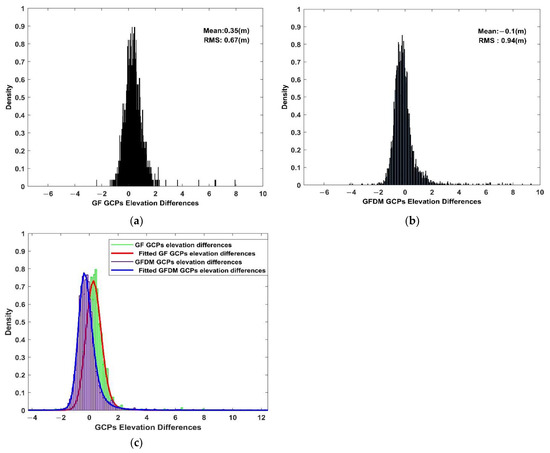
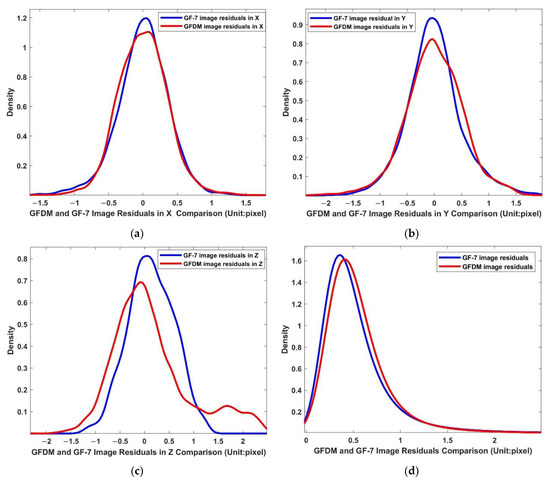
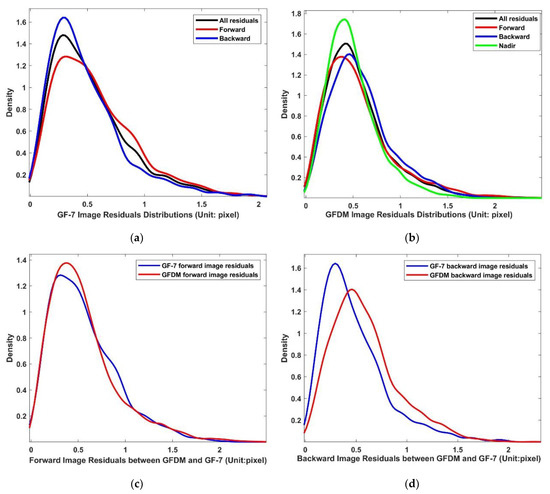
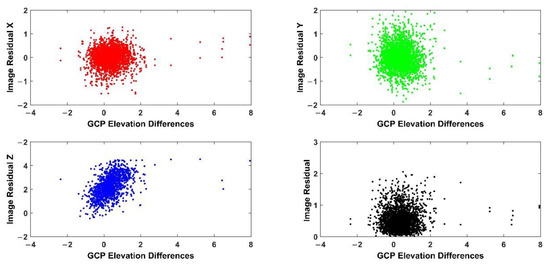
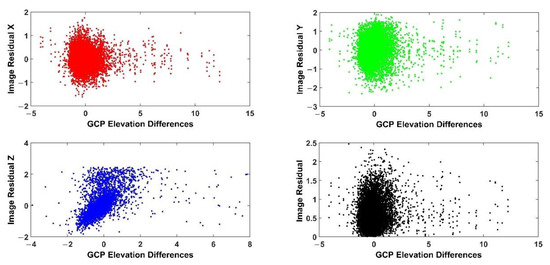
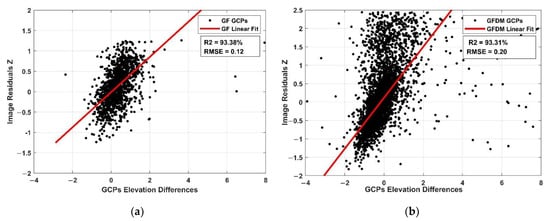
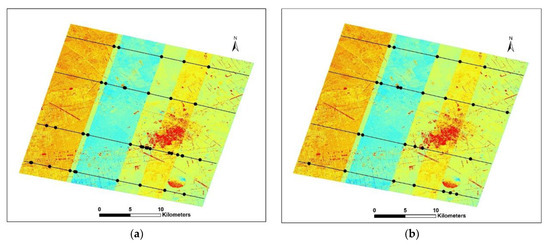
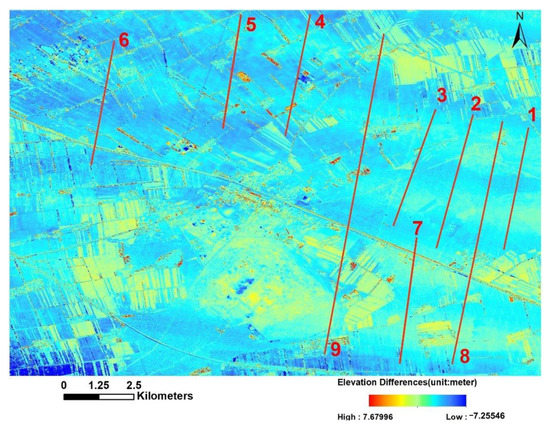
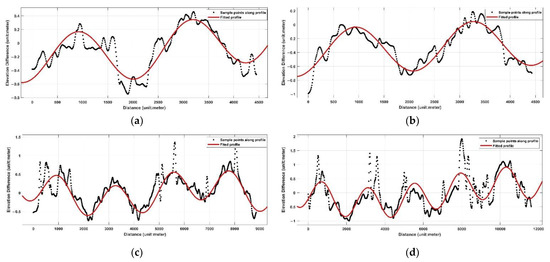
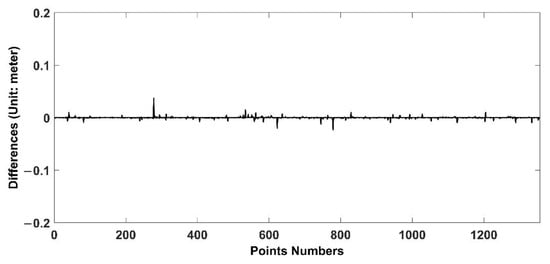
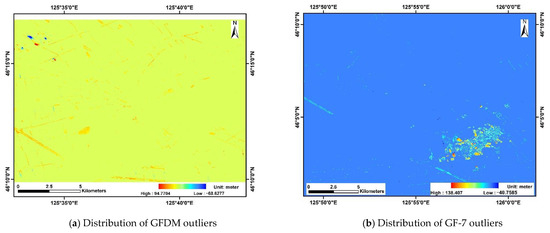
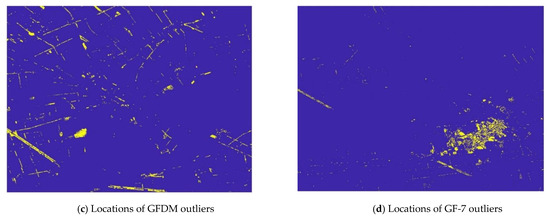
Digital Surface Model (DSM) derived from high resolution satellite imagery is important for various applications. GFDM is China’s first civil optical remote sensing satellite with multiple agile imaging modes and sub-meter resolution. Its panchromatic resolution is 0.5 m and 1.68 m for multi-spectral images. Compared with the onboard stereo viewing instruments (0.8 m for forward image, 0.65 m for back image, and 2.6 m for back multi-spectrum images) of GF-7, a mapping satellite of China in the same period, their accuracy is very similar. However, the accuracy of GFDM DSM has not yet been verified or fully characterized, and the detailed difference between the two has not yet been assessed either. This paper evaluates the DSM accuracy generated by GFDM and GF-7 satellite imagery using high-precision reference DSM and the observations of Ground Control Points (GCPs) as the reference data. A method to evaluate the DSM accuracy based on regional DSM errors and GCPs errors is proposed. Through the analysis of DSM subtraction, profile lines, strips detection and residuals coupling differences, the differences of DSM overall accuracy, vertical accuracy, horizontal accuracy and the strips errors between GFDM DSM and GF-7 DSM are evaluated. The results show that the overall accuracy of both is close while the vertical accuracy is slightly different. When regional DSM is used as the benchmark, the GFDM DSM has a slight advantage in elevation accuracy, but there are some regular fluctuation strips with small amplitude. When GCPs are used as the reference, the elevation Root Mean Square Error (RMSE) of GFDM DSM is about 0.94 m, and that of GF-7 is 0.67 m. GF-7 DSM is more accurate, but both of the errors are within 1 m. The DSM image residuals of the GF-7 are within 0.5 pixel, while the residuals of GFDM are relatively large, reaching 0.8 pixel.
Full article
(This article belongs to the Topic High-Resolution Earth Observation Systems, Technologies, and Applications)
▼
Show Figures
Graphical abstract


