Remote Sens. 2021, 13(23), 4912; https://doi.org/10.3390/rs13234912 - 3 Dec 2021
Cited by 5 | Viewed by 3728
Abstract
►
Show Figures
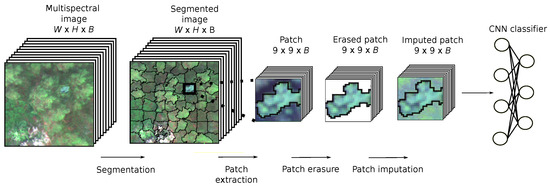
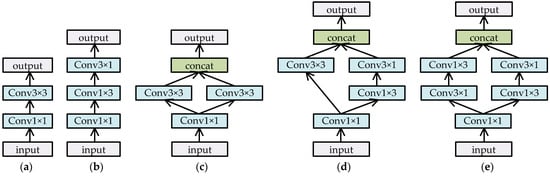
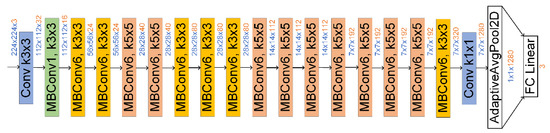
Hyperspectral Images (HSIs) have been utilized in many fields which contain spatial and spectral features of objects simultaneously. Hyperspectral image matching is a fundamental and critical problem in a wide range of HSI applications. Feature descriptors for grayscale image matching are well studied,
[...] Read more.
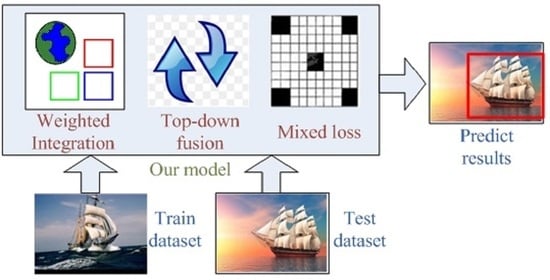
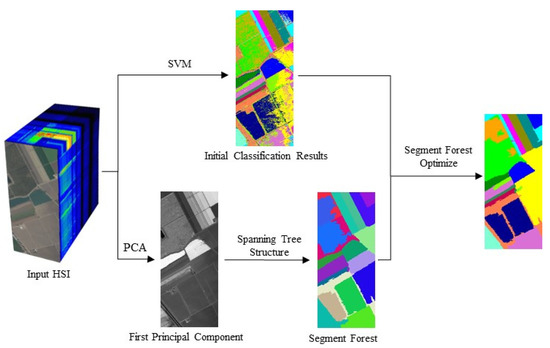
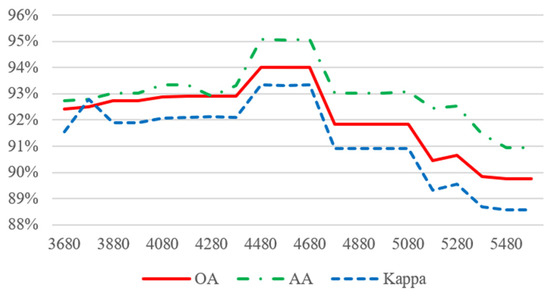
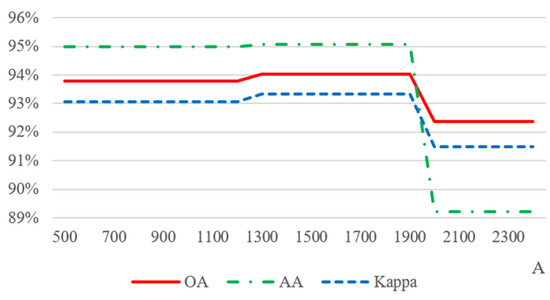
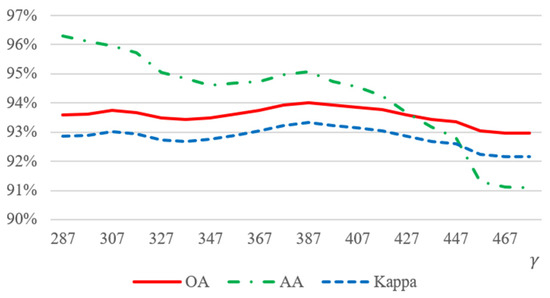
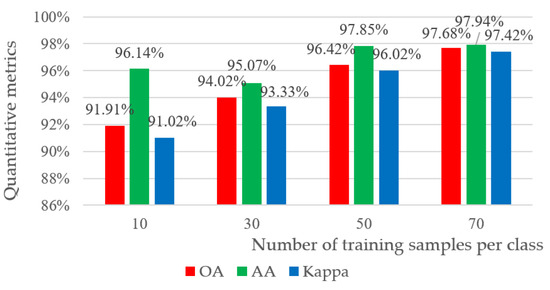
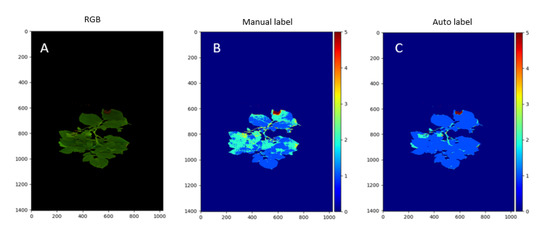
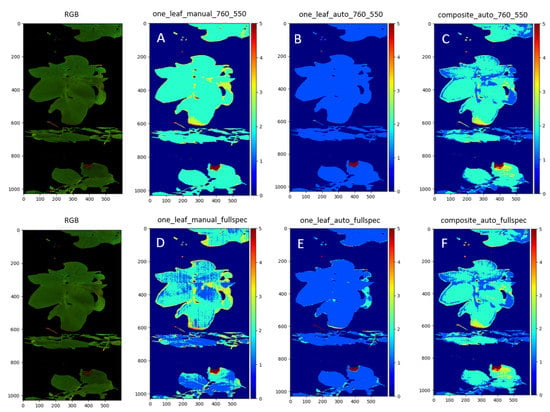
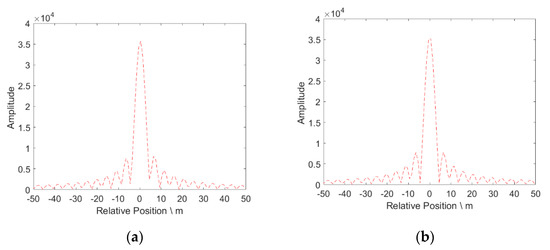
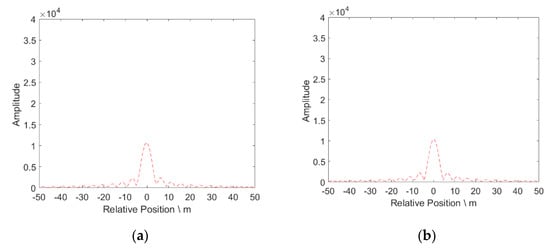
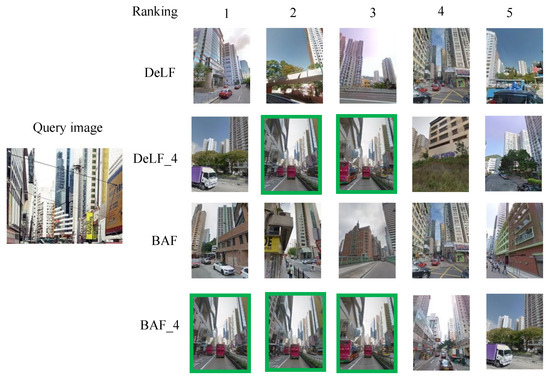
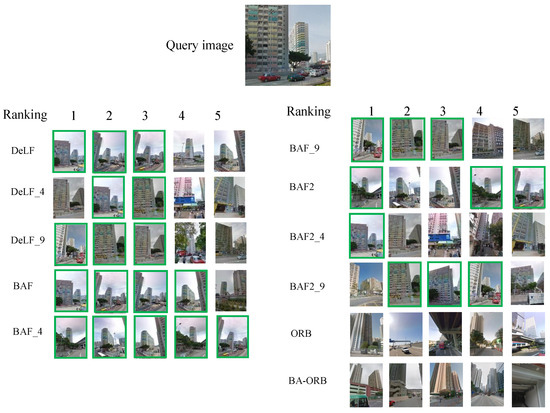
Hyperspectral Images (HSIs) have been utilized in many fields which contain spatial and spectral features of objects simultaneously. Hyperspectral image matching is a fundamental and critical problem in a wide range of HSI applications. Feature descriptors for grayscale image matching are well studied, but few descriptors are elaborately designed for HSI matching. HSI descriptors, which should have made good use of the spectral feature, are essential in HSI matching tasks. Therefore, this paper presents a descriptor for HSI matching, called HOSG-SIFT, which ensembles spectral features with spatial features of objects. First, we obtain the grayscale image by dimensional reduction from HSI and apply it to extract keypoints and descriptors of spatial features. Second, the descriptors of spectral features are designed based on the histogram of the spectral gradient (HOSG), which effectively preserves the physical significance of the spectral profile. Third, we concatenate the spatial descriptors and spectral descriptors with the same weights into a new descriptor and apply it for HSI matching. Experimental results demonstrate that the proposed HOSG-SIFT performs superior against traditional feature descriptors.
Full article

Graphical abstract

