Remote Sens. 2021, 13(23), 4819; https://doi.org/10.3390/rs13234819 - 27 Nov 2021
Cited by 11 | Viewed by 3863
Abstract
Timely and accurate information of cotton planting areas is essential for monitoring and managing cotton fields. However, there is no large-scale and high-resolution method suitable for mapping cotton fields, and the problems associated with low resolution and poor timeliness need to be solved.
[...] Read more.
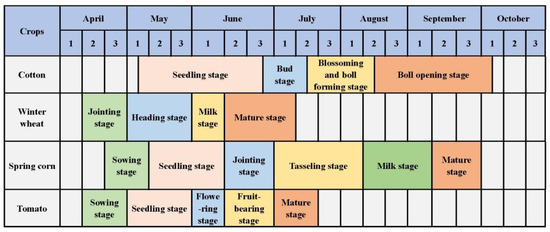
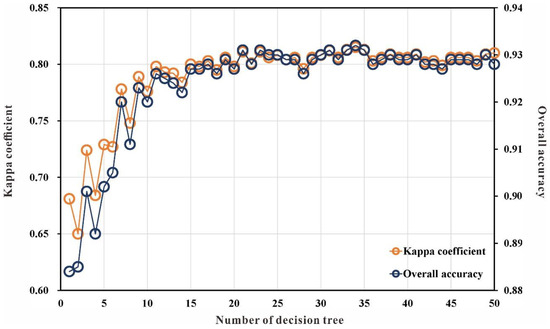
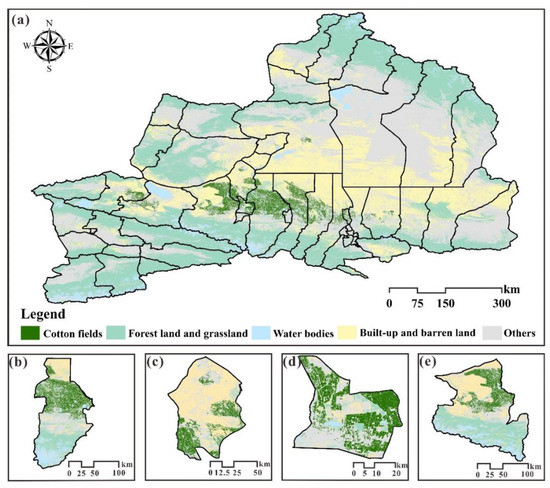
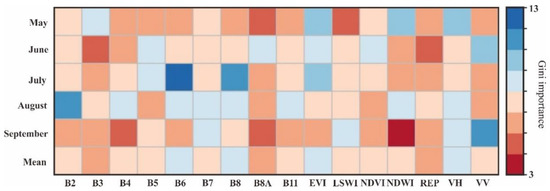
Timely and accurate information of cotton planting areas is essential for monitoring and managing cotton fields. However, there is no large-scale and high-resolution method suitable for mapping cotton fields, and the problems associated with low resolution and poor timeliness need to be solved. Here, we proposed a new framework for mapping cotton fields based on Sentinel-1/2 data for different phenological periods, random forest classifiers, and the multi-scale image segmentation method. A cotton field map for 2019 at a spatial resolution of 10 m was generated for northern Xinjiang, a dominant cotton planting region in China. The overall accuracy and kappa coefficient of the map were 0.932 and 0.813, respectively. The results showed that the boll opening stage was the best phenological phase for mapping cotton fields and the cotton fields was identified most accurately at the early boll opening stage, about 40 days before harvest. Additionally, Sentinel-1 and the red edge bands in Sentinel-2 are important for cotton field mapping, and there is great potential for the fusion of optical images and microwave images in crop mapping. This study provides an effective approach for high-resolution and high-accuracy cotton field mapping, which is vital for sustainable monitoring and management of cotton planting.
Full article
(This article belongs to the Special Issue Advances in Remote Sensing for Crop Monitoring and Yield Estimation)
►
Show Figures
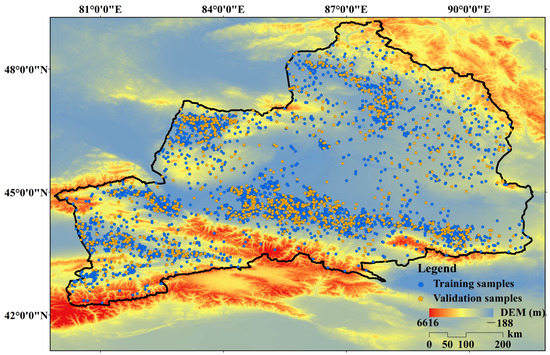
Figure 1


