Biomolecular EPR Meets NMR at High Magnetic Fields


1
Department of Physics, Free University Berlin, Arnimallee 14, D-14195 Berlin, Germany
2
Max Planck Institute for Chemical Energy Conversion, Stiftstr. 34-36, D-45470 Mülheim (Ruhr), Germany
3
Research School of Chemistry, The Australian National University, Canberra 2601, Australia
4
Faculty of Physics, Technical University Dortmund, Otto-Hahn-Str. 4a, D-44227 Dortmund, Germany
*
Authors to whom correspondence should be addressed.
Magnetochemistry 2018, 4(4), 50; https://doi.org/10.3390/magnetochemistry4040050
Submission received: 16 May 2018
/
Revised: 15 October 2018
/
Accepted: 17 October 2018
/
Published: 6 November 2018
(This article belongs to the Special Issue Electron Paramagnetic Resonance)
Abstract
:In this review on advanced biomolecular EPR spectroscopy, which addresses both the EPR and NMR communities, considerable emphasis is put on delineating the complementarity of NMR and EPR regarding the measurement of interactions and dynamics of large molecules embedded in fluid-solution or solid-state environments. Our focus is on the characterization of protein structure, dynamics and interactions, using sophisticated EPR spectroscopy methods. New developments in pulsed microwave and sweepable cryomagnet technology as well as ultrafast electronics for signal data handling and processing have pushed the limits of EPR spectroscopy to new horizons reaching millimeter and sub-millimeter wavelengths and 15 T Zeeman fields. Expanding traditional applications to paramagnetic systems, spin-labeling of biomolecules has become a mainstream multifrequency approach in EPR spectroscopy. In the high-frequency/high-field EPR region, sub-micromolar concentrations of nitroxide spin-labeled molecules are now sufficient to characterize reaction intermediates of complex biomolecular processes. This offers promising analytical applications in biochemistry and molecular biology where sample material is often difficult to prepare in sufficient concentration for NMR characterization. For multifrequency EPR experiments on frozen solutions typical sample volumes are of the order of 250 μL (S-band), 150 μL (X-band), 10 μL (Q-band) and 1 μL (W-band). These are orders of magnitude smaller than the sample volumes required for modern liquid- or solid-state NMR spectroscopy. An important additional advantage of EPR over NMR is the ability to detect and characterize even short-lived paramagnetic reaction intermediates (down to a lifetime of a few ns). Electron–nuclear and electron–electron double-resonance techniques such as electron–nuclear double resonance (ENDOR), ELDOR-detected NMR, PELDOR (DEER) further improve the spectroscopic selectivity for the various magnetic interactions and their evolution in the frequency and time domains. PELDOR techniques applied to frozen-solution samples of doubly spin-labeled proteins allow for molecular distance measurements ranging up to about 100 Å. For disordered frozen-solution samples high-field EPR spectroscopy allows greatly improved orientational selection of the molecules within the laboratory axes reference system by means of the anisotropic electron Zeeman interaction. Single-crystal resolution is approached at the canonical g-tensor orientations—even for molecules with very small g-anisotropies. Unique structural, functional, and dynamic information about molecular systems is thus revealed that can hardly be obtained by other analytical techniques. On the other hand, the limitation to systems with unpaired electrons means that EPR is less widely used than NMR. However, this limitation also means that EPR offers greater specificity, since ordinary chemical solvents and matrices do not give rise to EPR in contrast to NMR spectra. Thus, multifrequency EPR spectroscopy plays an important role in better understanding paramagnetic species such as organic and inorganic radicals, transition metal complexes as found in many catalysts or metalloenzymes, transient species such as light-generated spin-correlated radical pairs and triplets occurring in protein complexes of photosynthetic reaction centers, electron-transfer relays, etc. Special attention is drawn to high-field EPR experiments on photosynthetic reaction centers embedded in specific sugar matrices that enable organisms to survive extreme dryness and heat stress by adopting an anhydrobiotic state. After a more general overview on methods and applications of advanced multifrequency EPR spectroscopy, a few representative examples are reviewed to some detail in two Case Studies: (I) High-field ELDOR-detected NMR (EDNMR) as a general method for electron–nuclear hyperfine spectroscopy of nitroxide radical and transition metal containing systems; (II) High-field ENDOR and EDNMR studies of the Oxygen Evolving Complex (OEC) in Photosystem II, which performs water oxidation in photosynthesis, i.e., the light-driven splitting of water into its elemental constituents, which is one of the most important chemical reactions on Earth.
Table of Contents:
1. Introduction
2. NMR versus EPR Spectroscopy at High Magnetic Fields
3. High-Field EPR Instrumentation
4. Advanced Multifrequency EPR Techniques, a Brief Chronological Account
4.1. CW TREPR
4.2. Pulse EPR
4.3. ENDOR
4.3.1. Solid-State ENDOR
4.3.2. Solution ENDOR and TRIPLE Resonance
4.3.3. Pulse ENDOR
4.4. ESEEM
4.5. HYSCORE
4.6. ELDOR-Detected NMR (EDNMR)
4.7. PELDOR (DEER)
4.8. Terahertz High-Field EPR Spectroscopy
5. Site-Directed Spin Labelling (SDSL) in High-Field EPR Spectroscopy
5.1. Overview of Studies on Nitroxide Spin-Labelled Proteins and DNA Complexes
5.2. EPR Triangulation
5.3. An Illustrative Example: High-Field EPR on Nitroxide Spin-Labelled Bacteriorhodopsin
6. Selected Topics of Current High-Field EPR Spectroscopy on Biosystems
6.1. Extending the Distance Range between Molecular Spin Centers by High-Field Dipolar EPR with Gd3+ Spin Probes
6.2. Exploring by Ultrahigh-Field EPR the Molecular Basis of Radiation Resistance of Certain Bacterial Cells Containing Small High-Symmetry Antioxidant Complexes of Manganous Ions
6.3. The Effect of Protein-Solvent Interactions for Biological Function and the Survival of Organisms under Extreme Stress Situations of Heat and Dryness
6.4. Structure and Function of Transition Metal Conters in Metalloproteins
7. Case Study I: High-Field ELDOR-Detected NMR (EDNMR) as a General Method for Electron–Nuclear Hyperfine Spectroscopy with an Application on Nitroxide Radical and Transition Metal Containing Systems
7.1. Introduction
7.2. Nitrogen EDNMR on Nitroxide Radicals in Organic Solvents
7.3. EDNMR on Nitroxide Labelled Bacterial Reaction Centers Embedded in a Trehalose Glass
7.4. EDNMR on Transition Metal Containing Systems
7.5. Conclusion
8. Case Study II: High-Field ENDOR and EDNMR Studies of the Oxygen Evolving Complex (OEC) in PS II
8.1. Introduction
8.2. Structure of Photosystem II, Primary Events and the Water Oxidation Cycle
8.3. Electronic Structure of the OEC
8.4. Substrate Binding to the OEC
8.5. Conclusion and Future Challenges in Biological Water Oxidation
9. Conclusions
1. Introduction
This review on advanced biomolecular EPR spectroscopy addresses both the EPR and NMR communities. It is based on our 2013 overview article in Progress in Nuclear Magnetic Resonance Spectroscopy [1]. Here, we summarize the essentials of this review and include new contributions to high-field/high-frequency EPR published in recent years. We emphasize the complementarity of modern developments of NMR and EPR methodology when measuring the molecular interactions in large (bio)molecules. Concerning the title of the present review, Biomolecular EPR meets NMR at high magnetic fields, we are convinced that it correctly reflects the current growth of literature on high-field EPR in all its facets, such as transient EPR (TREPR), electron–nuclear double resonance (ENDOR), hyperfine sublevel correlation spectroscopy (HYSCORE), electron spin-echo envelope modulation (ESEEM), electron–electron double resonance (ELDOR), and ELDOR-detected NMR (EDNMR). In time-resolved EPR, parallel to the cw (continuous wave) method TREPR, also pulse EPR is being used with electron spin-echo detection (ESE-detected EPR, short-hand notation ESE-EPR), i.e., by recording the spin echo decay when varying the characteristic interpulse time separation [2].
In general, review articles published in Progress in NMR Spectroscopy are invited treatments of topics of current interest. In that segment of the magnetic resonance community that is involved in determining structures and dynamics of complex biomolecules, the barrier between the two cultures, NMR and EPR, seems to be gradually diminishing. The key ingredient of this evolution is the development of electron–nuclear double resonance techniques, such as dynamic nuclear-electron polarization (DNP), which is becoming an essential tool in the NMR discipline, addressing its main limitation, namely detection sensitivity.
The year 2016 marked the 50th anniversary of the first issue of Progress in Nuclear Magnetic Resonance Spectroscopy [3]. One should mention, however, that in the first 50 volumes of Progress only very few dedicated EPR spectroscopists appeared in the list of authors [4]. This disparity seems to be slowly changing.
In 2010, Jack Freed and his coworkers reported in this journal on the structural dynamics of bio-macromolecules and the slowly relaxing local structure approach, an approach that is equally powerful for both NMR and EPR spectroscopy [5]. And Gunnar Jeschke extended this treatment in 2013 [6] by discussing in detail the dynamic processes that can potentially affect the results of dipolar EPR spectroscopy of site-specifically spin-labeled macromolecules in the solid state as a result of internal dynamics of spin labels and their static conformational distributions. In 2012, Thomas Prisner and coworkers reported in Progress on DNP at high magnetic fields in liquids [7]. The authors nicely demonstrated to what extent DNP-driven signal enhancement techniques can profit from specific experiences gained separately in NMR and EPR spectroscopies. And in 2013, Klaus Möbius and coworkers discussed in Progress high-field/high-frequency EPR experiments on membrane proteins thereby crossing the gap between EPR and NMR [1]. In 2014, Andrew Webb reviewed cavity- and waveguide-resonator constructions in EPR, NMR and MRI applications [8]. In the same year, 2014, Konstantin Ivanov and coworkers [9] discussed in their review in Progress the role of level anti-crossings in nuclear spin hyperpolarization, a phenomenon based on the interaction between nuclear and electron spins and related to Chemically Induced Dynamic Nuclear Polarization (CIDNP). Nuclear spin hyperpolarization is an important resource for increasing the sensitivity of NMR spectroscopy and MRI. Signal enhancements can be as large as 3 to 4 orders of magnitude. The authors review the recent literature on polarization transfer mechanisms, in particular focusing on the role of Level Anti-Crossings (LACs) therein. Such “spontaneous” polarization transfer may occur both at low and high magnetic fields. At high magnetic field, polarization may be transferred by cross-relaxation effects. In addition, transfer of spin polarization can be accomplished by using specifically designed pulse sequences. Another promising high-field technique is to generate the strong-coupling condition by spin locking using strong radio-frequency B1 fields, carefully chosing their strength and frequency [9]. And finally, in 2017 Dieter Suter and Fedor Jelezko reviewed in Progress the exciting work on single-spin magnetic resonance, a recent EPR variant, in the nitrogen-vacancy center of diamond [10].
In public awareness, including that of the general sciences, NMR still ranks far ahead of EPR [4], and this will continue to be so. This observation seems to hold also for the members of the Nobel Committees for Physics, Chemistry, Physiology or Medicine. A brief historical account of the Nobel Prize laureates shows the common track of their decision making, leading from fundamental discoveries to exciting further developments and applications. NMR doubtlessly fits the rules: Otto Stern, USA: 1943 Nobel Prize in Physics, “for his contribution to the development of molecular ray method and his discovery of the magnetic moment of the proton”; Isidor I. Rabi, USA: 1944 Nobel Prize in Physics, “for his resonance method for recording the magnetic properties of atomic nuclei”; Felix Bloch, USA and Edward M. Purcell, USA: 1952 Nobel Prize in Physics, “for their discovery of new methods for nuclear magnetic precision measurements and discoveries in connection therewith”; Richard R. Ernst, Switzerland: 1991 Nobel Prize in Chemistry, “for his contributions to the development of the methodology of high resolution nuclear magnetic resonance spectroscopy”; Kurt Wüthrich, Switzerland: 2002 Nobel Prize in Chemistry, “for his development of nuclear magnetic resonance spectroscopy for determining the three-dimensional structure of biological macromolecules in solution”; Paul C. Lauterbur, USA, and Peter Mansfield, UK: 2003 Nobel Prize in Physiology or Medicine, “for their discoveries concerning magnetic resonance imaging (MRI)”.
Actually, no Nobel Prize was ever bestowed upon an EPR pioneer, despite the numerous nominations that have been made. This does not imply that in the magnetic resonance community recognition is being denied to EPR spectroscopy. On the contrary, in the last decade or so, one can observe a gradual move to a more balanced sentiment, although the fan club of NMR remains larger than that of EPR by orders of magnitude.
According to Web of Science, the annual distributions of NMR and EPR publications is characterized by phases of stagnation at a certain level of instrumental capabilities followed by phases of strong growth reflecting active research periods towards novel methodologies. Both in NMR and EPR a drastic increase of research publications correlates with technological breakthroughs in fast radiofrequeny and microwave pulsing schemes, in detection and data handling instrumentation—as well as in the development of technology and commercial fabrication of high- and ultrahigh-field cryomagnets. And both in NMR and EPR, when combining high-field spectroscopy with selective isotope labeling of the sample, such a strategy led to particularly impressive examples of novel perceptions in structural biology and chemistry.
Typically, such technological breakthroughs were first recognized—and taken advantage of—in dedicated academic laboratories with a tradition in EPR instrumentation development, be it in Europe, USA and Japan, see references in [1]. The limits of EPR spectroscopy were pushed to new horizons including multifrequency Fourier-transform multidimensional EPR techniques. This led to a strong increase of high-calibre EPR applications in basic and applied sciences, especially noticeable in the last 20 years for the subset of high-field EPR spectroscopy.
Furthermore, we attribute this observation to the fact that commercial mm and sub-mm EPR spectrometers of high performance became available (e.g., Bruker BioSpin, Rheinstetten, Germany, 94 GHz, 263 GHz), ready for routine applications. The commercialization of scientific instrumentation is a necessary step to make a technique available to and popular in a wide scientific community. This statement specifically applies to high-field EPR. The high-field EPR community is no longer limited to a relatively small number of physicists and physical chemists in research laboratories able to construct, maintain and operate such complex spectrometers. In a feedback loop, this creates the scientific background for an improved public funding of research activities, notably in the areas of biological systems and material sciences attracting a growing number of excellent students and postdocs to work in dedicated high-field EPR laboratories.
The strong connections between NMR and EPR become particularly visible when dealing with paramagnetic metal ions with total electron spin S ≠ 0 in proteins and other biosystems [11,12,13,14,15,16]. By applying sophisticated pulse techniques and data handling methods, it has become possible to obtain structural and mechanistic information by means of NMR on paramagnetic molecules that cannot be obtained otherwise. Paramagnetic reporter groups such as nitroxide spin labels or chelated lanthanide ions can almost deliberately be introduced into a diamagnetic molecule to provide additional structural and mechanistic information. Among the leading figures in the field of NMR of paramagnetic metal ions in proteins, we acknowledge Ivano Bertini (1940–2012) and his coworkers at the University of Florence [16] where, in 1999, he founded the Magnetic Resonance Center (CERM), hosting an impressive ensemble of NMR scientists and spectrometers, for details, see [17]. In 2017, Ivano Bertini’s long-time colleague Claudio Luchinat has published, together with coworkers from the University of Florence, the book NMR of Paramagnetic Molecules. Applications to Metallobiomolecules and Models [18].
We point out that the review article on paramagnetic resonance of biological metal centers by Marcellus Ubbink et al. [13] is particularly instructive in terms of chances and limitations of NMR and EPR when applied to biological metal centers. The first half of this review deals with high-frequency NMR of paramagnetic proteins, the second half with high-frequency/high-field EPR focusing on copper, iron, and manganese proteins.
The inherent limitation of EPR spectroscopy to paramagnetic systems appears to no longer prohibit applications on diamagnetic molecules: Over recent decades, methods for site-specific tagging of proteins and oligonucleotides with paramagnetic reporter groups have been developed with the aim of studying otherwise diamagnetic systems by dipolar EPR techniques [1]. Most often, such paramagnetic tags include nitroxide radicals or metal chelators. Site-directed double spin labeling with nitroxides has rapidly become a mainstream EPR approach [19]—as are tags suitable for site-specific and rigid attachment of lanthanide ions to bio-macromolecules [20,21,22]. Both the chemical synthesis of suitable spin labels and the molecular engineering of site-specific mutants to introduce the labels into the protein, form the basis for high-precision determination of distances and orientations of molecular subdomains by dipolar EPR techniques. They are discussed at length in numerous overview articles and specialized books, several of them are listed in [1], and will be touched upon here only in passing. We draw attention to the textbook-like treatise on high-field EPR spectroscopy in research and applications, published in 2011: Multifrequency Electron Paramagnetic Resonance, Theory and Applications, edited by S.K. Misra [23]. Its 26 chapters are written by leading scientists in the field containing both introductory chapters for the beginners and specialized chapters for additional reading.
2. NMR versus EPR Spectroscopy at High Magnetic Fields
Modern high-frequency/high-field EPR is booming nowadays, similar to what happened to NMR 15 years ago. The reasons for EPR’s expansion are found in the remarkable technological breakthroughs in microwave technology up to the THz region (500–1000 GHz), sweepable cryomagnet fabrication up to 15 T, and ultra-fast instrumentation for data acquisition and handling. The difference in the technical requirements for pulsed NMR and pulsed EPR and the disparate approaches for fulfilling them is rooted in the different timescales of the NMR and EPR resonance phenomena, which, in turn, are a consequence of the vastly different masses and magnetic moments of nuclei and electrons (for protons mp/me ≈ 1840; μe/μp ≈ 660), see Table 1.
In essence, the characteristic frequency separations in the NMR and EPR spectra are (Hz versus MHz), and the relaxation times T1 and T2 are (ms versus ns). Hence, NMR radiofrequency pulses need not be shorter than 10 µs, which does not pose any technical problems to generate and detect coherently. The transverse electronic T2 relaxation times, however, are typically in the range of a few ns. Hence, EPR microwave pulses have to be as short as a few ns. To generate and detect them coherently poses great technical problems even today. The technical obstacles to solve in constructing high-field/high-frequency EPR spectrometers in relation to NMR spectrometers can probably be best understood from Table 1 with the characteristic parameters of NMR and EPR. The existing limitations of microwave and sweepable cryomagnet technology prevented the EPR community for many years from simply copying the approved concepts and high-field strategy of modern NMR spectroscopy.
While nowadays pulse NMR has completely replaced cw NMR, the cw versus pulse competition is still widely open in EPR. Probably, cw and pulse EPR will continue to coexist. Which option to choose is entirely determined by the sample to be studied; its relaxation times ultimately dictate the preference for either a cw or pulse experiment.
Electron–nuclear double resonance (ENDOR) and other multiple resonance techniques such as ELDOR (electron–electron double resonance, PELDOR (pulse ELDOR or DEER) or EDNMR (ELDOR-detected NMR) have currently become very popular in the NMR and EPR communities. There are at least four important features emerging from EPR and NMR spectra when increasing the Zeeman field:
- (1)
- enhanced spectral resolution,
- (2)
- enhanced orientational selectivity in disordered samples,
- (3)
- enhanced detection sensitivity for restricted-volume samples,
- (4)
- enhanced “snapshot” sensitivity for probing fast motional dynamics.
Regarding those features some additional remarks may be appropriate:
Ad (1): The strategy for spectral resolution enhancement is similar in EPR and NMR: with increasing external Zeeman fields the field-dependent spin interactions in the spin Hamiltonian are separated from the field-independent ones. In high-field EPR, the g-factor resolution is increased in relation to the hyperfine couplings, in high-field NMR the chemical-shift resolution is increased in relation to the spin-spin couplings.
The information content of EPR spectra is governed by the static spin Hamiltonian, , consisting of three terms (for S = 1/2 systems and nuclei with I = 1/2): the field-dependent electron and nuclear Zeeman interactions and the field-independent electron–nuclear hyperfine interactions
(h: Planck constant; μB, μK: Bohr and nuclear magnetons; gn: nuclear g-factors; Ŝ, Î: electron and nuclear spin vector operators; the summation is over all nuclei).
The interaction tensors and probe the electronic structure (wave function) of the molecule either globally (g tensor) or locally (hyperfine tensors). They contain isotropic and anisotropic contributions, and in isotropic fluid solution only the scalar values, 1/3·Tr() and 1/3·Tr(), are observed.
In frozen solutions, powders or single crystals anisotropic tensor contributions also become observable. For nuclei with I ≥ 1, a quadrupole term has to be added to the spin Hamiltonian and corresponding energy eigenvalues. In the principal-axes system of the quadrupole tensor, they are determined by: Qzz = e2·qzz·Q/2I(2I − 1) and η = (qxx − qyy)/qzz. Here, e2·qzz·Q/h is the quadrupole coupling constant in frequency units and η is the asymmetry parameter; Q is the quadrupole moment of the nucleus and eqii are the principal values of the electric field gradient tensor.
Ad (2): In frozen solution samples, standard EPR suffers from low spectral resolution due to strong inhomogeneous line broadening. Such problems arise, for instance, because several radical species or different magnetic sites of rather similar g-values are present or the small g-tensor anisotropy of the paramagnetic system does not allow canonical orientations of the powder EPR spectrum to be observed. For all cases of delocalized spin systems, in which unresolved hyperfine interactions dominate the inhomogeneous EPR linewidth, a “true” high-field experiment has to fulfill the condition
i.e., the anisotropic electron Zeeman interaction, described by the difference Δg of principal g-tensor components, must exceed the inhomogeneous EPR linewidth ΔB. Alternatively, in certain cases ΔB can be reduced by isotope labeling, e.g., by perdeuteration of the nitroxide spin-label and/or 14N to 15N substitution, so that Equation (2) can be fulfilled already at moderate Zeeman fields. The reduction of ΔB by isotope labeling may be even the only way to enhance the spectral resolution when field-dependent g-strain effects become the linewidth-determining parameter at higher Zeeman fields.
The enhanced orientational selectivity of high-field EPR in disordered samples is illustrated in Figure 1. This feature becomes essential for randomly oriented spin systems with a small g-anisotropy and lacking any large hyperfine anisotropy; organic radicals in frozen solutions or biological cofactors in photosynthetic reaction center proteins are typical examples. Below room temperature, the overall rotation of a protein complex becomes so slow that powder-type EPR spectra (Pake patterns that are familiar to solid-state NMR spectroscopists) are obtained from which the canonical orientations of the dominating interaction tensor can be determined.
As a consequence of magneto-selection of tensor orientations, by means of a double-resonance experiment such as ENDOR, EDNMR or PELDOR, single-crystal-like information about spin interactions can be extracted by adjusting the magnetic field value to resonance positions of g-factor resolved spectral features of the powder pattern. Similar arguments hold for dipolar electron–electron spin interactions in radical pairs when studied by orientation-resolving high-field PELDOR. In the case of transition-metal complexes the large hyperfine anisotropy of the metal ion may provide this orientation selectivity for the entire orientational distribution of the molecules. Often, their g-anisotropy is large enough to allow for distinct orientational selectivity even in standard X-band EPR (in a Zeeman field of only 0.3 T) allowing for single-crystal-like ENDOR spectra [24,25,26,27].
Ad (3): Regarding the enhanced detection sensitivity of high-field EPR for restricted-volume samples, this advantage has become one of the most important issues in modern magnetic resonance spectroscopy to boost the notoriously poor NMR sensitivity. Owing to the thousandfold higher resonance frequency in EPR than in NMR, principally the detection sensitivity of EPR is higher by a factor of 106. This factor can hardly be compensated for by the sophisticated methods of spin polarization transfer due to electron–nuclear interactions employed in modern NMR spectroscopy, among them DNP enhanced NMR. This principal sensitivity advantage of EPR is even more accentuated when going from standard X-band EPR to high-field EPR operating, for example, in the mm and sub-mm frequency domains. Minute quantities of samples (μM versus mM concentrations [28,29]) have become sufficient to characterize stable and short-lived transient reaction intermediates of complex molecular systems—offering very interesting applications for biochemists and molecular biologists [1].
Ad (4): Both NMR and EPR have established themselves not only as powerful tools for determining structures but also as equally suitable methods for measuring reaction rates, for example the rates of interconversion between two molecular states A and B. This can be achieved by using the anisotropies of spin-spin interactions as probes and measure the temperature dependence of the progress in averaging of these anisotropies. The anisotropy of the magnetic interactions gives rise of different spectra for differently oriented molecules. But for molecules tumbling rapidly in fluid solution or sufficiently “soft” matrices, these anisotropies average out so that the peaks for a given molecular position are sharp and appear at an average position, rather than showing a broad envelope, a “Pake pattern”, spanning a wide frequency range for molecules in many different orientations. Thus, the time scale, be it the “NMR time scale” or the “EPR time scale” for dynamic processes averaging two resonance peaks in a spectrum, is the reciprocal of the difference in frequency of the peaks. Thus, the interconversion between A and B is fast on the NMR time scale if it occurs at a rate much greater than the difference in frequency between A and B in the NMR spectrum taken at a specific Zeeman field. Going to higher Zeeman fields allows one to study faster molecular dynamics [30]. This holds also for EPR, and switching from NMR to EPR shortens the snapshot window by six orders of magnitude! A multitude of studies on molecular dynamics employing anisotropic magnetic interactions of nuclear and/or electron spins has been reviewed in [1] where also the respective references are given.
In view of molecular distance measurements between two spin entities in solid-state samples, we emphasize the complementarity of EPR and NMR methods. We compare the range of distances in which anisotropic spin-spin interactions are not averaged out as in fluid samples (see Table 2). In solid-state NMR, typical short-range interproton distances derived from NOE’s have a cut-off limit of ≤5 Å. This provides a very useful range of distance restraints in many proteins. There are instances, however, in which short-range distance restraints do not lead to a unique molecular structure model, and long-range distance information extending over 15–25 Å would be desirable. In such a situation, NMR spectroscopists often resort to paramagnetic relaxation effects affecting the NMR spectra in a targeted way. In general, this involves introducing a paramagnetic relaxer as spin label at an appropriate site in the molecule [15]. Such spin labeling strategy is familiar also in EPR spectroscopy. Due to its large magnetic moment, μe, the unpaired electron is a much more sensitive probe for the location of a second spin, be it a nuclear or another electronic spin. Hence, the distance range, covered by anisotropic (dipolar) spin interactions accessible to dipolar EPR spectroscopy, covers distances from single bond lengths of about 1 Å up to transmembrane or even inter-domain distances of about 100 Å (10 nm) or even larger [17,30,31,32,33,34,35,36,37,38,39,40].
3. High-Field EPR Instrumentation
In the following section, we give a brief overview of the participating groups in the international contest for building multifrequency EPR spectrometers with higher and higher frequency-field ratios. Historical and technical details can be found, for instance, in [17].
It was in 1971 when Ya.S. Lebedev from the Institute of Chemical Physics in Moscow became the first EPR spectroscopist to start a long-term research and development project with the aim to realize a high-frequency/high-field EPR spectrometer with high sensitivity, resolution, stability and flexibility for broad applications in physics, chemistry and biology [41,42,43]. A concept of a 140 GHz EPR instrument was developed operating with a cryomagnet of 4.5 T maximum field. In the following years, several prototypes of the spectrometer were constructed. Different microwave sources including klystrons, backward-wave oszillators (BWO), diffraction generators and solid-state oscillators were tested. Single-mode resonators, oversized cavities and Fabry–Perot resonators, as well as non-resonant probeheads were tested together with different signal detectors. In 1979, the first working version of the 140 GHz cw EPR spectrometer was finished reaching a detection sensitivity of 4 × 10⁸ spins/mT at 1 Hz bandwidth. This was about three orders of magnitude higher than typical for X-band EPR spectrometers at that time.
Inspired by the new opportunities that high-field EPR offered, several research groups in the world started with developing their own EPR spectrometers tailored to their specific research objects. Here, we only give a few examples: In Europe, the Berlin [44,45] and Leiden [46,47] EPR groups first focused on the construction of sensitive W-band (95 GHz) EPR and on the extension of W-band EPR spectrometers to ENDOR capabilities. Cw ENDOR was realized in Berlin in 1988 [48]. The first pulsed EPR experiments at W-band were performed in Leiden in 1989 [46]. Pulsed 95 GHz ENDOR (and specialized W-band EPR/ENDOR cavities) were independently and almost simultaneously developed in 1993/1994 in both laboratories [49,50]. Pioneering work on pulsed high-field EPR at 140 GHz was done in the group of R.G. Griffin at MIT in Cambridge, USA in the late 1980s/early 1990s [51]. High-field/high-frequency EPR spectrometer development was given a major boost by the research groups of T.F. Prisner at the University of Frankfurt/Main [52,53] and G.M. Smith at St Andrews University [54]. In the US, the research group of J.H. Freed at Cornell University was the first to push EPR instrumentation to far-infrared technology, and pioneered the use of quasi-optical mw techniques in EPR. Details of their 250 GHz EPR spectrometer were published in 1988 [55]. One year later, the Möbius group at FU-Berlin published the construction details of a sub-mm high-field/high-frequency heterodyne induction-mode EPR spectrometer operating at 360 GHz [56]. In the same year the group of L.-C. Brunel at the Grenoble High-Magnetic-Field Laboratory realized an EPR system operating up to 525 GHz and magnetic fields up to 20 T [57]. In 2007, a 122 GHz/244 GHz high-field cw EPR spectrometer equipped with a 12 T magnet was described [58] that was home-built mainly by E. Reijerse in the MPI group of W. Lubitz in Mülheim/Ruhr. It could be operated also in pulse mode.
Tremendous additional efforts—both in terms of quasioptical theoretical design and experimental realization—were necessary in the Möbius group in Berlin to extend 360 GHz EPR to ENDOR, see [17] for a summary. Several prototypes of probeheads had to be be developed specifically for quasioptical EPR and ENDOR measurements at 360 GHz [59,60]. The probeheads are based on a plane-concave Fabry–Perot resonator operated in the TEM006 mode. With a resonant mirror distance d = 2.58 mm and curvature radius R = 8.06 mm one obtains a confocal distance of 3.76 mm. A typical value for the finesse of the resonator with sample is F = 160, resulting in a loaded quality factor QL = 800. Coupling to the tapered end of the corrugated waveguide is achieved through the flat mirror of the Fabry–Perot resonator, which is a highly reflective electro-formed copper mesh (typically 30 wires/mm). Tuning is achieved by translating the spherical mirror of the Fabry–Perot resonator via a micrometer screw outside the magnet. The field modulation coils surround the spherical mirror. The modulation amplitudes can be raised up to 3 mT without generating excessive microphonics. A quartz fiber integrated into the probehead allows for photo-generation of radicals or triplet states inside the resonator by laser excitation. The overall detection sensitivity of the spectrometer equipped with the Fabry–Perot resonator has been measured to be 1.5 × 10¹⁰ spins/mT at 1 Hz detection bandwidth. More details are given in [56,59,60,61,62,63].
In an alternative probehead configuration without resonator the copper mesh is removed, which reduces the spectrometer sensitivity by a factor of 40. To compensate for the decreased sensitivity, the amount of sample has to be increased by the same factor. However, since the combination of low-noise mw components, the induction-mode detection scheme and the high Zeeman B0 field provides an excellent overall detection sensitivity, an increase of the necessary amount of sample from 0.5 μL (typical for an organic radical in a 0.1 mM sample with resonator) to 20 μL (without resonator) is manageable in most realistic cases. Additional reading is recommended on quasi-optical mm and sub-mm EPR spectroscopy [52,54].
In terms of biological applications, we refer to examples of our 360 GHz EPR studies on Flavin radicals such as DNA photolyasis [64,65,66,67]. Or on the primary donor chlorophyll radical cations in photosynthetic reaction centers [17,56,68,69,70,71,72].
By now, the list of laboratory-built high-field/high-frequency EPR spectrometers has become rather long, and we recommend to consult the textbook [17] for references of the original publications.
Below, we have summarized the key aspects of instrumental development in form of Table 3.
In terms of instrumental development beyond currently available commercial high-field EPR spectrometers (see, www.bruker.com) the research group of G. Smith at the University of St Andrews conducts an ambitious project called “HIPER” (funded under the UK Basic Technology program). The group has designed a unique high-power quasioptical W-band (94 GHz, 1 kW) pulse EPR machine [28,29] featuring π/2 pulses as short as 5 ns and a detection bandwidth of 1 GHz in nonresonant sample holders operating in induction mode and at low temperatures. Low-power microwave pulses can be as short as 200 ps, and kilowatt pulses as short as 1.5 ns with timing resolution of a few hundred ps. The EPR machine is being used already in a variety of applications, others are in progress, many based on DEER/PELDOR pulse sequences. Phase cycling is being incorporated that permits multi-dimensional, multi-resonance experiments including two-dimensional EPR, ENDOR, ELDOR, and ESEEM. The HIPER spectrometer will be integrated with a state-of-the-art ultra-fast pulse laser facility (see, www.st-andrews.ac.uk/~mmwave/). The St Andrews group has demonstrated that the combination of high-power pulses at high frequencies and nonresonant cavities can offer excellent concentration sensitivity for orientation selective pulsed electron–electron double resonance allowing for measurements at a concentration level of 1 μM.
In the USA, there is a strong representation of high-field EPR spectroscopy with about a dozen research groups throughout the country. Particularly renowned are the large-scale advanced EPR facilities with regular workshops for the training of graduate students, postdoctoral fellows, and visitors. Prominent examples are: ACERT, the “National Biomedical Center for Advanced Electron Spin Resonance Technology” at Cornell University in Ithaca, NY (see, www.acert.cornell.edu/), the “National Biomedical Electron Paramagnetic Resonance Center” at the Medical College of Wisconsin in Milwaukee, WI (see, www.mcw.edu/EPR-Center.htm) and the “National High Magnetic Field Laboratory” in Tallahassee, FL (see, www.nationalmaglab.org/user-facilities).
In Japan, high-field EPR research is traditionally devoted to physics with the focus on novel magnetic materials and high-field EPR instrument developments. Particularly prominent are the research activities of the “Molecular Photoscience Research Center” at Kobe University (see, www.research.kobe-u.ac.jp/mprc/) in solid-state physics under extreme conditions, such as high magnetic fields up to 55 T using pulsed magnets, low temperatures down to 1.8 K using pumped liquid helium and high pressure up to 10 kbar. Also, in the chemical and biological sciences as well as in material sciences for quantum computers, a growing interest is noticeable in Japan. For example, T. Takui and coworkers at Osaka City University (see, www.qcqis.sci.osaka-cu.ac.jp/) focus their advanced EPR research on molecular spin science and organic molecule-based magnetics to develop novel open-shell molecular systems and magnetic molecular assemblages.
Among the numerous large-scale National Centers for ultrahigh-field NMR facilities around the world, we list only a few examples of such facilities that are scientifically strong but have not been mentioned here so far:
- -
- Centre Européen de Résonance Magnétique Nucléaire in Lyon, France (CRMN—CNRS/École Normale Supérieure Lyon/Université Claude Bernard Lyon). This is a large-scale European facility for ultrahigh-field NMR operated by the CNRS (Centre National de la Recherche Scientifique). Since 2009 an NMR spectrometer is working there at a proton frequency of 1 GHz. By acquiring this new NMR tool, the facility offers unique analytical capacity to the international scientific community. Dozens of national and international research projects have been running so far; they involve researchers from throughout the world. In 2015, BRUKER Corp. had announced that a 1.2 GHz (28.2 T) NMR instrument has been ordered by the CNRS to be placed at the University of Lille (France). The acquisition of this 1.2 GHz spectrometer will keep France at the leading edge of NMR technology. This national instrument will be installed in Lille for a broad panel of interdisciplinary research areas ranging from structural biology to catalysis, from sustainable energy development to bio-medical applications. It will be available to the international scientific community for cooperation projects.
- -
- The Danish Center for Ultrahigh-Field NMR Spectroscopy (localized at the Department of Chemistry, Aarhus University) hosts a number of state-of-the-art NMR spectrometers operating at a multitude of frequencies up to 950 MHz and equipped for solid- and liquid-state NMR experiments of inorganic, organic, and biological molecules. All equipment is available for Danish and external users through cooperation projects with the Danish Center.
- -
- CERM (Centro di Ricerca di Risonanze Magnetiche) is a center for research, knowledge transfer, and higher education of the University of Florence, located at the Polo Scientifico (Scientific Campus) in Sesto Fiorentino. CERM applies nuclear magnetic resonance (NMR) to fundamental questions in the Life Sciences. The collection of instrumentation at CERM is among the most advanced in the world. NMR Instruments include magnets from 400 MHz to 950 MHz, many equipped with unique probes for disparate experimental needs. The Consorzio Interuniversitario Risonanze Magnetiche di Metallo Proteine (CIRMMP) provides access to equipment at a national and European level.
- -
- The National Ultrahigh-Field NMR Facility for Solids (Ottawa, Canada, managed by the University of Ottawa) is a national scientific user facility funded by the Canada Foundation for Innovation (CFI). The equipment consists of a Bruker 900 MHz NMR spectrometer with ancillary equipment to acquire ultrahigh field static and fast spinning NMR spectra of solid materials. The uniqueness of the Facility is that it is dedicated to solid-state NMR research, where the highest magnetic fields are beneficial for quadrupolar and low-gamma nuclei such as oxygen-17, magnesium-25, and chlorine-35 among others. This type of instrument is not available elsewhere in Canada.
- -
- The Netherlands facility for ultrahigh NMR spectroscopy (uNMR-NL, managed by the University of Utrecht). Distributed over four sites (Utrecht University, Leiden University, Wageningen University, Radboud University Nijmegen), the uNMR-NL facility offers expertise and measurement time on spectrometers currently ranging from 600–950 MHz for solid- and liquid-state NMR as well as micro-imaging. The four major Dutch centers for magnetic resonance research in structural biology (Utrecht), paramagnetic bio-NMR and instrumentation development (Leiden), new materials (Nijmegen) and micro-imaging for plant, food and bio-nanotechnology (Wageningen) had formed such a consortium for implementation of this national facility that aims at providing open access to a new generation of NMR instruments operating at highest existing field strength across scientific disciplines and industrial research. As an important step in this direction, the uNMR-NL consortium received funding in the The Netherlands Organisation for Scientific Research (NWO) National Roadmap for Research Infrastructures to accqire the first 1.2 GHz (28.2 T) NMR spectrometer in the Netherlands. The installation of the 1.2 GHz NMR system (BRUKER) is expected in 2019.
- -
- The Center for Biomolecular Magnetic Resonance (BMRZ) at the Goethe University in Frankfurt (M), Germany. BMRZ is part of the European Large Scale Facilities and incorporates various high-field liquid and solid-state NMR spectrometers, as well as DNP-NMR and advanced EPR instrumentation. The 1.2 GHz (28.2 T) NMR spectrometer (BRUKER), ordered in 2015, is expected to be soon available to the scientific community in Germany and Europe. Research at the BMRZ center is dedicated to the elucidation of structure and functional mechanisms of biomolecules ranging from RNA and RNA-protein complexes, via large protein complexes to membrane proteins. Former Managing Director of the BMRZ center, Professor Harald Schwalbe, Goethe University in Frankfurt (M), happily remarked in relation to the new generation of ultrahigh-field NMR spectrometers: “The 1.2 GHz NMR system will allow us to investigate structure, dynamics and biological function of increasingly large and challenging biomolecular complexes. We will also be able to provide access for European researchers”. In 2017, Harald Schwalbe wrote an illumination Guest Editorial in Angewandte Chemie with the title “New 1.2 GHz NMR Spectrometers—New Horizons?” in which he gives an expert account of the key steps in magnet science and technology developments that were necessary to ultimately enable fabrication of such a revolutionary NMR instrument [121]. From this article we quote the last paragraph:“NMR is not the only structural biology technique undergoing revolutionary changes. Findings triggered by the development of free-electron laser crystallography (XFEL) and by new detectors for cryo-EM single particle and tomography analyses are impressive. Germany reacted by providing funding for the European XFEL installation in Hamburg, including four 1.2 GHz NMR spectrometers and for several cryo-EM machines. These funding decisions came at the right moment. It is important to note that all of the initiatives in structural biology have a national as well as a European dimension. NMR centers in Florence, Utrecht and Frankfurt will provide access to the new 1.2 GHz spectrometers for researchers from all over the European Union. Given the current isolationist movements, it will always be important to link national and European, if not global research endeavors, for the benefit of fundamental and applied research alike.”
In the following we will briefly summarize the chronological account of frequently used advanced multifrequency EPR techniques.
4. Advanced Multifrequency EPR Techniques, a Brief Chronological Account
EPR and NMR phenomena were originally observed in radiofrequency spectroscopy experiments employing continuous wave electromagnetic fields, for EPR in 1944 by E.K. Zavoisky [122,123] at Kazan University in the USSR, and for NMR in 1946 by E.M. Purcell, H.G. Torrey and R.V. Pound [124] at Harvard and, independently, by F. Bloch, W. Hansen and M.E. Packard [125] at Stanford. Those classical NMR experiments were honored as early as 1952 by the Nobel Prize in Physics to Bloch and Purcell. Zavoisky’s seminal discovery of EPR, on the other hand, was not adequately recognized on the western side of the Iron Curtain.
On the eastern side, however, Zavoisky was officially honored several times; for example, he was awarded the 1957 Lenin Prize, the highest sign of recognition in the USSR for his discovery of EPR. And in 1970, the State Committee on Inventions and Discoveries enshrined “The Electron Paramagnetic Resonance Phenomenon” in the State Register of the USSR. It was only in 1977 that Zavoisky was finally internationally honored by the prestigious ISMAR Award of the International Society of Magnetic Resonance at the ISMAR Conference in Banff, Canada—alas, posthumously [126]. He had died on 9 October 1976 in Moscow, just after having been informed of the decision from the ISMAR Prize Committee.
Below we list some milestone developments of advanced EPR spectroscopy together with key references of their inventors. Among them are commonly used variations of pulse electron–nuclear hyperfine spectroscopy that became powerful stand-alone techniques with their own acrynoms such as Mims-ENDOR, Davies-ENDOR, ESEEM, HYSCORE, ELDOR-detected NMR (EDNMR), as well as pulsed electron–electron dipolar spectroscopy, i.e., PELDOR (or DEER). These inventions were eleborated on quite extensively also in [1], where the references of the original publications are given.
In Figure 2 the EPR experiments on laser-pulse created radicals and radical pairs are summarized showing the microwave (mw) and radiofrequency (rf) irradiation schemes of a variety of cw and pulse high-field EPR techniques that are dealt with in this overview (for stable paramagnetic systems, the laser pulse is, of course, omitted). We point out that the challenge of modern molecular biology, biochemistry and biophysics is to understand the function of highly specialized proteins on the level of their molecular and electronic structure as well as their complex motional dynamics. We take the view that the arsenal of modern EPR techniques in general, and of high-field EPR in particular, provides powerful and versatile analytical tools for elucidating structure and dynamics of complex biosystems during their transient (or stable) states of action. The EPR-based information provides details of molecular structure and dynamics that is complementary to information obtained from other established biophysical techniques such as NMR spectroscopy and X-ray crystallography.
4.1. CW TREPR
We start this section by briefly discussing paramagnetic molecules with short lifetimes that have been generated in a spin-polarized, i.e., non-Boltzmann state, during a chemical reaction, for instance in the course of a photochemical process. To detect short-lived transient states and to study their mechanisms of spin polarization, specific time-resoved cw EPR strategies can be used (besides using pulsed EPR), provided the time response of the EPR spectrometer is fast enough. By employing a field modulation at a frequency as high as 1 MHz the time resolution can be extended to the µs range.
A decisive step towards much higher time resolution required for fast photoreactions has been done by abandoning field modulation altogether and rather generate a transient EPR signal via wavelength-selective pulsed laser excitation of an appropriate reactant. Subsequent “direct”, i.e., broadband detection of the transient EPR signal at a preset Zeeman field was accomplished by employing sufficiently fast data-acquisition systems. The Zeeman field is then stepped through the EPR resonance region establishing the time-resolved transient EPR technique known as “TREPR”. The pioneering experiments were carried out by S.I. Weissman and coworkers at Washington University in 1976 [127]. In TREPR, the inherent loss of sensitivity associated with broadband detection of transient paramagnetic states can be partly compensated by accumulating spectra after each light flash. This generally results in TREPR spectra of still rather poor signal-to-noise ratio. A signal enhancement of several orders of magnitude can, however, be often achieved by fast detection of transient electron-spin polarization effects occurring in many photo-reactions before spin-lattice relaxation leads to thermal equilibrium of spin-level populations. For overviews of such electron-spin polarization effects, see for example [128,129,130]. By now, the time resolution of TREPR has been pushed to the 10 ns range. TREPR has been proven to be an extremely powerful method in a wide range of microwave frequencies from S-band (4 GHz), X-band (9 GHz), K-band (24 GHz), Q-band (35 GHz) to high-field EPR frequencies such as 95 GHz, 120 GHz and 240 GHz [17,49,92,129,131,132,133,134].
4.2. Pulse EPR
While TREPR with broadband detection is still a cw technique with respect to the microwave irradiation, the next step forward for improving time resolution was pulsed EPR. It was as early as 1950 when E.L. Hahn [135] at Urbana invented the nuclear spin-echo detection. This invention, together with the introduction of Fourier-transform (FT) NMR by R.R. Ernst [136,137] opened the arena for pulse NMR spectroscopy. It went hand in hand with powerful computers becoming commercially available for doing fast Fourier transformation on-line with primary data acquisition. This marked the birth of FTNMR in the late 1970s, with its potential for recording multi-dimensional NMR spectra of complex biosystems in liquid and solid states. And, of course, for applications in medical magnetic resonance imaging (MRI). But it took almost another decade before R.J. Blume at Columbia [138] observed, for the first time, electron spin echoes analogous to Hahn’s nuclear spin echoes. And it took many more years before electron spin echo-detected EPR (ESE) methodologies gained sufficient experimental and theoretical momentum to revolutionize EPR spectroscopy in a way similar to what had happened in NMR spectroscopy decades earlier. To cope with the ultrafast pulsing and data handling requirements of pulsed EPR, the signals are detected either by two-pulse echoes (using a pulse sequence π/2−τ−π−τ−echo with nominal flip angles π/2 and π to generate a primary echo) or by three-pulse echoes (using flip angles π/2, π/2 and π/2 in a stimulated echo sequence π/2−τ−π/2−T−π/2−τ−echo [2,139]. Also Free Induction Decay (FID) detection is possible, see [2].
Pulse EPR spectroscopy has many pioneers, both from the theoretical and experimental side. In the early 1970s, K.M. Salikhov in Novosibirsk [140] laid the theoretical foundations for several advanced pulsed EPR methods. For example, he developed the theory of electron spin phase relaxation by stochastic modulation of dipole-dipole interactions between paramagnetic centers and its effect on the ESE decay [141]. He suggested the first pulse ELDOR (PELDOR) protocol to observe the modulation of the ESE signal due to electron–electron dipolar interactions in weakly coupled biradical systems in disordered solids [142]. The analogous NMR double-resonance experiment to measure distances between dipolar-coupled nuclei has been described by M. Emshwiller, E.L. Hahn and D. Kaplan as early as 1960 [143]. Some years later, Salikhov theoretically predicted new phenomena, such as quantum beats of the EPR line intensity [144] and out-of-phase spin echos of correlated radical pairs [145].
According to Salikhov’s predictions these non-equilibrium spin phenomena should be observable in time-resolved EPR spectra of transient spin-polarized radical-pair intermediates provided the EPR detection is sufficiently fast for non-Boltzmann spin systems. And, indeed, they were experimentally verified in several laboratories shortly after they had been predicted (for a review of the early experiments, see [129]). A rich variety of microwave pulse sequences and sophisticated experimental setups is found in more recent reviews and text books, for example those of A. Schweiger and G. Jeschke [2], K. Möbius and A. Savitsky [17] and the very recent book edited by D. Goldfarb and S. Stoll [146]. They refer to the pioneering work by W.B. Mims at Bell Telephone Laboratories, J.H. Freed at Cornell, Yu.D. Tsvetkov in Novosibirsk, A. Schweiger at ETH Zurich and G. Jeschke in Mainz, among many others. At high magnetic fields and frequencies, novel pulsed EPR, ENDOR and PELDOR/DEER experiments were performed, for example, in the groups of J. Schmidt at Leiden University, K. Möbius at FU Berlin, D. Goldfarb at the Weizmann Institute, T. Prisner at Frankfurt University, and G. Smith at St Andrews University (for the specific references, see [17]).
4.3. ENDOR
Thorough accounts of multifrequency ENDOR, and its extension to electron–nuclear-nuclear TRIPLE resonance spectroscopy, were published recently, and are recommended for further reading [69,147,148]. Several conceptually different types of ENDOR spectroscopy have to be distinguished exhibiting specific strengths and weaknesses (for details, see [1] where both the original references and recent developments are quoted).
4.3.1. Solid-State ENDOR
It was a milestone in the history of magnetic resonance spectroscopy when, in 1956, George Feher [149,150] at Bell Labs performed a game-changing “EPR meets NMR” experiment for which he coined the name ENDOR standing for “electron–nuclear double resonance”. Historical background information with references about the origin of the acronym ENDOR can be found, for instance, in [1]. For samples with many different electron–nuclear hyperfine couplings Feher’s ENDOR experiment made those spin couplings that normally stay unresolved under an inhomogeneously broadened EPR line to appear well resolved—very much like in an NMR spectrum of the same sample. His ingenious concept was to apply simultaneously two electromagnetic radiation fields, one in the microwave, the other in the radiofrequency range, to drive both EPR transitions (ΔmS = ±1) and NMR transitions (ΔmIi = ±1) in the spin system hyperfine-coupled with neighboring (“local”) nuclei. The driven spin transitions have a hyperfine energy level (mS, mI) in common. Thereby, the advantages of EPR (high detection sensitivity) are combined with those of NMR (high resolution), see details in [1]. ENDOR is inherently a variant of NMR for paramagnetic systems, the unpaired electron serving as highly sensitive detector for the NMR transitions ΔmIi = ±1. Each group of equivalent nuclei—no matter how many nuclei are involved and regardless of the value of their individual spin—contributes only two ENDOR lines to the spectrum (assuming no nuclear quadrupole interactions). For a particular group of equivalent nuclei, they appear at
(nuclear Larmor frequency νn = gn·μK·B0/h, the hyperfine coupling parameter A contains isotropic and anisotropic contributions of the hyperfine tensor . ENDOR signals are observed by monitoring changes of EPR line intensities when sweeping the rf field through the nuclear resonance frequencies. In isotropic solution, the hyperfine couplings) are given by Aiso = 1/3 Tr(), termed the “Fermi contact” interaction parameters.
The resolution enhancement becomes particularly drastic when nuclei with different magnetic moments are involved. Their ENDOR lines appear in different frequency ranges and, provided their Larmor frequencies are separated at the chosen Zeeman field B0, the different nuclei can be immediately identified. In the case of an accidental overlap of ENDOR lines from different nuclei at X-band (9.5 GHz and 0.34 T) the lines can be separated at higher Zeeman fields and microwave frequencies, for instance at 3.4 T and 95 GHz [48] or even at 12.9 T and 360 GHz [60]. The disentangling of ENDOR lines at different fields is depicted in Figure 3. In biological molecules with several magnetic nuclei other than protons, the separation of accidentally overlapping ENDOR lines is extremely helpful for analyzing complex spin systems by means of their nuclear Zeeman and hyperfine interactions.
4.3.2. Solution ENDOR and TRIPLE Resonance
The conditions for successful cw ENDOR are more stringent than for pulse ENDOR irradiation schemes [2,151,152,153]; roughly speaking, the nuclear and electron spin-lattice relaxation rates, Wn and We, have to be made equal in a specific matrix at a specific temperature. Feher’s first cw ENDOR experiment [150] was technically feasible only because the sample—phosphorus doped silicon—was kept at a low temperature, where all spin relaxation times are sufficiently long to easily enable saturation of both EPR and NMR transitions. This is the necessary condition for cw ENDOR so that the EPR microwave transitions are saturated. At NMR resonance, the applied rf field desaturates those transitions; this is observed as an ENDOR spectrum in form of changes of the EPR signal intensity when sweeping the frequency of the rf field applied through the NMR resonance region.
In contrast to solid-state ENDOR on paramagnets at low temperatures, for radicals in liquid solution, the electronic and nuclear relaxation times are much shorter—in the order of 10−5 to 10−7 s. Consequently, solution ENDOR experiments in the cw mode are technically much more demanding since much stronger saturating microwave and rf fields have to be applied. This is probably the reason why liquid-state ENDOR experiments needed many more years than solid-state ENDOR experiments to become successful (high-power cw ENDOR often suffers from rf pick-up problems distorting or even ruining the detected ENDOR signals).
Generally, magnetic resonance experiments carried out in liquid solution are designed to do away with the anisotropic interactions that broaden the spectral lines. On the other hand, the electron–nuclear dipolar hyperfine interaction provides valuable information on the electronic structure of the radical under study and, moreover, is an important analytical tool for the unambiguous assignment of the ENDOR lines. With this in mind, it is best to study single crystals to accurately measure the g- and hyperfine-anisotropies. Often, however, single crystal of proteins, especially membrane proteins, are difficult to grow, and frozen-solution samples have to be used instead—with the inherent drawbacks of line broadening and loss of spectral resolution. This was the motivation behind the long and strenuous efforts to develop liquid-phase ENDOR methodology. ENDOR on radicals in liquid solution directly yields the isotropic hyperfine coupling constants Aiso of various nuclei with I > 0, thereby providing “fingerprint” information of the radical’s electronic structure [154], for informative references, see for instance [1,154,155].
The pioneering work for cw ENDOR-in-solution was performed in 1963 by A.L. Cederquist at Washington University [156], who studied metal ammonia solutions, and by J.S. Hyde and A.H. Maki at Varian Associates and Harvard, respectively, in 1964 [157], who studied a stable organic radical dissolved in n-heptane solution. In the 1970s, further development of ENDOR spectroscopy in solution was greatly stimulated by J.H. Freed and his coworkers at Cornell, whose general theory of saturation and double-resonance from the late 1960s proved to be very appropriate for describing the amplitude, width, and shape of ENDOR lines in great detail [151]. This theory was an essential guideline for the development of high-power solution ENDOR and TRIPLE resonance instrumentation in the mid 1970’s to early 1980’s by K. Möbius and his group at Free University Berlin [152,158].
Admittedly, ENDOR has also weaknesses in comparison to EPR concerning detection sensitivity (typically 1–2 orders of magnitude lower) and relative line intensities (they do not simply reflect the number of contributing nuclei). These weaknesses, however, can be overcome to a good part by extending ENDOR to electron–nuclear-nuclear triple resonance. For the special case where there is only one set of hyperfine-coupled nuclei, such a triple resonance extension was proposed early on by G. Feher [159] and J.H. Freed [160]. Its experimental realization, however, had to wait until 1974 when K.P. Dinse in the Möbius group at Free University Berlin accomplished “Special TRIPLE” on radicals in liquid solution [161]. In cw Special TRIPLE the two frequency-swept rf fields are applied at frequencies symmetrically placed on either side of the Larmor frequency of the respective nuclei. This variant of triple resonance enhances the signal intensity and allows one to relate line intensities to the number of responsible nuclei. Thereby, the assignment of ENDOR lines to molecular positions is made possible, which is a vital task, but notoriously difficult in ENDOR spectroscopy [154,162].
About a year later, it was demonstrated by R. Biehl in the same group at FU Berlin [163], that additional information about relative signs of hyperfine couplings of radicals in solution—and thereby about their assignment—can be obtained by generalizing the triple resonance experiment to include NMR transitions of different nuclei in the radical (“General TRIPLE”). In cw General TRIPLE, two rf fields with independently variable frequencies are applied, one pumping a selected NMR transition while the other is swept through the ENDOR spectrum. From the resulting characteristic intensity changes in the ENDOR spectrum, the relative signs of the hyperfine couplings can be directly read out. The analogue of this experiment for solid-state samples at low temperature (77 K) was performed earlier by R.J. Cook and D.H. Whiffen (1964) at Teddington National Physical Laboratory [164]. They called it “double ENDOR”, and applied it to X-irradiated organic crystals to determine relative signs of hyperfine couplings.
The advantages of TRIPLE over ENDOR—enhanced sensitivity and resolution, information about multiplicity and relative signs of hyperfine couplings from line intensity variations—often justify the additional experimental effort inherent to triple resonance spectroscopy. This technique turned out to be extremely powerful in elucidating the electronic structures of organic radicals in solution [154] and transient cofactor radical ion intermediates in the reaction center protein complex of primary photosynthesis [165,166,167,168]. For a detailed discussion of the thorny way of liquid-phase ENDOR to non-proton nuclei, see [152,153,154] where also the original references are given [151,152,153,155,169,170,171,172,173,174,175,176]. With this knowledge at hand the critical balance of electronic and nuclear relaxation rates combined with sufficiently fast induced transition rates of the electron and nuclear spins could be managed and powerful spectrometers for ENDOR in solution were developed [151,152,155,175,176].
On the basis of Jack Freed’s relaxation theory for radicals in fluid solution [171,172,173,174], Martin Plato, Wolfgang Lubitz and coworkers in the Möbius group [152,153,177,178,179] carried out a systematic investigation of the ENDOR sensitivity of various heteronuclei, i.e., nuclei other than protons, in organic radicals. Optimum ENDOR conditions, such as temperature and viscosity of the solvent, mw and rf field strengths, were formulated by employing the rigorous density matrix formalism as a function of a few nuclear and molecular properties [153]. They include relaxation from fluctuating spin–rotation interaction, electron–nuclear dipolar and nuclear quadrupolar couplings and Heisenberg spin exchange. The most important molecular parameter turned out to be the magnitude of the anisotropy of electron–nuclear dipolar interaction. The theoretical results were found to be in good agreement with experimental observations on 2H, 13C, 14/15N, 19F, 31P and alkali nuclei in different molecular systems, thus allowing predictions to be made on the ENDOR detectability of other chemically or biologically interesting nuclei, such as 10/11B, 17O, 27Al, 29Si, 33S and 35/37Cl. In the meantime, most of these nuclei have indeed been detected by ENDOR in solution [167,180].
The flourishing ENDOR-in-solution subfield of EPR spectroscopy has been intensively covered by review articles, for example [180,181,182,183,184] and dedicated books, for example [17,154,155,162], which devote several chapters to this issue. Including an acid test of the ENDOR-in-solution technique for resolving complex hyperfine structures in protein complexes: the radical cation of the primary donor , the “special pair” of bacteriochlorophylls (BChl) in photosynthetic electron transfer in the Reaction Center (RC) of the purple bacteria Rhodobacter (Rb.) sphaeroides and Rhodospirillum rubrum [185,186,187]. The essential points of these ENDOR experiments are thoroughly reviewed in [1].
The single-crystal ENDOR and TRIPLE work on Rb. sphaeroides RCs at physiological temperatures, that were performed independently by three groups, G. Feher at UC San Diego, W. Lubitz at TU Berlin, K. Möbius at FU Berlin, but ultimately published jointly [188], represents a culmination of two decades of EPR work on the primary donor in bacterial RCs as started in [189]. For the first time it was possible to assign ENDOR lines unambiguously to the individual dimer halves of the primary donor “special pair”. This work on the electronic structure of the primary donor formed the basis for a large number of further studies on this species, see for example [133,190,191,192,193,194,195,196], leading to a deeper understanding of the role of the dimer in biological electron transfer [133,197,198]. Subsequently, similar ENDOR studies were performed on the primary donors, and , in the reaction centers of oxygenic photosynthesis, PS I and PS II [199,200,201,202].
DNP-enhanced NMR spectroscopy [203] continues to be used to elucidate the molecular origins of the unidirectional electron transfer after illumination of RCs from Rb. sphaeroides. Stimulated by theoretical studies [204] on the crucial role of the substituents of the “special-pair” donor, J. Matysik and coworkers used Photo-CIDNP MAS NMR to demonstrate, via the chemical-shift pattern of the special pair, that the peripheral atoms indeed show opposite electronic effects on both sides of the special pair [205,206], thereby confirming the ENDOR results on the primary donor radical cation.
4.3.3. Pulse ENDOR
We have seen that cw ENDOR requires a delicate balance of saturation and desaturation of electron and nuclear sublevels at a particular working temperature, the optimum is reached when electron and nuclear relaxation rates, We and Wn, become equal [151]. For specific samples and liquid solvents this is sometimes difficult to achieve due to unfavorable electron and nuclear relaxation times. In such a situation freezing the sample might be necessary and switching to pulse ENDOR techniques could be an advantage over cw ENDOR. But even pulse ENDOR can be impeded by too short T2 relaxation times while the T1 times can generally be adjusted by lowering the temperature. Hence, the sample properties dictate whether cw or pulse ENDOR is the preferable method. As a rule, for organic radicals and transition metal complexes in liquid solution around room temperature, pulse ENDOR is not feasible in most cases, because the relaxation processes are too fast, and cw ENDOR is the method of choice.
Actually, all ENDOR detection techniques (cw and pulse) are sensitive to the nuclear and electron spin relaxation rates. And we note that even pulse ENDOR techniques require the nuclear T1T2 product to be sufficiently long to coherently rotate the nuclear magnetization by the rf pulses used for detection of changes of electron spin signals via intensity changes of electron-spin echoes (ESE) [2]. We quote from the famed 2001 book “Principles of Pulse Electron Paramagnetic Resonance” by A. Schweiger and G. Jeschke [2]:
“In most practical situations, cw ENDOR is the method of choice for the measurement of small hyperfine couplings in liquid solution, whereas in solids pulse ENDOR is often superior.”
The more recent publications on pulse EPR (ESE-EPR) spectroscopy in all its variations are just too many to be referenced here. Hence, we refrain from even trying to cover them adequately. We rather escape to a few of the current key players in pulse EPR, ENDOR, ESEEM, HYSCORE, EDNMR and PELDOR spectroscopy on (bio)molecules and give only references to some examples of their recent work, specifically since 2015. And we ask the many other scientists in the field for their tolerance when their precious work is not adequately mentioned here.
As reference groups we have somewhat arbitrarily chosen those of Marina Bennati (Göttingen) [209,210,211], Robert Bittl (Berlin) [212,213,214], Dave Britt (UC Davis) [215,216,217], Jack Freed (Cornell) [218,219,220], Daniella Goldfarb (Weizmann) [221,222,223], Brian Hoffman (Northwestern) [224,225,226], Gunnar Jeschke (Zurich) [227,228,229], Chris Kay (London) [230,231], Yasuhiro Kobori (Kobe) [232,233,234], Wolfgang Lubitz (Mülheim/Ruhr) [235,236,237], Damian Murphy (Cardiff) [238,239,240], Thomas Prisner (Frankfurt/Main) [241,242,243], Christiane Timmel (Oxford) [244,245,246], Sabine van Doorslaer (Antwerp) [247,248,249], and Stefan Weber (Freiburg) [250,251,252].
For solid-state samples, ESE-detected pulse ENDOR versions were introduced by W.B. Mims (1965) at Bell Labs [253] and E.R. Davies (1974) at Clarendon [254]. Mims is acknowledged to have been the driving force in pulse EPR in general, and in pulse ENDOR in particular. Magnetic resonance experts called him the spiritus rector of pulse EPR [2]. In a pulse ENDOR experiment, mw pulses are used to generate an electron spin echo whose intensity is then recorded as a function of the pulsed rf frequency.
Pulse ENDOR spectroscopy offers several distinct advantages over the cw technique: The ENDOR effect can be as large as the electron spin echo intensity itself (while cw ENDOR reaches only about 1–10% of EPR signal intensity); pulse ENDOR requires no critical balance of rf power and relaxation times, pulse ENDOR is less susceptible to artifacts as there is neither an rf nor a mw field applied during the detection period; pulse ENDOR gives access to all relaxation times of a spin system (electron T1 and T2, nuclear T1 and T2, cross relaxation Tx). Therefore, pulse ENDOR has been the commonly used technique in many laboratories in recent decades, often applying pulse sequences developed by Mims [253] and Davies [254]. The two techniques are very similar to each other in their implementation (see Figure 2), but complementary in their results, specifically concerning experimental artifacts such as “blind spots” in the spectrum [255].
Mims-ENDOR is based on a stimulated ESE sequence, using two π/2 preparation mw pulses to invert the electron spin population, and a final π/2 mw pulse after the mixing period for stimulated echo signal detection. Between the preparation pulses and the final pulse, an rf π pulse is used to invert the nuclear spin population, resulting in polarization transfer between the nuclear and electron spin transitions in the mixing period. The echo intensity is subsequently measured as a function of the rf frequency to give the characteristic ENDOR spectrum. The Mims-ENDOR technique is most suited for weakly coupled nuclei, i.e., nuclei with small hyperfine coupling constants.
In Davies-ENDOR, a preparation mw π pulse is used in order to invert the magnetization of the electron spins in the applied static B0 field. During the subsequent mixing period an rf π pulse is applied, and only if the rf frequency is resonant with an NMR transition, magnetization will be transferred to the other mS electron spin manifold. During the following detection period, the z-component of the magnetization is measured using a mw two-pulse echo sequence, π/2, π, and one detects an inverted echo, i.e., essentially the EPR signal that is restored during the mixing period. The Davies-ENDOR technique is most suited to detect strongly coupled nuclei, i.e., nuclei with large hyperfine couplings.
Often pulse ENDOR techniques suffer from detectability problems at certain frequencies (“blind spots”). The important difference between hyperfine spectroscopy based either on the Mims- or Davies-ENDOR pulse sequences, when put into a nutshell, is that in Davies-ENDOR there are no blind spots. Blind spots are directly correlated to the size of the hyperfine interactions of the coupled nuclei. Hence, when using pulse ENDOR as a tool for structure determination, one has to make sure that no artifacts have occurred owing to the specific pulse strategy applied. They might mask certain hyperfine couplings and lead to a wrong interpretation of the spectra [255]. Powerful pulse strategies have been developed in various EPR laboratories to either avoid or overcome blind-spot artefacts, for references, see [2,256].
4.4. ESEEM
Besides ENDOR there is another type of EPR-based hyperfine spectroscopy that is widely used: electron spin echo envelope modulation (ESEEM). They have in common that both in ENDOR and ESEEM experiments the NMR transitions are monitored indirectly through EPR transitions (“quantum transformation”). The contrast between them is that while pulse ENDOR signals arise from the combined use of both mw and rf pulses which directly excite the EPR and the NMR transitions sequentially, in ESEEM only mw pulses are applied. The NMR transitions are indirectly observed due to spin-state mixing by dipolar hyperfine interaction resulting in semi-forbidden and allowed EPR transitions, respectively. Such transitions are coherently excited using short, intense mw pulses. The single-resonance ESEEM technique was introduced by W.B. Mims in 1972 [257]. He applied a mw spin-echo pulse train with varying inter-pulse separation and observed, on top of the exponential echo decay trace, echo amplitude modulations that are caused by hyperfine and quadrupole interactions. While ENDOR is a frequency-domain experiment, ESEEM is a time-domain experiment and subsequently requires fast-Fourier transformation of the primary time dependent data into the frequency regime.
Efficient mixing of the nuclear and electron spin eigenfunctions by the dipolar hyperfine interaction is mandatory to obtain detectable echo modulations. Consequently, the strength of the external magnetic field has to be properly chosen to approximately balance the Zeeman splitting of the nuclear sublevels and the respective hyperfine splittings (“cancellation condition” [258,259]). For protons, the cancellation condition is often met in X-band (9.5 GHz) EPR, depending on the magnitude of their hyperfine couplings, but not in W-band EPR (95 GHz) at high Zeeman fields.
The situation reverses, however, for nitrogen nuclei in W-band EPR. In some cases, also 14N hyperfine couplings have a favorable magnitude, which allows one to meet the cancellation condition even at X-band ESEEM [260,261,262]. First successful W-band high-field ESEEM measurements of 14N hyperfine and quadrupole interactions in disordered powder samples were performed at FU Berlin in 1998 [263]. Ten years later, this work was extended at FU Berlin by elaborate W-band ESEEM studies on nitroxide spin-label molecules to explore the respective sensitivity of the g-, hyperfine- and quadrupole-tensors for probing polarity and proticity effects of the solvent matrix [264].
4.5. HYSCORE
HYSCORE (hyperfine sublevel correlation spectroscopy) is a powerful technique for measuring electron–nuclear hyperfine couplings of complex molecular systems. It was introduced by P. Höfer, M. Mehring and coworkers [265] at the University of Stuttgart in 1986. It is based upon the COSY (correlation spectroscopy) NMR experiment. HYSCORE is essentially a 2D experiment that improves the spectral resolution by spreading overlapping resonance peaks over two dimensions thereby providing information which is difficult to reveal in an 1D ESEEM experiment. No wonder, therefore, that HYSCORE has become the standard experiment for the measurement of complex hyperfine and quadrupole spectra [2]; it produces comparable, often complimentary information to ENDOR.
In HYSCORE spin correlation is transferred from one electron spin manifold mS (e.g., mS = +1/2) to nuclear frequencies in the other mS manifold (mS = −1/2). In a HYSCORE experiment, the time between the second π/2 and π pulse is varied in one dimension and the time between the π and third π/2 pulse is varied in a second dimension. A two-dimensional Fourier transformation then gives the spectra, and illuminating examples are shown and discussed in [1].
Like any other ESEEM variant, HYSCORE is also best performed close to the exact cancellation condition [2]. Proton related ESEEM measurements are best performed at low mw frequencies (2–9 GHz) to decrease the Zeeman frequencies of nuclei and thereby facilitate the simultaneous excitation of forbidden and allowed EPR transitions, which is necessary for the generation of the ESEEM effect. During the last few years, however, it was demonstrated [263,264,266,267,268] that ESEEM spectroscopy can be performed routinely at Ku (12–18 GHz), Ka- and Q-band (26–35 GHz), and even W-band (95 GHz) frequencies, thus expanding considerably the range of multi-frequency ESEEM spectroscopy.
In 2008, for example, D. Goldfarb at the Weizmann Institute and her coworkers demonstrated that HYSCORE experiments carried out at 95 GHz make new ranges of hyperfine and nuclear quadrupole couplings accessible [269]. They observed nuclear modulation frequencies of 14N and 17O nuclei as high as 40 MHz. The correlations provided by the HYSCORE spectra are most important for signal assignment such as 14N quadrupolar couplings.
A HYSCORE-related new tool for the assignment of nuclear frequencies in pulsed EPR experiments was developed by D. Goldfarb, S. Van Doorslaer, A. Schweiger and their coworkers [270]. They termed it DONUT-HYSCORE (double nuclear coherence transfer hyperfine sublevel correlation). Its pulse scheme was designed to obtain correlations between nuclear frequencies belonging to the same electron spin manifold mS. DONUT-HYSCORE is thus complementary to the standard HYSCORE experiment, which generates correlations between nuclear frequencies belonging to different mS manifolds), and it is particularly useful for 14N nuclei, for example in copper(2+)-doped l-histidine hydrochloride monohydrate [270].
4.6. ELDOR-Detected NMR (EDNMR)
In the previous sections we have seen that there are several pulsed EPR techniques capable of probing nuclear transition frequencies of paramagnetic compounds, e.g., ESEEM-based techniques, as well as ENDOR-based techniques, able to unravel congested nuclear spectra. One of them has become very popular in recent years: pulsed ELDOR-detected NMR (EDNMR) [271]. The acronym ELDOR stands for electron–electron double resonance, i.e., two microwave fields are involved but no radiofrequency field. This is a typical second-order experiment and was introduced already in 1994 in the X-band frequency domain by A. Schweiger and his coworkers at ETH Zurich. It excels by its potential to determine hyperfine interactions in disordered systems.
In the original version of EDNMR (see Figure 4b), a strong and long selective preparation pulse of mw frequency ν2 excites “allowed” (ΔmS = 0; ΔmI = ±1) and “forbidden” transitions (ΔmS = ±1; ΔmI = ±1) simultaneously, thereby burning spectral holes into the EPR line. The positions of such holes, caused by the excitation of forbidden transitions, correspond to the nuclear transition frequencies of the spin system. A selective detection pulse of frequency ν1 creates an FID with an integrated intensity proportional to the magnetization at this frequency. The entire hole pattern is obtained by recording the integrated intensity of the FID while varying the frequency difference Δν = ν2 − ν1 step by step. More recent EDNMR experiments apply a Hahn-type primary echo pulse sequence for detection instead of using FID detection [272,273].
In [274], we included deliberations concerning the fundamental difference between coherence-transfer techniques (ESEEM) and polarization-transfer techniques (ENDOR, EDNMR) which will not be repeated here. In summary, the principal difference between ENDOR and EDNMR is the way in which the population of the nuclear levels is changed. In pulse ENDOR, the nuclear polarization is inverted by driving the allowed NMR transition (ΔmS = 0; ΔmI = ±1) with an rf π-pulse. In contrast, in EDNMR, the nuclear transitions of the spin manifold are probed indirectly by using a second strong and long mw pulse (also called high-turning-angle (HTA) pulse), which drives forbidden electron transitions (ΔmS = ±1; ΔmI = ±1), that is, transitions where both the electron and nuclear spin change their projection direction. Such “forbidden” transitions in the spin manifold become “weakly allowed” in the presence of an anisotropic hyperfine interaction or a nuclear quadrupole interaction. The EDNMR experiment can principally be performed at any microwave frequency band where the “forbidden” cross transitions are observed in EPR. EDNMR works best at Zeeman fields high enough to separate the NMR lines around the nuclear Larmor frequency from the hole burnt into the EPR spectrum of allowed transitions by the HTA-pulse. But the Zeeman fields must be small enough to keep the ratio of hyperfine and Zeeman interactions large enough to retain substantial second-order terms in the electron transition probabilities. Such conditions, which work in opposite direction, can often be fulfilled by high-field EDNMR at W-band [273,275,276,277,278]. Hence, this method has become very attractive for measuring nuclear frequencies for low-γ nuclei exhibiting broad ENDOR lines.
For the simple case of a 4-level scheme (S = 1/2, I = 1/2 with hyperfine interaction) Figure 4 depicts the different forms of pulse-driven polarization transfer in Davies-ENDOR (Figure 4a) and EDNMR (Figure 4b).
Compared with ENDOR, high-field EDNMR presents several advantages for the investigation of low-γ nuclei coupled to the electron spin. EDNMR is more robust than ENDOR against fast electron spin-lattice relaxation, T1, and spectral diffusion. Moreover, the recorded EDNMR spectrum is not distorted by blind spots around the nuclear Larmor frequencies, for examples, see [1,279].
The Goldfarb group has extended EDNMR to a correlation method, known under the acronym THYCOS (triple resonance hyperfine sublevel correlation spectroscopy) [275,278]. It combines ENDOR and EDNMR in a manner similar to the pulse TRIPLE method [280,281,282]. In the THYCOS pulse sequence the HTA microwave pulse, with frequency ν2, transfers populations across a forbidden EPR transition (ΔmS = ±1; ΔmI = ±1). This reduces the population difference between the corresponding allowed transition that is detected via an FID (or a spin echo) produced by a selective pulse (or an echo pulse sequence) with frequency ν1. The THYCOS experiment correlates lines in the EDNMR spectrum with lines in the ENDOR spectrum of nuclei belonging to different electron spin manifolds mS. This facilitates the assignment of nuclear resonance frequencies to their respective mS manifold, and, hence, gives the sign of the hyperfine coupling. The feasibility of this novel technique has been demonstrated using Cu2+-histidine complexes both in single-crystal and frozen-solution samples [275].
4.7. PELDOR (DEER)
In EPR spectroscopy on disordered systems most of its sub-disciplines, e.g., ENDOR and ELDOR techniques, show distinct virtues of spectral resolution at high magnetic fields in comparison to standard X-band spectroscopy with its much lower Zeeman fields [17,23]. It was recently demonstrated that in the case of pulsed ELDOR experiments (PELDOR, often called DEER), when performed at high Zeeman fields [283,284,285,286], not only the distance between paramagnetic centers with dipolarly coupled spins A and B can be measured but also unique information obtained concerning their relative orientation, i.e., their three-dimensional molecular structure. Measurements of distances between spin labels in large (bio)molecules by PELDOR methods with the scale of a few nm up to almost 10 nm have become very popular in the last few years; usually they are carried out at X-band EPR frequencies (for overviews, see for instance [33,37,287,288,289,290] and recent references given in Section 5.1).
Pulsed EPR methods exploiting the electron–electron dipolar interaction between two spin centers have been used in the past to yield spatial distributions in solids, and quite a number of ingenious pulse sequences have been developed to overcome specific difficulties and deficiencies inherent in the various approaches. Several methods of practical importance have emerged and, although their acronyms are often not too informative about their task specificity, they all are based on modifying the local dipolar field seen by one electron spin when manipulating a dipole-dipole coupled second electron spin—thereby modulating the spin-echo intensity. Hence, the common generic name is Pulsed Dipolar EPR Spectroscopy. The electron dipolar echo modulation is produced by a 2- or 3-pulse sequence with a microwave pulse at either the same frequency [291] or at a different frequency [292,293,294,295]. It is the different-frequency variant, using selective microwave pulses, which became the most popular one under the names PELDOR or DEER. Like many other inventions in pulse EPR, it originates from NMR analogues, here from a concept in solid-state NMR invented by Erwin Hahn and coworkers in Berkeley back in 1960 [143].
The electron–electron dipolar coupling between two spin-carrying domains is a function of their interspin distance and relative orientation. The main advantage of pulse versus cw EPR techniques in this endeavor is the ability to separate the electron–electron coupling from other interactions, such as electron–nuclear hyperfine interactions, and to reduce inhomogeneous line broadening. Thereby, the distance range that can be probed is extended to about 8 nm and more. Yu.D. Tsvetkov and his coworkers in Novosibirsk [142,296] established the 3-pulse PELDOR methodology in 1981. Later it was extended to a 4-pulse sequence for dead-time free detection [2,297]. Other powerful pulse sequences for measuring electron–electron frequencies and, thereby, distances have been invented, for example the single-frequency 6-pulse techniques DQC (double-quantum-coherence) by J.H. Freed and coworkers at Cornell [298] and RIDME (relaxation-induced dipolar modulation enhancement) by L. Kulik and coworkers in Novosibirsk [299]. The DQC and PELDOR/DEER methodologies have proven to be most useful for a wide range of applications in structural biology providing detailed information on large disordered systems at atomic resolution and accuracy. This level of accuracy can hardly be reached for disordered systems by any other technique in structural biology. Nowadays, PELDOR techniques applied to frozen-solution samples of doubly spin-labeled proteins allow for measurements of molecular distances ranging up to about 100 Å (10 nm).
Finally, coming back to high-field PELDOR, we give an historical account: In 2006/2007 pulsed electron dipolar spectroscopy at high Zeeman field was introduced with the aim to resolve the relative orientation of weakly coupled radical-pair partners in frozen-solution samples—in addition to measuring their distance. The necessary extension of the established PELDOR technique at X-band frequency to higher microwave frequencies was accomplished independently by the groups of T.F. Prisner (Frankfurt) [284,300,301] at 180 GHz, K. Möbius (Berlin/Mülheim) at 95 GHz [285], and G. Jeschke (Konstanz/Zurich) [286] at 95 GHz at about the same time.
4.8. Terahertz High-Field EPR Spectroscopy
A spectacular instrumental development of pulse high-frequency/high-field EPR spectroscopy has been achieved at the Helmholtz-Center Berlin for Materials and Energy by A. Schnegg, K. Holldack and their colleagues in 2009 and 2016 [116,117,302] which is based on the coherent synchrotron radiation (CSR) provided by the BESSY II storage ring at Berlin-Adlershof. Frequency domain Fourier transform THz EPR (FD-FT THz-EPR) is presented [116] as a novel tool to ascertain very large zero-field splittings in transition metal ion complexes. The BESSY II storage ring provides CSR in a frequency range from 5 cm−1 up to 40 cm−1 at external magnetic fields ranging from −10 T to +10 T. First measurements were reported on the single-molecule magnet Mn12Ac where the ∆MS = ±1 spin transition energies were studied as a function of the external magnetic field and temperature.
Briefly, the instrument features the following characteristics [302]: The THz beamline at BESSY II employs high power broadband femto- to picosecond long THz pulses for magneto-optical THz and FIR studies. A newly designed set-up exploits the unique properties of ultrashort THz pulses generated by laser-energy modulation of electron bunches in the storage ring or alternatively from compressed electron bunches. Experiments from 0.15 to 5 THz (≈5–150 cm−1) may be conducted at a user station of the Helmholtz facility equipped with a fully evacuated high resolution FTIR spectrometer (0.0063 cm−1), liquid-He cooled bolometer detectors, a THz time-domain-spectroscopy (TDS) set-up and different sample environments, including a superconducting high-field magnet (+11 T–−11 T) with variable temperature sample cryostat (1.5–300 K), and a THz attenuated total reflection chamber. Main applications are Frequency Domain Fourier transform THz-EPR (FD-FT THz-EPR), THz-FTIR spectroscopy and optical pump—THz probe time domain spectroscopy, with sub-ps time resolution.
Free electron lasers (FEL) produce powerful narrowband radiation in the THz range. Very recently an EPR THz spectrometer which combines the free electron laser FLARE with a 33 T Bitter magnet at the High Field Magnet Laboratory in Nijmegen was presented [118]. It uses up to 1 W power irradiation in the THz range, a transmission detection scheme and a classical magnetic field sweep. The performance of the THz spectrometer is measured via high-field EPR in the paramagnetic benchmark system 2,2-diphenyl-1-picrylhydrazyl (DPPH) [118]. High power irradiation of FEL allows also to perform pulse EPR experiments at THz frequencies. A pulse FEL-based EPR spectrometer operating at 240 GHz was described recently [112,113]. For more details on Very-High-Frequency (VHF) EPR we refer the reader to the recent review by A. Schnegg [303].
At Kobe University the research group of H. Ohta has developed multi-frequency high-field EPR spectrometers of large versatility for applications from different aeras of physics, chemistry and material sciences [304]. The high magnetic field EPR instrumentation covers the frequency region between 0.03 and 7 THz and the temperature region between 1.8 and 300 K. With this high-field EPR system Zeeman fields up to 55 T can be applied using a Cu-Ag pulsed magnet and a 300 kJ (10 kV) capacitor bank. Under this high magnetic field also high pressure can be applied up to 1.4 GPa. Moreover, in order to gain sensitivity of their standard high magnetic field EPR spectrometers, the Ohta group has developed a micro-cantilever EPR system using a torque method, which enables EPR measurements of micrometer size single crystals at low temperature. Recently, the group has succeeded in making the EPR measurements up to 369 GHz, the achieved sensitivity is about 1010 spins/G, which is much higher than that using the conventional transmission method. Finally, they developed magnetization-detected EPR using a SQUID magnetometer.
At the National High Magnetic Field Laboratory in Tallahassee, Florida, the ultra-high frequeny EPR instrumentation attained high sensitivity and versatility ready for wide ranges of applications [305] The facility offers users home built high-field and multi-high-frequency instruments covering the continuous frequency range from 9 GHz to ≈1 THz, with additional frequencies up to 2.5 THz using a molecular gas laser. Transmission probes are available for cw measurements, which are compatible with a range of magnets at the lab, including the highest field 45 T hybrid. Some of the probes can be configured with resonant cavities, providing enhanced sensitivity as well as options for in-situ rotation of single-crystal samples in the magnetic field, and the simultaneous application of pressure (up to ≈3 GPa). Quasi-optical (QO) reflection spectrometers are also available in combination with high-resolution 12 and 17 T superconducting magnet systems; a simple QO spectrometer has also been developed for use in the resistive and hybrid magnets (up to 45 T). In addition to cw capabilities, the facility houses a high-frequency pulsed EPR spectrometer, operating at 120, 240 and 336 GHz with 100 ns time resolution. A new high-power (1 kW) qusasi-optical pulsed 94 GHz spectrometer with 1 ns time resolution became available to users in 2015.
5. Site-Directed Spin Labeling (SDSL) in High-Field EPR Spectroscopy
Site-directed spin-labeling (SDSL) of biomolecules has become a mainstream multifrequency approach in EPR spectroscopy [1]. Because of the importance of SDSL in molecular spectroscopy, we will elaborate somewhat on this issue regarding high-field EPR spectroscopy.
5.1. Overview of Studies on Nitroxide Spin-Labeled Proteins and DNA Complexes
The inherent need for paramagnetic samples is no longer a severe limitation for EPR because during recent decades chemical techniques have been developed to introduce electron spin labels into diamagnetic molecules as “spy probes” without significantly disturbing their structure and function. An extremely powerful method for studying structure and conformational dynamics of biomolecules such as proteins has emerged from the pioneering work of Wayne Hubbell at UCLA [306], who introduced a protocol for site-directed nitroxide spin labeling (SDSL) via position-specific cysteine mutagenesis. The SDSL method has been adopted by many EPR research groups around the world.
Currently, Wayne Hubbell’s research is focused on understanding the inter-relationship of protein structure, dynamics and function. Of particular interest are proteins involved in visual signal transduction (rhodopsin, the G-protein transducin and arrestin) and soluble ligand-binding proteins. To explore functional protein dynamics in such complex systems, his laboratory continues to use the technique of SDSL in which a paramagnetic nitroxide side chain (R1) is introduced into the protein as a molecular sensor. The technique exploits the sensitivity of EPR to motions of R1 in the biologically important nanosecond and microsecond time domains that correspond to backbone fluctuations and conformational switching, respectively. Research in the group involves a parallel development of new EPR and SDSL technologies, for instance the introduction of high-pressure cells into the X-band EPR resonator and applications to the biosystems mentioned above.
In appreciation of his opulent spin-label oeuvre over the years we cite here quite a few of his SDSL studies since 2012/2013, in particular those in which new information was gained on fluctuations of conformational substates in proteins at a given temperature under the influence of high pressure [307,308] and those addressing a broad readership beyond specialists of the medical community, for example when reporting on a structural model of the activated GPCR rhodopsin in complex with another G-protein subtype (Gi) derived from intermolecular distance mapping with DEER-EPR and refinement with modeling, see [307,308,309,310,311,312,313,314,315,316,317,318,319,320].
Next, we mention a few more examples of spin-label EPR studies by other groups such as those of Heinz-Jürgen Steinhoff [81,288,290,321,322,323,324,325,326,327,328,329,330,331,332,333,334,335], of Klaus Möbius [17,69,264,328,336,337,338,339], of Thomas Prisner [242,243,340,341,342,343,344,345,346], Olav Schiemann [33,347,348,349,350,351,352,353,354,355,356,357,358], Gunnar Jeschke [35,229,359,360,361], Yuri Tsvetkov [362,363,364,365,366,367,368] and Jack Freed [369,370,371,372,373,374,375,376,377], Daniella Goldfarb [221,222,378,379], Marina Bennati [211,380,381]; but actually there are many more to be referred to. Because of limited space for this review we will refrain from such a challenging endeavor. Instead, we have compiled a list of recent publications concerning EPR/PELDOR/DEER/DQC work since 2014/2015, using either nitroxides or Gd3+ as spin labels; the respective references are: [6,209,210,211,212,213,214,219,220,221,222,223,229,242,251,333,334,345,346,357,358,361,374,375,376,377,378,379,380,382,383,384,385,386,387,388,389,390,391,392,393,394,395,396,397,398,399,400,401,402,403,404,405,406,407,408,409,410,411,412,413,414,415,416,417,418,419,420,421,422,423,424,425,426,427,428,429,430,431,432,433,434,435,436,437,438,439,440,441,442,443,444,445,446,447,448,449,450,451,452,453,454,455,456,457,458,459,460,461,462,463,464,465,466,467,468,469,470,471,472,473].
In SDSL-EPR experiments, often the methanethiosulfonate spin label (MTSSL) (IUPAC name: 1-oxyl-2,2,5,5-tetramethyl-2,5-dihydro-1H-pyrrol-3-yl)methyl methanesulfonothioate) is used to take advantage of its sulfhydryl specificity and its small molecular volume, which is rather similar to that of phenylalanine or tryptophane side chains. This implies that the natural protein structure will not be severly perturbed by the attached spin probe. MTSSL is attached to biomolecules such as proteins by reaction with thiol groups. The standard labeling reaction with proteins involves the cysteine residue, either present in the wild type or artificially introduced by point mutation. The heterodisulfide bond of MTSSL to the cysteine is robust, thus enabling site-directed spin labeling.
In contrast to natural amino-acid side chains, MTSSL spin labels are not rigidly connected to the protein backbone but linked by a rather flexible tether. This leads to a residual motion of the spin label even when the overall protein motion is frozen at low temperatures. To analyze the complex dynamics of spin-labeled protein systems, multi-frequency EPR techniques have been applied in recent years in conjunction with sophisticated lineshape analysis methods, such as those developed by J.H. Freed and his coworkers [474] on the basis of the stochastic Liouville-von Neumannn formalism [475,476,477,478,479,480,481,482]. Thereby it was possible to separate spin-label motions from protein motions at different temperatures [5,30]. This enabled deeper insights into complex protein dynamics and their different time constants [478,483,484,485].
In fact, the applicability of the SDSL technique has been considerably expanded by synthesizing and incorporating artificial amino acids with spin-label side chains into the protein at chosen positions [486]. These artificial spin-label amino acids are designed to reduce internal mobility of the label and, hence, to simplify discrimination between protein backbone dynamics and its modulation upon conformational changes during biological function and residual spin-label side-chain dynamics [487].
Traditionally, SDSL techniques have been employed in conjunction with standard X-band EPR spectroscopy, and the power of the method in terms of structure determination and sensitivity to reorientational dynamics has been extensively reviewed [488,489,490,491]. The combination of SDSL techniques with high-field/high-frequency EPR has added new dimensions concerning determination of molecular orientation and conformational changes of protein segments, sensitivity and selectivity to molecular motions, and polarity and proticity changes of the microenvironment of the spin label [131,492,493,494,495,496,497,498].
Many more examples of high-field EPR studies of biological samples are given in [1], in particular for disordered systems with small (gxx − gyy) anisotropy regarding analysis of non-axial interactions and motions. High-field EPR lineshapes are very sensitive to rapid internal motions and allow short correlation times of protein folding and reorientation to be measured over large temperature ranges, while slower motions are already within the rigid limit and are favorably studied at the lower Zeeman fields of X-band or L-band EPR.
5.2. EPR Triangulation
We now want to call attention to the “EPR-triangulation” methodology. For selectively spin-labeled biosystems this methodology was pioneered by Jack Freed and coworkers at Cornell [37,289]. It is a sophisticated EPR strategy in structural biology for measuring multiple-distance constraints by employing a large number of consecutively nitroxide spin-labeled protein domains. Thereby, the studied protein is encased in a scaffold of constraints, which uniquely define its shape and which limit possible scenarios of its secondary folds.
The phrase “EPR triangulation” or “spin triangulation” has been coined in the style of traditional geometry and geodesy. There, a “triangulation” of a plane surface means its tessellation by triangles, usually with the restriction that each triangle side is entirely shared by two adjacent triangles. For a three-dimensional object like a hilly landscape, triangulation is the division of the object into a set of tetrahedrons in such a way that no vertex of a tetrahedron lies in the interior of another tetrahedron.
As an aside, triangulation methods are standard now for local mapmaking, but it was only towards the end of the 18th century that detailed triangulation network surveys were established to map whole countries. For instance, the “Principal Triangulation of Great Britain” has begun in 1783, but not completed until 1853. Meanwhile, the famous German mathematician Carl Friedrich Gauss was entrusted from 1821 to 1825 with the triangulation of the Kingdom of Hanover, since 1815 part of the German Confederation. This association of 39 German-speaking states in Central Europe was created by the Congress of Vienna in 1815 to replace the former Holy Roman Empire of the German Nation, which had been dissolved in 1806. This was a consequence of Napoleon’s reorganization of much of the Empire of the German Nation into the Confederation of the Rhine, a French satellite, and happened in the aftermath of Austria’s and Prussia’s crushing defeat by Napoleon’s Grande Armée at Austerlitz on 2 December 1805.
Returning to the triangulation of the Kingdom of Hanover: For this task Carl Friedrich Gauss developed the mathematical method of least squares fitting (nowadays a common method in spectroscopy to fit experimental data to theoretical predictions) to find the best fit solution for large systems of simultaneous equations given more real-world measurements are available than unknowns of the problem. As another aside, part of the triangulation network used for Gauss’s survey was pictured on the reverse side of the 10 Deutschmark (DM) banknote (4th series of 10 DM banknotes, first issued 1991).
Apparently, determining the 3D structure of large irregular objects such as proteins by triangulation is a challenging and cumbersome task since it will require dozens of distances to measure in order to significantly restrain the possible structural conformations [289]. For spin-label triangulation, the chosen protein sites as tetrahedron vertices have to be accessible for the spin-labeling reagent, and the labeling should not significantly alter protein structure or function. This is a strict requirement and may limit the options for suitable site selection.
According to Freed’s published work [37,289], the triangulation approach to protein mapping is based on obtaining a rigid network of distance constraints. They are derived from a set of spin-labeled sites selected in such a way that they uniquely define the coordinates of most sites—or even all of them. This huge task can be accomplished by first making a sufficiently large number of double mutations with rigid spin labels. Subsequently, the distances between the respective pairs of spin labels are measured by dipolar pulsed EPR spectroscopy. Such a rigid scaffold of tetrahedrons for triangulation will strongly restrain the potential locations of spin labels and thereby help to identify the possible conformations of the protein.
The Freed group has shown that the constraints can be directly used to solve the protein structure at a resolution of 5 to 10 Å [37,289]. Admittedly, this is a rather low resolution. On the other hand, when only a low-resolution 3D structure of a protein complex is of interest, a few distances may suffice [499]. Evidently, the task of site selection could be facilitated by a priori knowledge of secondary and tertiary structure models from independent measurements.
The obvious catch of the EPR-triangulation method is a flexibility of the spin-label side-chains and the structural heterogeneity of proteins, which usually yield fairly broad distributions for each distance. Nevertheless, there are favorable cases where the EPR-triangulation approach was shown to work successfully [289,500,501,502].
After this more general overview of SDSL-EPR studies, we will now present a specific example to demonstrate the power of W-band high-field EPR spectroscopy for spin labeled membrane proteins. As illustrative example we selected site-specifically spin-labeled bacteriorhodopsin, the famous light-driven proton pump.
5.3. An Illustrative Example: High-Field EPR on Nitroxide Spin-Labeled Bacteriorhodopsin
Nature has invented the strategy to harvest sunlight as energy source for synthesizing ATP twice, in the photosynthetic reaction-center (RC) protein complexes of purple bacteria and in the bacteriorhodopsin (BR) protein complex of halobacteria. In photosynthetic RCs the energy conversion process is the light-induced primary electron transfer between chlorophyll and quinone cofactors, mediated by weak interactions with the protein microenvironment. In the BR protein complex, the energy conversion process is initiated by light-driven primary proton transfer between amino-acid residues, mediated by conformational changes of the only cofactor, the chromophore retinal.
In BR, this archetypical light-driven proton pump, light-induced cis-trans isomerization of retinal is the key molecular process that ensures unidirectionality of the transmembrane proton transfer. Retinal photoisomerization is among the fastest reactions known in biology proceeding in a time regime as short as femtoseconds. It has been widely studied by time-resolved spectroscopic techniques to probe the light-driven evolution of spectral intermediates and to obtain chemical insights into retinal isomerization steps. The transient intermediates, commonly called I, J, and K intermediates, were identified and shown to rise and decay in the ultrafast time regime, see [503] and the references therein.
We will turn now to the high-field spin-label EPR work on the paradigmatic proton-transfer protein BR. The aim of this work was to obtain new insights concerning the molecular mechanisms of light-driven medium-mediated proton transfer, in particular by site-specifically probing local polarity and proticity values along the proton channel in the protein complex which is embedded in functional membranes. We focus on proton-transfer intermediates of selectively MTSSL-labeled BR mutants from Halobacterium (H.) salinarium to determine potential barriers and molecular switches for vectorial transmembrane proton transfer. BR is a 26 kDa protein complex located in the cell membrane of the halophilic archaebacterium H. salinarium. High-resolution (to 1.55 Å resolution) X-ray crystallography coordinates are available of the ground-state structure [504] (see Figure 5).
Seven transmembrane helices (A–G) enclose the retinal that is covalently attached to lysine, K216, on helix G, via a protonated Schiff base. Absorption of 570 nm photons initiates the all-trans to 13-cis photoisomerization of the retinal. The Schiff base then releases a proton to the extracellular medium and is subsequently reprotonated from the cytoplasm. Transient intermediates of this catalytic photocycle can be distinguished by the different absorption properties of the retinal, and a sequence of intermediates named J, K, L, M, N and O has been characterized by time-resolved absorption spectroscopy [505], the M intermediate turned out to be divided into two substates, M1 and M2 [506,507]. During this photocycle, conformational changes of the protein (and the retinal) occur (for a review, see, [508]). Such conformational changes safeguard that light-driven release and uptake of protons do not occur from the same side of the membrane. They enable BR to work as a vectorial transmembrane proton pump. In wild-type BR, the conformational changes associated with the M1 M2 transition are suggested to function as a “reprotonation switch” required for vectorial proton transport since during the lifetime of the respective M state the accessibility of the Schiff base for protons is switched from the extracellular to the cytoplasmic side of the membrane. For details on the nature of the conformational changes and helix movements, we refer the reader to [1] where the original studies are also cited [509].
Major conformational changes occur at the cytoplasmic moieties of helices F and G. The helix movements provide an “opening” of the protein to protons on the cytoplasmic end of the transmembrane proton channel [509]. Thereby, proton transfer can occur from the internal aspartic-acid proton donor, D96, to the Schiff base during the M to N transition. The reprotonation of D96 from the cytoplasm occurs during the recovery of the BR initial state. The region between D96 and the Schiff base is largely nonpolar, packed with bulky amino-acid residues. Hence, in the unilluminated state, the Schiff base is effectively inaccessible to protons from the cytoplasm. In the light-driven M1 M2 transition, however, this region is opened for access of protons to the Schiff-base nitrogen atom. The question remains whether the relatively large conformational changes observed in the photocycle of wild-type BR and many BR mutants are a prerequisite for vectorial proton transport, i.e., if they really represent the widely proposed reprotonation switch.
Regarding the transmembrane polarity profile of BR along the putative proton pathway high-field EPR in conjunction with SDSL molecular engineering provided unique functional details: By 95 GHz (W-band) high-field EPR details of both the polarity and proticity profiles along the proton channel were probed by g- and hyperfine-tensor components from a series of 10 site-specifically nitroxide spin-labeled BR mutants with MTSSL spin label as the reporter side chain R1 [494]. Previous studies of a large number of spin-labeled proteins in numerous laboratories have shown that the Azz component of the hyperfine tensor and the gxx component of the g-tensor are particularly sensitive probes of the microenvironment of R1 thus allowing for measuring local changes of polarity and proticity of protein domains. In other words: the gxx and Azz components probe the local electric fields and the availability of H-bond forming partners of nearby amino-acid residues or water molecules [493,494,495]. Moreover, the dynamics of the nitroxide side chain R1 reveal, via EPR spectral lineshape analysis, direct information about motional constraints introduced by the secondary and tertiary protein structures in the vicinity of the nitroxide binding site [493,494].
W-band EPR spectra were recorded at temperatures below 200 K to avoid motional averaging of the anisotropic magnetic tensors. At these temperatures, R1 can be considered as immobilized on the EPR time scale. The spectra of selected mutants are shown in Figure 5a. The typical nitroxide powder-pattern lineshape is clearly resolved into three separate regions corresponding to the components gxx, gyy and gzz, the gzz region with resolved Azz splitting. The plots of gxx and Azz values versus the position r of R1 along the proton channel (Figure 5c) demonstrate distinct variations in the polarity and proticity of the nitroxide microenvironment (for the experimental error bars, see [494].
According to the structure model [510], residue S162R1 is located in the E-F loop at the cytoplasmic surface, whereas residue K129R1 is positioned in the D-E loop on the extracellular surface. The high polarity in the environment of these residues is evidence that the nitroxides are accessible to water molecules, which is in agreement with the structure. The polarity of the nitroxide microenvironment at positions 100, 167 and 170 is significantly smaller and reaches its minimum at position 46 between the proton donor D96 and the retinal. The plots directly reflect the hydrophobic barrier that the proton has to overcome on its way through the protein channel. The MO theoretical analysis of both tensor components, gxx and Azz, enabled the characterization of the R1 microenvironment in terms of protic and aprotic matrix properties, for details see [496]. The linear plot of experimental gxx versus Azz values of the nitroxide side chains R1 for various spin-label positions in BR is shown in Figure 6. More recently, the BR work has been extended to a thorough multifrequency EPR approach to study the heterogeneity in the nitroxide microenvironment [328], see also [494,511].
For more details about the remarkable features of high-field/high-frequency EPR spectroscopy in (bio)molecular systems such as transient paramagnetic reaction intermediates or spin-labeled proteins, we refer to recent books and overview articles, for example [17,23,42,70,90,129,131,300,474,496,497,512,513,514,515,516,517,518,519,520,521].
As an aside, we briefly mention the recent development of ultrafast crystallography of biomolecules by using high-power coherent X-ray free-electron lasers (XFELs) irradiating a jet stream of microcrystalline protein sample. This is a revolutionary extension of the arsenal of methods to be used in structural biology to understand the functions of proteins at a molecular level, based on the knowledge of their three-dimensional structure. Structural biology employs several imaging experimental techniques such as X-ray crystallography, NMR spectroscopy (to a lesser extent EPR spectroscopy), cryo-electron microscopy, to “see” individual proteins and other large biocomplexes. The novel XFELtechnique allows for collecting femtosecond diffraction patterns of large protein complexes such as bacteriorhodopsin and photosynthetic reaction centers (“diffraction before explosion” [522]). It is now possible to observe ultrafast photochemical reactions and their induced molecular motions within proteins on scales of femtoseconds to milliseconds with near-atomic structural resolution, thereby extending dramatically the dynamic range of time-resolved spectroscopic methods in structural biology. This method is expected to become of fundamental importance. We quote from ref. [522]:
“X-ray free-electron lasers have opened up the possibility of structure determination of protein crystals at room temperature, free of radiation damage. The femtosecond-duration pulses of these sources enable diffraction signals to be collected from samples at doses of 1000 MGy or higher. The sample is vaporized by the intense pulse, but not before the scattering that gives rise to the diffraction pattern takes place. Consequently, only a single flash diffraction pattern can be recorded from a crystal, giving rise to the method of serial crystallography where tens of thousands of patterns are collected from individual crystals that flow across the beam and the patterns are indexed and aggregated into a set of structure factors. The high-dose tolerance and the many-crystal averaging approach allow data to be collected from much smaller crystals than have been examined at synchrotron radiation facilities, even from radiation-sensitive samples.”
Until the end of 2017 it had been a dream in the biomolecular spectroscopy community to observe, in real time, the ultrafast photochemical cis-trans isomerization reaction intermediates and “see” their induced molecular motions within the proteins on scales of femtoseconds to milliseconds with atomic structural resolution. In 2018, finally this dream has become true, see [523] and references therein. In molecular biology, this work is rated a scientific sensation and motivated us to give a brief summary here as an aside of our EPR review.
A consortium of 32 scientists from 12 institutions participated in this grand project on “Retinal isomerization in bacteriorhodopsin captured by a femtosecond X-ray laser” [523] using the Linac Coherent Light Source (LCLS) facility at the Stanford National Accelerator Laboratory (SLAC) facility; both Science User Facilities are operated for the U.S. Department of Energy (DOE) by Stanford University. These facilities have been constructed to take X-ray snapshots of atoms and molecules at work, revealing fundamental processes in materials, technology and living matter (see, https://lcls.slac.stanford.edu/). Using X-ray free-electron lasers (XFELs), it is now possible to observe ultrafast photochemical reactions and their induced molecular motions within proteins on scales of femtoseconds to milliseconds with near-atomic structural resolution. In serial XFEL experiments, a stream of microcrystals in their mother liquor is exposed to intense 120 Hz femtosecond XFEL pulses, thereby collecting millions of X-ray diffraction “snapshots” in a time-frame of hours. Each X-ray FEL pulse is so intense that it destroys the sample; however, the pulse duration is so short that diffraction is observed before destruction occurs.
The retinal light-initiated cis-trans isomerization in bacteriorhodopsin with transient intermediates captured by serial femtosecond X-ray laser crystallography of microcrystal suspensions represents a particularly significant achievement. This is because retinal is a light-sensitive protein ligand that is used by all domains of life to process the information and energy content of light. Retinal-binding proteins are integral membrane proteins that drive vital biological processes, including light sensing for spatial orientation and circadian clock adjustment, as well as maintaining electrochemical gradients through ion transport. How the protein environment guides retinal isomerization on a subpicosecond time scale toward a single high-yield product is a fundamental outstanding question in photobiology.
A series of overlapping difference Fourier electron density maps reveal structural changes over the first picosecond of retinal photoexcitation. Complementary data for time delays of 10 ps and 8 ms allowed the authors to resolve the later stages of the cis-trans isomerization reaction characterized as I, J, K, and M intermediates. The time resolved structural data reveal the trajectory of retinal isomerization and provide atomic details at key points along the reaction pathway.
In the case of photosynthetic reaction center protein complexes (non-oxygenic bacterial RC, oxygenic Photosystem II) correspondingly sensational studies on serial femtosecond crystallography on liquid suspension jetstreams of microcrystal have been done about five years earlier by multi-discipline, multi-institutional groups of rearchers gathered around the Linac Coherent Light Source (LCLS) facility at Stanford:
- -
- For the RC complex from the non-sulfur purple bacterium Blastochloris viridis femtosecond X-ray diffraction work was done in 2013 by a consortium of 45 authors from 12 institutions [524]. The X-ray diffraction data were recorded from microcrystals of the RC to 2.8 Å resolution, and its serial femtosecond crystallography structures were determined to 3.5 Å resolution. Remarkably, although every microcrystal is exposed to a radiation dose of 33 MGy, no signs of X-ray-induced radiation damage are visible in this integral membrane protein structure. This reveals an exytremely important advantage of the femtosecond crystallography based on an ultrafast pulsed X-ray free-electron-laser method: It avoids radiation damages of protein complexes. Clearly, this crystallgraphic method has considerable potential for solving many challenging problems in current structural biology.
- -
- The Photosystem II (PS II) complexes of the cyanobacterium Thermosynechococcus (T.) elongatus [525,526,527,528,529] and T. vulcanus [530,531] have also been studied by serial femtosecond crystallography using X-ray lasers provided by the facilities at Stanford, CA, USA (LCLS) and Hyogo, Japan (SACLA). In this ground breaking work the advantages of the technique could be clearly demonstrated, namely that diffraction data can now be obtained for very small PS II crystals without radiation damage and that transient—even short-lived—states of the enzyme can be accessed in real time at room temperature [526]. The technique is of particular importance for the investigation of the water oxidizing/oxygen evolving enzyme located in PS II that undergoes significant structural changes within its catalytic cycle (for a detailed EPR story of the OEC, see Section 8, Case Study II).
6. Selected Topics of Current High-Field EPR Spectroscopy on Biosystems
When preparing the present overview article, it was not our intention to compose an encyclopedic report on EPR spectroscopy at high-fields in general. Rather, we focused on those aspects where the distance between EPR and NMR spectroscopy is short enough to address potential readers from both communities. With this goal in mind, we had to be very selective in choosing proper aspects of high-field EPR. This was a difficult task, but we decided to mainly touch upon topics related to (bio)chemistry or (bio)physics of large molecular complexes. In addition, we will comment on a few recent high-field EPR papers on biological systems that may be of general interest (for more detailed reports, see also the two Case Studies in Section 7 and Section 8).
6.1. Extending the Distance Range between Molecular Spin Centers by High-Field Dipolar EPR with Gd3+ Spin Probes
Interspin distances between 0.8 nm and 2.0 nm can be conventionally measured through the electron–electron dipolar broadening of the continuous wave (cw) EPR spectrum of nitroxide spin labels at X-band (9.4 GHz, 0.35 T). In 2013, the group of Daniella Goldfarb at the Weizmann Institute and her coworkers [532] were among the first to introduce Gd3+ as a promising alternative spin label for distance measurements by cw EPR above 7 Tesla, where the |−1/2〉 to |1/2〉 spin transition narrows below 1 mT and becomes extremely sensitive to dipolar broadening. To estimate the distance limits of cw EPR with Gd3+, the authors have measured spectra of frozen solutions of GdCl3 at 8.6 T (240 GHz) and 10 K at concentrations ranging from 50 mM to 0.1 mM, covering a broad range of average interspin distances. These experiments show substantial dipolar broadening at distances where line broadening cannot be observed with nitroxides at X-band.
This data, and its agreement with calculated dipolar-broadened lineshapes, show Gd3+ to be sensitive to distances as long as about 3.8 nm. Therefore, the combination of tailored Gd3+ labels and high magnetic fields can extend the longest interspin distances measurable by cw EPR from 2.0 nm to 3.8 nm. Moreover, the cw EPR data at 260 K demonstrate that the line broadening remains small enough at similar average interspin distances. They offer Gd3+ probes as promising distance rulers at temperatures higher than possible with conventional pulsed EPR distance measurements using nitroxide spin probes.
Special attention is drawn to the recent pulse electron–electron double resonance (PELDOR or DEER) studies at high-field and W-band mw frequency, performed mainly by the group of Daniella Goldfarb at Rehovot, for measuring long innermolecular distances using Gd3+ spin labels, even using triple spin labeling with Gd3+, Mn2+ and a nitroxide radical [221]. The same group published recently highly interesting high-field PELDOR distance measurements on proteins using Gd3+ tags, see for example [220,221,222,377,378,382,383,384,385,533].
The group of Thomas Prisner at Frankfurt has recently published very interesting results on long-range distance measurements in biomolecules comparing NMR and EPR spectroscopy [396].
6.2. Exploring by Ultrahigh-Field EPR the Molecular Basis of Radiation Resistance of Certain Bacterial Cells Containg Small High-Symmetry Antioxidant Complexes of Manganous Ions
Decades of functional genomic efforts have failed so far to predict the ability of cells to survive ionizing radiation. Evidence is mounting that small high-symmetry antioxidant complexes of manganous ions with metabolites (H-Mn2+) are responsible for cellular ionizing-radiation resistance, and that H-Mn2+ protects the proteome, not the genome, from radiation-induced reactive oxygen species. Taking the bacterium Deinococcus radiodurans as an example, a large team of interdisciplinary researchers around B.M. Hoffman (Northwestern University) has shown [534] that the amount of H-Mn2+ in nonirradiated living cells is readily gauged by high-field EPR spectroscopy. The amount of H-Mn2+ complexes is highly diagnostic of their DNA repair efficiency and survival capability after gamma-radiation exposure.
The significance of this recent work of high-field EPR spectroscopy on radiation damage in biological cells relies on the new insight that was gained into the strategies developed by biological cells to survive after gamma-radiation exposure by employing antioxidant complexes of manganous ions with metabolites (H-Mn2+). A quantitative EPR-based spectroscopic measure of cellular H-Mn2+ content was developed. Cellular H-Mn2+ content is the strongest known biological indicator of cellular ionizing-radiation resistance between and within organisms across the three domains of the tree of life, with potential applications including optimization of radiotherapy in medicine. High magnetic fields provide dramatically increased spectral resolution compared to the much lower field employed in commercial spectrometers. This facilitates discrimination of paramagnetic signals from biological samples that may potentially contain multiple species, e.g., manganous ions.
In this work [534], the EPR spectra were recorded under conditions of ultrahigh magnetic fields and microwave frequencies using a laboratory-built spectrometer at the EPR facility of the US National High Magnetic Field Laboratory (NHMFL) in Tellahassee, FL. Briefly, the instrument is a transmission-type spectrometer in which microwaves are propagated in cylindrical lightpipes. The microwaves were generated by a phase-locked Virginia Diodes source generating frequency of 13 ± 1 GHz and producing its harmonics of which the 2nd, 4th, 6th, 8th, 16th, 24th and 32nd are available. A superconducting magnet (Oxford Instruments) capable of reaching a field of 17 T was employed.
6.3. The Effect of Protein-Solvent Interactions for Biological Function and the Survival of Organisms under Extreme Stress Situations of Heat and Dryness
During recent decades, sugar-glass matrices attracted a growing interest in the biotechnology community for their ability to stabilize labile proteins, including therapeutic polypeptides, and optimize their storage at room temperature in the solid state [535,536,537,538,539,540]. Among the saccharides, trehalose (α-d-glucopyranosil α-d-glucopyranoside) is unique regarding its high glass transition temperature, Tg. Accordingly, already at room temperature trehalose forms glassy matrices upon dehydration which protect the hosted protein against denaturation induced by freezing, heating, and drying. The glass transition temperatures of common sugars are ordered as Tgglucose < Tgsucrose < Tgtrehalose. We note that Tg is strongly dependent on the water content of the sugar; for dry glucose, sucrose, and trehalose the Tg values are 296, 333, and 380 K, respectively [541].
In nature, the bioprotective action of trehalose and other disaccharide glasses is used by several organisms able to survive for long periods (up to years) extreme draught and high temperatures by preserving the structural integrity of their cellular structures, while reversibly arresting their metabolism, i.e., they are in a state of anhydrobiosis. Molecular biology research along such lines of Nature’s strategies to improve plant tolerance against heat and drought stress is currently a topical subject in view of the apparent threats of global climate change on world-wide agriculture and farming [542,543,544].
The molecular details of the protein–matrix dynamical coupling are still controversely debated in the current literature, for instance the role of hydrogen-bonding networks at the protein–matrix interface involving local water molecules for protein stabilization. It is now well established, however, that the extreme stabilization of proteins incorporated into trehalose glasses is rooted in the dramatic hindering of internal protein dynamics (“freezing out” at elevated temperatures) which thus prevents irreversible loss of the native structure. Changes in hydrogen-bonding patterns of protein complexes such as photosynthetic reaction centers usually have a strong impact on the overall function of a biological system.
Details of our recent pulsed W-band (94 GHz) high-field multi-resonance EPR, ELDOR-detected NMR and ENDOR experiments on photosynthetic reaction center complexes, in conjunction with using nitroxide spin-labeled proteins as well as deuterium and 17O isotope-labeled water [545,546,547], will be presented in Section 7, Case Study I.
6.4. Structure and Function of Transition Metal Centers in Metalloproteins
One of the main subjects of multifrequency/multiresonance EPR applications in biophysics and biochemistry is the investigation of transition metal ions chelated in molecular complexes; they often have one or more unpaired electrons in their d-orbitals. Prominent examples are proteins containing iron or manganese such as the two photosystems, PS I and PS II, of oxygenic photosynthesis. They contain non-heme iron, heme-containing cytochromes and iron-sulfur centers for light harvesting, light-induced charge separation and electron transfer—as well as a tetranuclear manganese/calcium cluster used for catalytic water oxidation, the famous “oxygen-evolving complex” (OEC). The reader is referred to [548,549,550] for references to the vast literature on this photosynthetic water-splitting process.
The OEC is one of the most interesting biocatalytic metal centers—and directly related to the topical field of renewable energy research [551,552,553,554,555,556]. Sensational new information on the OEC has been acquired in recent years thanks to the application of sophisticated EPR/NMR double resonance techniques at higher magnetic fields; this will be discussed to some detail in Section 8, Case Study II.
In [1] we have elaborated in a case study also on “High-field PELDOR and ENDOR structure determination of cation-anion radical pairs in photosynthetic reaction centers”. We will not repeat it here but recommend it for reading. There, the most important references are given for a better understanding of the scientific background, the applied methods and accomplished structural results on extremely important membrane protein complexes, namely the bacterial reaction center (bRC) of non-oxygenic photosynthesis as well as Photosystem I (PS I) and Photosystem II (PS II) of oxygenic photosynthesis.
7. Case Study I: High-Field ELDOR-Detected NMR (EDNMR) as a General Method for Electron–Nuclear Hyperfine Spectroscopy with an Application on Nitroxide Radical and Transition Metal Containing Systems
7.1. Introduction
As introduced in Section 4.6, ELDOR-detected NMR (EDNMR) was first described by the Schweiger laboratory at ETH Zurich [271] over 20 years ago. The method relies on using selective microwave pulses which pump spin forbidden transitions of the spin manifold, where both the electron and nuclear spins change their projection direction (ΔMS = ±1, ΔMI = ±1, ±2, … (Figure 7a,b). These transitions are referenced against the spin-allowed EPR transition to extract all NMR transitions of the spin manifold (Figure 7d). Up to recent years, EDNMR was only seldomly used because the technique is insensitive to NMR couplings that are within 5–10 MHz of the allowed EPR transition. At X- and Q-band microwave frequencies (0.3–1.2 T) most nuclei of interest fall within this spectral range, termed the central blind spot or blind zone (Figure 7c). This problem is overcome by moving the EDNMR experiment to higher magnetic fields and microwave frequencies, e.g., W-band (3.4 T). At this field range, the Larmor frequency, νn, of many nuclei is significantly larger than 10 MHz, allowing for their detection by EDNMR. Over the last decade, a series of reports appeared that used high-field EDNMR to characterize a number of chemical systems and materials with a wide variety of nuclei in radical [228,236,545,557,558,559,560,561,562,563,564] and transition metal containing systems [272,273,275,276,565,566,567,568,569,570,571,572,573,574,575,576,577,578,579,580,581,582,583,584].
High field EDNMR has a series of advantages over conventional double resonance techniques such as Electron Nuclear Double Resonance (ENDOR). These include:
- (i)
- Enhanced spectral resolution: the frequency at which the NMR transition of a particular nucleus is observed is linearly dependent on the applied magnetic field (Figure 7c). As such, moving to higher magnetic fields allows different nuclei to be more readily discriminated, as is the case in NMR spectroscopy.
- (ii)
- (iii)
- (iv)
The only disadvantage of using EDNMR is its reduced spectral resolution as compared to the corresponding ENDOR experiment [274,558]. We have recently demonstrated that such problems are typically avoided in the high-field regime, by using appropriately optimized pulse sequences. We also note that at high field, correlation transitions (those involving multiple nuclei) can be more easily suppressed that can contribute to the observed linewidth at lower microwave bands (X-, Q-band). In the text below we describe recent results from our laboratories on using EDNMR to characterize radicals and paramagnetic metal complexes at higher magnetic fields [236,273,274,545,558,559,562,563,564,572,583]. For further information about the EDNMR method we refer the reader to recent reviews [274,585].
7.2. Nitrogen EDNMR on Nitroxide Radicals in Organic Solvents
Aminoxyl radicals (nitroxides) are stable radicals used extensively in EPR spectroscopy as a spin label or local reporter group in solution and solid phase samples, for a recent review see [586]. Nitroxide radicals contain an NMR active 14N (or 15N) nucleus whose spectroscopic properties (hyperfine/quadrupole coupling) are dependent on the nitroxide’s local environment, see Section 5.3. The W-band 14N-EDNMR spectrum of a pyrroline-type nitroxide radical (R1) in 2-propanol frozen solution at the particular magnetic field position marked in Figure 8a is shown in Figure 8b [558]. It is important to remember that the hyperfine interaction between the nitrogen nucleus and the unpaired electron spin is not the same in all directions—leading to a powder EPR spectrum. The nitroxide molecular electron Zeeman, , and nitrogen hyperfine tensors, , are collinear. The unique tensor axis (z), describes the unpaired spin associated with the p-orbitals of the conjugated ring. It is characterized by a g-value approximately that of the free electron value and a large 14N hyperfine coupling, in the strong coupling limit, |Azz|/2 > |νn(14N)|. The other two g-tensor principal components appear at higher values (lower magnetic field positions) with 14N hyperfine couplings in the weak coupling limit, |Axx,yy|/2 < |νn(14N)|. As a consequence, the corresponding EDNMR spectrum of the nitroxide radical is strongly dependent on the field position at which the double resonance experiment is performed [558,564]. Thus, to capture the entire 14N-EDNMR spectrum one needs to measure in two dimensions, i.e., a series of EDNMR spectra need to be recorded across the whole EPR profile, to give the contour map shown in Figure 8c.
EDNMR spectra recorded in the high magnetic field region are of particular importance, as they allow the precise values of nitrogen hyperfine (Azz), and quadrupole, (Pzz), tensor z-components to be read out [236,558,562,563], see Figure 9a. These parameters are most sensitive to probe the microenvironment of nitroxide radicals.
The resolution of the EDNMR experiment also allows the different spectral contributions to be resolved. In the case of SDSL labeled proteins, discrete populations of nitroxides exposed to the different microenvironments can be characterized [328,562]. In cw EPR spectra, these different populations remain hidden in the EPR lines broadened by hyperfine interaction with nuclei other than nitrogen. Figure 9b depicts the W-band EDNMR spectra for R1-D16 in different solvents taken close to the respective canonical positions in the gzz, MI = −1 spectral region [559]. The spectra are overlaid with their best-fit simulation, which assume a Gaussian lineshape for each microenvironment population. Specifically, in ortho-terphenyl, aniline and methanol only a single pair of lines is observed by EDNMR, i.e., a single nitroxide radical population is present. In phenol, 2-propanol and water, however, two different contributions are observed in the EDNMR spectra. The analysis of solvent-dependent magnetic parameter values of the nitroxide, Azz and Pzz, lead to the conclusion that the principal values of all the magnetic interaction parameters primarily depend on whether the nitroxide participates in a hydrogen bond and what is the hydrogen bond donor group of the solvent [560]. The solvent bulk polarity, as described by the static dielectric constant was found to be of minor importance.
The high resolution of EDNMR also allows characterizing the changes of the nitroxide microenvironment upon the changes of the sample conditions. From a comparison of ENDMR spectra recorded in shock-frozen samples, which were subsequently annealed at higher temperatures, it was shown that the H-bond network, in which the nitroxide is involved, rearranges around the glass transition temperature [563].
At the end of this section we compare the performance of EDNMR and ENDOR as applied to nitroxide radicals [558]. Figure 9a shows W-band 14N EDNMR and ENDOR spectra of R1 in frozen ortho-terphenyl which were consecutively recorded on the same samples at the same magnetic field position (close to gzz, MI = −1). The spectra were acquired using the same frequency sweep range and the same pulse repetition rate, but using a different number of averages per point (100 for EDNMR, 500 for ENDOR). As expected, the line positions of the ENDOR and EDNMR recordings exactly coincide. The low-frequency ENDOR line around 38 MHz is strongly suppressed. This is due to the “hyperfine enhancement” effect [2] and the superimposed frequency dependence of the B2 (RF) field. Considering that the determination of Azz and Pzz requires the frequency positions of both the low- and high-frequency lines, the S/N ratio was calculated for the line with lowest NMR intensity. For ENDOR, an S/N ratio of 0.2 per shot was obtained. In contrast, for EDNMR the respective number is S/N = 6. Hence, the sensitivity of EDNMR is superior to ENDOR by a factor of 30. This means that the same information can be obtained in a 900 × shorter measurement time. The EDNMR spectrum exhibits a slightly broader linewidth (about 10%) as compared to the ENDOR spectrum. This small difference is of experimental origin and can be eliminated by adjusting the experimental parameters at the expense of the S/N ratio [564].
7.3. EDNMR on Nitroxide Labeled Bacterial Reaction Centers Embedded in a Trehalose Glass
In nature, the extraordinary bio-protective capabilities of disaccharide glasses are exploited by specific organisms, which are able to survive extreme conditions of temperature and dehydration by entering a state of reversibly arrested metabolic activity, called anhydrobiosis or cryptobiosis [587]. Trehalose is the most efficient sugar for bio-protection against extreme dehydration and osmotic stress. The exact mechanistic details of the trehalose efficiency are still under debate [588,589].
Several existing separate hypotheses—that to some extent are complementary and not mutually exclusive—try to explain the remarkable trehalose efficacy in bio-protection by predicting different changes in the first solvation shell of the protein upon dehydration. The “water replacement hypothesis” [590] states that upon drying the hydrogen-bond interactions of polar groups at the protein interface with water is replaced by hydrogen bonds to the trehalose sugar by which the protein structure is strongly stabilized. The “preferential hydration hypothesis” [591], on the other hand, states that water molecules become entrapped at the interface between the glassy sugar matrix and the protein surface. The “high viscosity hypothesis” [592] assumes that the inhibition of dynamic processes responsible for protein denaturation is mainly due to the high viscosity of the dried disaccharide matrix impeding diffusion. In an attempt to generalize the above models by incorporating some of their features, the “anchorage hypothesis” [593] has been proposed stating that hindering of protein dynamics is caused by a tight anchoring of the protein surface to the rigid matrix through the formation of an extended H-bond network. According to this view, the disaccharide matrix locks the protein surface either directly, as assumed in the water replacement hypothesis, or through bridging residual water molecules at the protein–matrix interface, thus preventing large-scale protein internal motions. To differentiate experimentally between these hypotheses, a sensitive spectroscopic method capable of direct water detection in a site-specific manner was needed.
High-field EDNMR in conjunction with nitroxide site-directed spin-labeling is capable not only to detect the water localy but also to quantify its amount. In our recent work, the bacterial reaction center (bRC) from Rhodobacter (Rb.) sphaeroides R26 embedded into a trehalose glass matrix was used as the model system [545]. The bRC hosts the two native radical cofactor ions (primary electron donor) and (primary electron acceptor) as well as an artificial nitroxide spin label site-specifically attached to the surface of the H-protein domain. The nitroxide label is located close to the protein surface serving as the water sensor at the trehalose-protein interface. The three paramagnetic reporter groups have distinctly different local environments. They serve as local probes to detect water molecules via magnetic interactions (electron–nuclear hyperfine and quadrupole) with either deuterons or 17O water nuclei.
The effect of bRC coating in a trehalose glass matrix has been thoroughly studied previously using laser-flash optical and EPR spectroscopies [594,595,596,597,598]. Upon progressive dehydration of the trehalose matrix, the kinetics of charge recombination becomes faster and exhibits widely distributed rate constants [594,595,597,599]. Thus, it mimics at room temperature the bRC recombination kinetics observed at cryogenic temperatures in the water-glycerol system when frozen in the dark [600,601].
The bRCs were equilibrated in an atmosphere of different relative humidities using saturated solutions of salt dissolved in deuterium (D) or 17O enriched water allowing precise control of the hydration levels of the protein. Two relative hydration levels, r, were chosen that result in a different extent of slaving the protein dynamics to the embedding sugar matrix: (i) r = 11% for which the protein dynamics is arrested on the time scale of seconds [597]; and (ii) r = 74% for which the dynamics is only mildly retarded as compared to the solution [602].
The EDNMR and ENDOR signals of D or 17O were recorded and analysed. The deuterium containing samples—despite higher EDNMR sensitivity—reveal two problems: (i) low spectral resolution of the EDNMR method which prohibits discrimination of the EDNMR signal contributions stemming from bonded and distant waters molecules; (ii) substantial signal contributions due to proton-deuterium exchange in the protein.
Figure 10b shows 17O EDNMR spectra recorded for MTSSL-bRC/trehalose equilibrated at r = 11% (LiCl/H217O) and r = 74% (NaCl/H217O). In both spectra, a line centered at the 17O nuclear Larmor frequency νn(17O) = 19.4 MHz and 14N lines from the nitroxide nitrogen were observed. The 17O EDNMR signal can be deconvoluted into two contributions due to (i) water molecules hydrogen-bonded to the nitroxide label and (ii) distant water in the vicinity of the nitroxide. Analysis of the 17O EDNMR line shows that the 17O line intensity contribution from distant water at r = 11% is 6 ± 2 times smaller than at r = 74%, Figure 10c. Thus, for MTSSL-bRC the ratio of 17O EDNMR line intensities for the hydrated state (r = 74%) to the dehydrated state (r = 11%) is 6 ± 2 reflecting the number of distant water molecules in the vicinity of the nitroxide spin label. This ratio is close to the H2O/trehalose molar ratios of both hydration states of 4.7 ± 0.2 as reported for the pure trehalose matrix [602]. Thus, the scaling of the 17O signal intensity follows the changes of the overall water content in the trehalose matrix. This fact is in quantitative conflict with the “water replacement hypothesis”. At the same time, the above observation weakens the applicability of the “preferential hydration hypothesis”, because it does not give evidence of a preferential hydration of the protein surface in comparison to the average hydration of the whole sugar matrix. Thus, our findings appear consistent with the “anchorage hypothesis” assumption that the trehalose matrix immobilizes the protein by locking its surface through direct H-bonds between exposed protein residues and sugar molecules, as well as through indirect H-bonds mediated by bridging water molecules of the residual hydration shell—which would be in line with the recent model suggestion of Olsson et al. in ref. [588].
While the spectral sensitivity of EDNMR relative to ENDOR is higher by several orders of magnitude, thus making it often the method of choice, the limited resolution of deuterium EDNMR using D2O poses a disadvantage for local water sensing in a quantitative way. However, deuterium EDNMR is well-suited for qualitative studies, like those presented here to determine the sugar rehydration kinetics for which no differentiation between coupled and distant water is necessary [545]. When quantitative information on the different types of water in proteins is required, 17O EDNMR using H217O can be used instead, taking advantage of the high sensitivity of the method and the possibility to resolve coupled from distant 17O contributions. In this respect, W-band EDNMR in conjunction with D and/or 17O isotope labeling is indeed a very strong methodology for local water sensing.
7.4. EDNMR on Transition Metal Containing Systems
The EDNMR technique performed at high fields is ideally suited for transition metal systems which typically display much faster magnetic relaxation (T1, T2) rates than radicals [270,572]. Indeed, the fast relaxation of transition metal complexes can lead to cases where nuclear coupling cannot be measured using conventionial techniques such as ENDOR. This is because the effect of the intial preparative pulse (selective population inversion) decays before the radio frequency pulse can be applied. Similar limitations exist for ESEEM. Here, modulations due to large anisotropic couplings appear immediately after the pulse sequence within the deadtime of the sequence and thus remain unresolved. We also note that nuclear transitions (ligand and metal centered) for transition metal complexes typically cover a large frequency range which cannot be accessed using ESEEM due to excitation bandwidth constraints.
The superior performance of high field EDNMR can be easily demonstrated using the solvated MnII ion dissolved in 17O labeled water (i.e., MnII(H217O)6, see Figure 11). In a single acquisition all nuclei of the complex (55Mn, 17O, 1H) can be detected, even though they span a range larger than 200 MHz. In addition, double-quantum transitions for the two high spin nuclei (55Mn, 17O, I = 5/2) are also readily excited along with correlation transitions involving the change in projection of two (or more) nuclei. The same recording is difficult to achieve using ENDOR owing to the breadth of the scan and the different nuclear spin states of the three nuclei (B2 field non-linearity). In addition, the double-quantum transitions and correlation transitions are not observed in the ENDOR recording. While it is not clearly evident from Figure 11, small deviations between the left-hand side (LHS) and right-hand side (RHS) of the raw EDNMR data trace can be observed, which are due to second order splitting of the nuclear spin submanifold. The same information is more difficult to obtain from conventional ENDOR measurements. All NMR transitions have the same sign, and thus the resulting spectrum is a superposition of the LHS and RHS of the EDNMR spectrum. Thus, in this situation the linewidth resolution in the EDNMR experiment is actually better than that of the corresponding ENDOR spectrum.
Correlation transitions are ubiquous in the EDNMR experiment. This can be shown by comparing EDNMR spectra collected for the solvated MnII ion in different water isotope mixtures (1H2O, 2H2O, H217O) [572,584]. In the Q-band spectra shown in Figure 12 correlation peaks involving double- or even triple-quantum transitions can all be easily observed. At very low fields, these transitions lead to an apparent line-broadening of the underlying single-quantum transition, and as such their ultility is only realized at higher magnetic fields. Nevertheless, these transitions do provide additional spectral information and, being able to access them, may form the basis of new, higher dimension EDNMR pulse sequences. One of these is CHEESY EDNMR, analogous to FT detected EDNMR [228]. This new method, using chirp pulse detection, allows single shot accumulation of the entire EDNMR spectrum. When using an initial selective pulse, correlations within the nuclear spin manifold can be deduced as in triple ENDOR or alternatively, THYCOS.
The same advantages can be seen for more complex systems. Our laboratories have recently reported high field EDNMR data for a series of oxygen (μ-oxo) bridged manganese homodimers and manganese-iron heterodimers [583]. This set included two simple synthetic complexes and two biological cofactors, from the manganese calatase enzyme and R2-like ligand oxidase (R2lox) enzyme. Using EDNMR we could characterize the electronic properties of the bridging oxygen(s) which mediate the super-exchange interaction between the two metal ions. And as above, our EDNMR spectra could also access all other magnetic nuclei in the complex (14N, 1H, 55Mn).
7.5. Conclusion
EDNMR performed at higher magnetic fields is unrivalled in terms of its sensitivity and bandwidth compared to conventional double resonance methods. The two examples above, an organic radical and a transition metal complex, are a testament to this. Furthermore, the robust nature of EDNMR towards fast relaxation allows it to be used for less well-defined chemical systems including protein aggregates (such as amyloids) and heterogeneous materials (such as metal oxides). EDNMR will in the future dramatically extend the range and scope of chemical problems pulse EPR techniques are applied to. An example of the depth of information that EDNMR can provide is given in the next Section 8, Case Study II, on the biological water splitting cofactor in oxygenic photosynthesis. Here, EDNMR was used to resolve the binding of the two substrate waters to the catalyst, a tetramanagnese-calcium cluster. These measurements were only possible using EDNMR at high magnetic field owing to the fast relaxation of the cofactor due to its integer electron spin.
EDNMR is also not limited to one-dimensional experiments as described above. Multi-dimensional EDNMR methods, similar to that of ESEEM, have already been reported by the Goldfarb group at the Weizmann Institute. One of such methods, Triple Hyperfine Correlation Spectroscopy (THYCOS) combines the EDNMR and Davies ENDOR pulse sequences to provide enhanced linewidth resolution [275]. We expect that further development of these methods will allow intrinsially small magnetic interactions to be interrogated. This could open up new approaches, using both instrinsic and extrinsic spin labels, to characterize distant nuclei, constrain the relative signs of the hyperfine intercations, in molecules that contain multiple NMR active nuclei, and potentially extract nuclear-nuclear coupling in paramagnetic systems.
8. Case Study II: High-Field ENDOR and EDNMR Studies of the Oxygen Evolving Complex (OEC) in PS II
8.1. Introduction
High field EPR spectroscopy is opening up new opportunities to study transition metal catalysis, particularly of high spin complexes. As described in the previous sections, such complexes are often EPR silent at lower microwave frequencies and typically display fast T1 relaxation, hampering the application of double resonance type methodologies such as ENDOR. The high field regime instead allows alternative techniques to be used, such as ELDOR-detected NMR, which displays both enhanced sensitivity and broadband detection, allowing difficult magnetic nuclei to be detected i.e., low-γ nuclei with large quadrupole moments. Below we describe how the application of high field EPR techniques has revolutionized our understanding of the mechanism of biological water oxidation, performed by a single enzyme in nature, Photosystem II (PS II).
Biological water oxidation is one of the most important processes in nature and is directly related to the topical field of renewable energy research [551,552,553,554,555,556]. The catalytic center hosts a unique protein-bound Mn4OxCa cluster, with five or six oxygen bridges depending on the state of the enzyme. The same cofactor is used by all organisms performing oxygenic photosynthesis and catalyzes the reaction:
PS II employs visible light (400–700 nm) to drive the water-splitting reaction. Note that four light quanta are necessary to produce one O2 from 2 water molecules [604]. The energy derived from this process is chemically stored in the form of reduced plastoquinone, which is subsequently used to generate NADPH, and an electrochemical potential that is derived from concomitant proton transfer across the thylakoid membrane. This latter process drives ATP synthesis from ADP. NADPH and ATP are necessary for the conversion of carbon dioxide (CO2) into carbohydrates [605]. Thus, PS II—together with a second photosystem, Photosystem I (PSI)—is primarily responsible for the vast majority of sunlight-derived biological energy storage on Earth; namely all food, natural materials (e.g., wood, cotton, peat), fossil fuels (coal, oil and natural gas) has been generated by photosynthesis. It is also responsible for the oxygen-rich atmosphere and the protecting ozone layer, processes that were of key importance for the development of higher life on our planet.
8.2. Structure of Photosystem II, Primary Events and the Water Oxidation Cycle
PS II carries many different cofactors for light-harvesting, excitation transfer, charge separation and transmembrane electron transfer, reduction and protonation of acceptor molecules as well as for the accumulation of oxidizing equivalents, leading to water splitting, O–O bond formation and O2 release (Figure 13a). The path of light-induced electron transfer and the water oxidation process is shown in Figure 13b, and the structure of the Mn4OxCa cluster is shown in Figure 14a. Light excitation of the reaction center of PS II, a multi-pigment assembly of four chlorophyll-a and two pheophytin-a molecules, leads to primary charge separation on a picosecond timescale, a single electron transfer process, resulting in a charge-separated radical-pair state [606]. The radical cation of the primary donor, a chlorophyll pigment, has an estimated oxidizing potential of +1.2 to +1.3 V, the highest known in biology [607], which is required for efficient water oxidation. The radical anion of the primary acceptor, a pheophytin pigment (the Pheo bound to the D1 protein) exists transiently and is stabilized by subsequent electron/hole transfer steps. The acceptor passes its electron to the bound plastoquinone molecules (QA and subsequently QB), whereas is reduced within nanoseconds by a redox active tyrosine side chain of the D1 protein, YZ (Figure 14b). In this way, the distance between the electron and the hole increases, suppressing recombination reactions. Reducing equivalents derived from this process are temporarily stored as reduced plastoquinol (QBH2), a mobile electron carrier, generated after two light absorption/charge separation and protonation events.
The structure of this membrane protein has been obtained by X-ray crystallography (XRD). The first crystallization of PS II from cyanobacteria and a structural analysis with 3.8 Å resolution has been done by the groups of H.T. Witt and W. Saenger (Berlin, Germany) [609] and was later refined by J. Barber (London, UK) [610]. A breakthrough has recently been reported by J.R. Shen and N. Kamiya (Okayama/Osaka, Japan) in 2011, who published a PS II structure with 1.9 Å resolution, in which the arrangement of the Mn4OxCa cluster of the OEC was resolved for the first time [608], see Figure 14a. One of the major problems of XRD of metalloproteins is radiation damage in the intense X-ray beam of modern synchrotrons [611] that can however be avoided by fs time resolved X-ray diffraction using a free electron X-ray laser (XFEL) [612,613]. In recent years this technique has revolutionized structure analysis of PS II, in particular information on the arrangement of the Mn, Ca and O atoms in the OEC and the water binding to the cluster has been determined for different states of the OEC [525,526,527,529,530,531].
The accumulation of oxidizing equivalents on the donor side is necessary for the four-electron water-splitting oxidation reaction as the reaction center only generates one electron hole per absorbed photon. Oxidizing equivalents (“electron holes”) are stored by the tetranuclear manganese complex, which is connected to the reaction center via the one-electron hole carrier YZ. To retain charge neutrality protons are released during accumulation of oxidizing equivalents. This has the consequence of leveling the redox transitions of the OEC such that the same oxidizing potential (about 1 V) can be used for all Mn oxidation events [614]. The series of distinct redox intermediates that make up the water-splitting reaction cycle are described in terms of the Si states of the catalytic water oxidation cycle first described by Bessel Kok [615], where i indicates the number of stored oxidizing equivalents (i = 0–4) in the Mn4OxCa cluster, see Figure 14b). The S4-state, which has not yet been spectroscopically identified, rapidly decays to S0 upon release of molecular triplet dioxygen and rebinding of one substrate water molecule. It is postulated that the second water is only loosely associated with the Mn4OxCa cluster until late in the reaction cycle, i.e., S2–S4 [616]. The dark-stable or resting state of the enzyme is S1, since S0 is of low potential and is oxidized via a second redox-active tyrosine residue YD of the D2 protein.
8.3. Electronic Structure of the OEC
Manganese in its various oxidation states (e.g., Mn2+, Mn3+, Mn4+) has electron spin states of S = 5/2, 4/2 and 3/2, respectively—note Ca2+ carries no spin (S = 0). In the oxygen-bridged Mn-cluster (Figure 14a) the electron spins are coupled (via spin exchange), either ferro- or antiferromagnetically and with varying strengths J, leading to a large variety of ground and excited spin states. The spin and net oxidation states of the S-states, the order in which the Mn ions are oxidized and the level to which they interact all have consequences for the redox properties of the cluster, the binding of the substrate waters, and O2 and H+ release. An accurate picture of the electronic structure of the OEC is therefore critical for understanding the mechanism of water oxidation. As the water oxidation cycle involves four single oxidation events of the Mn4OxCa cluster, it is particularly well suited for studies by EPR spectroscopies. Historically it has been shown that all S states display paramagnetism [621] with S0 and S2 possessing an effective half-integer spin ground states, Seff = 1/2. These two states are readily accessible by cw and pulse EPR techniques, and much detailed information has been gathered on their electronic structure. The characteristic EPR signals seen in both the S0 and S2 states are centered at g ≈ 2 and are commonly referred to as the “multiline” spectrum [622,623]. The large number of spectral lines of these spectra originates in the hyperfine interaction of the effective electron spin Seff = 1/2 with the four 55Mn nuclei, each with nuclear spin I = 5/2. As the transitions appear over a relatively narrow magnetic field range (≈160 mT) spectral congestion does not allow these interactions to be uniquely determined. As a consequence, EPR-detected NMR techniques such as ENDOR, that measure the hyperfine-coupled 55Mn nuclei directly, have been applied to more accurately probe the electronic structure [624,625,626,627]. These methods at X- and Q-band microwave frequencies have constrained the oxidation states of the four manganese ions in the S0 and S2 states [272,619,624,628], the ligand field of each Mn ion [629,630] and the role of the Ca2+ ion in catalysis [631,632]. An interesting result is that even in the lowest state S0 of the Kok cycle no Mn2+ has been detected, resulting in Mn oxidation states of Mn4(III, III, III, IV) for S0, Mn4(III, III, IV, IV) for S1 and Mn4(III, IV, IV, IV) for S2 [633].
Recently, high field EPR has extended this detailed description of the electronic structure of the cofactor to the S3 state, the last metastable state of the catalytic cycle prior to O-O bond formation and the release of O2. This state is challenging to study as the cofactor carries an even number of unpaired electrons and thus displays an integer ground spin state. An earlier X-band EPR study resolved a very broad EPR signal for the S3 state and postulated that the cofactor in this state has a ground spin state of Seff = 3 [634]. Recent pulse W-band EPR experiments (Figure 15c) have corroborated this assignment [635], and proved by a Rabi nutation experiment that the spin ground state is S = 3. Additional 55Mn EDNMR experiments at W-band also showed that in S3 all Mn ions are in the Mn4+ state Mn4(IV,IV,IV,IV) and are octahedrally coordinated [635]. This requires that a sixth ligand is binding to the open coordination site of the Mn3+ in S2 when it is oxidized. This ligand is most probably the second substrate water molecule which also loses a proton in the S2 to S3 transition [635]. The elusive S4 state could not be trapped and characterized so far.
8.4. Substrate Binding to the OEC
The OEC represents a genuine molecular catalyst with only two sites for substrate binding, resulting in single product formation, namely triplet O2, avoiding generation of other reactive oxygen species as H2O2, HO2− or O2•−. While the exact sites of water binding are still debated, the kinetics of binding are well understood. They have been determined by time-resolved membrane-inlet mass spectrometry (MIMS) studies, which employ a rapid jump in H218O concentration within specific laser flash sequences [616]. These experiments have identified a possible role for Ca2+ in the binding of one water substrate, as substrate binding is influenced by chemical Ca2+/Sr2+ exchange. Similarly, these experiments established that the two substrate molecules bind at separate sites, as their exchange rates vary independently with Si state. The slower exchanging substrate water (WS) can be detected in all Si states suggesting it binds earlier in the S-state cycle (S0), while the faster exchanging substrate (Wf) has only been resolved in the S2 and S3-states. FTIR measurements support these findings, suggesting that one water molecule, possibly Wf, binds during the S2 → S3 transition [636]. Water binding has been indicated in the S-state cycle in Figure 14.
High field EPR spectroscopy is a powerful tool for determining the identity (H2O/OH−/O2−) and location of water-derived species bound at or in the vicinity of the Mn4OxCa cluster. This can be achieved via the detection of the coupling of magnetic nuclei, 1H/2H (I = 1/2, 1) or 17O (I = 5/2), to the Seff = 1/2 states (S0, S2) of the Mn4OxCa cluster. Recently, we have addressed this question using high-field 17O-EDNMR [273] observing exchangeable 17O “water” signals. It is stressed that this experiment needs to be performed at high field (W-band) owing to the blind spot limitations at lower fields (X- and Q-band). Importantly, the induction of these 17O signals—the rate with which the bulk solvent water (H217O) exchanged with the bound Mn-16O species—occurred on the same timescale as observed in the mass spectrometry experiment. The 17O EDNMR at 94 GHz is shown in Figure 16a. The spectral analysis of the spectra yielded three different 17O hyperfine couplings. These were assigned by comparison with 17O labeled model complexes to (i) a μ-oxo bridge (green); (ii) terminal MnA-OH/OH2 (orange); and (iii) Ca/2nd shell—OH/H2O ligands (purple). Orientation selection in EPR allowed assignment of the exchangeable μ-oxo bridge to either O4 or O5 (Figure 16b). A similar μ-oxo bridge signal was observed in Q-band 17O-ENDOR experiments [637], at significantly lower S/N. Earlier low-frequency FTIR spectroscopy supports the above hypothesis that the OEC contains an exchangeable μ2-oxo or μ3-oxo bridge [638]. The demonstration that a Mn μ-oxo bridge of the OEC can exchange on a timescale similar to that of the substrate is novel. Model compounds do not show fast exchange of µ-oxo bridges, probably because they lack several features provided by the protein matrix such as acid/base functions. A final assignment of the strongly coupled oxygen to O5 came from Ca/Sr exchange experiments [273] and ammonia binding studies [639]. The dynamic nature of the O5 bridge observed in our studies on the S2 state [640] (Figure 17) and in the crystal structure [608] also supports the assignment of the exchangeable oxygen to this “reactive” O5.
Recent 17O EDNMR studies of H217O binding to the S0 state found that in this state O5 is protonated (OH-), suggesting the first substrate water is binding immediately after O2 release in the S4 → S0 transition and in the process loses a proton [641]. As discussed above, the high field EPR data [635] strongly suggests that the second substrate water binds in the S2 → S3 transition, leading to two oxygens (O5 and O6) in close proximity to each other in the “burning chamber” of the enzyme. Recently X-ray crystallographic (XFEL) results obtained for the S3 state [531], support this finding and have been further confirmed in a very recent publication by Kern et al. [642]. These important spectroscopic and crystallographic results support the notion that two substrate water molecules represent Mn bound oxygens and favor a radical type coupling mechanism as proposed by Siegbahn (see below, Figure 17).
8.5. Conclusion and Future Challenges in Biological Water Oxidation
Advanced EPR techniques have contributed strongly to our understanding of the electronic structure (oxidation and spin states of the metal ions) of the OEC in different states of the S cycle and to the binding of water, and O2 formation. However, there are still many challenges to be tackled. One pertinent open question is the structure of the elusive S4 state. A possible stabilization and characterization of this state would finally complete our knowledge of the S states of the Kok cycle. A missing key experiment is further the detection of the 6th oxygen (17O) in the manganese cluster by EPR to support the recent crystallographic XFEL data of the S3 state [535,642]. This could in principle be done by using H217O in combination with W-band 17O EDNMR on the S3 state. Furthermore, the determination of the water binding kinetics should be followed for all state transitions by rapid freeze quench techniques, also using H217O combined with 17O EDNMR detection. First experiments along these lines have successfully been performed in our laboratory. The exchange of certain amino acids in the vicinity of the OEC could shed light on the fine-tuning of its electronic structure in the S state cycle and would be important to understand its high turnover frequency of about 500 s−1, see Figure 14b. It is remarkable that the OEC within its limited lifetime of only 30 min under normal light conditions performs about 106 catalytic cycles. A great challenge for chemists working in the field of water oxidation is the understanding and modeling of the sophisticated mechanism by which PS II repairs photo-damage of the protein subunit D1 [645], which carries both the pigments of the electron-transfer chain and the manganese cluster. In this context the formation of the manganese cluster in the protein is of great interest—also for (bio)inorganic chemists who are interested to understand and synthesize a functional water splitting unit in chemical model systems.
9. Conclusions
During the last two decades, the science community has witnessed a boost of new and exciting EPR applications in chemistry, biology and physics. This is largely due to technological breakthroughs in the development of pulsed microwave sources and components for frequencies up to several hundred GHz, sweepable cryomagnet design and ultra-fast data-acquisition and data-handling instrumentation. It enables the EPR spectroscopists to introduce multiple-pulse microwave irradiation schemes at very high Zeeman fields—very much in analogy to what is common practice in modern NMR spectroscopy. Advanced EPR in all its facets offers new powerful tools for determining structure-dynamics-function relations of large disordered biosystems and transient intermediates with lifetimes as short as tens of nanoseconds that can be observed in their working states on biologically relevant timescales.
The enduring growth of modern EPR and how it is reflected in terms of the number of EPR research groups in Europe, the USA, Japan and other parts of the Asia-Pacific region, the number of national and international specialized EPR symposia and advanced cross-border EPR schools as well as interdisciplinary research programs with exciting international cooperation projects. There exist regular schools for advanced EPR, such as those of the European Federation of EPR Groups (EF-EPR, see, www.physics.ua.ac.be/EFEPR/). The first EF-EPR school was in Caorle, Italy, in 1999. This was followed by the schools in Retie, Belgium (2002), in Wiesbaden, Germany (2005), in St Andrews, UK (2008), in Konstanz, Germany (2010), in Rehovot, Israel (2013) and in Berlin, Germany (2015).
Such a growth of the advanced EPR community was made possible by sustaining financial support from national and international funding agencies. For example, the European Union supported the Human Capital and Mobility (HCM) project “High-Field EPR: Technology and Applications” (Coordinator J. Schmidt, Leiden, 1993–1996), and the DFG (Deutsche Forschungsgemeinschaft) granted exceptionally strong support through the Priority Programmes 1051 “High-Field EPR in Biology, Chemistry and Physics” (Coordinator K. Möbius, Berlin, 1998–2004) and 1601 “New Frontiers in Sensitivity for EPR Spectroscopy: From Biological Cells to Nano Materials” (Coordinator M. Bennati, Göttingen, funded since 2012, see, www.spp1601.de/).
There can be no doubt that in the area of (bio)molecular spectroscopy the visibility of EPR in relation to NMR has strongly increased, and our working hypothesis, “EPR meets NMR at high magnetic fields”, appears to be justified. This perception is probably also due to the existence of international EPR societies and their dissemination activities. As examples, we mention here only ISMAR (International Society for Magnetic Resonance, see, www.weizmann.ac.il/ISMAR/) and IES (International EPR (ESR) Society, see, www.ieprs.org/). In particular the EPR Newsletter of IES (editor L.V. Mosina, see www.epr-newsletter.ethz.ch/) has matured to a valuable professional publication of new information about worldwide EPR activities as well as essays by competent authors on magnetic-resonance history. And with theme-centered articles written by leading experts in the field such as, for instance, Pros and Cons of Pulse Dipolar ESR: DQC & DEER by P.P. Borbat and J.H. Freed [37] or Animal Detected Magnetic Resonance by P.J. Hore [646], or Dynamic Nuclear Polarization at High Magnetic Fields by T. Prisner [647].
There is a strong international competition between large-scale national facilities for high- and ultrahigh magnetic field NMR spectroscopy located, for example, in the UK, Germany, France, The Netherlands, Italy, and USA. To maintain a worldwide top position in ultrahigh-field NMR (and EPR!) research, development and application, it is imperative to host leading-edge instrumentation with its associated infrastructure for supporting the active scientists involved, often coming as short-term visitors for joint projects.
An illustrative example for how fast a leading position in the internatonal competition in ultrahigh-field magnetic resonance can be lost because of underfunding is the situation in the UK: As is openly discussed in the magnetic-resonance community, the UK has temporarily fallen behind its previous international competitive power both in capacity and capability. The probable reason is underinvestment in advanced NMR instrumentation for over a decade preventing to purchase the next generation of ultrahigh field NMR equipment. The hope is that the public funding institutions for research and development will quickly react and set the right priorities to enable NMR, MRI (and EPR) to continue their triumph in modern analytical and medical sciences. Innovation and commercialization, these were always the key ingredients of the development of magnetic resonance applications. The NMR, MRI and EPR markets have always been dominated by a limited number of physical research laboratories and small dedicated companies. Their creative activities cannot be arbitrarily switched on or off—with any switch of governmental politics. This fact has many confirmations in the history of fundamental and applied sciences. In this relation, to cheer you up by some optimistic views on the future of ultrahigh field magnetic resonance, it is comforting to read the appraisals of Ewald Moser et al. [648] on the role of magnet technology to increase sensitivity and specificity.
To sum up, we will reemphasize a few points:
- -
- New developments in pulsed microwave and sweepable cryomagnet technology as well as ultrafast electronics for signal data handling and processing have pushed the limits of modern EPR spectroscopy to the mm- and sub-mm wavelength and 15 T Zeeman field regions. Sub-micromolar concentrations of paramagnetic molecules such as nitroxide spin-labeled protein complexes have become sufficient to characterize reaction intermediates—offering new application possibilities in biochemistry and molecular biology [17,28,29]. Moreover, for multifrequency EPR experiments on frozen solutions typical sample volumes are 250 μL (S-band), 150 μL (X-band), 10 μL (Q-band) and 1 μL (W-band), see [649,650,651,652,653]. This is orders of magnitude better than the sample volume requirements for modern NMR spectroscopy.
- -
- Modern multifrequency EPR methods, in particular at high magnetic fields and microwave frequencies, provide unique information on structure and dynamics of stable and transient radicals and radical pairs occurring in chemical and biological processes. Optimized time windows can be selected by the multifrequency EPR approach to disentangle different modes of motion at biologically relevant timescales.
- -
- Compared to optical spectroscopy, both NMR and EPR, notoriously suffer from low detection sensitivity, in fact NMR much more than EPR (by a factor of 106). Hence, both techniques strive for “quantum transformation” in a double-resonance experiment by which the radiofrequency or microwave quanta absorbed at resonance are not detected directly but rather by their effect on a coupled quantum system of higher energy [653,654,655]. For this strategy, ENDOR is a paradigmatic example.
- -
- A different strategy for sensitivity enhancement is taking advantage of spin-polarization effects on a nuclear-spin system by a coupled electron-spin system. Powerful polarizing mechanisms are, for instance, CIDNP, CIDEP; they cover a wide field of research and applications. The key references of original and overview articles and books in the literature of this field are just too many to be cited here. From the numerous review articles and monographs published over recent decades we give only a few examples which we found useful, such as [132,656,657,658,659,660,661]. A recent illuminating research article by Michael Wasielewski and coworkers on spin polarization transfer by the radical pair mechanism [661] contains a representative list of refrences with leading citations included.
- -
- Many organic cofactors in electron-transfer proteins have only small g anisotropies and, hence, to resolve the canonical g-tensor orientations in disordered samples such as frozen solutions much higher magnetic fields are required than available in X-band EPR. Thereby, orientation-selective hydrogen bonding and polar interactions in the protein binding sites can be traced by high-field EPR, which provides information complementary to what is available from high-resolution X-ray crystallography.
- -
- Organic radicals are often generated as transient intermediates during photoinitiated processes in proteins. To identify and distinguish them by the small differences in their g-factors and hyperfine interactions, time-resolved high-field EPR becomes the method of choice for elucidating reaction pathways.
- -
- Pulse EPR techniques for solid-state applications have come to the fore and can provide details of weak electron–electron or electron–nuclear couplings and their orientational dependence—even in disordered powder samples or glasses. State-of-the-art pulse high-field EPR spectrometers at 94 GHz offer single nanoseconds length π/2 pulses and short dead-times with GHz detection bandwidths permitting multi-dimensional, multi-resonance experiments at the 1 μM concentration level.
- -
- PELDOR, ENDOR, ESEEM or EDNMR at high Zeeman fields take additional advantage of the orientation selection of molecular sub-ensembles in powder or frozen-solution samples. Thereby, even in the case of small g anisotropies, these techniques can provide single-crystal-like information about electron dipolar and electron–nuclear hyperfine interactions, including the directions of interspin dipolar axes in coupled radical pairs and hydrogen bonds to cofactors in the protein.
- -
- In metallo-protein high-spin systems, such as the Mn2+ or Co2+ proteins, the EPR spectrum analysis can be drastically simplified at high Zeeman fields due to the suppression of second-order effects. This is also accompanied by a considerable increase in sensitivity. In case of large zero-field splittings, EPR transitions might not be observable at all at X-band, but become accessible at higher quantum energies of mm or sub-mm microwaves.
- -
- High-field EPR noticeably extends the applicability of the site-directed spin-labeling technique, which was originally combined with X-band EPR. Owing to the spectral resolution of both the g-tensor and hyperfine-tensor components of nitroxide spin probes, polarity and proticity profiles of the protein microenvironment can be identified, for example in transmembrane channel proteins.
- -
- High-field EPR/high-frequency instrumentation development will remain a challenging task. This specifically refers to sufficient output power of mm and sub-mm microwave sources for fast ns pulsing. Ultrahigh-field magnet technology improvements will continue to play a decisive role in this endeavor. We concur with the assessment of a reviewer of this paper stating that “EPR is on a journey and the next ten years will see a push to the very highest fields and frequencies, partly led by advances in mm-wave/THz technology”.
- -
- Both the NMR and EPR communities are driven by the same motivation—to understand spin interactions in complex systems for revealing their structure and dynamics—be it from the viewpoint of materials science, or biological or medical sciences. The big issues in the natural and life sciences—environment, sustainable energy, health and disease, food and water—ask for the best of all methodologies to apply, including EPR and NMR. Success of contributions to such big issues will rely on the design of new magnetic-resonance experiments “off the beaten track” as well as on in-depth theoretical analyses of the experimental results on the basis of modern quantum-chemical methodologies.
Browsing through Web of Science reveals that the enthusiasm of the scientists working in the area of ultrahigh field NMR spectroscopy (and high-field EPR spectroscopy) seems to be undaunted. As for specialized scientific meetings, for example, the workshop “Ultrahigh field NMR spectroscopy: challenges and new horizons” is scheduled for 19 November 2018, at the University of Lille, France. It will be organized (and sponsored) by the French CNRS Research Infrastructure “Magnetic Nuclear Resonance, Very High Fields”. The workshop aims at presenting the potential of high-field NMR spectroscopy in chemistry, materials science and biology and the new horizons opened by the advent of high-resolution NMR magnets with 1H Larmor frequency higher than 1 GHz. Incidentally, in this frequency range low-field L- and S-band EPR are still being used successfully, for example, in specific PELDOR experiments [662] or in vivo EPR imaging [663]. Apparently, time has come that indeed biomolecular EPR meets NMR at high magnetic fields and resonance frequencies—and thus do the related technologies involved. Current interests in both communities are the protein dynamics playing a role for enzymatic function as well as protein–matrix interactions—and the methods for their respective elucidation both in solid and liquid solution samples. Hence, it is not surprising that the research topics addressed in job advertisements and announcements of vacancies for graduate students sound rather similar in both areas: characterization of proteins or DNA complexes in terms of molecular structure, dynamics and function.
Author Contributions
The manuscript was written through contributions of all authors; K.M., W.L., N.C. and A.S. contributed equally to the manuscript. All authors have given approval to the final version of the manuscript.
Funding
Financial support of the work described was granted primarily by the Deutsche Forschungsgemeinschaft, mainly in the frame of the Cluster of Excellence RESOLV (EXC 1069), the Priority Program SPP 1051 “High-field EPR in Biology, Chemistry and Physics”, the Collaborative Research Center SFB 498 “Protein-Cofactor Interactions in Biological Processes”, and the Group Project MO 132/19-2 “Protein Action Observed by Advanced EPR”. The authors are also grateful for support of the Max Planck Society and the Free University of Berlin (KM).
Acknowledgments
Over the years, numerous coworkers—students, postdocs, and colleagues—from different parts of the world have contributed to our interdisciplinary high-field EPR work on proteins who are named in the cited references. To all of them we want to express our gratitude and appreciation. We are also grateful to the reviewers for their constructive criticism of this manuscript.
Conflicts of Interest
The authors declare no competing financial interest.
References
- Möbius, K.; Lubitz, W.; Savitsky, A. High-field EPR on membrane proteins—Crossing the gap to NMR. Prog. Nucl. Magn. Reson. Spectrosc. 2013, 75, 1–49. [Google Scholar] [CrossRef] [PubMed]
- Schweiger, A.; Jeschke, G. Principles of Pulse Electron Paramagnetic Resonance; Oxford University Press: Oxford, UK, 2001. [Google Scholar]
- Neuhaus, D.; Bodenhausen, G.; Gadian, D.; Meier, B.; Morris, G. Fifty years of “progress in NMR spectroscopy”—An editorial from the present editorial board. Prog. Nucl. Magn. Reson. Spectrosc. 2016, 94–95, A1–A2. [Google Scholar] [CrossRef] [PubMed]
- Feeney, J.; Emsley, J.W. Forty years of Progress in Nuclear Magnetic Resonance Spectroscopy. Prog. Nucl. Magn. Reson. Spectrosc. 2007, 50, 179–198. [Google Scholar]
- Meirovitch, E.; Shapiro, Y.E.; Pohmeno, A.; Freed, J.H. Structural dynamics of bio-macromolecules by NMR: The slowly relaxing local structure approach. Prog. Nucl. Magn. Reson. Spectrosc. 2010, 56, 360–405. [Google Scholar] [CrossRef] [PubMed] [Green Version]
- Jeschke, G. Conformational dynamics and distribution of nitroxide spin labels. Prog. Nucl. Magn. Reson. Spectrosc. 2013, 72, 42–60. [Google Scholar] [CrossRef] [PubMed] [Green Version]
- Griesinger, C.; Bennati, M.; Vieth, H.M.; Luchinat, C.; Parigi, G.; Hoefer, P.; Engelke, F.; Glaser, S.J.; Denysenkov, V.; Prisner, T.F. Dynamic nuclear polarization at high magnetic fields in liquids. Prog. Nucl. Magn. Reson. Spectrosc. 2012, 64, 4–28. [Google Scholar] [CrossRef] [PubMed]
- Webb, A. Cavity- and waveguide-resonators in electron paramagnetic resonance, nuclear magnetic resonance, and magnetic resonance imaging. Prog. Nucl. Magn. Reson. Spectrosc. 2014, 83, 1–20. [Google Scholar] [CrossRef] [PubMed]
- Ivanov, K.L.; Pravdivtsev, A.N.; Yurkovskaya, A.V.; Vieth, H.M.; Kaptein, R. The role of level anti-crossings in nuclear spin hyperpolarization. Prog. Nucl. Magn. Reson. Spectrosc. 2014, 81, 1–36. [Google Scholar] [CrossRef] [PubMed]
- Suter, D.; Jelezko, F. Single-spin magnetic resonance in the nitrogen-vacancy center of diamond. Prog. Nucl. Magn. Reson. Spectrosc. 2017, 98–99, 50–62. [Google Scholar] [CrossRef] [PubMed]
- De Boer, E.; Van Willigen, H. Nuclear magnetic resonance of paramagnetic systems. Prog. Nucl. Magn. Reson. Spectrosc. 1967, 2, 111–161. [Google Scholar] [CrossRef]
- Mar, G.N.L. Nuclear Magnetic Resonance of Paramagnetic Macromolecules; Kluwer Academic Publishers: Dordrecht, The Netherlands, 1995. [Google Scholar]
- Ubbink, M.; Worrall, J.A.R.; Canters, G.W.; Groenen, E.J.J.; Huber, M. Paramagnetic resonance of biological metal centers. Annu. Rev. Biophys. Biomol. Struct. 2002, 31, 393–422. [Google Scholar] [CrossRef] [PubMed]
- Bertini, I.; Luchinat, C.; Parigi, G.; Pierattelli, R. Perspectives in paramagnetic NMR of metalloproteins. Dalton Trans. 2008, 3782–3790. [Google Scholar] [CrossRef] [PubMed]
- Otting, G. Protein NMR using paramagnetic ions. Annu. Rev. Biophys. 2010, 39, 387–405. [Google Scholar] [CrossRef] [PubMed]
- Su, X.-C.; Otting, G. Paramagnetic labelling of proteins and oligonucleotides for NMR. J. Biomol. NMR 2009, 46, 101–112. [Google Scholar] [CrossRef] [PubMed]
- Möbius, K.; Savitsky, A. High-Field EPR Spectroscopy on Proteins and Their Model Systems: Characterization of Transient Paramagnetic States; RSC Publishing: London, UK, 2009; p. 385. [Google Scholar]
- Bertini, I.; Luchinat, C.; Parigi, G.; Ravera, E. NMR of Paramagnetic Molecules, 2nd ed.; Elsevier: Boston, MA, USA, 2017. [Google Scholar]
- Berliner, L.J.; Eaton, S.S.; Eaton, G.R. Distance Measurements in Biological Systems by EPR, Biological Magnetic Resonance; Kluwer: New York, NY, USA, 2002; Volume 19. [Google Scholar]
- Song, Y.; Meade, T.J.; Astashkin, A.V.; Klein, E.L.; Enemark, J.H.; Raitsimring, A. Pulsed dipolar spectroscopy distance measurements in biomacromolecules labeled with Gd(III) markers. J. Magn. Reson. 2011, 210, 59–68. [Google Scholar] [CrossRef] [PubMed] [Green Version]
- Kaminker, I.; Yagi, H.; Huber, T.; Feintuch, A.; Otting, G.; Goldfarb, D. Spectroscopic selection of distance measurements in a protein dimer with mixed nitroxide and Gd3+ spin labels. Phys. Chem. Chem. Phys. 2012, 14, 4355–4358. [Google Scholar] [CrossRef] [PubMed]
- Yagi, H.; Banerjee, D.; Graham, B.; Huber, T.; Goldfarb, D.; Otting, G. Gadolinium tagging for high-precision measurements of 6 nm distances in protein assemblies by EPR. J. Am. Chem. Soc. 2011, 133, 10418–10421. [Google Scholar] [CrossRef] [PubMed]
- Misra, S.K. Multifrequency Electron Paramagnetic Resonance: Theory and Applications; Wiley-VCH: Berlin, Germany, 2011. [Google Scholar]
- Rist, G.; Hyde, J.S. Ligand ENDOR of Cu-8-hydroxyquinolinate substituted into a single crystal and a powder of phthalimide. J. Chem. Phys. 1968, 49, 2449–2451. [Google Scholar] [CrossRef]
- Rist, G.; Hyde, J.S. Ligand ENDOR of Cu-8-hydroxyquinolinate substituted into organic single crystals. J. Chem. Phys. 1969, 50, 4532–4542. [Google Scholar] [CrossRef]
- Rist, G.; Hyde, J.S. Ligand ENDOR of metal complexes in powders. J. Chem. Phys. 1970, 52, 4633–4643. [Google Scholar] [CrossRef]
- Hoffman, B.M.; DeRose, V.J.; Doan, P.E.; Gurbiel, R.J.; Houseman, A.L.P.; Telser, J. Metalloenzyme active-site structure and function through multifrequency cw and pulsed ENDOR. In EMR of Paramagnetic Molecules; Berliner, L.J., Reuben, J., Eds.; Springer: Boston, MA, USA, 1993; pp. 151–218. [Google Scholar]
- Song, L.; Liu, Z.; Kaur, P.; Esquiaqui, J.M.; Hunter, R.I.; Hill, S.; Smith, G.M.; Fanucci, G.E. Toward increased concentration sensitivity for continuous wave EPR investigations of spin-labeled biological macromolecules at high fields. J. Magn. Reson. 2016, 265, 188–196. [Google Scholar] [CrossRef] [PubMed] [Green Version]
- Cruickshank, P.A.S.; Bolton, D.R.; Robertson, D.A.; Hunter, R.I.; Wylde, R.J.; Smith, G.M. A kilowatt pulsed 94 GHz electron paramagnetic resonance spectrometer with high concentration sensitivity, high instantaneous bandwidth, and low dead time. Rev. Sci. Instrum. 2009, 80, 103102. [Google Scholar] [CrossRef] [PubMed]
- Borbat, P.P.; Costa-Filho, A.J.; Earle, K.A.; Moscicki, J.K.; Freed, J.H. Electron spin resonance in studies of membranes and proteins. Science 2001, 291, 266–269. [Google Scholar] [CrossRef] [PubMed]
- Tsvetkov, Y.D.; Grishin, Y.A. Techniques for EPR spectroscopy of pulsed electron double resonance (PELDOR): A review. Instrum. Exp. Technnol. 2009, 52, 615–636. [Google Scholar] [CrossRef]
- Spindler, P.E.; Glaser, S.J.; Skinner, T.E.; Prisner, T.F. Broadband inversion PELDOR spectroscopy with partially adiabatic shaped pulses. Angew. Chem. Int. Ed. 2013, 52, 3425–3429. [Google Scholar] [CrossRef] [PubMed]
- Schiemann, O.; Prisner, T.F. Long-range distance determinations in biomacromolecules by EPR spectroscopy. Q. Rev. Biophys. 2007, 40, 1–53. [Google Scholar] [CrossRef] [PubMed]
- Jeschke, G. Determination of the nanostructure of polymer materials by electron paramagnetic resonance spectroscopy. Macromol. Rapid Commun. 2002, 23, 227–246. [Google Scholar] [CrossRef]
- Jeschke, G.; Polyhach, Y. Distance measurements on spin-labelled biomacromolecules by pulsed electron paramagnetic resonance. Phys. Chem. Chem. Phys. 2007, 9, 1895–1910. [Google Scholar] [CrossRef] [PubMed]
- Wegener, A.A.; Klare, J.P.; Engelhard, M.; Steinhoff, H.J. Structural insights into the early steps of receptor-transducer signal transfer in archaeal phototaxis. EMBO J. 2001, 20, 5312–5319. [Google Scholar] [CrossRef] [PubMed] [Green Version]
- Borbat, P.P.; Freed, J.H. Pros and cons of pulse dipolar ESR. EPR Newsl. 2007, 17, 21–33. [Google Scholar]
- Altenbach, C.; Kusnetzow, A.K.; Ernst, O.P.; Hofmann, K.P.; Hubbell, W.L. High-resolution distance mapping in rhodopsin reveals the pattern of helix movement due to activation. Proc. Natl. Acad. Sci. USA 2008, 105, 7439–7444. [Google Scholar] [CrossRef] [PubMed] [Green Version]
- Georgieva, E.R.; Ramlall, T.F.; Borbat, P.P.; Freed, J.H.; Eliezer, D. Membrane-bound alpha-synuclein forms an extended helix: Long-distance pulsed ESR measurements using vesicles, bicelles, and rodlike micelles. J. Am. Chem. Soc. 2008, 130, 12856–12857. [Google Scholar] [CrossRef] [PubMed]
- Zou, P.; Bortolus, M.; McHaourab, H.S. Conformational cycle of the ABC transporter msba in liposomes: Detailed analysis using double electron-electron resonance spectroscopy. J. Mol. Biol. 2009, 393, 586–597. [Google Scholar] [CrossRef] [PubMed]
- Grinberg, O.; Dubinskii, A.A. The early years. In Very High Frequency (VHF) ESR/EPR, Biological Magnetic Resonance; Grinberg, O., Berliner, L.J., Eds.; Kluwer/Plenum Publishers: New York, NY, USA, 2004; Volume 22, pp. 1–15. [Google Scholar]
- Lebedev, Y.S. Very high-field EPR. In Foundations of Modern EPR; Eaton, S.S., Salikhov, K.M., Eds.; World Scientific: Singapore, 1998; p. 731. [Google Scholar]
- Lebedev, Y.S. High-frequency continuous-wave electron spin resonance. In Modern Pulsed and Continuous-Wave Electron Spin Resonance; Kevan, L., Bowman, M.K., Eds.; John Wiley: New York, NY, USA, 1990; pp. 365–404. [Google Scholar]
- Haindl, E.; Möbius, K.; Oloff, H. A 94 GHz electron-paramagnetic-res spectrometer with fabry-perot resonator. Zeitschrift für Naturforschung A 1985, 40, 169–172. [Google Scholar] [CrossRef]
- Burghaus, O.; Rohrer, M.; Götzinger, T.; Plato, M.; Möbius, K. A novel high-field high-frequency EPR and ENDOR spectrometer operating at 3 mm wavelength. Meas. Sci. Technol. 1992, 3, 765–774. [Google Scholar] [CrossRef]
- Weber, R.T.; Disselhorst, J.; Prevo, L.J.; Schmidt, J.; Wenckebach, W.T. Electron spin-echo spectroscopy at 95 GHz. J. Magn. Reson. 1989, 81, 129–144. [Google Scholar] [CrossRef]
- Allgeier, J.; Disselhorst, J.A.J.M.; Weber, R.T.; Wenckebach, W.T.; Schmidt, J. High-frequency pulsed electron spin resonance. In Modern Pulsed and Continuous-Wave Electron Spin Resonance; Kevan, L., Bowman, M.K., Eds.; John Wiley: New York, NY, USA, 1990; pp. 267–283. [Google Scholar]
- Burghaus, O.; Toth-Kischkat, A.; Klette, R.; Möbius, K. Proton ENDOR at a microwave frequency of 97 GHz. J. Magn. Reson. 1988, 80, 383–388. [Google Scholar] [CrossRef]
- Prisner, T.F.; Rohrer, M.; Möbius, K. Pulsed 95-GHz, high-field EPR heterodyne spectrometer with high spectral and time resolution. Appl. Magn. Reson. 1994, 7, 167–183. [Google Scholar] [CrossRef]
- Disselhorst, J.A.J.M.; van der Meer, H.; Poluektov, O.G.; Schmidt, J. A pulsed EPR and ENDOR spectrometer operating at 95 GHz. J. Magn. Reson. A 1995, 115, 183–188. [Google Scholar] [CrossRef]
- Prisner, T.F.; Un, S.; Griffin, R.G. Pulsed ESR at 140 GHz. Isr. J. Chem. 1992, 32, 357–363. [Google Scholar] [CrossRef]
- Prisner, T.F. Pulsed high frequency/high-field EPR. Adv. Magn. Opt. Reson. 1997, 20, 245–299. [Google Scholar]
- Rohrer, M.; Brugmann, O.; Kinzer, B.; Prisner, T.F. High-field/high-frequency EPR spectrometer operating in pulsed and continuous-wave mode at 180 GHz. Appl. Magn. Reson. 2001, 21, 257–274. [Google Scholar] [CrossRef]
- Smith, G.M.; Lesurf, J.C.G.; Mitchell, R.H.; Riedi, P.C. Quasi-optical cw mm-wave electron spin resonance spectrometer. Rev. Sci. Instrum. 1998, 69, 3924–3937. [Google Scholar] [CrossRef]
- Lynch, W.B.; Earle, K.A.; Freed, J.H. 1-mm wave electron-spin-resonance spectrometer. Rev. Sci. Instrum. 1988, 59, 1345–1351. [Google Scholar] [CrossRef]
- Fuchs, M.R.; Prisner, T.F.; Möbius, K. A high-field/high-frequency heterodyne induction-mode electron paramagnetic resonance spectrometer operating at 360 GHz. Rev. Sci. Instrum. 1999, 70, 3681–3683. [Google Scholar] [CrossRef]
- Muller, F.; Hopkins, M.A.; Coron, N.; Grynberg, M.; Brunel, L.C.; Martinez, G. A high magnetic-field EPR spectrometer. Rev. Sci. Instrum. 1989, 60, 3681–3684. [Google Scholar] [CrossRef]
- Reijerse, E.; Schmidt, P.P.; Klihm, G.; Lubitz, W. A cw and pulse EPR spectrometer operating at 122 and 244 GHz using a quasi-optical bridge and a cryogen-free 12 T superconducting magnet. Appl. Magn. Reson. 2007, 31, 611–626. [Google Scholar] [CrossRef]
- Fuchs, M. A High-Field/High-Frequency Electron Paramagnetic Resonance Spectrometer (360 GHz/14 T). Ph.D. Thesis, Free Universty Berlin, Berlin, Germany, 1999. [Google Scholar]
- Schnegg, A.; Dubinskii, A.A.; Fuchs, M.R.; Grishin, Y.A.; Kirilina, E.P.; Lubitz, W.; Plato, M.; Savitsky, A.; Möbius, K. High-field EPR, ENDOR and eldor on bacterial photosynthetic reaction centers. Appl. Magn. Reson. 2007, 31, 59–98. [Google Scholar] [CrossRef]
- Fuhs, M.; Möbius, K. Pulsed-high field/high-frequency EPR spectroscopy. In High Magnetic Fields: Applications in Condensed Matter Physics and Spectroscopy; Berthier, C., Lévy, L.P., Martinez, G., Eds.; Springer: Berlin/Heidelberg, Germany, 2001; pp. 476–493. [Google Scholar]
- Schnegg, A. High-Field EPR on Electrontransfer Proteins. Ph.D. Thesis, Free Universty Berlin, Berlin, Germany, 2003. [Google Scholar]
- Grishin, Y.A.; Fuchs, M.R.; Schnegg, A.; Dubinskii, A.A.; Dumesh, B.S.; Rusin, F.S.; Bratman, V.L.; Möbius, K. Pulsed orotron—A new microwave source for submillimeter pulse high-field electron paramagnetic resonance spectroscopy. Rev. Sci. Instrum. 2004, 75, 2926–2936. [Google Scholar] [CrossRef]
- Fuchs, M.R.; Schleicher, E.; Schnegg, A.; Kay, C.W.M.; Törring, J.T.; Bittl, R.; Bacher, A.; Richter, G.; Möbius, K.; Weber, S. G-tensor of the neutral flavin radical cofactor of DNA photolyase revealed by 360-GHz electron paramagnetic resonance spectroscopy. J. Phys. Chem. B 2002, 106, 8885–8890. [Google Scholar] [CrossRef]
- Weber, S.; Kay, C.W.M.; Mögling, H.; Möbius, K.; Hitomi, K.; Todo, T. Photoactivation of the flavin cofactor in xenopus laevis (6–4) photolyase: Observation of a transient tyrosyl radical by time-resolved electron paramagnetic resonance. Proc. Natl. Acad. Sci. USA 2002, 99, 1319–1322. [Google Scholar] [CrossRef] [PubMed]
- Schnegg, A.; Kay, C.W.M.; Schleicher, E.; Hitomi, K.; Todo, T.; Möbius, K.; Weber, S. The G-tensor of the flavin cofactor in (6–4) photolyase: A 360 GHz/12.8 T electron paramagnetic resonance study. Mol. Phys. 2006, 104, 1627–1633. [Google Scholar] [CrossRef]
- Okafuji, A.; Schnegg, A.; Schleicher, E.; Möbius, K.; Weber, S. G-tensors of the flavin adenine dinucleotide radicals in glucose oxidase: A comparative multifrequency electron paramagnetic resonance and electron-nuclear double resonance study. J. Phys. Chem. B 2008, 112, 3568–3574. [Google Scholar] [CrossRef] [PubMed]
- Fuchs, M.R.; Schnegg, A.; Plato, M.; Schulz, C.; Müh, F.; Lubitz, W.; Möbius, K. The primary donor cation p+· in potosynthetic reaction centers of site-directed mutants of Rhodobacter sphaeroides: G-tensor shifts revealed by high-field EPR at 360 GHz/12.8 T. Chem. Phys. 2003, 294, 371–384. [Google Scholar] [CrossRef]
- Möbius, K.; Goldfarb, D. High-field/high-frequency electron paramagnetic resonance involving single- and multiple-transition schemes. In Biophysical Techniques in Photosynthesis, Vol. II; Aartsma, T.J., Matysik, J., Eds.; Springer: Dordrecht, The Netherlands, 2008; pp. 267–304. [Google Scholar]
- Misra, S.K.; Möbius, K.; Savitsky, A. Multifrequency EPR on photosynthetic systems. In Multifrequency Electron Paramagnetic Resonance; Misra, S.K., Ed.; Wiley-VCH: Berlin, Germany, 2011; pp. 875–911. [Google Scholar]
- Möbius, K.; Savitsky, A.; Fuchs, M. Primary processes in photosynthesis: What do we learn from high-field EPR spectroscopy? In Very High Frequency (VHF) ESR/EPR, Biological Magnetic Resonance Vol. 22; Grinberg, O.Y., Berliner, L.J., Eds.; Springer: Boston, MA, USA, 2004; pp. 45–93. [Google Scholar]
- Möbius, K.; Schnegg, A.; Plato, M.; Fuchs, M.R.; Savitsky, A. High-field EPR spectroscopy on transfer proteins in biological action. Acta Phys. Pol. A 2005, 108, 215–234. [Google Scholar] [CrossRef]
- Galkin, A.A.; Grinberg, O.Y.; Dubinskii, A.A.; Kabdin, N.N.; Krymov, V.N.; Kurochkin, V.I.; Lebedev, Y.S.; Oranskii, L.F.; Shuvalov, V.F. EPR spectrometer in 2-mm range for chemical-research. Instrum. Exp. Tech. 1977, 20, 1229. [Google Scholar]
- Bresgunov, A.Y.; Dubinskii, A.A.; Krimov, V.N.; Petrov, Y.G.; Poluektov, O.G.; Lebedev, Y.S. Pulsed EPR in 2-mm band. Appl. Magn. Reson. 1991, 2, 715–728. [Google Scholar] [CrossRef]
- van der Meer, H.J.; Disselhorst, J.A.J.M.; Allgeier, J.; Schmidt, J.; Wenckebach, W.T. A low-temperature insert for a 95 GHz electron-spin-echo spectrometer. Meas. Sci. Technol. 1990, 1, 396–400. [Google Scholar] [CrossRef]
- Schmalbein, D.; Maresch, G.G.; Kamlowski, A.; Höfer, P. The bruker high-frequency-EPR system. Appl. Magn. Reson. 1999, 16, 185–205. [Google Scholar] [CrossRef]
- Wang, W.; Belford, R.L.; Clarkson, R.B.; Davis, P.H.; Forrer, J.; Nilges, M.J.; Timken, M.D.; Walczak, T.; Thurnauer, M.C.; Norris, J.R.; et al. Very high-frequency EPR-94 GHz instrument and applications to primary reaction centers from photosynthetic red bacteria and to other disordered-systems. Appl. Magn. Reson. 1994, 6, 195–215. [Google Scholar] [CrossRef]
- Nilges, M.J.; Smirnov, A.I.; Clarkson, R.B.; Belford, R.L. Electron paramagnetic resonance w-band spectrometer with a low-noise amplifier. Appl. Magn. Reson. 1999, 16, 167–183. [Google Scholar] [CrossRef]
- Gromov, I.; Krymov, V.; Manikandan, P.; Arieli, D.; Goldfarb, D. A W-band pulsed ENDOR spectrometer: Setup and application to transition metal centers. J. Magn. Reson. 1999, 139, 8–17. [Google Scholar] [CrossRef] [PubMed]
- Hofbauer, W.; Earle, K.A.; Dunnam, C.R.; Moscicki, J.K.; Freed, J.H. High-power 95 GHz pulsed electron spin resonance spectrometer. Rev. Sci. Instrum. 2004, 75, 1194–1208. [Google Scholar] [CrossRef]
- Brutlach, H.; Bordignon, E.; Urban, L.; Klare, J.P.; Reyher, H.J.; Engelhard, M.; Steinhoff, H.J. High-field EPR and site-directed spin labeling reveal a periodical polarity profile: The sequence 88 to 94 of the phototransducer NpHtrII in complex with sensory rhodopsin, NpSRII. Appl. Magn. Reson. 2006, 30, 359–372. [Google Scholar] [CrossRef]
- Hyde, J.S.; Froncisz, W.; Sidabras, J.W.; Camenisch, T.G.; Anderson, J.R.; Strangeway, R.A. Microwave frequency modulation in cw EPR at W-band using a loop-gap resonator. J. Magn. Reson. 2007, 185, 259–263. [Google Scholar] [CrossRef] [PubMed]
- Hill, S.; Dalal, N.S.; Brooks, J.S. A multifrequency-resonator-based system for high-sensitivity high-field EPR investigations of small single crystals. Appl. Magn. Reson. 1999, 16, 237–245. [Google Scholar] [CrossRef]
- Reijerse, E.J.; van Dam, P.J.; Klaassen, A.A.K.; Hagen, W.R.; van Bentum, P.J.M.; Smith, G.M. Concepts in high-frequency EPR—Applications to bio-inorganic systems. Appl. Magn. Reson. 1998, 14, 153–167. [Google Scholar] [CrossRef]
- Dorlet, P.; Seibold, S.A.; Babcock, G.T.; Gerfen, G.J.; Smith, W.L.; Tsai, A.L.; Un, S. High-field EPR study of tyrosyl radicals in prostaglandin H-2 synthase-1. Biochemistry 2002, 41, 6107–6114. [Google Scholar] [CrossRef] [PubMed]
- Gunn, A.; Brynda, M.; Britt, R.D. Construction of laboratory built D-band (130 GHz) pulsed and cw EPR spectrometer. Abstr. Pap. Am. Chem. Soc. 2005, 229, U751. [Google Scholar]
- Stich, T.A.; Lahiri, S.; Yeagle, G.; Dicus, M.; Brynda, M.; Gunn, A.; Aznar, C.; DeRose, V.J.; Britt, R.D. Multifrequency pulsed EPR studies of biologically relevant manganese(II) complexes. Appl. Magn. Reson. 2007, 31, 321–341. [Google Scholar] [CrossRef] [PubMed]
- Bennati, M.; Farrar, C.T.; Bryant, J.A.; Inati, S.J.; Weis, V.; Gerfen, G.J.; Riggs-Gelasco, P.; Stubbe, J.; Griffin, R.G. Pulsed electron-nuclear double resonance (ENDOR) at 140 GHz. J. Magn. Reson. 1999, 138, 232–243. [Google Scholar] [CrossRef] [PubMed]
- Becerra, L.R.; Gerfen, G.J.; Bellew, B.F.; Bryant, J.A.; Hall, D.A.; Inati, S.J.; Weber, R.T.; Un, S.; Prisner, T.F.; McDermott, A.E.; et al. A spectrometer for dynamic nuclear-polarization and electron-paramagnetic-resonance at high-frequencies. J. Magn. Reson. A 1995, 117, 28–40. [Google Scholar] [CrossRef]
- Prisner, T.; Rohrer, M.; MacMillan, F. Pulsed EPR spectroscopy: Biological applications. Annu. Rev. Phys. Chem. 2001, 52, 279–313. [Google Scholar] [CrossRef] [PubMed]
- Cardin, J.T.; Kolaczkowski, S.V.; Anderson, J.R.; Budil, D.E. Quasioptical design for an EPR spectrometer based on a horizontal-bore superconducting solenoid. Appl. Magn. Reson. 1999, 16, 273–292. [Google Scholar] [CrossRef]
- Van Tol, J.; Brunel, L.C.; Wylde, R.J. A quasioptical transient electron spin resonance spectrometer operating at 120 and 240 GHz. Rev. Sci. Instrum. 2005, 76, 074101. [Google Scholar] [CrossRef]
- Blok, H.; Disselhorst, J.; Orlinskii, S.B.; Schmidt, J. A continuous-wave and pulsed electron spin resonance spectrometer operating at 275 GHz. J. Magn. Reson. 2004, 166, 92–99. [Google Scholar] [CrossRef] [PubMed]
- Blok, H.; Disselhorst, J.; van der Meer, H.; Orlinskii, S.B.; Schmidt, J. ENDOR spectroscopy at 275 GHz. J. Magn. Reson. 2005, 173, 49–53. [Google Scholar] [CrossRef] [PubMed]
- Ivancich, A.; Mattioli, T.A.; Un, S. Effect of protein microenvironment on tyrosyl radicals. A high-field (285 GHz) EPR, resonance raman, and hybrid density functional study. J. Am. Chem. Soc. 1999, 121, 5743–5753. [Google Scholar] [CrossRef]
- Un, S.; Dorlet, P.; Rutherford, A.W. A high-field EPR tour of radicals in photosystems I and II. Appl. Magn. Reson. 2001, 21, 341–361. [Google Scholar] [CrossRef]
- Annino, G.; Cassettari, M.; Fittipaldi, M.; Longo, I.; Martinelli, M.; Massa, C.A.; Pardi, L.A. High-field, multifrequency EPR spectroscopy using whispering gallery dielectric resonators. J. Magn. Reson. 2000, 143, 88–94. [Google Scholar] [CrossRef] [PubMed]
- Hassan, A.K.; Pardi, L.A.; Krzystek, J.; Sienkiewicz, A.; Goy, P.; Rohrer, M.; Brunel, L.C. Ultrawide band multifrequency high-field emr technique: A methodology for increasing spectroscopic information. J. Magn. Reson. 2000, 142, 300–312. [Google Scholar] [CrossRef] [PubMed]
- Hassan, A.K.; Maniero, A.L.; van Tol, H.; Saylor, C.; Brunel, L.C. High-field emr: Recent cw developments at 25 tesla, and next-millennium challenges. Appl. Magn. Reson. 1999, 16, 299–308. [Google Scholar] [CrossRef]
- Rohrer, M.; Krzystek, J.; Williams, V.; Brunel, L.C. Fabry-perot resonator for high-field multi-frequency ESR at millimetre and submillimetre wavelengths. Meas. Sci. Technol. 1999, 10, 275–284. [Google Scholar] [CrossRef]
- Moll, H.P.; Kutter, C.; van Tol, J.; Zuckerman, H.; Wyder, P. Principles and performance of an electron spin echo spectrometer using far infrared lasers as excitation sources. J. Magn. Reson. 1999, 137, 46–58. [Google Scholar] [CrossRef] [PubMed]
- Earle, K.A.; Tipikin, D.S.; Freed, J.H. Far-infrared electron-paramagnetic-resonance spectrometer utilizing a quasioptical reflection bridge. Rev. Sci. Instrum. 1996, 67, 2502–2513. [Google Scholar] [CrossRef]
- Earle, K.A.; Freed, J.H. Quasioptical hardware for a flexible fir-EPR spectrometer. Appl. Magn. Reson. 1999, 16, 247–272. [Google Scholar] [CrossRef]
- Nojiri, H.; Motokawa, M.; Okuda, K.; Kageyama, H.; Ueda, Y.; Tanaka, H. Thz-ESR system by using single shot and repeating pulsed magnetic fields. J. Phys. Soc. Jpn. 2003, 72 (Suppl. B), 109–116. [Google Scholar] [CrossRef]
- Tatsukawa, T.; Maeda, T.; Sasai, H.; Idehara, T.; Mekata, I.; Saito, T.; Kanemaki, T. ESR spectrometer with a wide frequency-range using a gyrotron as a radiation power source. Int. J. Infrared Millim. Waves 1995, 16, 293–305. [Google Scholar] [CrossRef]
- Tatsukawa, T.; Shirai, T.; Imaizumi, T.; Idehara, T.; Ogawa, I.; Kanemaki, T. Ruby ESR over a wide frequency range in the millimeter wave region. Int. J. Infrared Millim. Waves 1998, 19, 859–874. [Google Scholar] [CrossRef]
- Mitsudo, S.; Higuchi, T.; Kanazawa, K.; Idehara, T.; Ogawa, I.; Chiba, M. High field ESR measurements using gyrotron fu series as radiation sources. J. Phys. Soc. Jpn. 2003, 72 (Suppl. B), 172–176. [Google Scholar] [CrossRef]
- Morley, G.W.; Brunel, L.C.; van Tol, J. A multifrequency high-field pulsed electron paramagnetic resonance/electron-nuclear double resonance spectrometer. Rev. Sci. Instrum. 2008, 79, 064703. [Google Scholar] [CrossRef] [PubMed] [Green Version]
- Fujii, Y.; Ishikawa, Y.; Ohya, K.; Miura, S.; Koizumi, Y.; Fukuda, A.; Omija, T.; Mitsudo, S.; Mizusaki, T.; Matsubara, A.; et al. Development of very-low-temperature millimeter-wave electron-spin-resonance measurement system. Appl. Magn. Reson. 2018, 49, 783–801. [Google Scholar] [CrossRef]
- Cho, F.H.; Stepanov, V.; Takahashi, S. A high-frequency electron paramagnetic resonance spectrometer for multi-dimensional, multi-frequency, and multi-phase pulsed measurements. Rev. Sci. Instrum. 2014, 85, 075110. [Google Scholar] [CrossRef] [PubMed] [Green Version]
- Cho, F.H.; Stepanov, V.; Abeywardana, C.; Takahashi, S. 230/115 GHz electron paramagnetic resonance/double electron-electron resonance spectroscopy. In Methods in Enzymology; Qin, P.Z., Warncke, K., Eds.; Elsevier Academic Press Inc.: San Diego, CA, USA, 2015; Volume 563, pp. 95–118. [Google Scholar]
- Takahashi, S.; Brunel, L.C.; Edwards, D.T.; van Tol, J.; Ramian, G.; Han, S.; Sherwin, M.S. Pulsed electron paramagnetic resonance spectroscopy powered by a free-electron laser. Nature 2012, 489, 409–413. [Google Scholar] [CrossRef] [PubMed]
- Takahashi, S.; Allen, D.G.; Seifter, J.; Ramian, G.; Sherwin, M.S.; Brunel, L.-C.; van Tol, J. Pulsed EPR spectrometer with injection-locked ucsb free-electron laser. Infrared Phys. Technol. 2008, 51, 426–428. [Google Scholar] [CrossRef]
- Nafradi, B.; Gaal, R.; Feher, T.; Forro, L. Microwave frequency modulation in continuous-wave far-infrared ESR utilizing a quasi-optical reflection bridge. J. Magn. Reson. 2008, 192, 265–268. [Google Scholar] [CrossRef] [PubMed] [Green Version]
- Neugebauer, P.; Bloos, D.; Marx, R.; Lutz, P.; Kern, M.; Aguilà, D.; Vaverka, J.; Laguta, O.; Dietrich, C.; Clérac, R.; et al. Ultra-broadband EPR spectroscopy in field and frequency domains. Phys. Chem. Chem. Phys. 2018, 20, 15528–15534. [Google Scholar] [CrossRef] [PubMed]
- Schnegg, A.; Behrends, J.; Lips, K.; Bittl, R.; Holldack, K. Frequency domain fourier transform THz-EPR on single molecule magnets using coherent synchrotron radiation. Phys. Chem. Chem. Phys. 2009, 11, 6820–6825. [Google Scholar] [CrossRef] [PubMed]
- Nehrkorn, J.; Holldack, K.; Bittl, R.; Schnegg, A. Recent progress in synchrotron-based frequency-domain fourier-transform THz-EPR. J. Magn. Reson. 2017, 280, 10–19. [Google Scholar] [CrossRef] [PubMed]
- Ozerov, M.; Bernath, B.; Kamenskyi, D.; Redlich, B.; van der Meer, A.F.G.; Christianen, P.C.M.; Engelkamp, H.; Maan, J.C. A THz spectrometer combining the free electron laser flare with 33 T magnetic fields. Appl. Phys. Lett. 2017, 110, 094106. [Google Scholar] [CrossRef]
- Sakurai, T.; Matsui, R.; Kawasaki, K.; Okubo, S.; Ohta, H.; Matsubayashi, K.; Uwatoko, Y.; Kudo, K.; Koike, Y. Development of high-pressure and multi-frequency ESR system and its application to quantum spin system. Appl. Magn. Reson. 2015, 46, 1007–1012. [Google Scholar] [CrossRef]
- Siaw, T.A.; Leavesley, A.; Lund, A.; Kaminker, I.; Han, S. A versatile and modular quasi optics-based 200 GHz dual dynamic nuclear polarization and electron paramagnetic resonance instrument. J. Magn. Reson. 2016, 264, 131–153. [Google Scholar] [CrossRef] [PubMed] [Green Version]
- Schwalbe, H. New 1.2 GHz NMR spectrometers—New horizons? Angew. Chem. Int. Ed. 2017, 56, 10252–10253. [Google Scholar] [CrossRef] [PubMed]
- Zavoisky, E. Relaxation of liquid solutions for perpendicular fields. J. Phys. USSR 1945, 9, 211–216. [Google Scholar]
- Zavoisky, E. Paramagnetic absorption in some salts in perpendicular magnetic fields. Zh. Eksper. Teor. Fiz. 1946, 16, 603–606. [Google Scholar]
- Purcell, E.M.; Torrey, H.C.; Pound, R.V. Resonance absorption by nuclear magnetic moments in a solid. Phys. Rev. 1946, 69, 37–38. [Google Scholar] [CrossRef]
- Bloch, F.; Hansen, W.W.; Packard, M. Nuclear induction. Phys. Rev. 1946, 69, 127. [Google Scholar] [CrossRef]
- Hausser, K. Award address for professor E. K. Zavoisky. J. Magn. Reson. 1978, 29, 179–181. [Google Scholar] [CrossRef]
- Kim, S.S.; Weissman, S.I. Detection of transient electron-paramagnetic resonance. J. Magn. Reson. 1976, 24, 167–169. [Google Scholar] [CrossRef]
- McLauchlan, K.A.; Yeung, M.T. Time-resolved ESR studies of free radicals. In Electron Spin Resonance; Royal Society of Chemistry: Cambridge, UK, 1994; Volume 14, pp. 32–62. [Google Scholar]
- Stehlik, D.; Möbius, K. New EPR methods for investigating photoprocesses with paramagnetic intermediates. Annu. Rev. Phys. Chem. 1997, 48, 745–784. [Google Scholar] [CrossRef] [PubMed]
- Hoff, A.J. Advanced EPR: Applications in Biology and Biochemistry; Elsevier: Amsterdam, The Netherlands, 1989. [Google Scholar]
- Savitsky, A.; Kühn, M.; Duche, D.; Möbius, K.; Steinhoff, H.J. Spontaneous refolding of the pore-forming colicin a toxin upon membrane association as studied by X-band and W-band high-field electron paramagnetic resonance spectroscopy. J. Phys. Chem. B 2004, 108, 9541–9548. [Google Scholar] [CrossRef]
- Savitsky, A.; Möbius, K. Photochemical reactions and photoinduced electron-transfer processes in liquids, frozen solutions, and proteins as studied by multifrequency time-resolved EPR spectroscopy. Helv. Chim. Acta 2006, 89, 2544–2589. [Google Scholar] [CrossRef]
- Lubitz, W.; Lendzian, F.; Bittl, R. Radicals, radical pairs and triplet states in photosynthesis. Acc. Chem. Res. 2002, 35, 313–320. [Google Scholar] [CrossRef] [PubMed]
- Savitsky, A.N.; Galander, M.; Möbius, K. W-band time-resolved electron paramagnetic resonance spectroscopy on transient organic radicals in solution. Chem. Phys. Lett. 2001, 340, 458–466. [Google Scholar] [CrossRef]
- Hahn, E.L. Spin echos. Phys. Rev. 1950, 80, 580–594. [Google Scholar] [CrossRef]
- Ernst, R.R. Sensitivity enhancement in magnetic resonance. I. Analysis of method of time averaging. Rev. Sci. Instrum. 1965, 36, 1689. [Google Scholar] [CrossRef]
- Ernst, R.R.; Anderson, W.A. Application of fourier transform spectroscopy to magnetic resonance. Rev. Sci. Instrum. 1966, 37, 93–102. [Google Scholar] [CrossRef]
- Blume, R.J. Electron spin relaxation times in sodium-ammonia solutions. Phys. Rev. 1958, 109, 1867–1873. [Google Scholar] [CrossRef]
- Keijzers, C.P.; Reijerse, E.J.; Schmidt, J. Pulsed EPR: A New Field of Applications; North Holland: Amsterdam, The Netherlands, 1989. [Google Scholar]
- Salikhov, K.M.; Semenov, A.G.; Tsvetkov, Y.D. Electron Spin Echo and Its Applications; Nauka: Moscow, Russia, 1976. [Google Scholar]
- Milov, A.D.; Salikhov, K.M.; Tsvetkov, Y.D. Effect of spin dipole-dipole interaction on phase relaxation in magnetically dilute solid bodies. Zh. Eksper. Teor. Fiz. 1972, 63, 2329–2335. [Google Scholar]
- Milov, A.D.; Salikhov, K.M.; Shirov, M.D. Application of eldor in electron-spin echo for paramagnetic center space distribution in solids. Fiz. Tverd. Tela 1981, 23, 975–982. [Google Scholar]
- Emshwiller, M.; Hahn, E.L.; Kaplan, D. Pulsed nuclear resonance spectroscopy. Phys. Rev. 1960, 118, 414–424. [Google Scholar] [CrossRef]
- Salikhov, K.M.; Bock, C.H.; Stehlik, D. Time development of electron spin polarization in magnetically coupled, spin correlated radical pairs. Appl. Magn. Reson. 1990, 1, 195–211. [Google Scholar] [CrossRef]
- Salikhov, K.M.; Kandrashkin, Y.; Salikhov, A.K. Peculiarities of free induction and primary spin echo signals for spin-correlated radical pairs. Appl. Magn. Reson. 1992, 3, 199–216. [Google Scholar] [CrossRef]
- Goldfarb, D.; Stoll, S. EPR Spectroscopy: Fundamentals and Methods; Wilez: New York, NY, USA, 2018; p. 648. [Google Scholar]
- Goldfarb, D.; Krymov, V. W-band pulsed ENDOR of transition metal centers, biological magnetic resonance. In Very High Frequency (VHF) ESR/EPR; Grinberg, O., Berliner, L.J., Eds.; Kluwer/Plenum: New York, NY, USA, 2004; Volume 22, pp. 305–351. [Google Scholar]
- Maniero, A.L. High frequency ENDOR spectroscopy. In Very High Frequency (VHF) ESR/EPR, Biological Magnetic Resonance; Grinberg, O., Berliner, L.J., Eds.; Kluwer/Plenum: New York, NY, USA, 2004; Volume 22, pp. 478–494. [Google Scholar]
- Feher, G. Method of polarizing nuclei in paramagnetic substances. Phys. Rev. 1956, 103, 500–501. [Google Scholar] [CrossRef]
- Feher, G. Observation of nuclear magnetic resonances via the electron spin resonance line. Phys. Rev. 1956, 103, 834–835. [Google Scholar] [CrossRef]
- Freed, J.H. Theory of multiple resonance and ESR saturation in liquids and related media. In Mulitiple Electron Resonance Spectroscopy; Dorio, M.M., Freed, J.H., Eds.; Plenum: New York, NY, USA, 1979; pp. 73–142. [Google Scholar]
- Möbius, K.; Plato, M.; Lubitz, W. Radicals in solution studied by ENDOR and triple resonance spectroscopy. Phys. Rep. 1982, 87, 171–208. [Google Scholar] [CrossRef]
- Plato, M.; Lubitz, W.; Möbius, K. A solution ENDOR sensitivity study of various nuclei in organic radicals. J. Phys. Chem. 1981, 85, 1202–1219. [Google Scholar] [CrossRef]
- Kurreck, H.; Kirste, B.; Lubitz, W. Electron Nuclear Double Resonance Spectroscopy of Radicals in Solution—Applications to Organic and Biological Chemistry; VCH Publishers, Inc.: Deerfield Beach, FL, USA, 1988; pp. 1–374. [Google Scholar]
- Kevan, L.; Kispert, L.D. Electron Spin Double Resonance Spectroscopy; John Wiley: New York, NY, USA, 1976. [Google Scholar]
- Cederquist, A. Electron-Nuclear Double Resonance in Homogeneously Broadened Systems: Metal Ammonia Solutions. Ph.D. Thesis, Washington University, St. Louis, MO, USA, 1963. [Google Scholar]
- Hyde, J.S.; Maki, A.H. ENDOR of free radical in solution. J. Chem. Phys. 1964, 40, 3117–3118. [Google Scholar] [CrossRef]
- Möbius, K.; Biehl, R. Electron-nuclear-nuclear triple resonance of radicals in solution. In Multiple Electron Resonance Spectroscopy; Dorio, M.M., Freed, J.H., Eds.; Plenum Press: New York, NY, USA, 1979; pp. 475–508. [Google Scholar]
- Feher, G. Electron nuclear double resonance (ENDOR) experiments. Physica 1958, 24, S80–S87. [Google Scholar] [CrossRef]
- Freed, J.H. Theory of saturation and double resonance effects in ESR spectra. 4. Electron-nuclear triple resonance. J. Chem. Phys. 1969, 50, 2271–2272. [Google Scholar] [CrossRef]
- Dinse, K.P.; Biehl, R.; Möbius, K. Electron nuclear triple resonance of free-radicals in solution. J. Chem. Phys. 1974, 61, 4335–4341. [Google Scholar] [CrossRef]
- Gerson, F.; Huber, W. Electron Spin Resonance Spectroscopy of Organic Radicals; Wiley-VCH: Weinheim, Germany, 2003. [Google Scholar]
- Biehl, R.; Plato, M.; Möbius, K. General triple resonance on free-radicals in solution—Determination of relative signs of isotropic hyperfine coupling-constants. J. Chem. Phys. 1975, 63, 3515–3522. [Google Scholar] [CrossRef]
- Cook, R.J.; Whiffen, D.H. Relative signs of hyperfine coupling constants by double ENDOR experiment. Proc. Phys. Soc. Lond. 1964, 84, 845–848. [Google Scholar] [CrossRef]
- Hoff, A.J.; Möbius, K. Nitrogen electron nuclear double resonance and proton triple resonance experiments on the bacteriochlorophyll cation in solution. Proc. Natl. Acad. Sci. USA 1978, 75, 2296–2300. [Google Scholar] [CrossRef] [PubMed]
- Lendzian, F.; Bönigk, B.; Plato, M.; Möbius, K.; Lubitz, W. 15N ENDOR experiments on the primary donor cation radical d+ in bacterial reaction center single crystals of RB. Shaeroides R-26. In The Photosynthetic Bacterial Reaction Center II; Breton, J., Vermeglio, A., Eds.; Plenum: New York, NY, USA, 1992; Volume 237, pp. 89–97. [Google Scholar]
- Lubitz, W.; Lendzian, F. ENDOR spectroscopy. In Biophysical Techniques in Photosynthesis; Amesz, J., Hoff, A.J., Eds.; Kluwer: Dordrecht, The Netherlands, 1996; pp. 255–275. [Google Scholar]
- Levanon, H.; Möbius, K. Advanced EPR spectroscopy on electron transfer processes in photosynthesis and biomimetic model systems. Annu. Rev. Biophys. Biomol. Struct. 1997, 26, 495–540. [Google Scholar] [CrossRef] [PubMed]
- Allendoerfer, R.D.; Maki, A.H. A phenomenological description of ENDOR in solution; example: The tri-t-butyl phenoxyl radical. J. Magn. Reson. 1970, 3, 396–410. [Google Scholar] [CrossRef]
- Leniart, D.S.; Connor, H.D.; Freed, J.H. Esr and ENDOR study of spin relaxation of semiquinones in liquid solution. J. Chem. Phys. 1975, 63, 165–199. [Google Scholar] [CrossRef]
- Freed, J.H. Theory of saturation and double-resonance effects in ESR spectra. J. Chem. Phys. 1965, 43, 2312–2332. [Google Scholar] [CrossRef]
- Freed, J.H. Theory of saturation and double resonance effects in electron spin resonance spectra. 2. Exchange vs. dipolar mechanisms. J. Phys. Chem. 1967, 71, 38–51. [Google Scholar] [CrossRef]
- Freed, J.H.; Leniart, D.S.; Hyde, J.S. Theory of saturation and double resonance effects in ESR spectra. 3. Rf coherence and line shapes. J. Chem. Phys. 1967, 47, 2762–2773. [Google Scholar] [CrossRef]
- Freed, J.H.; Leniart, D.S.; Connor, H.D. Theory of saturation and double-resonance in ESR-spectra. 5. Average ENDOR and eldor lines. J. Chem. Phys. 1973, 58, 3089–3105. [Google Scholar] [CrossRef]
- Möbius, K.; Lubitz, W.; Plato, M. Liquid-state ENDOR and triple resonance. In Advanced EPR, Applications in Biology and Biochemistry; Hoff, A.J., Ed.; Elsevier: Amsterdam, The Netherlands, 1989; pp. 441–499. [Google Scholar]
- Biehl, R.; Lubitz, W.; Möbius, K.; Plato, M. Observation of deuterium quadrupole splittings of aromatic free-radicals in liquid-crystals by ENDOR and triple resonance. J. Chem. Phys. 1977, 66, 2074–2078. [Google Scholar] [CrossRef]
- Lubitz, W.; Dinse, K.P.; Möbius, K.; Biehl, R. Fluorine and proton ENDOR of aromatic radicals in solution. Chem. Phys. 1975, 8, 371–383. [Google Scholar] [CrossRef]
- Lubitz, W.; Plato, M.; Möbius, K.; Biehl, R. Alkali and h ENDOR on aromatic ion-pairs in solution—Indo approach. J. Phys. Chem. 1979, 83, 3402–3413. [Google Scholar] [CrossRef]
- Lubitz, W. Aufklärung der Elektronenstruktur Aromatischer Radikale Durch Ekektron-Kern-Mehrfachresonanz-Experimente an Protonen und Heterokernen. Ph.D. Thesis, Free University Berlin, Berlin, Germany, 1977. [Google Scholar]
- Lubitz, W. EPR in photosynthesis. In Electron Paramagnetic Resonance; Gilbert, B.C., Davies, M.J., Murphy, D.M., Eds.; The Royal Society of Chemistry: Cambidge, UK, 2004; Volume 19, pp. 174–242. [Google Scholar]
- Möbius, K. ENDOR and ELDOR. In Electron Spin Resonance; Ayscough, P.B., Ed.; The Royal Society of Chemistry: Cambridge, UK, 1977; Volume 4, pp. 16–29. [Google Scholar]
- Möbius, K. EPR studies of photosynthesis. In Electron Spin Resonance; Atherton, N.M., Davies, M.J., Gilbert, B.C., Eds.; The Royal Society of Chemistry: Cambridge, UK, 1994; Volume 14, pp. 203–245. [Google Scholar]
- Weber, S. Recent EPR studies on the bacterial photosynthetic reaction centre. In Electron Paramagnetic Resonance; Gilbert, B.C., Davies, M.J., McLauchlan, K.A., Eds.; The Royal Society of Chemistry: Cambridge, UK, 2000; Volume 17, pp. 43–77. [Google Scholar]
- Murphy, D.M.; Farley, R.D. Principles and applications of ENDOR spectroscopy for structure determination in solution and disordered matrices. Chem. Soc. Rev. 2006, 35, 249–268. [Google Scholar] [CrossRef] [PubMed]
- Bixon, M.; Fajer, J.; Feher, G.; Freed, J.H.; Gamliel, D.; Hoff, A.J.; Levanon, H.; Möbius, K.; Nechushtai, R.; Norris, J.R.; et al. Primary events in photosynthesis—Problems, speculations, controversies, and future-trends. Isr. J. Chem. 1992, 32, 369–518. [Google Scholar]
- Lendzian, F.; Lubitz, W.; Scheer, H.; Bubenzer, C.; Möbius, K. Invivo liquid solution ENDOR and triple resonance of bacterial photosynthetic reaction centers of Rhodopseudomonas sphaeroides R-26. J. Am. Chem. Soc. 1981, 103, 4635–4637. [Google Scholar] [CrossRef] [Green Version]
- Lubitz, W.; Lendzian, F.; Scheer, H.; Gottstein, J.; Plato, M.; Möbius, K. Structural studies of the primary donor cation radical P870+· in reaction centers of Rhodospirillum rubrum by electron-nuclear double resonance in solution. Proc. Natl. Acad. Sci. USA 1984, 81, 1401–1405. [Google Scholar] [CrossRef] [PubMed] [Green Version]
- Lendzian, F.; Huber, M.; Isaacson, R.A.; Endeward, B.; Plato, M.; Bönigk, B.; Möbius, K.; Lubitz, W.; Feher, G. The electronic-structure of the primary donor cation-radical in Rhodobacter sphaeroides R-26—ENDOR and triple-resonance studies in single-crystals of reaction centers. Biochim. Biophys. Acta 1993, 1183, 139–160. [Google Scholar] [CrossRef]
- Hoff, A.J.; Deisenhofer, J. Photophysics of photosynthesis. Structure and spectroscopy of reaction centers of purple bacteria. Phys. Rep. 1997, 287, 2–247. [Google Scholar] [CrossRef]
- Rautter, J.; Lendzian, F.; Lin, X.; Williams, J.C.; Allen, J.P.; Lubitz, W. Effect of orbital asymmetry in p+ on electron transfer in reaction centers of RB. Sphaeroides. In The Reaction Center of Photosynthetic Bacteria, Structure and Dynamics; Michel-Beyerle, M.E., Ed.; Springer: Berlin, Germany, 1996; pp. 37–50. [Google Scholar]
- Rautter, J.; Lendzian, F.; Schulz, C.; Fetsch, A.; Kuhn, M.; Lin, X.; Williams, J.C.; Allen, J.P.; Lubitz, W. ENDOR studies of the primary donor cation radical in mutant reaction centers of rhodobacter sphaeroides with altered hydrogen-bond interactions. Biochemistry 1995, 34, 8130–8143. [Google Scholar] [CrossRef] [PubMed]
- Rautter, J.; Lendzian, F.; Lubitz, W.; Wang, S.; Allen, J.P. Comparative study of reaction centers from photosynthetic purple bacteria: Electron paramagnetic resonance and electron nuclear double resonance spectroscopy. Biochemistry 1994, 33, 12077–12084. [Google Scholar] [CrossRef] [PubMed]
- Rautter, J.; Gessner, C.; Lendzian, F.; Lubitz, W.; Williams, J.C.; Murchison, H.A.; Wang, S.; Woodbury, N.W.; Allen, J.P. EPR and ENDOR studies of the primary donor cation radical in native and genetically modified bacterial reaction centers. In Photosynthetic Bacterial Reaction Center II; Breton, J., Vermeglio, A., Eds.; Plenum: New York, NY, USA, 1992; Volume 237, pp. 99–108. [Google Scholar]
- Müh, F.; Lendzian, F.; Roy, M.; Williams, J.C.; Allen, J.P.; Lubitz, W. Pigment-protein interactions in bacterial reaction centers and their influence on oxidation potential and spin density distribution of the primary donor. J. Phys. Chem. B 2002, 106, 3226–3236. [Google Scholar] [CrossRef]
- Johnson, E.T.; Müh, F.; Nabedryk, E.; Williams, J.C.; Allen, J.P.; Lubitz, W.; Breton, J.; Parson, W.W. Electronic and vibronic coupling of the special pair of bacteriochlorophylls in photosynthetic reaction centers from wild-type and mutant strains of Rhodobacter sphaeroides. J. Phys. Chem. B 2002, 106, 11859–11869. [Google Scholar] [CrossRef]
- Artz, K.; Williams, J.C.; Allen, J.P.; Lendzian, F.; Rautter, J.; Lubitz, W. Relationship between the oxidation potential and electron spin density of the primary electron donor in reaction centers from Rhodobacter sphaeroides. Proc. Natl. Acad. Sci. USA 1997, 94, 13582–13587. [Google Scholar] [CrossRef] [PubMed]
- Plato, M.; Möbius, K.; Michel-Beyerle, M.E.; Bixon, M.; Jortner, J. Intermolecular electronic interactions in the primary charge separation in bacterial photosynthesis. J. Am. Chem. Soc. 1988, 110, 7279–7285. [Google Scholar] [CrossRef]
- Feher, G. The bruker lecture. Identification and characterization of the primary donor in bacterial photosynthesis: A chronological account of an EPR/ENDOR investigation. J. Chem. Soc. Perkin Trans. 2 1992, 1861–1874. [Google Scholar] [CrossRef]
- Käß, H.; Fromme, P.; Witt, H.T.; Lubitz, W. Orientation and electronic structure of the primary donor radical cation P700 in photosystem I: A single crystals EPR and ENDOR study. J. Phys. Chem. B 2001, 105, 1225–1239. [Google Scholar] [CrossRef]
- Lubitz, W. Pulse EPR and ENDOR studies of light-induced radicals and triplet states in photosystem ii of oxygenic photosynthesis. Phys. Chem. Chem. Phys. 2002, 4, 5539–5545. [Google Scholar] [CrossRef]
- Rigby, S.E.J.; Nugent, J.H.A.; O’Malley, P.J. ENDOR and special triple resonance studies of chlorophyll cation radicals in photosystem II. Biochemistry 1994, 33, 10043–10050. [Google Scholar] [CrossRef] [PubMed]
- Lubitz, W. EPR studies of the primary electron donor P700 in photosystem I. In Advances in Photosynthesis and Respiration: The Light-Driven Plastocyanin: Ferredoxin Oxidoreductase; Golbeck, J.H., Ed.; Springer: Dordrecht, The Netherlands, 2006; Volume 24, pp. 245–269. [Google Scholar]
- Daviso, E.; Prakash, S.; Alia, A.; Gast, P.; Neugebauer, J.; Jeschke, G.; Matysik, J. The electronic structure of the primary electron donor of reaction centers of purple bacteria at atomic resolution as observed by photo-cidnp C-13 NMR. Proc. Natl. Acad. Sci. USA 2009, 106, 22281–22286. [Google Scholar] [CrossRef] [PubMed]
- Yamasaki, H.; Takano, Y.; Nakamura, H. Theoretical investigation of the electronic asymmetry of the special pair cation radical in the photosynthetic type-II reaction center. J. Phys. Chem. B 2008, 112, 13923–13933. [Google Scholar] [CrossRef] [PubMed]
- Sai Sankar Gupta, K.B.; Alia, A.; de Groot, H.J.M.; Matysik, J. Symmetry break of special pair: Photochemically induced dynamic nuclear polarization NMR confirms control by nonaromatic substituents. J. Am. Chem. Soc. 2013, 135, 10382–10387. [Google Scholar] [CrossRef] [PubMed]
- Matysik, J.; Leipzig University, Leipzig, Germany. Personal Communication, 2013.
- Kurreck, H.; Huber, M. Model reactions for photosynthesis-photoinduced charge and energy-transfer between covalently-linked porphyrin and quinone units. Angew. Chem. Int. Ed. 1995, 34, 849–866. [Google Scholar] [CrossRef]
- Gust, D.; Moore, T.A. Intramolecular photoinduced electron transfer reactions of porphyrins. In The Porphyrin Handbook; Kadish, K.M., Smith, K.M., Guilard, R., Eds.; Academic Press: New York, NY, USA, 2000; Volume 8, pp. 153–190. [Google Scholar]
- Lee, W.; Kasanmascheff, M.; Huynh, M.; Quartararo, A.; Costentin, C.; Bejenke, I.; Nocera, D.G.; Bennati, M.; Tommos, C.; Stubbe, J. Properties of site-specifically incorporated 3-aminotyrosine in proteins to study redox-active tyrosines: Escherichia coli ribonucleotide reductase as a paradigm. Biochemistry 2018, 57, 3402–3415. [Google Scholar] [CrossRef] [PubMed]
- Nick, T.U.; Ravichandran, K.R.; Stubbe, J.; Kasanmascheff, M.; Bennati, M. Spectroscopic evidence for a H bond network at Y356 located at the subunit interface of active E. coli ribonucleotide reductase. Biochemistry 2017, 56, 3647–3656. [Google Scholar] [CrossRef] [PubMed]
- Halbmair, K.; Seikowski, J.; Tkach, I.; Hobartner, C.; Sezer, D.; Bennati, M. High-resolution measurement of long-range distances in RNA: Pulse EPR spectroscopy with tempo-labeled nucleotides. Chem. Sci. 2016, 7, 3172–3180. [Google Scholar] [CrossRef] [PubMed]
- Goetzl, S.; Teutloff, C.; Werther, T.; Hennig, S.E.; Jeoung, J.H.; Bittl, R.; Dobbek, H. Protein dynamics in the reductive activation of a B12-containing enzyme. Biochemistry 2017, 56, 5496–5502. [Google Scholar] [CrossRef] [PubMed]
- Saeidpour, S.; Lohan, S.B.; Anske, M.; Unbehauen, M.; Fleige, E.; Haag, R.; Meinke, M.C.; Bittl, R.; Teutloff, C. Localization of dexamethasone within dendritic core-multishell (CMS) nanoparticles and skin penetration properties studied by multi-frequency electron paramagnetic resonance (EPR) spectroscopy. Eur. J. Pharm. Biopharm. 2017, 116, 94–101. [Google Scholar] [CrossRef] [PubMed]
- Löwenstein, J.; Lauterbach, L.; Teutloff, C.; Lenz, O.; Bittl, R. Active site of the NAD(+)-reducing hydrogenase from Ralstonia eutropha studied by EPR spectroscopy. J. Phys. Chem. B 2015, 119, 13834–13841. [Google Scholar] [CrossRef] [PubMed]
- Tao, L.Z.; Stich, T.A.; Liou, S.H.; Soldatova, A.V.; Delgadillo, D.A.; Romano, C.A.; Spiro, T.G.; Goodin, D.B.; Tebo, B.M.; Casey, W.H.; et al. Copper binding sites in the manganese-oxidizing MNX protein complex investigated by electron paramagnetic resonance spectroscopy. J. Am. Chem. Soc. 2017, 139, 8868–8877. [Google Scholar] [CrossRef] [PubMed]
- Stich, T.A.; McAlpin, J.G.; Wall, R.M.; Rigsby, M.L.; Britt, R.D. Electron paramagnetic resonance characterization of dioxygen-bridged cobalt dimers with relevance to water oxidation. Inorg. Chem. 2016, 55, 12728–12736. [Google Scholar] [CrossRef] [PubMed]
- Rao, G.; Britt, R.D. Electronic structure of two catalytic states of the [FeFe] hydrogenase H-cluster as probed by pulse electron paramagnetic resonance spectroscopy. Inorg. Chem. 2018, 57, 10935–10944. [Google Scholar] [CrossRef] [PubMed]
- Selmke, B.; Borbat, P.P.; Nickolaus, C.; Varadarajan, R.; Freed, J.H.; Trommer, W.E. Open and closed form of maltose binding protein in its native and molten globule state as studied by EPR spectroscopy. Biochemistry 2018, 57, 5507–5512. [Google Scholar] [CrossRef] [PubMed]
- Srivastava, M.; Freed, J.H. Singular value decomposition method to determine distance distributions in pulsed dipolar electron spin resonance. J. Phys. Chem. Lett. 2017, 8, 5648–5655. [Google Scholar] [CrossRef] [PubMed]
- Franck, J.M.; Chandrasekaran, S.; Dzikovski, B.; Dunnam, C.R.; Freed, J.H. Focus: Two-dimensional electron-electron double resonance and molecular motions: The challenge of higher frequencies. J. Chem. Phys. 2015, 142, 212302. [Google Scholar] [CrossRef] [PubMed] [Green Version]
- Prokopiou, G.; Lee, M.D.; Collauto, A.; Abdelkader, E.H.; Bahrenberg, T.; Feintuch, A.; Ramirez-Cohen, M.; Clayton, J.; Swarbrick, J.D.; Graham, B.; et al. Small Gd(III) tags for Gd(III)-Gd(III) distance measurements in proteins by EPR spectroscopy. Inorg. Chem. 2018, 57, 5048–5059. [Google Scholar] [CrossRef] [PubMed]
- Wu, Z.; Feintuch, A.; Collauto, A.; Adams, L.A.; Aurelio, L.; Graham, B.; Otting, G.; Goldfarb, D. Selective distance measurements using triple spin labeling with Gd3+, Mn2+, and a nitroxide. J. Phys. Chem. Lett. 2017, 8, 5277–5282. [Google Scholar] [CrossRef] [PubMed]
- Manukovsky, N.; Feintuch, A.; Kuprov, I.; Goldfarb, D. Time domain simulation of Gd3+-Gd3+ distance measurements by EPR. J. Chem. Phys. 2017, 147, 044201. [Google Scholar] [CrossRef] [PubMed]
- Horitani, M.; Offenbacher, A.R.; Carr, C.A.M.; Yu, T.; Hoeke, V.; Cutsail, G.E.; Hammes-Schiffer, S.; Klinman, J.P.; Hoffman, B.M. C-13 ENDOR spectroscopy of lipoxygenase-substrate complexes reveals the structural basis for C-H activation by tunneling. J. Am. Chem. Soc. 2017, 139, 1984–1997. [Google Scholar] [CrossRef] [PubMed]
- Davydov, R.; Khadka, N.; Yang, Z.Y.; Fielding, A.J.; Lukoyanov, D.; Dean, D.R.; Seefeldt, L.C.; Hoffman, B.M. Exploring electron/proton transfer and conformational changes in the nitrogenase mofe protein and femo-cofactor through cryoreduction/EPR measurements. Isr. J. Chem. 2016, 56, 841–851. [Google Scholar] [CrossRef] [PubMed]
- Cutsail, G.E.; Telser, J.; Hoffman, B.M. Advanced paramagnetic resonance spectroscopies of iron-sulfur proteins: Electron nuclear double resonance (ENDOR) and electron spin echo envelope modulation (ESEEM). Biochim. Biophys. Acta 2015, 1853, 1370–1394. [Google Scholar] [CrossRef] [PubMed]
- Kuzhelev, A.A.; Krumkacheva, O.A.; Shevelev, G.Y.; Yulikov, M.; Fedin, M.V.; Bagryanskaya, E.G. Room-temperature distance measurements using RIDME and the orthogonal spin labels trityl/nitroxide. Phys. Chem. Chem. Phys. 2018, 20, 10224–10230. [Google Scholar] [CrossRef] [PubMed]
- Wili, N.; Jeschke, G. Chirp echo fourier transform EPR-detected NMR. J. Magn. Reson. 2018, 289, 26–34. [Google Scholar] [CrossRef] [PubMed]
- Gmeiner, C.; Dorn, G.; Allain, F.H.T.; Jeschke, G.; Yulikov, M. Spin labelling for integrative structure modelling: A case study of the polypyrimidine-tract binding protein 1 domains in complexes with short rnas. Phys. Chem. Chem. Phys. 2017, 19, 28360–28380. [Google Scholar] [CrossRef] [PubMed]
- Salvadori, E.; Luke, N.; Shaikh, J.; Leventis, A.; Bronstein, H.; Kay, C.W.M.; Clarke, T.M. Ultra-fast spin-mixing in a diketopyrrolopyrrole monomer/fullerene blend charge transfer state. J. Mater. Chem. A 2017, 5, 24335–24343. [Google Scholar] [CrossRef]
- Salvadori, E.; Fung, M.W.; Hoffmann, M.; Anderson, H.L.; Kay, C.W.M. Exploiting the symmetry of the resonator mode to enhance PELDOR sensitivity. Appl. Magn. Reson. 2015, 46, 359–368. [Google Scholar] [CrossRef] [PubMed]
- Ema, F.; Tanabe, M.; Saito, S.; Yoneda, T.; Sugisaki, K.; Tachikawa, T.; Akimoto, S.; Yamauchi, S.; Sato, K.; Osuka, A.; et al. Charge-transfer character drives möbius antiaromaticity in the excited triplet state of twisted [28] hexaphyrin. J. Phys. Chem. Lett. 2018, 9, 2685–2690. [Google Scholar] [CrossRef] [PubMed]
- Hasegawa, M.; Nagashima, H.; Minobe, R.; Tachikawa, T.; Mino, H.; Kobori, Y. Regulated electron tunneling of photoinduced primary charge-separated state in the photosystem II reaction center. J. Phys. Chem. Lett. 2017, 8, 1179–1184. [Google Scholar] [CrossRef] [PubMed]
- Miura, T.; Tao, R.; Shibata, S.; Umeyama, T.; Tachikawa, T.; Imahori, H.; Kobori, Y. Geometries, electronic couplings, and hole dissociation dynamics of photoinduced electron–hole pairs in polyhexylthiophene–fullerene dyads rigidly linked by oligophenylenes. J. Am. Chem. Soc. 2016, 138, 5879–5885. [Google Scholar] [CrossRef] [PubMed]
- Agostini, A.; Niklas, J.; Schulte, T.; Di Valentin, M.; Bortolus, M.; Hofmann, E.; Lubitz, W.; Carbonera, D. Changing the site energy of per-614 in the peridinin-chlorophyll a-protein does not alter its capability of chlorophyll triplet quenching. Biochim. Biophys. Acta 2018, 1859, 612–618. [Google Scholar] [CrossRef] [PubMed]
- Lohmiller, T.; Vibhute Mahesh, A.; Lubitz, W.; Savitsky, A. Multifrequency multiresonance EPR investigation of halogen-bonded complexes involving neutral nitroxide radicals. Z. Phys. Chem. 2017, 231, 867. [Google Scholar] [CrossRef]
- Krewald, V.; Retegan, M.; Neese, F.; Lubitz, W.; Pantazis, D.A.; Cox, N. Spin state as a marker for the structural evolution of nature’s water-splitting catalyst. Inorg. Chem. 2016, 55, 488–501. [Google Scholar] [CrossRef] [PubMed]
- Vallotto, C.; Williams, H.E.; Murphy, D.M.; Ayres, Z.J.; Edge, R.; Newton, M.E.; Wedge, C.J. An electron paramagnetic resonance (EPR) spectroscopy study on the γ-irradiation sterilization of the pharmaceutical excipient l-histidine: Regeneration of the radicals in solution. Int. J. Pharm. 2017, 533, 315–319. [Google Scholar] [CrossRef] [PubMed]
- Ritterskamp, N.; Sharples, K.; Richards, E.; Folli, A.; Chiesa, M.; Platts, J.A.; Murphy, D.M. Understanding the coordination modes of [Cu(Acac)2(Imidazole)n=1,2] adducts by EPR, ENDOR, HYSCORE, and DFT analysis. Inorg. Chem. 2017, 56, 11862–11875. [Google Scholar] [CrossRef] [PubMed]
- Pelties, S.; Carter, E.; Folli, A.; Mahon, M.F.; Murphy, D.M.; Whittlesey, M.K.; Wolf, R. Influence of ring-expanded n-heterocyclic carbenes on the structures of half-sandwich Ni(I) complexes: An X-ray, electron paramagnetic resonance (EPR), and electron nuclear double resonance (ENDOR) study. Inorg. Chem. 2016, 55, 11006–11017. [Google Scholar] [CrossRef] [PubMed]
- Gränz, M.; Erlenbach, N.; Spindler, P.; Gophane, D.B.; Stelzl, L.S.; Sigurdsson, S.T.; Prisner, T.F. Dynamics of nucleic acids at room temperature revealed by pulsed EPR spectroscopy. Angew. Chem. Int. Ed. 2018, 57, 10540–10543. [Google Scholar] [CrossRef] [PubMed]
- Grytz, C.M.; Kazemi, S.; Marko, A.; Cekan, P.; Güntert, P.; Sigurdsson, S.T.; Prisner, T.F. Determination of helix orientations in a flexible DNA by multi-frequency EPR spectroscopy. Phys. Chem. Chem. Phys. 2017, 19, 29801–29811. [Google Scholar] [CrossRef] [PubMed]
- Dastvan, R.; Brouwer, E.-M.; Schuetz, D.; Mirus, O.; Schleiff, E.; Prisner, T.F. Relative orientation of potra domains from cyanobacterial OMP85 studied by pulsed EPR spectroscopy. Biophys. J. 2016, 110, 2195–2206. [Google Scholar] [CrossRef] [PubMed]
- Richert, S.; Tait, C.E.; Timmel, C.R. Delocalisation of photoexcited triplet states probed by transient EPR and hyperfine spectroscopy. J. Magn. Reson. 2017, 280, 103–116. [Google Scholar] [CrossRef] [PubMed]
- Bowen, A.M.; Jones, M.W.; Lovett, J.E.; Gaule, T.G.; McPherson, M.J.; Dilworth, J.R.; Timmel, C.R.; Harmer, J.R. Exploiting orientation-selective deer: Determining molecular structure in systems containing Cu(II) centres. Phys. Chem. Chem. Phys. 2016, 18, 5981–5994. [Google Scholar] [CrossRef] [PubMed] [Green Version]
- Tait, C.E.; Neuhaus, P.; Anderson, H.L.; Timmel, C.R. Triplet state delocalization in a conjugated porphyrin dimer probed by transient electron paramagnetic resonance techniques. J. Am. Chem. Soc. 2015, 137, 6670–6679. [Google Scholar] [CrossRef] [PubMed]
- Van Doorslaer, S.; Cuypers, B. Electron paramagnetic resonance of globin proteins—A successful match between spectroscopic development and protein research. Mol. Phys. 2018, 116, 287–309. [Google Scholar] [CrossRef]
- Van Doorslaer, S. Hyperfine spectroscopy: ESEEM. eMagRes 2017, 51–69. [Google Scholar] [CrossRef]
- Motion, C.L.; Lovett, J.E.; Bell, S.; Cassidy, S.L.; Cruickshank, P.A.S.; Bolton, D.R.; Hunter, R.I.; El Mkami, H.; Van Doorslaer, S.; Smith, G.M. Deer sensitivity between iron centers and nitroxides in heme-containing proteins improves dramatically using broadband, high-field EPR. J. Phys. Chem. Lett. 2016, 7, 1411–1415. [Google Scholar] [CrossRef] [PubMed] [Green Version]
- Weber, S. Transient EPR. eMagRes 2017, 6, 255–269. [Google Scholar]
- Nohr, D.; Paulus, B.; Rodriguez, R.; Okafuji, A.; Bittl, R.; Schleicher, E.; Weber, S. Determination of radical–radical distances in light-active proteins and their implication for biological magnetoreception. Angew. Chem. Int. Ed. 2017, 56, 8550–8554. [Google Scholar] [CrossRef] [PubMed]
- Biskup, T.; Sommer, M.; Rein, S.; Meyer, D.L.; Kohlstädt, M.; Würfel, U.; Weber, S. Ordering of pcdtbt revealed by time-resolved electron paramagnetic resonance spectroscopy of its triplet excitons. Angew. Chem. Int. Ed. 2015, 54, 7707–7710. [Google Scholar] [CrossRef] [PubMed]
- Mims, W.B. Pulsed ENDOR experiments. Proc. R. Soc. Lond. Ser. A 1965, 283, 452–457. [Google Scholar] [CrossRef]
- Davies, E.R. New pulse ENDOR technique. Phys. Lett. A 1974, 47, 1–2. [Google Scholar] [CrossRef]
- Doan, P.E.; Lees, N.S.; Shanmugam, M.; Hoffman, B.M. Simulating suppression effects in pulsed ENDOR, and the ‘hole in the middle’ of mims and davies ENDOR spectra. Appl. Magn. Reson. 2010, 37, 763–779. [Google Scholar] [CrossRef] [PubMed]
- Van Gastel, M.; Lubitz, W. EPR investigation of [NiFe] hydrogenases. In High Resolution EPR; Berliner, L., Hanson, G., Eds.; Springer: New York, NY, USA, 2009; Volume 28, pp. 441–470. [Google Scholar]
- Mims, W.B. Envelope modulation in spin-echo experiments. Phys. Rev. B 1972, 5, 2409–2418. [Google Scholar] [CrossRef]
- Flanagan, H.L.; Singel, D.J. Analysis of n-14 eseem patterns of randomly oriented solids. J. Chem. Phys. 1987, 87, 5606–5616. [Google Scholar] [CrossRef]
- Flanagan, H.L.; Gerfen, G.J.; Lai, A.; Singel, D.J. Orientation-selective N-14 electron-spin echo envelope modulation (ESEEM)—The determination of N-14 quadrupole coupling tensor principal axis orientations in orientationally disordered solids. J. Chem. Phys. 1988, 88, 2162–2168. [Google Scholar] [CrossRef]
- Käß, H.; Bitters-Mannweidlich, E.; Andreasson, L.E.; Bönigk, B.; Lubitz, W. ENDOR and eseem of the 15N labeled labeled radical cations of chlorophyll a and the primary donor P700 in photosystem I. Chem. Phys. 1995, 194, 419–432. [Google Scholar]
- Käß, H.; Fromme, P.; Lubitz, W. Quadrupole parameters of nitrogen nuclei in the cation radical P700·+ determined by eseem of single crystals of photosystem I. Chem. Phys. Lett. 1996, 257, 197–206. [Google Scholar]
- Käß, H.; Lubitz, W. Evaluation of 2D-ESEEM data of N-15-labeled radical cations of the primary donor P-700 in photosystem I and chlorophyll a. Chem. Phys. Lett. 1996, 251, 193–203. [Google Scholar]
- Bloess, A.; Möbius, K.; Prisner, T.F. High-frequency/high-field electron spin echo envelope modulation study of nitrogen hyperfine and quadrupole interactions on a disordered powder sample. J. Magn. Reson. 1998, 134, 30–35. [Google Scholar] [CrossRef] [PubMed]
- Savitsky, A.; Dubinskii, A.A.; Plato, M.; Grishin, Y.A.; Zimmermann, H.; Möbius, K. High-field EPR and eseem investigation of the nitrogen quadrupole interaction of nitroxide spin labels in disordered solids: Towards differentiation between polarity and proticity matrix effects on protein function. J. Phys. Chem. B 2008, 112, 9079–9090. [Google Scholar] [CrossRef] [PubMed]
- Höfer, P.; Grupp, A.; Nebenfuhr, H.; Mehring, M. Hyperfine sublevel correlation (HYSCORE) spectroscopy—A 2D electron-spin-resonance investigation of the squaric acid radical. Chem. Phys. Lett. 1986, 132, 279–282. [Google Scholar] [CrossRef]
- Silakov, A.; Reijerse, E.J.; Albracht, S.P.J.; Hatchikian, E.C.; Lubitz, W. The electronic structure of the H-cluster in the [FeFe]-hydrogenase from Desulfovibrio desulfuricans: A Q-band Fe-57-ENDOR and HYSCORE study. J. Am. Chem. Soc. 2007, 129, 11447–11458. [Google Scholar] [CrossRef] [PubMed]
- Gromov, I.; Shane, J.; Forrer, J.; Rakhmatoullin, R.; Rozentzwaig, Y.; Schweiger, A. A q-band pulse EPR/ENDOR spectrometer and the implementation of advanced one- and two-dimensional pulse EPR methodology. J. Magn. Reson. 2001, 149, 196–203. [Google Scholar] [CrossRef] [PubMed]
- Astashkin, A.V.; Enemark, J.H.; Raitsimring, A. 26.5–40 GHz Ka-band pulsed EPR spectrometer. Concept. Magn. Reson. B 2006, 29B, 125–136. [Google Scholar] [CrossRef]
- Goldfarb, D.; Lipkin, Y.; Potapov, A.; Gorodetsky, Y.; Epel, B.; Raitsimring, A.M.; Radoul, M.; Kaminker, I. Hyscore and deer with an upgraded 95 GHz pulse EPR spectrometer. J. Magn. Reson. 2008, 194, 8–15. [Google Scholar] [CrossRef] [PubMed]
- Goldfarb, D.; Kofman, V.; Libman, J.; Shanzer, A.; Rahmatouline, R.; Van Doorslaer, S.; Schweiger, A. Double nuclear coherence transfer (DONUT)-HYSCORE: A new tool for the assignment of nuclear frequencies in pulsed EPR experiments. J. Am. Chem. Soc. 1998, 120, 7020–7029. [Google Scholar] [CrossRef]
- Schosseler, P.; Wacker, T.; Schweiger, A. Pulsed eldor-detected NMR. Chem. Phys. Lett. 1994, 224, 319–324. [Google Scholar] [CrossRef]
- Kulik, L.; Epel, B.; Messinger, J.; Lubitz, W. Pulse EPR, Mn-55-ENDOR and eldor-detected NMR of the S-2-state of the oxygen evolving complex in photosystem II. Photosynth. Res. 2005, 84, 347–353. [Google Scholar] [CrossRef] [PubMed]
- Rapatskiy, L.; Cox, N.; Savitsky, A.; Ames, W.M.; Sander, J.; Nowaczyk, M.M.; Roegner, M.; Boussac, A.; Neese, F.; Messinger, J.; et al. Detection of the water-binding sites of the oxygen-evolving complex of photosystem II using W-band O-17 electron-electron double resonance-detected NMR spectroscopy. J. Am. Chem. Soc. 2012, 134, 16619–16634. [Google Scholar] [CrossRef] [PubMed]
- Cox, N.; Nalepa, A.; Pandelia, M.-E.; Lubitz, W.; Savitsky, A. Chapter nine—Pulse double-resonance EPR techniques for the study of metallobiomolecules. In Methods in Enzymology; Qin Peter, Z., Kurt, W., Eds.; Academic Press: Cambridge, MA, USA, 2015; Volume 563, pp. 211–249. [Google Scholar]
- Potapov, A.; Epel, B.; Goldfarb, D. A triple resonance hyperfine sublevel correlation experiment for assignment of electron-nuclear double resonance lines. J. Chem. Phys. 2008, 128, 052320. [Google Scholar] [CrossRef] [PubMed]
- Flores, M.; Agrawal, A.G.; van Gastel, M.; Gaertner, W.; Lubitz, W. Electron-electron double resonance-detected NMR to measure metal hyperfine interactions: Ni-61 in the Ni-B state of the [NiFe] hydrogenase of Desulfovibrio vulgaris miyazaki F. J. Am. Chem. Soc. 2008, 130, 2402–2403. [Google Scholar] [CrossRef] [PubMed]
- Jeschke, G.; Spiess, H.W. Nmr-correlated high-field electron paramagnetic resonance spectroscopy. Chem. Phys. Lett. 1998, 293, 9–18. [Google Scholar] [CrossRef]
- Potapov, A.; Pecht, I.; Goldfarb, D. Resolving ligand hyperfine couplings of type 1 and 2 Cu(II) in ascorbate oxidase by high field pulse EPR correlation spectroscopy. Phys. Chem. Chem. Phys. 2010, 12, 62–65. [Google Scholar] [CrossRef] [PubMed]
- Baute, D.; Goldfarb, D. The 17O hyperfine interaction in V17O(H217O)52+ and Mn(H217O)62+ determined by high field ENDOR aided by DFT calculations. J. Phys. Chem. A 2005, 109, 7865–7871. [Google Scholar] [CrossRef] [PubMed]
- Mehring, M.; Höfer, P.; Grupp, A. Pulsed electron nuclear double and triple resonance schemes. Ber. Bunsen-Ges. Phys. Chem. 1987, 91, 1132–1137. [Google Scholar] [CrossRef]
- Epel, B.; Goldfarb, D. Two-dimensional pulsed triple at 95 GHz. J. Magn. Reson. 2000, 146, 196–203. [Google Scholar] [CrossRef] [PubMed]
- Goldfarb, D.; Epel, B.; Zimmermann, H.; Jeschke, G. 2D triple in orientationally disordered samples—A means to resolve and determine relative orientation of hyperfine tensors. J. Magn. Reson. 2004, 168, 75–87. [Google Scholar] [CrossRef] [PubMed]
- Denysenkov, V.P.; Biglino, D.; Lubitz, W.; Prisner, T.F.; Bennati, M. Structure of the tyrosyl biradical in mouse R2 ribonucleotide reductase from high-field PELDOR. Angew. Chem. Int. Ed. 2008, 47, 1224–1227. [Google Scholar] [CrossRef] [PubMed]
- Denysenkov, V.P.; Prisner, T.F.; Stubbe, J.; Bennati, M. High-field pulsed electron-electron double resonance spectroscopy to determine the orientation of the tyrosyl radicals in ribonucleotide reductase. Proc. Natl. Acad. Sci. USA 2006, 103, 13386–13390. [Google Scholar] [CrossRef] [PubMed] [Green Version]
- Savitsky, A.; Dubinskii, A.A.; Flores, M.; Lubitz, W.; Möbius, K. Orientation-resolving pulsed electron dipolar high-field EPR spectroscopy on disordered solids: I. Structure of spin-correlated radical pairs in bacterial photosynthetic reaction centers. J. Phys. Chem. B 2007, 111, 6245–6262. [Google Scholar] [CrossRef] [PubMed]
- Polyhach, Y.; Godt, A.; Bauer, C.; Jeschke, G. Spin pair geometry revealed by high-field deer in the presence of conformational distributions. J. Magn. Reson. 2007, 185, 118–129. [Google Scholar] [CrossRef] [PubMed]
- Jeschke, G. Pro and contra of pulse eldor. EPR Newsletter 2005, 14, 14–16. [Google Scholar]
- Klare, J.P.; Steinhoff, H.-J. Site-directed spin labeling and pulse dipolar electron paramagnetic resonance. In Encyclopedia of Analytical Chemistry; Meyers, R.A., Ed.; John Wiley: Chichester, UK, 2010. [Google Scholar]
- Borbat, P.P.; Freed, J.H. Measuring distances by pulsed dipolar ESR spectroscopy: Spin-labeled histidine kinases. In Methods in Enzymology; Simon, M.I., Crane, B.R., Crane, A., Eds.; Elsevier: New York, NY, USA, 2007; Volume 423, pp. 52–116. [Google Scholar]
- Böhme, S.; Steinhoff, H.-J.; Klare, J.P. Accessing the distance range of interest in biomolecules; site-directed spin labeling and deer spectroscopy. Spectroscopy 2010, 24, 283–288. [Google Scholar] [CrossRef]
- Kurshev, V.V.; Raitsimring, A.M.; Tsvetkov, Y.D. Selection of dipolar interaction by the 2+1 pulse train ese. J. Magn. Reson. 1989, 81, 441–454. [Google Scholar] [CrossRef]
- Milov, A.D.; Maryasov, A.G.; Tsvetkov, Y.D. Pulsed electron double resonance (PELDOR) and its applications in free-radicals research. Appl. Magn. Reson. 1998, 15, 107–143. [Google Scholar] [CrossRef]
- Pfannebecker, V.; Klos, H.; Hubrich, M.; Volkmer, T.; Heuer, A.; Wiesner, U.; Spiess, H.W. Determination of end-to-end distances in oligomers by pulsed EPR. J. Phys. Chem. 1996, 100, 13428–13432. [Google Scholar] [CrossRef]
- Martin, R.E.; Pannier, M.; Diederich, F.; Gramlich, V.; Hubrich, M.; Spiess, H.W. Determination of end-to-end distances in a series of tempo diradicals of up to 2.8 nm length with a new four-pulse double electron electron resonance experiment. Angew. Chem. Int. Ed. 1998, 37, 2834–2837. [Google Scholar] [CrossRef]
- Larsen, R.G.; Singel, D.J. Double electron-electron resonance spin-echo modulation—Spectroscopic measurement of electron-spin pair separations in orientationally disordered solids. J. Chem. Phys. 1993, 98, 5134–5146. [Google Scholar] [CrossRef]
- Milov, A.D.; Ponomarev, A.B.; Tsvetkov, Y.D. Electron-electron double resonance in electron spin echo: Model biradical systems and the sensitized photolysis of decalin. Chem. Phys. Lett. 1984, 110, 67–72. [Google Scholar] [CrossRef]
- Pannier, M.; Veit, S.; Godt, A.; Jeschke, G.; Spiess, H.W. Dead-time free measurement of dipole-dipole interactions between electron spins. J. Magn. Reson. 2000, 142, 331–340. [Google Scholar] [CrossRef] [PubMed]
- Saxena, S.; Freed, J.H. Two dimensional electron spin resonance and slow motions. J. Phys. Chem. A 1997, 101, 7998–8008. [Google Scholar] [CrossRef]
- Kulik, L.V.; Dzuba, S.A.; Grigoryev, I.A.; Tsvetkov, Y.D. Electron dipole-dipole interaction in eseem of nitroxide biradicals. Chem. Phys. Lett. 2001, 343, 315–324. [Google Scholar] [CrossRef]
- Bennati, M.; Prisner, T.F. New developments in high field electron paramagnetic resonance with applications in structural biology. Rep. Prog. Phys. 2005, 68, 411–448. [Google Scholar] [CrossRef]
- Denysenkov, V.P.; Prisner, T.F.; Stubbe, J.; Bennati, M. High-frequency 180 GHz PELDOR. Appl. Magn. Reson. 2005, 29, 375–384. [Google Scholar] [CrossRef]
- Holldack, K.; Schnegg, A. Thz electron paramagnetic resonance/THz spectroscopy at bessy II. JLSRF 2016, 2, A51. [Google Scholar] [CrossRef]
- Schnegg, A. Very-high-frequency EPR. eMagRes 2017, 6, 115–131. [Google Scholar]
- Ohta, H.; Okubo, S.; Ohmichi, E.; Sakurai, T.; Zhang, W.-M.; Shimokawa, T. Developments of multi-extreme high field ESR in Kobe. J. Low Temp. Phys. 2013, 170, 511–519. [Google Scholar] [CrossRef]
- Krzystek, J.; Ozarowski, A.; van Tol, J.; Liu, J.; Hill, S. High-frequency and high-field EPR/ESR in tallahassee. EPR Newsl. 2007, 22, 12–14. [Google Scholar]
- Hubbell, W.L.; Altenbach, C. Investigation of structure and dynamics in membrane-proteins using site-directed spin-labeling. Curr. Opin. Struct. Biol. 1994, 4, 566–573. [Google Scholar] [CrossRef]
- Davydov, D.R.; Yang, Z.; Davydova, N.; Halpert, J.R.; Hubbell, W.L. Conformational mobility in cytochrome p450 3a4 explored by pressure-perturbation EPR spectroscopy. Biophys. J. 2016, 110, 1485–1498. [Google Scholar] [CrossRef] [PubMed]
- Lerch, M.T.; Yang, Z.; Brooks, E.K.; Hubbell, W.L. Mapping protein conformational heterogeneity under pressure with site-directed spin labeling and double electron–electron resonance. Proc. Natl. Acad. Sci. USA 2014, 111, E1201–E1210. [Google Scholar] [CrossRef] [PubMed] [Green Version]
- Van Eps, N.; Altenbach, C.; Caro, L.N.; Latorraca, N.R.; Hollingsworth, S.A.; Dror, R.O.; Ernst, O.P.; Hubbell, W.L. G(i)- and G(s)-coupled gpcrs show different modes of g-protein binding. Proc. Natl. Acad. Sci. USA 2018, 115, 2383–2388. [Google Scholar] [CrossRef] [PubMed]
- Van Eps, N.; Caro, L.N.; Morizumi, T.; Kusnetzow, A.K.; Szczepek, M.; Hofmann, K.P.; Bayburt, T.H.; Sligar, S.G.; Ernst, O.P.; Hubbell, W.L. Conformational equilibria of light-activated rhodopsin in nanodiscs. Proc. Natl. Acad. Sci. USA 2017, 114, E3268–E3275. [Google Scholar] [CrossRef] [PubMed]
- Yang, Z.Y.; Bridges, M.D.; Lopez, C.J.; Rogozhnikova, O.Y.; Trukhin, D.V.; Brooks, E.K.; Tormyshev, V.; Halpern, H.J.; Hubbell, W.L. A triarylmethyl spin label for long-range distance measurement at physiological temperatures using t−1 relaxation enhancement. J. Magn. Reson. 2016, 269, 50–54. [Google Scholar] [CrossRef] [PubMed]
- Altenbach, C.; López, C.J.; Hideg, K.; Hubbell, W.L. Chapter three—Exploring structure, dynamics, and topology of nitroxide spin-labeled proteins using continuous-wave electron paramagnetic resonance spectroscopy. In Methods in Enzymology; Qin, P.Z., Warncke, K., Eds.; Academic Press: Cambridge, MA, USA, 2015; Volume 564, pp. 59–100. [Google Scholar]
- Lerch, M.T.; Yang, Z.; Altenbach, C.; Hubbell, W.L. Chapter two—High-pressure EPR and site-directed spin labeling for mapping molecular flexibility in proteins. In Methods in Enzymology; Qin, P.Z., Warncke, K., Eds.; Academic Press: Cambridge, MA, USA, 2015; Volume 564, pp. 29–57. [Google Scholar]
- Yang, Z.; Bridges, M.; Lerch, M.T.; Altenbach, C.; Hubbell, W.L. Chapter one—Saturation recovery EPR and nitroxide spin labeling for exploring structure and dynamics in proteins. In Methods in Enzymology; Qin, P.Z., Warncke, K., Eds.; Academic Press: Cambridge, MA, USA, 2015; Volume 564, pp. 3–27. [Google Scholar]
- López, C.J.; Fleissner, M.R.; Brooks, E.K.; Hubbell, W.L. Stationary-phase EPR for exploring protein structure, conformation, and dynamics in spin-labeled proteins. Biochemistry 2014, 53, 7067–7075. [Google Scholar] [CrossRef] [PubMed]
- Yang, Z.; Jiménez-Osés, G.; López, C.J.; Bridges, M.D.; Houk, K.N.; Hubbell, W.L. Long-range distance measurements in proteins at physiological temperatures using saturation recovery EPR spectroscopy. J. Am. Chem. Soc. 2014, 136, 15356–15365. [Google Scholar] [CrossRef] [PubMed]
- Schredelseker, J.; Paz, A.; López, C.J.; Altenbach, C.; Leung, C.S.; Drexler, M.K.; Chen, J.-N.; Hubbell, W.L.; Abramson, J. High resolution structure and double electron-electron resonance of the zebrafish voltage-dependent anion channel 2 reveal an oligomeric population. J. Biol. Chem. 2014, 289, 12566–12577. [Google Scholar] [CrossRef] [PubMed]
- Hubbell, W.L.; López, C.J.; Altenbach, C.; Yang, Z. Technological advances in site-directed spin labeling of proteins. Curr. Opin. Struct. Biol. 2013, 23, 725–733. [Google Scholar] [CrossRef] [PubMed] [Green Version]
- Toledo Warshaviak, D.; Khramtsov, V.V.; Cascio, D.; Altenbach, C.; Hubbell, W.L. Structure and dynamics of an imidazoline nitroxide side chain with strongly hindered internal motion in proteins. J. Magn. Reson. 2013, 232, 53–61. [Google Scholar] [CrossRef] [PubMed] [Green Version]
- López, C.J.; Oga, S.; Hubbell, W.L. Mapping molecular flexibility of proteins with site-directed spin labeling: A case study of myoglobin. Biochemistry 2012, 51, 6568–6583. [Google Scholar] [CrossRef] [PubMed]
- Borovykh, I.V.; Ceola, S.; Gajula, P.; Gast, P.; Steinhoff, H.J.; Huber, M. Distance between a native cofactor and a spin label in the reaction centre of rhodobacter sphaeroides by a two-frequency pulsed electron paramagnetic resonance method and molecular dynamics simulations. J. Magn. Reson. 2006, 180, 178–185. [Google Scholar] [CrossRef] [PubMed]
- Bordignon, E.; Steinhoff, H.-J. Membrane protein structure and dynamics studied by site-directed spin-labeling ESR. In ESR Spectroscopy in Membrane Biophysics, Biological Magnetic Resonance; Hemminga, M.A., Berliner, L.J., Eds.; Elsevier: New York, NY, USA, 2007; Volume 27, pp. 129–164. [Google Scholar]
- Gajula, P.; Borovykh, I.V.; Beier, C.; Shkuropatova, T.; Gast, P.; Steinhoff, H.J. Spin-labeled photosynthetic reaction centers from Rhodobacter sphaeroides studied by electron paramagnetic resonance spectroscopy and molecular dynamics simulations. Appl. Magn. Reson. 2007, 31, 167–178. [Google Scholar] [CrossRef]
- Grote, M.; Bordignon, E.; Polyhach, Y.; Jeschke, G.; Steinhoff, H.-J.; Schneider, E. A comparative electron paramagnetic resonance study of the nucleotide-binding domains’ catalytic cycle in the assembled maltose atp-binding cassette importer. Biophys. J. 2008, 95, 2924–2938. [Google Scholar] [CrossRef] [PubMed]
- Padmavathi, P.V.L.; Steinhoff, H.-J. Conformation of the closed channel state of colicin a in proteoliposomes: An umbrella model. J. Mol. Biol. 2008, 378, 204–214. [Google Scholar] [CrossRef] [PubMed]
- Böhme, S.; Padmavathi, P.V.L.; Holterhues, J.; Ouchni, F.; Klare, J.P.; Steinhoff, H.-J. Topology of the amphipathic helices of the colicin a pore-forming domain in E. coli lipid membranes studied by pulse EPR. Phys. Chem. Chem. Phys. 2009, 11, 6770–6777. [Google Scholar] [CrossRef] [PubMed]
- Klare, J.P.; Steinhoff, H.-J. Spin labeling EPR. Photosynth. Res. 2009, 102, 377–390. [Google Scholar] [CrossRef] [PubMed]
- Bordignon, E.; Brutlach, H.; Urban, L.; Hideg, K.; Savitsky, A.; Schnegg, A.; Gast, P.; Engelhard, M.; Groenen, E.J.J.; Möbius, K.; et al. Heterogeneity in the nitroxide micro-environment: Polarity and proticity effects in spin-labeled proteins studied by multi-frequency EPR. Appl. Magn. Reson. 2010, 37, 391–403. [Google Scholar] [CrossRef]
- Böhme, S.; Meyer, S.; Krueger, A.; Steinhoff, H.-J.; Wittinghofer, A.; Klare, J.P. Stabilization of g domain conformations in the trna-modifying mnme-gida complex observed with double electron electron resonance spectroscopy. J. Biol. Chem. 2010, 285, 16991–17000. [Google Scholar] [CrossRef] [PubMed]
- Grohmann, D.; Klose, D.; Klare, J.P.; Kay, C.W.M.; Steinhoff, H.-J.; Werner, F. Rna-binding to archaeal rna polymerase subunits F/E: A deer and fret study. J. Am. Chem. Soc. 2010, 132, 5954–5955. [Google Scholar] [CrossRef] [PubMed]
- Abe, C.; Klose, D.; Dietrich, F.; Ziegler, W.H.; Polyhach, Y.; Jeschke, G.; Steinhoff, H.-J. Orientation selective deer measurements on vinculin tail at X-band frequencies reveal spin label orientations. J. Magn. Reson. 2012, 216, 53–61. [Google Scholar] [CrossRef] [PubMed]
- Pulagam, L.P.; Steinhoff, H.-J. Acidic PH-induced membrane insertion of colicin a into E. coli natural lipids probed by site-directed spin labeling. J. Mol. Biol. 2013, 425, 1782–1794. [Google Scholar] [CrossRef] [PubMed]
- Dunkel, S.; Pulagam, L.P.; Steinhoff, H.J.; Klare, J.P. In vivo EPR on spin labeled colicin a reveals an oligomeric assembly of the pore-forming domain in E. coli membranes. Phys. Chem. Chem. Phys. 2015, 17, 4875–4878. [Google Scholar] [CrossRef] [PubMed]
- Klare, J.P.; Steinhoff, H.-J. Spin labeling studies of transmembrane signaling and transport: Applications to phototaxis, abc transporters and symporters. In Methods in Enzymology; Qin, P.Z., Warncke, K., Eds.; Elsevier: Amsterdam, The Netherlands, 2015; Volume 564, pp. 315–347. [Google Scholar]
- Voskoboynikova, N.; Mosslehy, W.; Colbasevici, A.; Ismagulova, T.T.; Bagrov, D.V.; Akovantseva, A.A.; Timashev, P.S.; Mulkidjanian, A.Y.; Bagratashvili, V.N.; Shaitan, K.V.; et al. Characterization of an archaeal photoreceptor/transducer complex from natronomonas pharaonis assembled within styrene-maleic acid lipid particles. RSC Adv. 2017, 7, 51324–51334. [Google Scholar] [CrossRef]
- Savitsky, A.; Möbius, K. High-field EPR. Photosynth. Res. 2009, 102, 311–333. [Google Scholar] [CrossRef] [PubMed]
- Bagryanskaya, E.G.; Bardelang, D.; Chenesseau, S.; Finet, J.P.; Jicsinszky, L.; Karoui, H.; Marque, S.R.A.; Möbius, K.; Polovyanenko, D.; Savitsky, A.; et al. EPR, NMR, and thermodynamic evidences for forced nuclear spin-electron spin interactions in the case of 1-phenyl-2-methylpropyl-1,1-dimethyl-2-nitroxide (TIPNO) attached to permethylated beta-cyclodextrin. Appl. Magn. Reson. 2009, 36, 181–194. [Google Scholar] [CrossRef]
- Savitsky, A.; Plato, M.; Möbius, K. The temperature dependence of nitroxide spin-label interaction parameters: A high-field EPR study of intramolecular motional contributions. Appl. Magn. Reson. 2010, 37, 415–434. [Google Scholar] [CrossRef]
- Savitsky, A.; Dubinskii, A.A.; Zimmermann, H.; Lubitz, W.; Möbius, K. High-field dipolar electron paramagnetic resonance (EPR) spectroscopy of nitroxide biradicals for determining three-dimensional structures of biomacromolecules in disordered solids. J. Phys. Chem. B 2011, 115, 11950–11963. [Google Scholar] [CrossRef] [PubMed]
- Bode, B.E.; Plackmeyer, J.; Prisner, T.F.; Schiemann, O. PELDOR measurements on a nitroxide-labeled Cu(II) porphyrin: Orientation selection, spin-density distribution, and conformational flexibility. J. Phys. Chem. A 2008, 112, 5064–5073. [Google Scholar] [CrossRef] [PubMed]
- Bode, B.E.; Dastvan, R.; Prisner, T.F. Pulsed electron-electron double resonance (PELDOR) distance measurements in detergent micelles. J. Magn. Reson. 2011, 211, 11–17. [Google Scholar] [CrossRef] [PubMed]
- Dastvan, R.; Bode, B.E.; Karuppiah, M.P.R.; Marko, A.; Lyubenova, S.; Schwalbe, H.; Prisner, T.F. Optimization of transversal relaxation of nitroxides for pulsed electron-electron double resonance spectroscopy in phospholipid membranes. J. Phys. Chem. B 2010, 114, 13507–13516. [Google Scholar] [CrossRef] [PubMed]
- Endeward, B.; Butterwick, J.A.; MacKinnon, R.; Prisner, T.F. Pulsed electron-electron double-resonance determination of spin-label distances and orientations on the tetrameric potassium ion channel kcsa. J. Am. Chem. Soc. 2009, 131, 15246–15250. [Google Scholar] [CrossRef] [PubMed]
- Marko, A.; Prisner, T.F. An algorithm to analyze PELDOR data of rigid spin label pairs. Phys. Chem. Chem. Phys. 2013, 15, 619–627. [Google Scholar] [CrossRef] [PubMed]
- Joseph, B.; Sikora, A.; Bordignon, E.; Jeschke, G.; Cafiso, D.S.; Prisner, T.F. Distance measurement on an endogenous membrane transporter in e-coli cells and native membranes using EPR spectroscopy. Angew. Chem. Int. Ed. 2015, 54, 6196–6199. [Google Scholar] [CrossRef] [PubMed]
- Joseph, B.; Tormyshev, V.M.; Rogozhnikova, O.Y.; Akhmetzyanov, D.; Bagryanskaya, E.G.; Prisner, T.F. Selective high-resolution detection of membrane protein-ligand interaction in native membranes using trityl-nitroxide PELDOR. Angew. Chem. Int. Ed. 2016, 55, 11538–11542. [Google Scholar] [CrossRef] [PubMed]
- Pliotas, C.; Ward, R.; Branigan, E.; Rasmussen, A.; Hagelueken, G.; Huang, H.; Black, S.S.; Booth, I.R.; Schiemann, O.; Naismith, J.H. Conformational state of the mscs mechanosensitive channel in solution revealed by pulsed electron-electron double resonance (PELDOR) spectroscopy. Proc. Natl. Acad. Sci. USA 2012, 109, E2675–E2682. [Google Scholar] [CrossRef] [PubMed]
- Reginsson, G.W.; Schiemann, O. Pulsed electron-electron double resonance: Beyond nanometre distance measurements on biomacromolecules. Biochem. J. 2011, 434, 353–363. [Google Scholar] [CrossRef] [PubMed]
- Reginsson, G.W.; Shelke, S.A.; Rouillon, C.; White, M.F.; Sigurdsson, S.T.; Schiemann, O. Protein-induced changes in DNA structure and dynamics observed with noncovalent site-directed spin labeling and PELDOR. Nucl. Acids Res. 2013, 41, e11. [Google Scholar] [CrossRef] [PubMed]
- Schiemann, O. Studying protein DNA binding with PELDOR. Biophys. J. 2011, 100, 2. [Google Scholar] [CrossRef]
- Bode, B.E.; Plackmeyer, J.; Bolte, M.; Prisner, T.F.; Schiemann, O. PELDOR on an exchange coupled nitroxide copper(II) spin pair. J. Organomet. Chem. 2009, 694, 1172–1179. [Google Scholar] [CrossRef]
- Hagelueken, G.; Ingledew, W.J.; Huang, H.; Petrovic-Stojanovska, B.; Whitfield, C.; ElMkami, H.; Schiemann, O.; Naismith, J.H. PELDOR spectroscopy distance fingerprinting of the octameric outer-membrane protein wza from Escherichia coli. Angew. Chem. Int. Ed. 2009, 48, 2904–2906. [Google Scholar] [CrossRef] [PubMed]
- Schiemann, O.; Cekan, P.; Margraf, D.; Prisner, T.F.; Sigurdsson, S.T. Relative orientation of rigid nitroxides by PELDOR: Beyond distance measurements in nucleic acids. Angew. Chem. Int. Ed. 2009, 48, 3292–3295. [Google Scholar] [CrossRef] [PubMed]
- Frolow, O.; Endeward, B.; Schiemann, O.; Prisner, T.F.; Engels, J.W. Tpa labelled oligonucleotides for long range distance measurements by EPR. In Proceedings of the 14th Symposium on Chemistry of Nucleic Acid Components, Cesky Krumlov, Czech Republic, 8–13 June 2008; Hocek, M., Ed.; 2008; Volume 10, pp. 343–344. [Google Scholar]
- Frolow, O.; Endeward, B.; Schiemann, O.; Prisner, T.F.; Engels, J.W. Nitroxide spin labeled rna for long range distance measurements by EPR-PELDOR. Nucl. Acids Symp. Ser. 2008, 153–154. [Google Scholar] [CrossRef] [PubMed]
- Abdullin, D.; Florin, N.; Hagelueken, G.; Schiemann, O. EPR-based approach for the localization of paramagnetic metal ions in biomolecules. Angew. Chem. Int. Ed. 2015, 54, 1827–1831. [Google Scholar] [CrossRef] [PubMed]
- Yin, D.M.; Hannam, J.S.; Schmitz, A.; Schiemann, O.; Hagelueken, G.; Famulok, M. Studying the conformation of a receptor tyrosine kinase in solution by inhibitor-based spin labeling. Angew. Chem. Int. Ed. 2017, 56, 8417–8421. [Google Scholar] [CrossRef] [PubMed]
- Hagelueken, G.; Hoffmann, J.; Schubert, E.; Duthie, F.G.; Florin, N.; Konrad, L.; Imhof, D.; Behrmann, E.; Morgner, N.; Schiemann, O. Studies on the X-ray and solution structure of feob from Escherichia coli BL21. Biophys. J. 2016, 110, 2642–2650. [Google Scholar] [CrossRef] [PubMed]
- Polyhach, Y.; Bordignon, E.; Tschaggelar, R.; Gandra, S.; Godt, A.; Jeschke, G. High sensitivity and versatility of the deer experiment on nitroxide radical pairs at Q-band frequencies. Phys. Chem. Chem. Phys. 2012, 14, 10762–10773. [Google Scholar] [CrossRef] [PubMed]
- Jeschke, G. Deer distance measurements on proteins. Annu. Rev. Phys. Chem. 2012, 63, 419–446. [Google Scholar] [CrossRef] [PubMed]
- Gmeiner, C.; Klose, D.; Mileo, E.; Belle, V.; Marque, S.R.A.; Dorn, G.; Allain, F.H.T.; Guigliarelli, B.; Jeschke, G.; Yulikov, M. Orthogonal tyrosine and cysteine site-directed spin labeling for dipolar pulse EPR spectroscopy on proteins. J. Phys. Chem. Lett. 2017, 8, 4852–4857. [Google Scholar] [CrossRef] [PubMed]
- Gobbo, M.; Biondi, B.; De Zotti, M.; Milov, A.D.; Tsvetkov, Y.D.; Maryasov, A.G.; Formaggio, F.; Toniolo, C. Conformational properties of the spin-labeled tylopeptin b and heptaibin peptaibiotics based on PELDOR spectroscopy data. J. Pept. Sci. 2012, 18, S59–S60. [Google Scholar]
- Kuznetsov, N.A.; Milov, A.D.; Isaev, N.P.; Vorobjev, Y.N.; Koval, V.V.; Dzuba, S.A.; Fedorova, O.S.; Tsvetkov, Y.D. PELDOR analysis of enzyme-induced structural changes in damaged DNA duplexes. Mol. Biosyst. 2011, 7, 2670–2680. [Google Scholar] [CrossRef] [PubMed]
- Kuznetsov, N.A.; Milov, A.D.; Koval, V.V.; Samoilova, R.I.; Grishin, Y.A.; Knorre, D.G.; Tsvetkov, Y.D.; Fedorova, O.S.; Dzuba, S.A. PELDOR study of conformations of double-spin-labeled single- and double-stranded DNA with non-nucleotide inserts. Phys. Chem. Chem. Phys. 2009, 11, 6826–6832. [Google Scholar] [CrossRef] [PubMed]
- Milov, A.D.; Samoilova, R.I.; Tsvetkov, Y.D.; De Zotti, M.; Formaggio, F.; Toniolo, C.; Handgraaf, J.-W.; Raap, J. Structure of self-aggregated alamethicin in epc membranes detected by pulsed electron-electron double resonance and electron spin echo envelope modulation spectroscopies. Biophys. J. 2009, 96, 3197–3209. [Google Scholar] [CrossRef] [PubMed]
- Milov, A.D.; Samoilova, R.I.; Tsvetkov, Y.D.; De Zotti, M.; Toniolo, C.; Raap, J. PELDOR conformational analysis of bis-labeled alamethicin aggregated in phospholipid vesicles. J. Phys. Chem. B 2008, 112, 13469–13472. [Google Scholar] [CrossRef] [PubMed]
- Milov, A.D.; Samoilova, R.I.; Tsvetkov, Y.D.; Formaggio, F.; Toniolo, C.; Raap, J. Self-aggregation of spin-labeled alamethicin in epc vesicles studied by pulsed electron-electron double resonance. J. Am. Chem. Soc. 2007, 129, 9260–9261. [Google Scholar] [CrossRef] [PubMed]
- Milov, A.D.; Tsvetkov, Y.D.; Gorbunova, E.Y.; Mustaeva, L.G.; Ovchinnikova, T.V.; Handgraaf, J.-W.; Raap, J. Solvent effects on the secondary structure of the membrane-active zervamicin determined by PELDOR spectroscopy. Chem. Biodivers. 2007, 4, 1243–1255. [Google Scholar] [CrossRef] [PubMed]
- Smith, A.K.; Freed, J.H. Dynamics and ordering of lipid spin-labels along the coexistence curve of two membrane phases: An ESR study. Chem. Phys. Lipids 2012, 165, 348–361. [Google Scholar] [CrossRef] [PubMed] [Green Version]
- Dzikovski, B.; Tipikin, D.; Freed, J. Conformational distributions and hydrogen bonding in gel and frozen lipid bilayers: A high frequency spin-label ESR study. J. Phys. Chem. B 2012, 116, 6694–6706. [Google Scholar] [CrossRef] [PubMed]
- Georgieva, E.R.; Roy, A.S.; Grigoryants, V.M.; Borbat, P.P.; Earle, K.A.; Scholes, C.P.; Freed, J.H. Effect of freezing conditions on distances and their distributions derived from double electron electron resonance (DEER): A study of doubly-spin-labeled T4 lysozyme. J. Magn. Reson. 2012, 216, 69–77. [Google Scholar] [CrossRef] [PubMed]
- Dzikovski, B.G.; Borbat, P.P.; Freed, J.H. Channel and nonchannel forms of spin-labeled gramicidin in membranes and their equilibria. J. Phys. Chem. B 2011, 115, 176–185. [Google Scholar] [CrossRef] [PubMed]
- Zhang, Z.; Fleissner, M.R.; Tipikin, D.S.; Liang, Z.; Moscicki, J.K.; Earle, K.A.; Hubbell, W.L.; Freed, J.H. Multifrequency electron spin resonance study of the dynamics of spin labeled T4 lysozyme. J. Phys. Chem. B 2010, 114, 5503–5521. [Google Scholar] [CrossRef] [PubMed]
- Orlando, B.J.; Borbat, P.P.; Georgieva, E.R.; Freed, J.H.; Malkowski, M.G. Pulsed dipolar spectroscopy reveals that tyrosyl radicals are generated in both monomers of the cyclooxygenase-2 dimer. Biochemistry 2015, 54, 7309–7312. [Google Scholar] [CrossRef] [PubMed]
- Sun, Y.; Borbat, P.P.; Grigoryants, V.M.; Myers, W.K.; Freed, J.H.; Soholes, C.P. Pulse dipolar ESR of doubly labeled mini tar DNA and its annealing to mini tar RNA. Biophys. J. 2015, 108, 893–902. [Google Scholar] [CrossRef] [PubMed]
- Lai, A.L.; Clerico, E.M.; Blackburn, M.E.; Patel, N.A.; Robinson, C.V.; Borbat, P.P.; Freed, J.H.; Gierasch, L.M. Key features of an Hsp70 chaperone allosteric landscape revealed by ion-mobility native mass spectrometry and double electron-electron resonance. J. Biol. Chem. 2017, 292, 8773–8785. [Google Scholar] [CrossRef] [PubMed] [Green Version]
- Eschmann, N.A.; Georgieva, E.R.; Ganguly, P.; Borbat, P.P.; Rappaport, M.D.; Akdogan, Y.; Freed, J.H.; Shea, J.-E.; Han, S. Signature of an aggregation-prone conformation of tau. Sci. Rep. 2017, 7, 44739. [Google Scholar] [CrossRef] [PubMed] [Green Version]
- Bahrenberg, T.; Rosenski, Y.; Carmieli, R.; Zibzener, K.; Qi, M.; Frydrnan, V.; Godt, A.; Goldfarb, D.; Feintuch, A. Improved sensitivity for W-band Gd(III)-Gd(III) and nitroxide-nitroxide deer measurements with shaped pulses. J. Magn. Reson. 2017, 283, 1–13. [Google Scholar] [CrossRef] [PubMed]
- Feintuch, A.; Otting, G.; Goldfarb, D. Gd3+ spin labeling for measuring distances in biomacromolecules: Why and how? In Methods in Enzymology; Qin, P.Z., Warncke, K., Eds.; Elsevier: Amsterdam, The Netherlands, 2015; Volume 563, pp. 415–457. [Google Scholar]
- Tkach, I.; Halbmair, K.; Hoebartner, C.; Bennati, M. High-frequency 263 GHz PELDOR. Appl. Magn. Reson. 2014, 45, 969–979. [Google Scholar] [CrossRef]
- Halbmair, K.; Wegner, J.; Diederichsen, U.; Bennati, M. Pulse EPR measurements of intramolecular distances in a topp-labeled transmembrane peptide in lipids. Biophys. J. 2016, 111, 2345–2348. [Google Scholar] [CrossRef] [PubMed]
- Clayton, J.A.; Qi, M.; Godt, A.; Goldfarb, D.; Han, S.G.; Sherwin, M.S. Gd3+-Gd3+ distances exceeding 3 nm determined by very high frequency continuous wave electron paramagnetic resonance. Phys. Chem. Chem. Phys. 2017, 19, 5127–5136. [Google Scholar] [CrossRef] [PubMed]
- Cohen, M.R.; Frydman, V.; Milko, P.; Iron, M.A.; Abdelkader, E.H.; Lee, M.D.; Swarbrick, J.D.; Raitsimring, A.; Otting, G.; Graham, B.; et al. Overcoming artificial broadening in Gd3+-Gd3+ distance distributions arising from dipolar pseudo-secular terms in deer experiments. Phys. Chem. Chem. Phys. 2016, 18, 12847–12859. [Google Scholar] [CrossRef] [PubMed]
- Abdelkader, E.H.; Lee, M.D.; Feintuch, A.; Cohen, M.R.; Swarbrick, J.D.; Otting, G.; Graham, B.; Goldfarb, D. A new Gd3+ spin label for Gd3+-Gd3+ distance measurements in proteins produces narrow distance distributions. J. Phys. Chem. Lett. 2015, 6, 5016–5021. [Google Scholar] [CrossRef] [PubMed]
- Abdelkader, E.H.; Yao, X.; Feintuch, A.; Adams, L.A.; Aurelio, L.; Graham, B.; Goldfarb, D.; Otting, G. Pulse EPR-enabled interpretation of scarce pseudocontact shifts induced by lanthanide binding tags. J. Biomol. NMR 2016, 64, 39–51. [Google Scholar] [CrossRef] [PubMed]
- Gophane, D.B.; Endeward, B.; Prisner, T.F.; Sigurdsson, S.T. A semi-rigid isoindoline-derived nitroxide spin label for RNA. Org. Biomol. Chem. 2018, 16, 816–824. [Google Scholar] [CrossRef] [PubMed]
- Stelzl, L.S.; Erlenbach, N.; Heinz, M.; Prisner, T.F.; Hummer, G. Resolving the conformational dynamics of DNA with angstrom resolution by pulsed electron-electron double resonance and molecular dynamics. J. Am. Chem. Soc. 2017, 139, 11674–11677. [Google Scholar] [CrossRef] [PubMed]
- Schnorr, K.A.; Gophane, D.B.; Helmling, C.; Cetiner, E.; Pasemann, K.; Furtig, B.; Wacker, A.; Qureshi, N.S.; Granz, M.; Barthelmes, D.; et al. Impact of spin label rigidity on extent and accuracy of distance information from pre data. J. Biomol. NMR 2017, 68, 53–63. [Google Scholar] [CrossRef] [PubMed]
- Weinrich, T.; Granz, M.; Grunewald, C.; Prisner, T.F.; Gobel, M.W. Synthesis of a cytidine phosphoramidite with protected nitroxide spin label for EPR experiments with RNA. Eur. J. Org. Chem. 2017, 491–496. [Google Scholar] [CrossRef]
- Kamble, N.R.; Granz, M.; Prisner, T.F.; Sigurdsson, S.T. Noncovalent and site-directed spin labeling of duplex RNA. Chem. Comm. 2016, 52, 14442–14445. [Google Scholar] [CrossRef] [PubMed]
- Akhmetzyanov, D.; Ching, H.Y.V.; Denysenkov, V.; Demay-Drouhard, P.; Bertrand, H.C.; Tabares, L.C.; Policar, C.; Prisner, T.F.; Un, S. Ridme spectroscopy on high-spin Mn2+ centers. Phys. Chem. Chem. Phys. 2016, 18, 30857–30866. [Google Scholar] [CrossRef] [PubMed]
- Schöps, P.; Plackmeyer, J.; Marko, A. Separation of intra- and intermolecular contributions to the PELDOR signal. J. Magn. Reson. 2016, 269, 70–77. [Google Scholar] [CrossRef] [PubMed]
- Erlenbach, N.; Endeward, B.; Schöps, P.; Gophane, D.B.; Sigurdsson, S.T.; Prisner, T.F. Flexibilities of isoindoline-derived spin labels for nucleic acids by orientation selective PELDOR. Phys. Chem. Chem. Phys. 2016, 18, 16196–16201. [Google Scholar] [CrossRef] [PubMed] [Green Version]
- Grytz, C.M.; Marko, A.; Cekan, P.; Sigurdsson, S.T.; Prisner, T.F. Flexibility and conformation of the cocaine aptamer studied by PELDOR. Phys. Chem. Chem. Phys. 2016, 18, 2993–3002. [Google Scholar] [CrossRef] [PubMed] [Green Version]
- Endeward, B.; Marko, A.; Denysenkov, V.P.; Sigurdsson, S.T.; Prisner, T.F. Advanced EPR methods for studying conformational dynamics of nucleic acids. In Methods in Enzymology; Qin, P.Z., Warncke, K., Eds.; Elsevier: Amsterdam, The Netherlands, 2015; Volume 564, pp. 403–425. [Google Scholar]
- Barthelmes, D.; Granz, M.; Barthelmes, K.; Allen, K.N.; Imperiali, B.; Prisner, T.; Schwalbe, H. Encoded loop-lanthanide-binding tags for long-range distance measurements in proteins by NMR and EPR spectroscopy. J. Biomol. NMR 2015, 63, 275–282. [Google Scholar] [CrossRef] [PubMed] [Green Version]
- Akhmetzyanov, D.; Schops, P.; Marko, A.; Kunjir, N.C.; Sigurdsson, S.T.; Prisner, T.F. Pulsed EPR dipolar spectroscopy at q- and g-band on a trityl biradical. Phys. Chem. Chem. Phys. 2015, 17, 24446–24451. [Google Scholar] [CrossRef] [PubMed]
- Prisner, T.F.; Marko, A.; Sigurdsson, S.T. Conformational dynamics of nucleic acid molecules studied by PELDOR spectroscopy with rigid spin labels. J. Magn. Reson. 2015, 252, 187–198. [Google Scholar] [CrossRef] [PubMed]
- Borbat, P.P.; Freed, J.H. Dipolar spectroscopy—Single-resonance methods. eMagRes 2017, 6, 465–493. [Google Scholar]
- Srivastava, M.; Georgieva, E.R.; Freed, J.H. A new wavelet denoising method for experimental time-domain signals: Pulsed dipolar electron spin resonance. J. Phys. Chem. A 2017, 121, 2452–2465. [Google Scholar] [CrossRef] [PubMed]
- Dzikovski, B.; Livshits, V.; Freed, J. Interaction of spin-labeled lipid membranes with transition metal ions. J. Phys. Chem. B 2015, 119, 13330–13346. [Google Scholar] [CrossRef] [PubMed]
- Wylie, B.J.; Dzikovski, B.G.; Pawsey, S.; Caporini, M.; Rosay, M.; Freed, J.H.; McDermott, A.E. Dynamic nuclear polarization of membrane proteins: Covalently bound spin-labels at protein-protein interfaces. J. Biomol. NMR 2015, 61, 361–367. [Google Scholar] [CrossRef] [PubMed]
- Samanta, D.; Borbat, P.P.; Dzikovski, B.; Freed, J.H.; Crane, B.R. Bacterial chemoreceptor dynamics correlate with activity state and are coupled over long distances. Proc. Natl. Acad. Sci. USA 2015, 112, 2455–2460. [Google Scholar] [CrossRef] [PubMed] [Green Version]
- Jeschke, G. The contribution of modern EPR to structural biology. Emerg. Top. Life Sci. 2018. [Google Scholar] [CrossRef]
- Jeschke, G. Mmm: A toolbox for integrative structure modeling. Protein Sci. 2018, 27, 76–85. [Google Scholar] [CrossRef] [PubMed]
- Doll, A.; Jeschke, G. Wideband frequency-swept excitation in pulsed EPR spectroscopy. J. Magn. Reson. 2017, 280, 46–62. [Google Scholar] [CrossRef] [PubMed]
- Jeschke, G. The making and breaking of a substrate trap. Biophys. J. 2017, 112, 1–2. [Google Scholar] [CrossRef] [PubMed]
- Jeschke, G. Dipolar spectroscopy—Double-resonance methods. eMagRes 2016, 5, 1459–1475. [Google Scholar]
- Duss, O.; Yulikov, M.; Allain, F.H.T.; Jeschke, G. Chapter ten—Combining NMR and EPR to determine structures of large rnas and protein–rna complexes in solution. In Methods in Enzymology; Woodson, S.A., Allain, F.H.T., Eds.; Academic Press: Cambridge, MA, USA, 2015; Volume 558, pp. 279–331. [Google Scholar]
- Soetbeer, J.; Hülsmann, M.; Godt, A.; Polyhach, Y.; Jeschke, G. Dynamical decoupling of nitroxides in o-terphenyl: A study of temperature, deuteration and concentration effects. Phys. Chem. Chem. Phys. 2018, 20, 1615–1628. [Google Scholar] [CrossRef] [PubMed]
- Vercellino, I.; Rezabkova, L.; Olieric, V.; Polyhach, Y.; Weinert, T.; Kammerer, R.A.; Jeschke, G.; Korkhov, V.M. Role of the nucleotidyl cyclase helical domain in catalytically active dimer formation. Proc. Natl. Acad. Sci. USA 2017, 114, E9821–E9828. [Google Scholar] [CrossRef] [PubMed]
- Pribitzer, S.; Sajid, M.; Hülsmann, M.; Godt, A.; Jeschke, G. Pulsed triple electron resonance (TRIER) for dipolar correlation spectroscopy. J. Magn. Reson. 2017, 282, 119–128. [Google Scholar] [CrossRef] [PubMed]
- Keller, K.; Mertens, V.; Qi, M.; Nalepa, A.I.; Godt, A.; Savitsky, A.; Jeschke, G.; Yulikov, M. Computing distance distributions from dipolar evolution data with overtones: Ridme spectroscopy with Gd(III)-based spin labels. Phys. Chem. Chem. Phys. 2017, 19, 17856–17876. [Google Scholar] [CrossRef] [PubMed]
- Kerzhner, M.; Matsuoka, H.; Wuebben, C.; Famulok, M.; Schiemann, O. High-yield spin labeling of long rnas for electron paramagnetic resonance spectroscopy. Biochemistry 2018, 57, 2923–2931. [Google Scholar] [CrossRef] [PubMed]
- Meyer, A.; Jassoy, J.J.; Spicher, S.; Berndhäuser, A.; Schiemann, O. Performance of PELDOR, RIDME, SIFTER, and DQC in measuring distances in trityl based bi- and triradicals: Exchange coupling, pseudosecular coupling and multi-spin effects. Phys. Chem. Chem. Phys. 2018, 20, 13858–13869. [Google Scholar] [CrossRef] [PubMed]
- Jassoy, J.; Meyer, A.; Spicher, S.; Wuebben, C.; Schiemann, O. Synthesis of nanometer sized bis- and tris-trityl model compounds with different extent of spin–spin coupling. Molecules 2018, 23, 682. [Google Scholar] [CrossRef] [PubMed]
- Jassoy, J.J.; Berndhäuser, A.; Duthie, F.; Kühn, S.P.; Hagelueken, G.; Schiemann, O. Versatile trityl spin labels for nanometer distance measurements on biomolecules in vitro and within cells. Angew. Chem. Int. Ed. 2017, 56, 177–181. [Google Scholar] [CrossRef] [PubMed]
- Kerzhner, M.; Abdullin, D.; Więcek, J.; Matsuoka, H.; Hagelueken, G.; Schiemann, O.; Famulok, M. Post-synthetic spin-labeling of rna through click chemistry for PELDOR measurements. Chem. Eur. J. 2016, 22, 12113–12121. [Google Scholar] [CrossRef] [PubMed]
- Gölz, J.P.; NejatyJahromy, Y.; Bauer, M.; Muhammad, A.; Schnakenburg, G.; Grimme, S.; Schiemann, O.; Menche, D. Design, synthesis, EPR-studies and conformational bias of novel spin-labeled DCC-analogues for the highly regioselective labeling of aliphatic and aromatic carboxylic acids. Chem. Eur. J. 2016, 22, 9591–9598. [Google Scholar] [CrossRef] [PubMed]
- Meyer, A.; Schiemann, O. PELDOR and RIDME measurements on a high-spin manganese(II) bisnitroxide model complex. J. Phys. Chem. A 2016, 120, 3463–3472. [Google Scholar] [CrossRef] [PubMed]
- Abdullin, D.; Hagelueken, G.; Schiemann, O. Determination of nitroxide spin label conformations via PELDOR and X-ray crystallography. Phys. Chem. Chem. Phys. 2016, 18, 10428–10437. [Google Scholar] [CrossRef] [PubMed]
- Meyer, A.; Abdullin, D.; Schnakenburg, G.; Schiemann, O. Single and double nitroxide labeled bis(terpyridine)-copper(II): Influence of orientation selectivity and multispin effects on PELDOR and RIDME. Phys. Chem. Chem. Phys. 2016, 18, 9262–9271. [Google Scholar] [CrossRef] [PubMed]
- Constantinescu-Aruxandei, D.; Petrovic-Stojanovska, B.; Schiemann, O.; Naismith, J.H.; White, M.F. Taking a molecular motor for a spin: Helicase mechanism studied by spin labeling and PELDOR. Nucl. Acids Res. 2016, 44, 954–968. [Google Scholar] [CrossRef] [PubMed]
- Matsuoka, H.; Schiemann, O. Molecular spins in biological systems. In Electron Spin Resonance (ESR) Based Quantum Computing; Takui, T., Berliner, L., Hanson, G., Eds.; Springer: New York, NY, USA, 2016; pp. 51–77. [Google Scholar]
- Hagelueken, G.; Abdullin, D.; Schiemann, O. Chapter twenty-two—Mtsslsuite: Probing biomolecular conformation by spin-labeling studies. In Methods in Enzymology; Qin, P.Z., Warncke, K., Eds.; Academic Press: Cambridge, MA, USA, 2015; Volume 563, pp. 595–622. [Google Scholar]
- Abdullin, D.; Duthie, F.; Meyer, A.; Müller, E.S.; Hagelueken, G.; Schiemann, O. Comparison of PELDOR and RIDME for distance measurements between nitroxides and low-spin Fe(III) ions. J. Phys. Chem. B 2015, 119, 13534–13542. [Google Scholar] [CrossRef] [PubMed]
- Hagelueken, G.; Duthie, F.G.; Florin, N.; Schubert, E.; Schiemann, O. Expression, purification and spin labelling of the ferrous iron transporter feob from Escherichia coli BL21 for EPR studies. Protein Expr. Purif. 2015, 114, 30–36. [Google Scholar] [CrossRef] [PubMed]
- Abdullin, D.; Hagelueken, G.; Hunter, R.I.; Smith, G.M.; Schiemann, O. Geometric model-based fitting algorithm for orientation-selective PELDOR data. Mol. Phys. 2015, 113, 544–560. [Google Scholar] [CrossRef]
- Timachi, M.H.; Hutter, C.A.J.; Hohl, M.; Assafa, T.; Böhm, S.; Mittal, A.; Seeger, M.A.; Bordignon, E. Exploring conformational equilibria of a heterodimeric abc transporter. eLife 2017, 6, e20236. [Google Scholar] [CrossRef] [PubMed]
- Celia, H.; Noinaj, N.; Zakharov, S.D.; Bordignon, E.; Botos, I.; Santamaria, M.; Barnard, T.J.; Cramer, W.A.; Lloubes, R.; Buchanan, S.K. Structural insight into the role of the ton complex in energy transduction. Nature 2016, 538, 60–65. [Google Scholar] [CrossRef] [PubMed]
- Bleicken, S.; Jeschke, G.; Stegmueller, C.; Salvador-Gallego, R.; García-Sáez, A.J.; Bordignon, E. Structural model of active bax at the membrane. Mol. Cell 2014, 56, 496–505. [Google Scholar] [CrossRef] [PubMed]
- Hohl, M.; Hürlimann, L.M.; Böhm, S.; Schöppe, J.; Grütter, M.G.; Bordignon, E.; Seeger, M.A. Structural basis for allosteric cross-talk between the asymmetric nucleotide binding sites of a heterodimeric ABC exporter. Proc. Natl. Acad. Sci. USA 2014, 111, 11025–11030. [Google Scholar] [CrossRef] [PubMed]
- Mao, Z.; Liou, S.-H.; Khadka, N.; Jenney, F.E.; Goodin, D.B.; Seefeldt, L.C.; Adams, M.W.W.; Cramer, S.P.; Larsen, D.S. Cluster-dependent charge-transfer dynamics in iron–sulfur proteins. Biochemistry 2018, 57, 978–990. [Google Scholar] [CrossRef] [PubMed]
- Liu, G.; Liou, S.-H.; Enkin, N.; Tkach, I.; Bennati, M. Photo-induced radical polarization and liquid-state dynamic nuclear polarization using fullerene nitroxide derivatives. Phys. Chem. Chem. Phys. 2017, 19, 31823–31829. [Google Scholar] [CrossRef] [PubMed] [Green Version]
- Liou, S.-H.; Myers, W.K.; Oswald, J.D.; Britt, R.D.; Goodin, D.B. Putidaredoxin binds to the same site on cytochrome P450cam in the open and closed conformation. Biochemistry 2017, 56, 4371–4378. [Google Scholar] [CrossRef] [PubMed]
- Liu, G.; Levien, M.; Karschin, N.; Parigi, G.; Luchinat, C.; Bennati, M. One-thousand-fold enhancement of high field liquid nuclear magnetic resonance signals at room temperature. Nat. Chem. 2017, 9, 676–680. [Google Scholar] [CrossRef] [PubMed] [Green Version]
- Rizzato, R.; Bennati, M. Cross-polarization electron-nuclear double resonance spectroscopy. ChemPhysChem 2015, 16, 3769–3773. [Google Scholar] [CrossRef] [PubMed]
- Kasanmascheff, M.; Lee, W.; Nick, T.U.; Stubbe, J.; Bennati, M. Radical transfer in E. coli ribonucleotide reductase: A NH2Y731/R411A-α mutant unmasks a new conformation of the pathway residue 731. Chem. Sci. 2016, 7, 2170–2178. [Google Scholar] [CrossRef] [PubMed]
- Bährle, C.; Nick, T.U.; Bennati, M.; Jeschke, G.; Vogel, F. High-field electron paramagnetic resonance and density functional theory study of stable organic radicals in lignin: Influence of the extraction process, botanical origin, and protonation reactions on the radical G tensor. J. Phys. Chem. A 2015, 119, 6475–6482. [Google Scholar] [CrossRef] [PubMed]
- Nick, T.U.; Lee, W.; Koßmann, S.; Neese, F.; Stubbe, J.; Bennati, M. Hydrogen bond network between amino acid radical intermediates on the proton-coupled electron transfer pathway of E. coli α2 ribonucleotide reductase. J. Am. Chem. Soc. 2015, 137, 289–298. [Google Scholar] [CrossRef] [PubMed]
- Schlee, S.; Klein, T.; Schumacher, M.; Nazet, J.; Merkl, R.; Steinhoff, H.-J.; Sterner, R. Relationship of catalysis and active site loop dynamics in the (βα)8-barrel enzyme indole-3-glycerol phosphate synthase. Biochemistry 2018, 57, 3265–3277. [Google Scholar] [CrossRef] [PubMed]
- Meiners, A.; Meyer-Ács, M.; Bondarenko, E.; Steinhoff, H.-J.; Mittmann, K. Conjugation of spin labeled proteins to fluorescent quantum dots∗. Mater. Today 2017, 4, S180–S187. [Google Scholar] [CrossRef]
- Kathiresan, M.; Steinhoff, H.-J.; Walder, L. Tempo-labeled viologen dendrimers: Synthesis, characterization, and preliminary distance measurements. Macromol. Chem. Phys. 2017, 218, 1700142. [Google Scholar] [CrossRef]
- Diskowski, M.; Mehdipour, A.R.; Wunnicke, D.; Mills, D.J.; Mikusevic, V.; Bärland, N.; Hoffmann, J.; Morgner, N.; Steinhoff, H.-J.; Hummer, G.; et al. Helical jackknives control the gates of the double-pore K(+) uptake system ktrab. eLife 2017, 6, e24303. [Google Scholar] [CrossRef] [PubMed]
- Orekhov, P.; Bothe, A.; Steinhoff, H.-J.; Shaitan, K.V.; Raunser, S.; Fotiadis, D.; Schlesinger, R.; Klare, J.P.; Engelhard, M. Sensory rhodopsin I and sensory rhodopsin ii form trimers of dimers in complex with their cognate transducers. Photochem. Photobiol. 2017, 93, 796–804. [Google Scholar] [CrossRef] [PubMed]
- Bagrov, D.V.; Voskoboynikova, N.; Armeev, G.A.; Mosslehy, W.; Gluhov, G.S.; Ismagulova, T.T.; Mulkidjanian, A.Y.; Kirpichnikov, M.P.; Steinhoff, H.-J.; Shaitan, K.V. Characterization of lipodisc nanoparticles containing sensory rhodopsin ii and its cognate transducer from natronomonas pharaonis. Biophysics 2016, 61, 942–949. [Google Scholar] [CrossRef]
- Gruian, C.M.; Rickert, C.; Nicklisch, S.C.T.; Vanea, E.; Steinhoff, H.-J.; Simon, S. Conformational changes and competitive adsorption between serum albumin and hemoglobin on bioceramic substrates. ChemPhysChem 2017, 18, 634–642. [Google Scholar] [CrossRef] [PubMed]
- Kucher, S.; Korneev, S.; Tyagi, S.; Apfelbaum, R.; Grohmann, D.; Lemke, E.A.; Klare, J.P.; Steinhoff, H.-J.; Klose, D. Orthogonal spin labeling using click chemistry for in vitro and in vivo applications. J. Magn. Reson. 2017, 275, 38–45. [Google Scholar] [CrossRef] [PubMed]
- Matthies, M.; Glinka, K.; Theiling, M.; Hideg, K.; Steinhoff, H.-J. Kinetics of rapid covalent bond formation of aniline with humic acid: Esr investigations with nitroxide spin labels. Appl. Magn. Reson. 2016, 47, 627–641. [Google Scholar] [CrossRef]
- Gölz, J.P.; Bockelmann, S.; Mayer, K.; Steinhoff, H.-J.; Wieczorek, H.; Huss, M.; Klare, J.P.; Menche, D. EPR studies of V-ATPase with spin-labeled inhibitors DCC and archazolid: Interaction dynamics with proton translocating subunit C. ChemMedChem 2016, 11, 420–428. [Google Scholar] [CrossRef] [PubMed]
- Wunnicke, D.; Ding, P.; Yang, H.; Seela, F.; Steinhoff, H.-J. DNA with parallel strand orientation: A nanometer distance study with spin labels in the watson–crick and the reverse watson–crick double helix. J. Phys. Chem. B 2015, 119, 13593–13599. [Google Scholar] [CrossRef] [PubMed]
- Ernst, F.G.M.; Rickert, C.; Bluschke, A.; Betat, H.; Steinhoff, H.-J.; Mörl, M. Domain movements during CCA-addition: A new function for motif C in the catalytic core of the human trna nucleotidyltransferases. RNA Biol. 2015, 12, 435–446. [Google Scholar] [CrossRef] [PubMed]
- Gast, P.; Mance, D.; Zurlo, E.; Ivanov, K.L.; Baldus, M.; Huber, M. A tailored multi-frequency EPR approach to accurately determine the magnetic resonance parameters of dynamic nuclear polarization agents: Application to amupol. Phys. Chem. Chem. Phys. 2017, 19, 3777–3781. [Google Scholar] [CrossRef] [PubMed]
- Gerolin, M.; Zerbetto, M.; Moretto, A.; Formaggio, F.; Toniolo, C.; van Son, M.; Shabestari, M.H.; Huber, M.; Calligari, P.; Polimeno, A. Integrated computational approach to the electron paramagnetic resonance characterization of rigid 310-helical peptides with toac nitroxide spin labels. J. Phys. Chem. B 2017, 121, 4379–4387. [Google Scholar] [CrossRef] [PubMed]
- Kumar, P.; Schilderink, N.; Subramaniam, V.; Huber, M. Membrane binding of parkinson’s protein α-synuclein: Effect of phosphorylation at positions 87 and 129 by the s to d mutation approach. Isr. J. Chem. 2017, 57, 762–770. [Google Scholar] [CrossRef] [PubMed]
- Zurlo, E.; Meeuwenoord, N.J.; Filippov, D.V.; Huber, M. Rigid spin labels for improved distance and dynamics in intrinsically disordered proteins and peptides. Biophys. J. 2017, 112, 316a. [Google Scholar] [CrossRef]
- Shabestari, M.H.; Meeuwenoord, N.J.; Filippov, D.V.; Huber, M. Interaction of the amyloid β peptide with sodium dodecyl sulfate as a membrane-mimicking detergent. J. Biol. Phys. 2016, 42, 299–315. [Google Scholar] [CrossRef] [PubMed] [Green Version]
- Schilder, J.; Liu, W.-M.; Kumar, P.; Overhand, M.; Huber, M.; Ubbink, M. Protein docking using an ensemble of spin labels optimized by intra-molecular paramagnetic relaxation enhancement. Phys. Chem. Chem. Phys. 2016, 18, 5729–5742. [Google Scholar] [CrossRef] [PubMed] [Green Version]
- Scarpelli, F.; Arrieta, A.L.; Gast, P.; Groenen, E.J.J.; Milikisyants, S.; Murphy, M.E.P.; Huber, M. A single-crystal EPR study at 95 GHz of the type-2 copper site of nitrite reductase from alcaligenes faecalis. Appl. Magn. Reson. 2015, 46, 411–420. [Google Scholar] [CrossRef]
- van Son, M.; Lindhoud, S.; van der Wild, M.; van Mierlo, C.P.M.; Huber, M. Double electron–electron spin resonance tracks flavodoxin folding. J. Phys. Chem. B 2015, 119, 13507–13514. [Google Scholar] [CrossRef] [PubMed]
- Kumar, P.; Segers-Nolten, I.M.J.; Schilderink, N.; Subramaniam, V.; Huber, M. Parkinson’s protein α-synuclein binds efficiently and with a novel conformation to two natural membrane mimics. PLoS ONE 2015, 10, e0142795. [Google Scholar] [CrossRef] [PubMed]
- The magnetic field dependence of cross-effect dynamic nuclear polarization under magic angle spinning. J. Chem. Phys. 2015, 142, 234201. [CrossRef] [PubMed]
- Hashemi Shabestari, M.; Kumar, P.; Segers-Nolten, I.M.J.; Claessens, M.M.A.E.; van Rooijen, B.D.; Subramaniam, V.; Huber, M. Three long-range distance constraints and an approach towards a model for the α-synuclein-fibril fold. Appl. Magn. Reson. 2015, 46, 369–388. [Google Scholar] [CrossRef]
- Milov, A.D.; Tsvetkov, Y.D.; Raap, J.; De Zotti, M.; Formaggio, F.; Toniolo, C. Review conformation, self-aggregation, and membrane interaction of peptaibols as studied by pulsed electron double resonance spectroscopy. Pept. Sci. 2015, 106, 6–24. [Google Scholar] [CrossRef] [PubMed]
- Syryamina, V.N.; Samoilova, R.I.; Tsvetkov, Y.D.; Ischenko, A.V.; De Zotti, M.; Gobbo, M.; Toniolo, C.; Formaggio, F.; Dzuba, S.A. Peptides on the surface: Spin-label EPR and PELDOR study of adsorption of the antimicrobial peptides trichogin GA IV and ampullosporin a on the silica nanoparticles. Appl. Magn. Reson. 2016, 47, 309–320. [Google Scholar] [CrossRef]
- Milov, A.D.; Samoilova, R.I.; Tsvetkov, Y.D.; Peggion, C.; Formaggio, F.; Toniolo, C. Peptides on the surface. PELDOR data for spin-labeled alamethicin F50/5 analogues on organic sorbent. J. Phys. Chem. B 2014, 118, 7085–7090. [Google Scholar] [CrossRef] [PubMed]
- Milov, A.D.; Tsvetkov, Y.D.; Bortolus, M.; Maniero, A.L.; Gobbo, M.; Toniolo, C.; Formaggio, F. Synthesis and conformational properties of a toac doubly spin-labeled analog of the medium-length, membrane active peptaibiotic ampullosporin a as revealed by cd, fluorescence, and EPR spectroscopies. Pept. Sci. 2014, 102, 40–48. [Google Scholar] [CrossRef] [PubMed]
- Lohan, S.B.; Saeidpour, S.; Solik, A.; Schanzer, S.; Richter, H.; Dong, P.; Darvin, M.E.; Bodmeier, R.; Patzelt, A.; Zoubari, G.; et al. Investigation of the cutaneous penetration behavior of dexamethasone loaded to nano-sized lipid particles by EPR spectroscopy, and confocal raman and laser scanning microscopy. Eur. J. Pharm. Biopharm. 2017, 116, 102–110. [Google Scholar] [CrossRef] [PubMed]
- Engelhard, C.; Diensthuber, R.P.; Möglich, A.; Bittl, R. Blue-light reception through quaternary transitions. Sci. Rep. 2017, 7, 1385. [Google Scholar] [CrossRef] [PubMed]
- Consentius, P.; Loll, B.; Gohlke, U.; Alings, C.; Müller, C.; Müller, R.; Teutloff, C.; Heinemann, U.; Kaupp, M.; Wahl, M.C.; et al. Internal dynamics of the 3-pyrroline-n-oxide ring in spin-labeled proteins. J. Phys. Chem. Lett. 2017, 8, 1113–1117. [Google Scholar] [CrossRef] [PubMed]
- Saeidpour, S.; Lohan, S.B.; Solik, A.; Paul, V.; Bodmeier, R.; Zoubari, G.; Unbehauen, M.; Haag, R.; Bittl, R.; Meinke, M.C.; et al. Drug distribution in nanostructured lipid particles. Eur. J. Pharm. Biopharm. 2017, 110, 19–23. [Google Scholar] [CrossRef] [PubMed]
- Yee, E.F.; Diensthuber, R.P.; Vaidya, A.T.; Borbat, P.P.; Engelhard, C.; Freed, J.H.; Bittl, R.; Möglich, A.; Crane, B.R. Signal transduction in light–oxygen–voltage receptors lacking the adduct-forming cysteine residue. Nat. Commun. 2015, 6, 10079. [Google Scholar] [CrossRef] [PubMed] [Green Version]
- Hahn, A.; Engelhard, C.; Reschke, S.; Teutloff, C.; Bittl, R.; Leimkühler, S.; Risse, T. Structural insights into the incorporation of the mo cofactor into sulfite oxidase from site-directed spin labeling. Angew. Chem. Int. Ed. 2015, 54, 11865–11869. [Google Scholar] [CrossRef] [PubMed]
- Freed, J.H. New technologies in electron spin resonance. Annu. Rev. Phys. Chem. 2000, 51, 655–689. [Google Scholar] [CrossRef] [PubMed]
- Polnaszek, C.F.; Freed, J.H. Electron-spin resonance studies of anisotropic ordering, spin relaxation, and slow tumbling in liquid-crystalline solvents. J. Phys. Chem. 1975, 79, 2283–2306. [Google Scholar] [CrossRef]
- Freed, J.H. Stochastic-molecular theory of spin-relaxation for liquid-crystals. J. Chem. Phys. 1977, 66, 4183–4199. [Google Scholar] [CrossRef]
- Polimeno, A.; Freed, J.H. Slow motional ESR in complex fluids—The slowly relaxing local-structure model of solvent cage effects. J. Phys. Chem. 1995, 99, 10995–11006. [Google Scholar] [CrossRef]
- Liang, Z.C.; Freed, J.H. An assessment of the applicability of multifrequency ESR to study the complex dynamics of biomolecules. J. Phys. Chem. B 1999, 103, 6384–6396. [Google Scholar] [CrossRef]
- Tugarinov, V.; Liang, Z.C.; Shapiro, Y.E.; Freed, J.H.; Meirovitch, E. A structural mode-coupling approach to n-15 NMR relaxation in proteins. J. Am. Chem. Soc. 2001, 123, 3055–3063. [Google Scholar] [CrossRef] [PubMed]
- Meirovitch, E.; Shapiro, Y.E.; Polimeno, A.; Freed, J.H. Protein dynamics from NMR: The slowly relaxing local structure analysis compared with model-free analysis. J. Phys. Chem. A 2006, 110, 8366–8396. [Google Scholar] [CrossRef] [PubMed]
- Misra, S.K.; Freed, J.H. Molecular motions. In Multifrequency Electron Paramagnetic Resonance; Misra, S.K., Ed.; Wiley-VCH: Berlin, Germany, 2011; pp. 497–544. [Google Scholar]
- Polimeno, A.; Freed, J.H. A many-body stochastic approach to rotational motions in liquids. In Advances in Chemical Physics; John Wiley & Sons, Inc.: Hoboken, NJ, USA, 2007; pp. 89–206. [Google Scholar]
- Sezer, D.; Freed, J.H.; Roux, B. Multifrequency electron spin resonance spectra of a spin-labeled protein calculated from molecular dynamics simulations. J. Am. Chem. Soc. 2009, 131, 2597–2605. [Google Scholar] [CrossRef] [PubMed]
- Liang, Z.C.; Freed, J.H.; Keyes, R.S.; Bobst, A.M. An electron spin resonance study of DNA dynamics using the slowly relaxing local structure model. J. Phys. Chem. B 2000, 104, 5372–5381. [Google Scholar] [CrossRef]
- Liang, Z.C.; Lou, Y.; Freed, J.H.; Columbus, L.; Hubbell, W.L. A multifrequency electron spin resonance study of t4 lysozyme dynamics using the slowly relaxing local structure model. J. Phys. Chem. B 2004, 108, 17649–17659. [Google Scholar] [CrossRef]
- Cornish, V.W.; Benson, D.R.; Altenbach, C.A.; Hideg, K.; Hubbell, W.L.; Schultz, P.G. Site-specific incorporation of biophysical probes into proteins. Proc. Natl. Acad. Sci. USA 1994, 91, 2910–2914. [Google Scholar] [CrossRef] [PubMed]
- Shafer, A.M.; Kalai, T.; Liu, S.Q.B.; Hideg, K.; Voss, J.C. Site-specific insertion of spin-labeled l-amino acids in xenopus oocytes. Biochemistry 2004, 43, 8470–8482. [Google Scholar] [CrossRef] [PubMed]
- Steinhoff, H.J. Methods for study of protein dynamics and protein-protein interaction in protein-ubiquitination by electron paramagnetic resonance spectroscopy. Front. Biosci. 2002, 7, C97–C110. [Google Scholar] [CrossRef] [PubMed]
- Hubbell, W.L.; Cafiso, D.S.; Altenbach, C. Identifying conformational changes with site-directed spin labeling. Nat. Struct. Mol. Biol. 2000, 7, 735–739. [Google Scholar] [CrossRef] [PubMed]
- Hubbell, W.L.; Gross, A.; Langen, R.; Lietzow, M.A. Recent advances in site-directed spin labeling of proteins. Curr. Opin. Struct. Biol. 1998, 8, 649–656. [Google Scholar] [CrossRef]
- Hubbell, W.L.; McHaourab, H.S.; Altenbach, C.; Lietzow, M.A. Watching proteins move using site-directed spin labeling. Structure 1996, 4, 779–783. [Google Scholar] [CrossRef] [Green Version]
- Möbius, K.; Savitsky, A.; Wegener, C.; Plato, M.; Fuchs, M.; Schnegg, A.; Dubinskii, A.A.; Grishin, Y.A.; Grigor’ev, I.A.; Kuhn, M.; et al. Combining high-field EPR with site-directed spin labeling reveals unique information on proteins in action. Magn. Reson. Chem. 2005, 43, S4–S19. [Google Scholar] [CrossRef] [PubMed]
- Steinhoff, H.-J.; Savitsky, A.; Wegener, C.; Pfeiffer, M.; Plato, M.; Möbius, K. High-field EPR studies of the structure and conformational changes of site directed spin labeled bacteriorhodopsin. Biochim. Biophys. Acta 2000, 1457, 253–262. [Google Scholar] [CrossRef]
- Wegener, C.; Savitsky, A.; Pfeiffer, M.; Möbius, K.; Steinhoff, H.-J. High-field EPR-detected shifts of magnetic tensor components of spin label side chains reveal protein conformational changes: The proton entrance channel of bacteriorhodopsin. Appl. Magn. Reson. 2001, 21, 441–450. [Google Scholar] [CrossRef]
- Plato, M.; Steinhoff, H.-J.; Wegener, C.; Törring, J.T.; Savitsky, A.; Möbius, K. Molecular orbital study of polarity and hydrogen bonding effects on the g and hyperfine tensors of site directed no spin labeled bacteriorhodopsin. Mol. Phys. 2002, 100, 3711–3721. [Google Scholar] [CrossRef]
- Earle, K.A.; Smirnov, A.I. High field ESR: Applications to protein structure and dynamics, biological magnetic resonance. In Very High Frequency (VHF) ESR/EPR; Grinberg, O., Berliner, L.J., Eds.; Kluwer/Plenum Publishers: New York, NY, USA, 2004; Volume 22, pp. 96–144. [Google Scholar]
- Livshits, V.A.; Marsh, D. Hf-EPR spectra of spin labels in membranes, biological magnetic resonance. In Very High Frequency (VHF) ESR/EPR; Grinberg, O., Berliner, L.J., Eds.; Kluwer/Plenum Publishers: New York, NY, USA, 2004; Volume 22, pp. 431–465. [Google Scholar]
- Barnes, J.P.; Liang, Z.C.; McHaourab, H.S.; Freed, J.H.; Hubbell, W.L. A multifrequency electron spin resonance study of t4 lysozyme dynamics. Biophys. J. 1999, 76, 3298–3306. [Google Scholar] [CrossRef]
- Banham, J.E.; Timmel, C.R.; Abbott, R.J.M.; Lea, S.M.; Jeschke, G. The characterization of weak protein-protein interactions: Evidence from deer for the trimerization of a von willebrand factor a domain in solution. Angew. Chem. Int. Ed. 2006, 45, 1058–1061. [Google Scholar] [CrossRef] [PubMed]
- Chiang, Y.W.; Borbat, P.P.; Freed, J.H. Maximum entropy: A complement to tikhonov regularization for determination of pair distance distributions by pulsed ESR. J. Magn. Reson. 2005, 177, 184–196. [Google Scholar] [CrossRef] [PubMed]
- Bennati, M.; Robblee, J.H.; Mugnaini, V.; Stubbe, J.; Freed, J.H.; Borbat, P. EPR distance measurements support a model for long-range radical initiation in e.Coli ribonucleotide reductase. J. Am. Chem. Soc. 2005, 127, 15014–15015. [Google Scholar] [CrossRef] [PubMed]
- Park, S.Y.; Borbat, P.P.; Gonzalez-Bonet, G.; Bhatnagar, J.; Pollard, A.M.; Freed, J.H.; Bilwes, A.M.; Crane, B.R. Reconstruction of the chemotaxis receptor-kinase assembly. Nat. Struct. Mol. Biol. 2006, 13, 400–407. [Google Scholar] [CrossRef] [PubMed]
- Daldrop, J.O.; Saita, M.; Heyden, M.; Lorenz-Fonfria, V.A.; Heberle, J.; Netz, R.R. Orientation of non-spherical protonated water clusters revealed by infrared absorption dichroism. Nat. Commun. 2018, 9, 311. [Google Scholar] [CrossRef] [PubMed] [Green Version]
- Luecke, H.; Schobert, B.; Richter, H.-T.; Cartailler, J.-P.; Lanyi, J.K. Structure of bacteriorhodopsin at 1.55 resolution. J. Mol. Biol. 1999, 291, 899–911. [Google Scholar] [CrossRef] [PubMed]
- Váró, G.; Lanyi, J.K. Kinetic and spectroscopic evidence for an irreversible step between dEPRotonation and rEPRotonation of the schiff base in the bacteriorhodopsin photocycle. Biochemistry 1991, 30, 5008–5015. [Google Scholar] [CrossRef] [PubMed]
- Druckmann, S.; Friedmann, N.; Lanyi, J.K.; Needleman, R.; Ottolenghi, M.; Shewes, M. The back photoreaction of the m intermediate in the photocycle of bacteriorhodopsin: Mechanism and evidence for two m species. Photochem. Photobiol. 1992, 56, 1041–1047. [Google Scholar] [CrossRef] [PubMed]
- Hessling, B.; Herbst, J.; Rammelsberg, R.; Gerwert, K. Fourier transform infrared double-flash experiments resolve bacteriorhodopsin’s M1 to M2 transition. Biophys. J. 1997, 73, 2071–2080. [Google Scholar] [CrossRef]
- Haupts, U.; Tittor, J.; Oesterhelt, D. Closing in on bacteriorhodopsin: Progress in understanding the molecule. Annu. Rev. Biophys. Biomol. Struct. 1999, 28, 367–399. [Google Scholar] [CrossRef] [PubMed]
- Subramaniam, S.; Henderson, R. Molecular mechanism of vectorial proton translocation by bacteriorhodopsin. Nature 2000, 406, 653–657. [Google Scholar] [CrossRef] [PubMed]
- Pfeiffer, M.; Rink, T.; Gerwert, K.; Oesterhelt, D.; Steinhoff, H.-J. Site-directed spin labeling reveals the orientation of the amino acid side chains in the e-f loop of bacteriorhodopsin. J. Mol. Biol. 1999, 287, 163–172. [Google Scholar] [CrossRef] [PubMed]
- Radzwill, N.; Gerwert, K.; Steinhoff, H.-J. Time-resolved detection of transient movement of helices f and g in doubly spin-labeled bacteriorhodopsin. Biophys. J. 2001, 80, 2856–2866. [Google Scholar] [CrossRef]
- Stoll, S. High-field EPR of bioorganic radicals. In Electron Paramagnetic Resonance; The Royal Society of Chemistry: London, UK, 2011; Volume 22, pp. 107–154. [Google Scholar]
- Möbius, K. Primary processes in photosynthesis: What do we learn from high-field EPR spectroscopy? Chem. Soc. Rev. 2000, 29, 129–139. [Google Scholar] [CrossRef]
- Riedi, P.C.; Smith, G.M. Progress in high-field EPR. In Electron Paramagnetic Resonance; Gilbert, B.C., Davies, M.J., Murphy, D.M., Eds.; Royal Society of Chemistry: Cambridge, UK, 2002; Volume 18, pp. 254–303. [Google Scholar]
- Smirnov, A.I. Spin-labeling in high-field EPR. In Electron Paramagnetic Resonance; Gilbert, B.C., Davies, M.J., Murphy, D.M., Eds.; Royal Society of Chemistry: Cambridge, UK, 2002; Volume 18, pp. 109–136. [Google Scholar]
- Smith, G.M.; Riedi, P.C. Progress in high-field EPR. In Electron Paramagnetic Resonance; Gilbert, B.C., Davies, M.J., McLauchlan, K.A., Eds.; Royal Society of Chemistry: Cambridge, UK, 2000; Volume 17, pp. 164–204. [Google Scholar]
- Freed, J.H. The development of high-field/high-frequency ESR, biological magnetic resonance. In Very High Frequency (VHF) ESR/EPR; Grinberg, O., Berliner, L.J., Eds.; Kluwer/Plenum Publishers: New York, NY, USA, 2004; Volume 22, pp. 19–43. [Google Scholar]
- Gulla, A.F.; Budil, D.E. Engineering and design concepts for quasioptical high-field electron paramagnetic resonance. Concept. Magn. Reson. B 2004, 22B, 15–36. [Google Scholar] [CrossRef]
- Marsh, D.; Kurad, D.; Livshits, V.A. High-field electron spin resonance of spin labels in membranes. Chem. Phys. Lipids 2002, 116, 93–114. [Google Scholar] [CrossRef]
- Möbius, K.; Savitsky, A.; Schnegg, A.; Plato, M.; Fuchs, M. High-field EPR spectroscopy applied to biological systems: Characterization of molecular switches for electron and ion transfer. Phys. Chem. Chem. Phys. 2005, 7, 19–42. [Google Scholar] [CrossRef] [PubMed]
- Prisner, T. Pulsed high-frequency EPR. In Very High Frequency (VHF) ESR/EPR, Biological Magnetic Resonance; Grinberg, O., Berliner, L.J., Eds.; Kluwer/Plenum Publishers: New York, NY, USA, 2004; Volume 22, pp. 45–93. [Google Scholar]
- Chapman, H.N.; Caleman, C.; Timneanu, N. Diffraction before destruction. Philos. Trans. R. Soc. Lond. B Biol. Sci. 2014, 369. [Google Scholar] [CrossRef] [PubMed]
- Nogly, P.; Weinert, T.; James, D.; Carbajo, S.; Ozerov, D.; Furrer, A.; Gashi, D.; Borin, V.; Skopintsev, P.; Jaeger, K.; et al. Retinal isomerization in bacteriorhodopsin captured by a femtosecond X-ray laser. Science 2018, 361, eaat0094. [Google Scholar] [CrossRef] [PubMed]
- Johansson, L.C.; Arnlund, D.; Katona, G.; White, T.A.; Barty, A.; DePonte, D.P.; Shoeman, R.L.; Wickstrand, C.; Sharma, A.; Williams, G.J.; et al. Structure of a photosynthetic reaction centre determined by serial femtosecond crystallography. Nat. Commun. 2013, 4, 2911. [Google Scholar] [CrossRef] [PubMed] [Green Version]
- Kern, J.; Alonso-Mori, R.; Hellmich, J.; Tran, R.; Hattne, J.; Laksmono, H.; Glöckner, C.; Echols, N.; Sierra, R.G.; Sellberg, J.; et al. Room temperature femtosecond X-ray diffraction of photosystem II microcrystals. Proc. Natl. Acad. Sci. USA 2012, 109, 9721–9726. [Google Scholar] [CrossRef] [PubMed] [Green Version]
- Kern, J.; Alonso-Mori, R.; Tran, R.; Hattne, J.; Gildea, R.J.; Echols, N.; Glöckner, C.; Hellmich, J.; Laksmono, H.; Sierra, R.G.; et al. Simultaneous femtosecond X-ray spectroscopy and diffraction of photosystem II at room temperature. Science 2013, 340, 491–495. [Google Scholar] [CrossRef] [PubMed]
- Kern, J.; Tran, R.; Alonso-Mori, R.; Koroidov, S.; Echols, N.; Hattne, J.; Ibrahim, M.; Gul, S.; Laksmono, H.; Sierra, R.G.; et al. Taking snapshots of photosynthetic water oxidation using femtosecond X-ray diffraction and spectroscopy. Nat. Commun. 2014, 5, 4371. [Google Scholar] [CrossRef] [PubMed]
- Fuller, F.D.; Gul, S.; Chatterjee, R.; Burgie, E.S.; Young, I.D.; Lebrette, H.; Srinivas, V.; Brewster, A.S.; Michels-Clark, T.; Clinger, J.A.; et al. Drop-on-demand sample delivery for studying biocatalysts in action at X-ray free-electron lasers. Nat. Methods 2017, 14, 443–449. [Google Scholar] [CrossRef] [PubMed] [Green Version]
- Kupitz, C.; Basu, S.; Grotjohann, I.; Fromme, R.; Zatsepin, N.A.; Rendek, K.N.; Hunter, M.S.; Shoeman, R.L.; White, T.A.; Wang, D.; et al. Serial time-resolved crystallography of photosystem II using a femtosecond X-ray laser. Nature 2014, 513, 261–265. [Google Scholar] [CrossRef] [PubMed] [Green Version]
- Suga, M.; Akita, F.; Hirata, K.; Ueno, G.; Murakami, H.; Nakajima, Y.; Shimizu, T.; Yamashita, K.; Yamamoto, M.; Ago, H.; et al. Native structure of photosystem II at 1.95 Å resolution viewed by femtosecond X-ray pulses. Nature 2014, 517, 99–103. [Google Scholar] [CrossRef] [PubMed] [Green Version]
- Suga, M.; Akita, F.; Sugahara, M.; Kubo, M.; Nakajima, Y.; Nakane, T.; Yamashita, K.; Umena, Y.; Nakabayashi, M.; Yamane, T.; et al. Light-induced structural changes and the site of O=O bond formation in PSII caught by XFEL. Nature 2017, 543, 131–135. [Google Scholar] [CrossRef] [PubMed] [Green Version]
- Edwards, D.T.; Ma, Z.D.; Meade, T.J.; Goldfarb, D.; Han, S.G.; Sherwin, M.S. Extending the distance range accessed with continuous wave EPR with gd3+ spin probes at high magnetic fields. Phys. Chem. Chem. Phys. 2013, 15, 11313–11326. [Google Scholar] [CrossRef] [PubMed]
- Dalaloyan, A.; Qi, M.; Ruthstein, S.; Vega, S.; Godt, A.; Feintuch, A.; Goldfarb, D. Gd(III)-Gd(III) EPR distance measurements—The range of accessible distances and the impact of zero field splitting (vol. 17, pg 18464, 2015). Phys. Chem. Chem. Phys. 2016, 18, 18614. [Google Scholar] [CrossRef] [PubMed]
- Sharma, A.; Gaidamakova, E.K.; Grichenko, O.; Matrosova, V.Y.; Hoeke, V.; Klimenkova, P.; Conze, I.H.; Volpe, R.P.; Tkavc, R.; Gostincar, C.; et al. Across the tree of life, radiation resistance is governed by antioxidant Mn2+, gauged by paramagnetic resonance. Proc. Natl. Acad. Sci. USA 2017, 114, E9253–E9260. [Google Scholar] [CrossRef] [PubMed]
- Carpenter, J.F.; Crowe, L.M.; Crowe, J.H. Stabilization of phosphofructokinase with sugars during freeze-drying—Characterization of enhanced protection in the presence of divalent-cations. Biochim. Biophys. Acta 1987, 923, 109–115. [Google Scholar] [CrossRef]
- Lopez-Diez, E.C.; Bone, S. The interaction of trypsin with trehalose: An investigation of protein preservation mechanisms. Biochim. Biophys. Acta 2004, 1673, 139–148. [Google Scholar] [CrossRef] [PubMed]
- Jain, N.K.; Roy, I. Effect of trehalose on protein structure. Prot. Sci. 2009, 18, 24–36. [Google Scholar] [CrossRef] [PubMed]
- Ohtake, S.; Wang, Y.J. Trehalose: Current use and future applications. J. Pharm. Sci. 2011, 100, 2020–2053. [Google Scholar] [CrossRef] [PubMed]
- Crowe, J.H.; Carpenter, J.F.; Crowe, L.M. The role of vitrification in anhydrobiosis. Ann. Rev. Physiol. 1998, 60, 73–103. [Google Scholar] [CrossRef] [PubMed]
- Crowe, L.M. Lessons from nature: The role of sugars in anhydrobiosis. Comp. Biochem. Physiol. 2002, 131, 505–513. [Google Scholar] [CrossRef]
- Simperler, A.; Kornherr, A.; Chopra, R.; Bonnet, P.A.; Jones, W.; Motherwell, W.D.S.; Zifferer, G. Glass transition temperature of glucose, sucrose, and trehalose: An experimental and in silico study. J. Phys. Chem. B 2006, 110, 19678–19684. [Google Scholar] [CrossRef] [PubMed]
- Singh, S.; Ambastha, V.; Levine, A.; Sopory, S.K.; Yadava, P.K.; Tripathy, B.C.; Tiwari, B.S. Anhydrobiosis and programmed cell death in plants: Commonalities and differences. Curr. Plant Biol. 2015, 2, 12–20. [Google Scholar] [CrossRef]
- Fahad, S.; Bajwa, A.A.; Nazir, U.; Anjum, S.A.; Farooq, A.; Zohaib, A.; Sadia, S.; Nasim, W.; Adkins, S.; Saud, S.; et al. Crop production under drought and heat stress: Plant responses and management options. Front. Plant Sci. 2017, 8, 114. [Google Scholar] [CrossRef] [PubMed]
- Zafar, S.A.; Hameed, A.; Nawaz, M.A.; Wei, M.A.; Noor, M.A.; Hussain, M.; Mehboob ur, R. Mechanisms and molecular approaches for heat tolerance in rice (Oryza sativa L.) under climate change scenario. J. Integr. Agric. 2018, 17, 726–738. [Google Scholar] [CrossRef]
- Nalepa, A.; Malferrari, M.; Lubitz, W.; Venturoli, G.; Möbius, K.; Savitsky, A. Local water sensing: Water exchange in bacterial photosynthetic reaction centers embedded in a trehalose glass studied using multiresonance EPR. Phys. Chem. Chem. Phys. 2017, 19, 28388–28400. [Google Scholar] [CrossRef] [PubMed]
- Shelaev, I.; Gorka, M.; Savitsky, A.; Kurashov, V.; Mamedov, M.; Gostev, F.; Möbius, K.; Nadtochenko, V.; Golbeck, J.; Semenov, A. Effect of dehydrated trehalose matrix on the kinetics of forward electron transfer reactions in photosystem I. Z. Phys. Chem. 2017, 231, 325–345. [Google Scholar] [CrossRef]
- Malferrari, M.; Savitsky, A.; Mamedov, M.D.; Milanovsky, G.E.; Lubitz, W.; Möbius, K.; Semenov, A.Y.; Venturoli, G. Trehalose matrix effects on charge-recombination kinetics in photosystem I of oxygenic photosynthesis at different dehydration levels. Biochim. Biophys. Acta 2016, 1857, 1440–1454. [Google Scholar] [CrossRef] [PubMed]
- Amesz, J.; Hoff, A.J. Biophysical Techniques in Photosynthesis; Springer: Dordrecht, The Netherlands, 1996. [Google Scholar]
- Wydrzynski, T.J.; Satoh, K. Photosystem II, the light-driven water: Plastoquinone oxidoreductase. In Advances in Photosynthesis and Respiration; Wydrzynski, T.J., Satoh, K., Eds.; Springer: Dordrecht, The Netherlands, 2005. [Google Scholar]
- Ort, D.; Yocum, C.; Heichel, I. Oxygenic Photosynthesis: The Light Reactions; Kluwer: Dordrecht, The Netherlands, 2004; Volume 4, pp. 1–9. [Google Scholar]
- Lubitz, W.; Reijerse, E.J.; Messinger, J. Solar water-splitting into h2 and o2: Design principles of photosystem ii and hydrogenases. Energy Environ. Sci. 2008, 1, 15–31. [Google Scholar] [CrossRef]
- Lewis, N.S.; Nocera, D.G. Powering the planet: Chemical challenges in solar energy utilization. Proc. Natl. Acad. Sci. USA 2006, 103, 15729–15735. [Google Scholar] [CrossRef] [PubMed] [Green Version]
- Thapper, A.; Styring, S.; Saraccao, G.; Rutherford, A.W.; Robert, B.; Magnuson, A.; Lubitz, W.; Llobet, A.; Kurz, P.; Holzwarth, A.R.; et al. Artificial photosynthesis for solar fuels—An evolving research field within ampea, a joint programme of the european energy research alliance. Green 2013, 3, 43–57. [Google Scholar] [CrossRef]
- Schlögl, R. Chemical Energy Storage; De Gruyter: Berlin, Germany, 2013; p. 479. [Google Scholar]
- Cox, N.; Pantazis, D.A.; Neese, F.; Lubitz, W. Artificial photosynthesis: Understanding water splitting in nature. Interface Focus 2015, 5, 20150009. [Google Scholar] [CrossRef] [PubMed]
- Barber, J. Photosynthetic water splitting provides a blueprint for artificial leaf technology. Joule 2017, 1, 5–9. [Google Scholar] [CrossRef]
- Florent, M.; Kaminker, I.; Nagarajan, V.; Goldfarb, D. Determination of the 14N quadrupole coupling constant of nitroxide spin probes by W-band eldor-detected NMR. J. Magn. Reson. 2011, 210, 192–199. [Google Scholar] [CrossRef] [PubMed]
- Nalepa, A.; Möbius, K.; Lubitz, W.; Savitsky, A. High-field eldor-detected NMR study of a nitroxide radical in disordered solids: Towards characterization of heterogeneity of microenvironments in spin-labeled systems. J. Magn. Reson. 2014, 242, 203–213. [Google Scholar] [CrossRef] [PubMed]
- Nalepa, A.; Möbius, K.; Plato, M.; Lubitz, W.; Savitsky, A. Nitroxide spin-labels—Magnetic parameters and hydrogen bond formation. A high-field EPR and EDNMR study. Appl. Magn. Reson. 2018, in press. [Google Scholar] [CrossRef]
- Kaminker, I.; Wilson, T.D.; Savelieff, M.G.; Hovav, Y.; Zimmermann, H.; Lu, Y.; Goldfarb, D. Correlating nuclear frequencies by two-dimensional eldor-detected NMR spectroscopy. J. Am. Chem. Soc. 2014, 240, 77–89. [Google Scholar] [CrossRef] [PubMed]
- Van Landeghem, M.; Maes, W.; Goovaerts, E.; Van Doorslaer, S. Disentangling overlapping high-field EPR spectra of organic radicals: Identification of light-induced polarons in the record fullerene-free solar cell blend pbdb-t:Itic. J. Magn. Reson. 2018, 288, 1–10. [Google Scholar] [CrossRef] [PubMed]
- Gast, P.; Herbonnet, R.T.L.; Klare, J.; Nalepa, A.; Rickert, C.; Stellinga, D.; Urban, L.; Möbius, K.; Savitsky, A.; Steinhoff, H.J.; et al. Hydrogen bonding of nitroxide spin labels in membrane proteins. Phys. Chem. Chem. Phys. 2014, 16, 15910–15916. [Google Scholar] [CrossRef] [PubMed] [Green Version]
- Bordignon, E.; Nalepa, A.I.; Savitsky, A.; Braun, L.; Jeschke, G. Changes in the microenvironment of nitroxide radicals around the glass transition temperature. J. Phys. Chem. B 2015, 119, 13797–13806. [Google Scholar] [CrossRef] [PubMed]
- Cox, N.; Nalepa, A.; Lubitz, W.; Savitsky, A. Eldor-detected NMR: A general and robust method for electron-nuclear hyperfine spectroscopy? J. Magn. Reson. 2017, 280, 63–78. [Google Scholar] [CrossRef] [PubMed]
- Potapov, A.; Lancaster, K.M.; Richards, J.H.; Gray, H.B.; Goldfarb, D. Spin delocalization over type zero copper. Inorg. Chem. 2012, 51, 4066–4075. [Google Scholar] [CrossRef] [PubMed]
- Nagy, N.V.; Doorslaer, S.V.; Szabó-Plánka, T.; Rompaey, S.V.; Hamza, A.; Fülöp, F.; Tóth, G.K.; Rockenbauer, A. Copper(II)-binding ability of stereoisomeric cis- and trans-2-aminocyclohexanecarboxylic acid–l-phenylalanine dipeptides. A combined cw/pulsed EPR and DFT study. Inorg. Chem. 2012, 51, 1386–1399. [Google Scholar] [CrossRef] [PubMed]
- Bruch, E.M.; Warner, M.T.; Thomine, S.; Tabares, L.C.; Un, S. Pulse electron double resonance detected multinuclear NMR spectra of distant and low sensitivity nuclei and its application to the structure of Mn(II) centers in organisms. J. Phys. Chem. B 2015, 119, 13515–13523. [Google Scholar] [CrossRef] [PubMed]
- Bruch, E.M.; Thomine, S.; Tabares, L.C.; Un, S. Variations in Mn(II) speciation among organisms: What makes d. Radiodurans different. Metallomics 2015, 7, 136–144. [Google Scholar] [CrossRef] [PubMed]
- Fittipaldi, M.; García-Rubio, I.; Trandafir, F.; Gromov, I.; Schweiger, A.; Bouwen, A.; Van Doorslaer, S. A multi-frequency pulse EPR and ENDOR approach to study strongly coupled nuclei in frozen solutions of high-spin ferric heme proteins. J. Phys. Chem. B 2008, 112, 3859–3870. [Google Scholar] [CrossRef] [PubMed]
- Kaminker, I.; Goldberg, H.; Neumann, R.; Goldfarb, D. High-field pulsed EPR spectroscopy for the speciation of the reduced [PV2MO10O40]6− polyoxometalate catalyst used in electron-transfer oxidations. Chem. Eur. J. 2010, 16, 10014–10020. [Google Scholar] [CrossRef] [PubMed]
- Klein, E.L.; Raitsimring, A.M.; Astashkin, A.V.; Rajapakshe, A.; Johnson-Winters, K.; Arnold, A.R.; Potapov, A.; Goldfarb, D.; Enemark, J.H. Identity of the exchangeable sulfur-containing ligand at the Mo(V) center of R160Q human sulfite oxidase. Inorg. Chem. 2012, 51, 1408–1418. [Google Scholar] [CrossRef] [PubMed]
- Cox, N.; Lubitz, W.; Savitsky, A. W-band eldor-detected NMR (EDNMR) spectroscopy as a versatile technique for the characterization of transition metal-ligand interactions. Mol. Phys. 2013, 111, 2788–2808. [Google Scholar] [CrossRef]
- Zamani, S.; Meynen, V.; Hanu, A.-M.; Mertens, M.; Popovici, E.; Van Doorslaer, S.; Cool, P. Direct spectroscopic detection of framework-incorporated vanadium in mesoporous silica materials. Phys. Chem. Chem. Phys. 2009, 11, 5823–5832. [Google Scholar] [CrossRef] [PubMed]
- Mino, H.; Ono, T. Applications of pulsed eldor-detected NMR measurements to studies of photosystem II: Magnetic characterization of YD tyrosine radical and Mn2+ bound to the high-affinity site. Appl. Magn. Reson. 2003, 23, 571. [Google Scholar] [CrossRef]
- Litvinov, A.; Feintuch, A.; Un, S.; Goldfarb, D. Triple resonance EPR spectroscopy determines the mn2+ coordination to ATP. J. Magn. Reson. 2018, 294, 143–152. [Google Scholar] [CrossRef] [PubMed]
- Marchiori, D.A.; Oyala, P.H.; Debus, R.J.; Stich, T.A.; Britt, R.D. Structural effects of ammonia binding to the Mn4CaO5 cluster of photosystem II. J. Phys. Chem. B 2018, 122, 1588–1599. [Google Scholar] [CrossRef] [PubMed]
- Barwinska-Sendra, A.; Basle, A.; Waldron, K.J.; Un, S. A charge polarization model for the metal-specific activity of superoxide dismutases. Phys. Chem. Chem. Phys. 2018, 20, 2363–2372. [Google Scholar] [CrossRef] [PubMed] [Green Version]
- Cohen, M.R.; Mendelman, N.; Radoul, M.; Wilson, T.D.; Savelieff, M.G.; Zimmermann, H.; Kaminker, I.; Feintuch, A.; Lu, Y.; Goldfarb, D. Thiolate spin population of type I copper in azurin derived from S-33 hyperfine coupling. Inorg. Chem. 2017, 56, 6163–6174. [Google Scholar] [CrossRef] [PubMed]
- Yang, Y.; Gong, Y.J.; Litvinov, A.; Liu, H.K.; Yang, F.; Su, X.C.; Goldfarb, D. Generic tags for Mn(II) and Gd(III) spin labels for distance measurements in proteins. Phys. Chem. Chem. Phys. 2017, 19, 26944–26956. [Google Scholar] [CrossRef] [PubMed]
- Nguyen, A.I.; Suess, D.L.M.; Darago, L.E.; Oyala, P.H.; Levine, D.S.; Ziegler, M.S.; Britt, R.D.; Tilley, T.D. Manganese-cobalt oxido cubanes relevant to manganese-doped water oxidation catalysts. J. Am. Chem. Soc. 2017, 139, 5579–5587. [Google Scholar] [CrossRef] [PubMed]
- Sarma, B.B.; Carmieli, R.; Collauto, A.; Efremenko, I.; Martin, J.M.L.; Neumann, R. Electron transfer oxidation of benzene and aerobic oxidation to phenol. ACS Catal. 2016, 6, 6403–6407. [Google Scholar] [CrossRef]
- Aliabadi, A.; Zaripov, R.; Salikhov, K.; Voronkova, V.; Vavilova, E.; Abdulmalic, M.A.; Ruffer, T.; Buchner, B.; Kataev, V. Electron spin density on the n-donor atoms of Cu(II)-(bis)oxamidato complexes as probed by a pulse eldor detected NMR. J. Phys. Chem. B 2015, 119, 13762–13770. [Google Scholar] [CrossRef] [PubMed]
- Rapatskiy, L.; Ames, W.M.; Perez-Navarro, M.; Savitsky, A.; Griese, J.J.; Weyhermueller, T.; Shafaat, H.S.; Hogbom, M.; Neese, F.; Pantazis, D.A.; et al. Characterization of oxygen bridged manganese model complexes using multifrequency 17O-hyperfine EPR spectroscopies and density functional theory. J. Phys. Chem. B 2015, 119, 13904–13921. [Google Scholar] [CrossRef] [PubMed]
- Hetzke, T.; Bowen, A.M.; Prisner, T.F. Eldor-detected NMR at Q-band. Appl. Magn. Reson. 2017, 48, 1375–1397. [Google Scholar] [CrossRef]
- Goldfarb, D. Eldor-detected NMR. eMagRes 2017, 101–114. [Google Scholar] [CrossRef]
- Bordignon, E. EPR spectroscopy of nitroxide spin probes. eMagRes 2017, 6, 235–253. [Google Scholar]
- Clegg, J.S. Cryptobiosis—A peculiar state of biological organization. Comp. Biochem. Phys. B 2001, 128, 613–624. [Google Scholar] [CrossRef]
- Olsson, C.; Jansson, H.; Swenson, J. The role of trehalose for the stabilization of proteins. J. Phys. Chem. B 2016, 120, 4723–4731. [Google Scholar] [CrossRef] [PubMed]
- Shukla, N.; Pomarico, E.; Chen, L.; Chergui, M.; Othon, C.M. Retardation of bulk water dynamics by disaccharide osmolytes. J. Phys. Chem. B 2016, 120, 9477–9483. [Google Scholar] [CrossRef] [PubMed]
- Carpenter, J.F.; Crowe, J.H. An infrared spectroscopic study of the interactions of carbohydrates with dried proteins. Biochemistry 1989, 28, 3916–3922. [Google Scholar] [CrossRef] [PubMed]
- Belton, P.S.; Gil, A.M. Ir and raman-spectroscopic studies of the interaction of trehalose with hen egg-white lysozyme. Biopolymers 1994, 34, 957–961. [Google Scholar] [CrossRef] [PubMed]
- Sampedro, J.G.; Uribe, S. Trehalose-enzyme interactions result in structure stabilization and activity inhibition. The role of viscosity. Mol. Cell. Biochem. 2004, 256, 319–327. [Google Scholar] [CrossRef] [PubMed]
- Cordone, L.; Cottone, G.; Giuffrida, S.; Palazzo, G.; Venturoli, G.; Viappiani, C. Internal dynamics and protein-matrix coupling in trehalose-coated proteins. Biochim. Biophys. Acta 2005, 1749, 252–281. [Google Scholar] [CrossRef] [PubMed]
- Palazzo, G.; Mallardi, A.; Hochkoeppler, A.; Cordone, L.; Venturoli, G. Electron transfer kinetics in photosynthetic reaction centers embedded in trehalose glasses: Trapping of conformational substates at room temperature. Biophys. J. 2002, 82, 558–568. [Google Scholar] [CrossRef]
- Francia, F.; Dezi, M.; Mallardi, A.; Palazzo, G.; Cordone, L.; Venturoli, G. Protein-matrix coupling/uncoupling in “dry” systems of photosynthetic reaction center embedded in trehalose/sucrose: The origin of trehalose peculiarity. J. Am. Chem. Soc. 2008, 130, 10240–10246. [Google Scholar] [CrossRef] [PubMed]
- Francia, F.; Palazzo, G.; Mallardi, A.; Cordone, L.; Venturoli, G. Residual water modulates Qa−-to-Qb− electron transfer in bacterial reaction centers embedded in trehalose amorphous matrices. Biophys. J. 2003, 85, 2760–2775. [Google Scholar] [CrossRef]
- Malferrari, M.; Francia, F.; Venturoli, G. Retardation of protein dynamics by trehalose in dehydrated systems of photosynthetic reaction centers. Insights from electron transfer and thermal denaturation kinetics. J. Phys. Chem. B 2015, 119, 13600–13618. [Google Scholar] [CrossRef] [PubMed]
- Savitsky, A.; Malferrari, M.; Francia, F.; Venturoli, G.; Möbius, K. Bacterial photosynthetic reaction centers in trehalose glasses: Coupling between protein conformational dynamics and electron-transfer kinetics as studied by laser-flash and high-field EPR spectroscopies. J. Phys. Chem. B 2010, 114, 12729–12743. [Google Scholar] [CrossRef] [PubMed]
- Francia, F.; Palazzo, G.; Mallardi, A.; Cordone, L.; Venturoli, G. Probing light-induced conformational transitions in bacterial photosynthetic reaction centers embedded in trehalose-water amorphous matrices. Biochim. Biophys. Acta 2004, 1658, 50–57. [Google Scholar] [CrossRef] [PubMed]
- Kleinfeld, D.; Okamura, M.Y.; Feher, G. Electron-transfer kinetics in photosynthetic reaction centers cooled to cryogenic temperatures in the charge-separated state: Evidence for light-induced structural changes. Biochemistry 1984, 23, 5780–5786. [Google Scholar] [CrossRef] [PubMed]
- McMahon, B.H.; Muller, J.D.; Wraight, C.A.; Nienhaus, G.U. Electron transfer and protein dynamics in the photosynthetic reaction center. Biophys. J. 1998, 74, 2567–2587. [Google Scholar] [CrossRef]
- Malferrari, M.; Nalepa, A.; Venturoli, G.; Francia, F.; Lubitz, W.; Möbius, K.; Savitsky, A. Structural and dynamical characteristics of trehalose and sucrose matrices at different hydration levels as probed by ftir and high-field EPR. Phys. Chem. Chem. Phys. 2014, 16, 9831–9848. [Google Scholar] [CrossRef] [PubMed]
- Koepke, J.; Krammer, E.M.; Klingen, A.R.; Sebban, P.; Ullmann, G.M.; Fritzsch, G. Ph modulates the quinone position in the photosynthetic reaction center from rhodobacter sphaeroides in the neutral and charge separated states. J. Mol. Biol. 2007, 371, 396–409. [Google Scholar] [CrossRef] [PubMed]
- Joliot, P.; Barbieri, G.; Chabaud, R. Un nouveau modele des centres photochimiques du systeme II. Photochem. Photobiol. 1969, 10, 309–329. [Google Scholar] [CrossRef]
- Blankenship, R.E. Molecular Mechanisms of Photosynthesis; Wiley: Oxford, UK, 2014. [Google Scholar]
- Cardona, T.; Sedoud, A.; Cox, N.; Rutherford, A.W. Charge separation in photosystem ii: A comparative and evolutionary overview. Biochim. Biophys. Acta 2012, 1817, 26–43. [Google Scholar] [CrossRef] [PubMed]
- Rappaport, F.; Guergova-Kuras, M.; Nixon, P.J.; Diner, B.A.; Lavergne, J. Kinetics and pathways of charge recombination in photosystem II. Biochemistry 2002, 41, 8518–8527. [Google Scholar] [CrossRef] [PubMed]
- Umena, Y.; Kawakami, K.; Shen, J.R.; Kamiya, N. Crystal structure of oxygen-evolving photosystem ii at a resolution of 1.9. Nature 2011, 473, 55–60. [Google Scholar] [CrossRef] [PubMed]
- Zouni, A.; Witt, H.-T.; Kern, J.; Fromme, P.; Krauss, N.; Saenger, W.; Orth, P. Crystal structure of photosystem II from Synechococcus elongatus at 3.8 Å resolution. Nature 2001, 409, 739–743. [Google Scholar] [CrossRef] [PubMed]
- Ferreira, K.N.; Iverson, T.M.; Maghlaoui, K.; Barber, J.; Iwata, S. Architecture of the photosynthetic oxygen-evolving center. Science 2004, 303, 1831–1838. [Google Scholar] [CrossRef] [PubMed]
- Yano, J.; Kern, J.; Irrgang, K.-D.; Latimer, M.J.; Bergmann, U.; Glatzel, P.; Pushkar, Y.; Biesiadka, J.; Loll, B.; Sauer, K.; et al. X-ray damage to the Mn4Ca complex in single crystals of photosystem II: A case study for metalloprotein crystallography. Proc. Natl. Acad. Sci. USA 2005, 102, 12047–12052. [Google Scholar] [CrossRef] [PubMed]
- Ogata, H.; Lubitz, W. Protein crystallography using free-electron lasers: Water oxidation in photosynthesis. Angew. Chem. Int. Ed. 2014, 53, 13007–13008. [Google Scholar] [CrossRef] [PubMed]
- Chapman, H.N.; Fromme, P.; Barty, A.; White, T.A.; Kirian, R.A.; Aquila, A.; Hunter, M.S.; Schulz, J.; DePonte, D.P.; Weierstall, U.; et al. Femtosecond X-ray protein nanocrystallography. Nature 2011, 470, 73–77. [Google Scholar] [CrossRef] [PubMed]
- Messinger, J.; Renger, G. Chapter 17 photosynthetic water splitting. In Primary Processes of Photosynthesis, Part 2: Principles and Apparatus; The Royal Society of Chemistry: London, UK, 2008; Volume 9, pp. 291–349. [Google Scholar]
- Kok, B.; Forbush, B.; McGloin, M. Cooperation of charges in photosynthetic O2 evolution. Photochem. Photobiol. 1970, 11, 457–476. [Google Scholar] [CrossRef] [PubMed]
- Hillier, W.; Wydrzynski, T.J. 18O-water exchange in photosystem II: Substrate binding and intermediates of the water splitting cycle. Coord. Chem. Rev. 2008, 252, 306–317. [Google Scholar] [CrossRef]
- Dau, H.; Haumann, M. The manganese complex of photosystem II in its reaction cycle-basic framework and possible realization at the atomic level. Coord. Chem. Rev. 2008, 252, 273–295. [Google Scholar] [CrossRef]
- Klauss, A.; Haumann, M.; Dau, H. Alternating electron and proton transfer steps in photosynthetic water oxidation. Proc. Natl. Acad. Sci. USA 2012, 109, 16035–16040. [Google Scholar] [CrossRef] [PubMed] [Green Version]
- Cox, N.; Pantazis, D.A.; Neese, F.; Lubitz, W. Biological water oxidation. Acc. Chem. Res. 2013, 46, 1588–1596. [Google Scholar] [CrossRef] [PubMed]
- Lubitz, W.; Lohmiller, T.; Cox, N. Water oxidation and oxygen evolution in photosynthesis. An enzyme that changed the world. Bunsen-Mag. 2016, 101, 216–223. [Google Scholar]
- Haddy, A. EPR spectroscopy of the manganese cluster of photosystem II. Photosynth. Res. 2007, 92, 357–368. [Google Scholar] [CrossRef] [PubMed]
- Dismukes, G.C.; Siderer, Y. Intermediates of a polynuclear manganese center involved in photosynthetic oxidation of water. Proc. Natl. Acad. Sci. USA 1981, 78, 274–278. [Google Scholar] [CrossRef] [PubMed] [Green Version]
- Messinger, J.; Robblee, J.H.; Yu, W.O.; Sauer, K.; Yachandra, V.K.; Klein, M.P. The S0 state of the oxygen-evolving complex in photosystem ii is paramagnetic: Detection of an EPR multiline signal. J. Am. Chem. Soc. 1997, 119, 11349–11350. [Google Scholar] [CrossRef] [PubMed]
- Kulik, L.V.; Epel, B.; Lubitz, W.; Messinger, J. Electronic structure of the Mn4OxCa cluster in the S0 and S2 states of the oxygen-evolving complex of photosystem II based on pulse 55Mn ENDOR and EPR spectroscopy. J. Am. Chem. Soc. 2007, 129, 13421–13435. [Google Scholar] [CrossRef] [PubMed]
- Randall, D.W.; Sturgeon, B.E.; Ball, J.A.; Lorigan, G.A.; Chan, M.K.; Klein, M.P.; Armstrong, W.H.; Britt, R.D. 55Mn ese-ENDOR of a mixed valence Mn(III)Mn(IV) complex: Comparison with the mn cluster of the photosynthetic oxygen-evolving complex. J. Am. Chem. Soc. 1995, 117, 11780–11789. [Google Scholar] [CrossRef]
- Peloquin, J.M.; Campbell, K.A.; Randall, D.W.; Evanchik, M.A.; Pecoraro, V.L.; Armstrong, W.H.; Britt, R.D. 55Mn ENDOR of the S2-state multiline EPR signal of photosystem II: Implications on the structure of the tetranuclear mn cluster. J. Am. Chem. Soc. 2000, 122, 10926–10942. [Google Scholar] [CrossRef]
- Kulik, L.V.; Epel, B.; Lubitz, W.; Messinger, J. 55Mn pulse ENDOR at 34 GHz of the S0 and S2 states of the oxygen-evolving complex in photosystem II. J. Am. Chem. Soc. 2005, 127, 2392–2393. [Google Scholar] [CrossRef] [PubMed]
- Cox, N.; Ames, W.; Epel, B.; Kulik, L.V.; Rapatskiy, L.; Neese, F.; Messinger, J.; Wieghardt, K.; Lubitz, W. Electronic structure of a weakly antiferromagnetically coupled MnIIMnIII model relevant to manganese proteins: A combined EPR, 55Mn-ENDOR, and DFT study. Inorg. Chem. 2011, 50, 8238–8251. [Google Scholar] [CrossRef] [PubMed]
- Stich, T.A.; Yeagle, G.J.; Service, R.F.; Debus, R.J.; Britt, R.D. Ligation of D1-His332 and D1-Asp170 to the manganese cluster of photosystem II from synechocystis assessed by multifrequency pulse EPR spectroscopy. Biochemistry 2011, 50, 7390–7404. [Google Scholar] [CrossRef] [PubMed]
- Schinzel, S.; Schraut, J.; Arbuznikov, A.; Siegbahn, P.; Kaupp, M. Density functional calculations of 55Mn, 14N and 13C electron paramagnetic resonance parameters support an energetically feasible model system for the S2 state of the oxygen-evolving complex of photosystem II. Chem. Eur. J. 2010, 16, 10424–10438. [Google Scholar] [CrossRef] [PubMed]
- Cox, N.; Rapatskiy, L.; Su, J.H.; Pantazis, D.A.; Sugiura, M.; Kulik, L.V.; Dorlet, P.; Rutherford, A.W.; Neese, F.; Boussac, A.; et al. Effect of Ca2+/Sr2+ substitution on the electronic structure of the oxygen-evolving complex of photosystem II: A combined multifrequency EPR, 55Mn-ENDOR, and DFT study of the S2 state. J. Am. Chem. Soc. 2011, 133, 3635–3648. [Google Scholar] [CrossRef] [PubMed]
- Lohmiller, T.; Cox, N.; Su, J.H.; Messinger, J.; Lubitz, W. The basic properties of the electronic structure of the oxygen-evolving complex of photosystem ii are not perturbed by Ca2+ removal. J. Biol. Chem. 2012, 287, 24721–24733. [Google Scholar] [CrossRef] [PubMed]
- Krewald, V.; Retegan, M.; Cox, N.; Messinger, J.; Lubitz, W.; DeBeer, S.; Neese, F.; Pantazis, D.A. Metal oxidation states in biological water splitting. Chem. Sci. 2015, 6, 1676–1695. [Google Scholar] [CrossRef] [PubMed] [Green Version]
- Boussac, A.; Sugiura, M.; Rutherford, A.W.; Dorlet, P. Complete EPR spectrum of the S3-state of the oxygen-evolving photosystem II. J. Am. Chem. Soc. 2009, 131, 5050–5051. [Google Scholar] [CrossRef] [PubMed]
- Cox, N.; Retegan, M.; Neese, F.; Pantazis, D.A.; Boussac, A.; Lubitz, W. Electronic structure of the oxygen-evolving complex in photosystem ii prior to o-o bond formation. Science 2014, 345, 804–808. [Google Scholar] [CrossRef] [PubMed]
- Noguchi, T. Ftir detection of water reactions in the oxygen-evolving centre of photosystem II. Phil. Trans. R. Soc. B 2008, 363, 1189–1195. [Google Scholar] [CrossRef] [PubMed]
- McConnell, I.L.; Grigoryants, V.M.; Scholes, C.P.; Myers, W.K.; Chen, P.Y.; Whittaker, J.W.; Brudvig, G.W. EPR-ENDOR characterization of (17O, 1H, 2 H) water in manganese catalase and its relevance to the oxygen-evolving complex of photosystem II. J. Am. Chem. Soc. 2012, 134, 1504–1512. [Google Scholar] [CrossRef] [PubMed]
- Chu, H.-A.; Sackett, H.; Babcock, G.T. Identification of a Mn-O-Mn cluster vibrational mode of the oxygen-evolving complex in photosystem II by low-frequency ftir spectroscopy. Biochemistry 2000, 39, 14371–14376. [Google Scholar] [CrossRef] [PubMed]
- Navarro, M.P.; Ames, W.M.; Nilsson, H.; Lohmiller, T.; Pantazis, D.A.; Rapatskiy, L.; Nowacyzk, M.M.; Neese, F.; Boussac, A.; Messinger, J.; et al. Ammonia binding to the oxygen-evolving complex of photosystem ii identiefies the solvent-exchangeable water. Proc. Natl. Acad. Sci. USA 2013, 110, 15561–15566. [Google Scholar] [CrossRef] [PubMed]
- Pantazis, D.A.; Ames, W.; Cox, N.; Lubitz, W.; Neese, F. Two interconvertible structures that explain the spectroscopic properties of the oxygen-evolving complex of photosystem II in the S2 state. Angew. Chem. Int. Ed. 2012, 51, 9935–9940. [Google Scholar] [CrossRef] [PubMed]
- Lohmiller, T.; Krewald, V.; Sedoud, A.; Rutherford, A.W.; Neese, F.; Lubitz, W.; Pantazis, D.A.; Cox, N. The first state in the catalytic cycle of the water-oxidizing enzyme: Identification of a water-derived μ-hydroxo bridge. J. Am. Chem. Soc. 2017, 139, 14412–14424. [Google Scholar] [CrossRef] [PubMed]
- Kern, J.; Chatterjee, R.; Young, I.D.; Fuller, F.D.; Lassalle, L.; Ibrahim, M.; Gul, S.; Fransson, T.; Brewster, A.S.; Alonso-Mori, R.; et al. Structures of the intermediates of kok’s photosynthetic water oxidation clock. Nature 2018, in press. [Google Scholar]
- Retegan, M.; Krewald, V.; Mamedov, F.; Neese, F.; Lubitz, W.; Cox, N.; Pantazis, D.A. A five-coordinate Mn(IV) intermediate in biological water oxidation: Spectroscopic signature and a pivot mechanism for water binding. Chem. Sci. 2016, 7, 72–84. [Google Scholar] [CrossRef] [PubMed]
- Siegbahn, P.E.M. Structures and energetics for O2 eormation in photosystem II. Acc. Chem. Res. 2009, 42, 1871–1880. [Google Scholar] [CrossRef] [PubMed]
- Komenda, J.; Sobotka, R.; Nixon, P.J. Assembling and maintaining the photosystem ii complex in chloroplasts and cyanobacteria. Curr. Opin. Plant Biol. 2012, 15, 245–251. [Google Scholar] [CrossRef] [PubMed]
- Hore, P.J. Animal detected magnetic resonance. EPR Newsl. 2011, 21, 2–3. [Google Scholar]
- Prisner, T. Dynamic nuclear polarization at high magnetic fields. EPR Newsl. 2018, 28, 7–8. [Google Scholar]
- Moser, E.; Laistler, E.; Schmitt, F.; Kontaxis, G. Ultra-high field NMR and MRI—The role of magnet technology to increase sensitivity and specificity. Front. Phys. 2017, 5, 33. [Google Scholar] [CrossRef]
- Jeschke, G. Lecture Notes: Studying Macromolecules by EPR; ETH Zurich: Zurich, Switzerland, 2017; p. 72. [Google Scholar]
- Dzikovski, B. Sample preparation for quasioptical high-field ESR. EPR Newsl. 2007, 22, 14–15. [Google Scholar]
- Murray, P.R.; Collison, D.; Daff, S.; Austin, N.; Edge, R.; Flynn, B.W.; Jack, L.; Leroux, F.; McInnes, E.J.L.; Murray, A.F.; et al. An in situ electrochemical cell for q- and w-band EPR spectroscopy. J. Magn. Reson. 2011, 213, 206–209. [Google Scholar] [CrossRef] [PubMed]
- Smirnova, T.I.; Smirnov, A.I. High-field ESR spectroscopy in membrane and protein biophysics. In ESR Spectroscopy in Membrane Biophysics; Springer: Boston, MA, USA, 2007; pp. 165–251. [Google Scholar]
- Hoff, A.J. (Ed.) Optically-detected magnetic resonance of triplet states. In Advanced EPR, Applications in Biology and Biochemistry; Elsevier: Amsterdam, The Netherlands, 1989; pp. 633–684. [Google Scholar]
- Dinse, K.P.; Winscom, C.J. Determination of n-14 quadrupole tensor of phenazine in its lowest excited triplet-state by odnqr. J. Chem. Phys. 1978, 68, 1337–1343. [Google Scholar] [CrossRef]
- Von Borczyskowski, C.V.; Plato, M.; Dinse, K.P.; Möbius, K. Optically detected X-band ENDOR of excited triplet-state of quinoxaline and p-dichlorobenzene. Semicond. Insul. 1978, 4, 376. [Google Scholar]
- Atkins, P.W.; McLauchlan, K.A. Electron spin polarization. In Chemically Induced Magnetic Polarization; Lepley, A.R., Closs, G.L., Eds.; Wiley: New York, NY, USA, 1973; pp. 41–93. [Google Scholar]
- Freed, J.H.; Pedersen, J.B. The theory of chemically induced dynamic spin polarization. In Advances in Magnetic Resonance; Waugh, J.S., Ed.; Academic Press: New York, NY, USA, 1976; Volume 8, pp. 1–80. [Google Scholar]
- Salikhov, K.M.; Molin, Y.N.; Sagdeev, R.Z.; Buchachenko, A.L. Spin Polarization and Magnetic Effects in Radical Reactions; Elsevier: Amsterdam, The Netherlands, 1984. [Google Scholar]
- Steiner, U.E.; Ulrich, T. Magnetic-field effects in chemical-kinetics and related phenomena. Chem. Rev. 1989, 89, 51–147. [Google Scholar] [CrossRef]
- Forbes, M.D.E.; Jarocha, L.E.; Sim, S.; Tarasov, V.F. Chapter one—Time-resolved electron paramagnetic resonance spectroscopy: History, technique, and application to supramolecular and macromolecular chemistry. In Advances in Physical Organic Chemistry; Williams, I.H., Williams, N.H., Eds.; Academic Press: Cambridge, MA, USA, 2013; Volume 47, pp. 1–83. [Google Scholar]
- Zarea, M.; Ratner, M.A.; Wasielewski, M.R. Spin polarization transfer by the radical pair mechanism. J. Chem. Phys. 2015, 143, 054101. [Google Scholar] [CrossRef] [PubMed]
- Weber, A.; Schiemann, O.; Bode, B.; Prisner, T.F. PELDOR at S- and X-band frequencies and the separation of exchange coupling from dipolar coupling. J. Magn. Reson. 2002, 157, 277–285. [Google Scholar] [CrossRef] [PubMed]
- Williams, B.B.; Halpern, H.J. In vivo EPR imaging. In Biomedical EPR, Part A: Free Radicals, Metals, Medicine, and Physiology, Biological Magnetic Resonance Vol. 23; Eaton, S.R., Eaton, G.R., Berliner, L.J., Eds.; Springer: Boston, MA, USA, 2005; pp. 283–319. [Google Scholar]
Figure 1.
Enhanced orientational selectivity by high-field EPR, taking the radical anion of the ubiquinone acceptor cofactor in frozen-solution photosynthetic reaction centers as example. (a) X-band EPR without orientation selection of canonical g-tensor components; (b) W-band EPR with partial orientation selection of the canonical gxx, gyy, gzz components of the g-tensor; (c) calculated orientation selections mapped on the unit sphere.
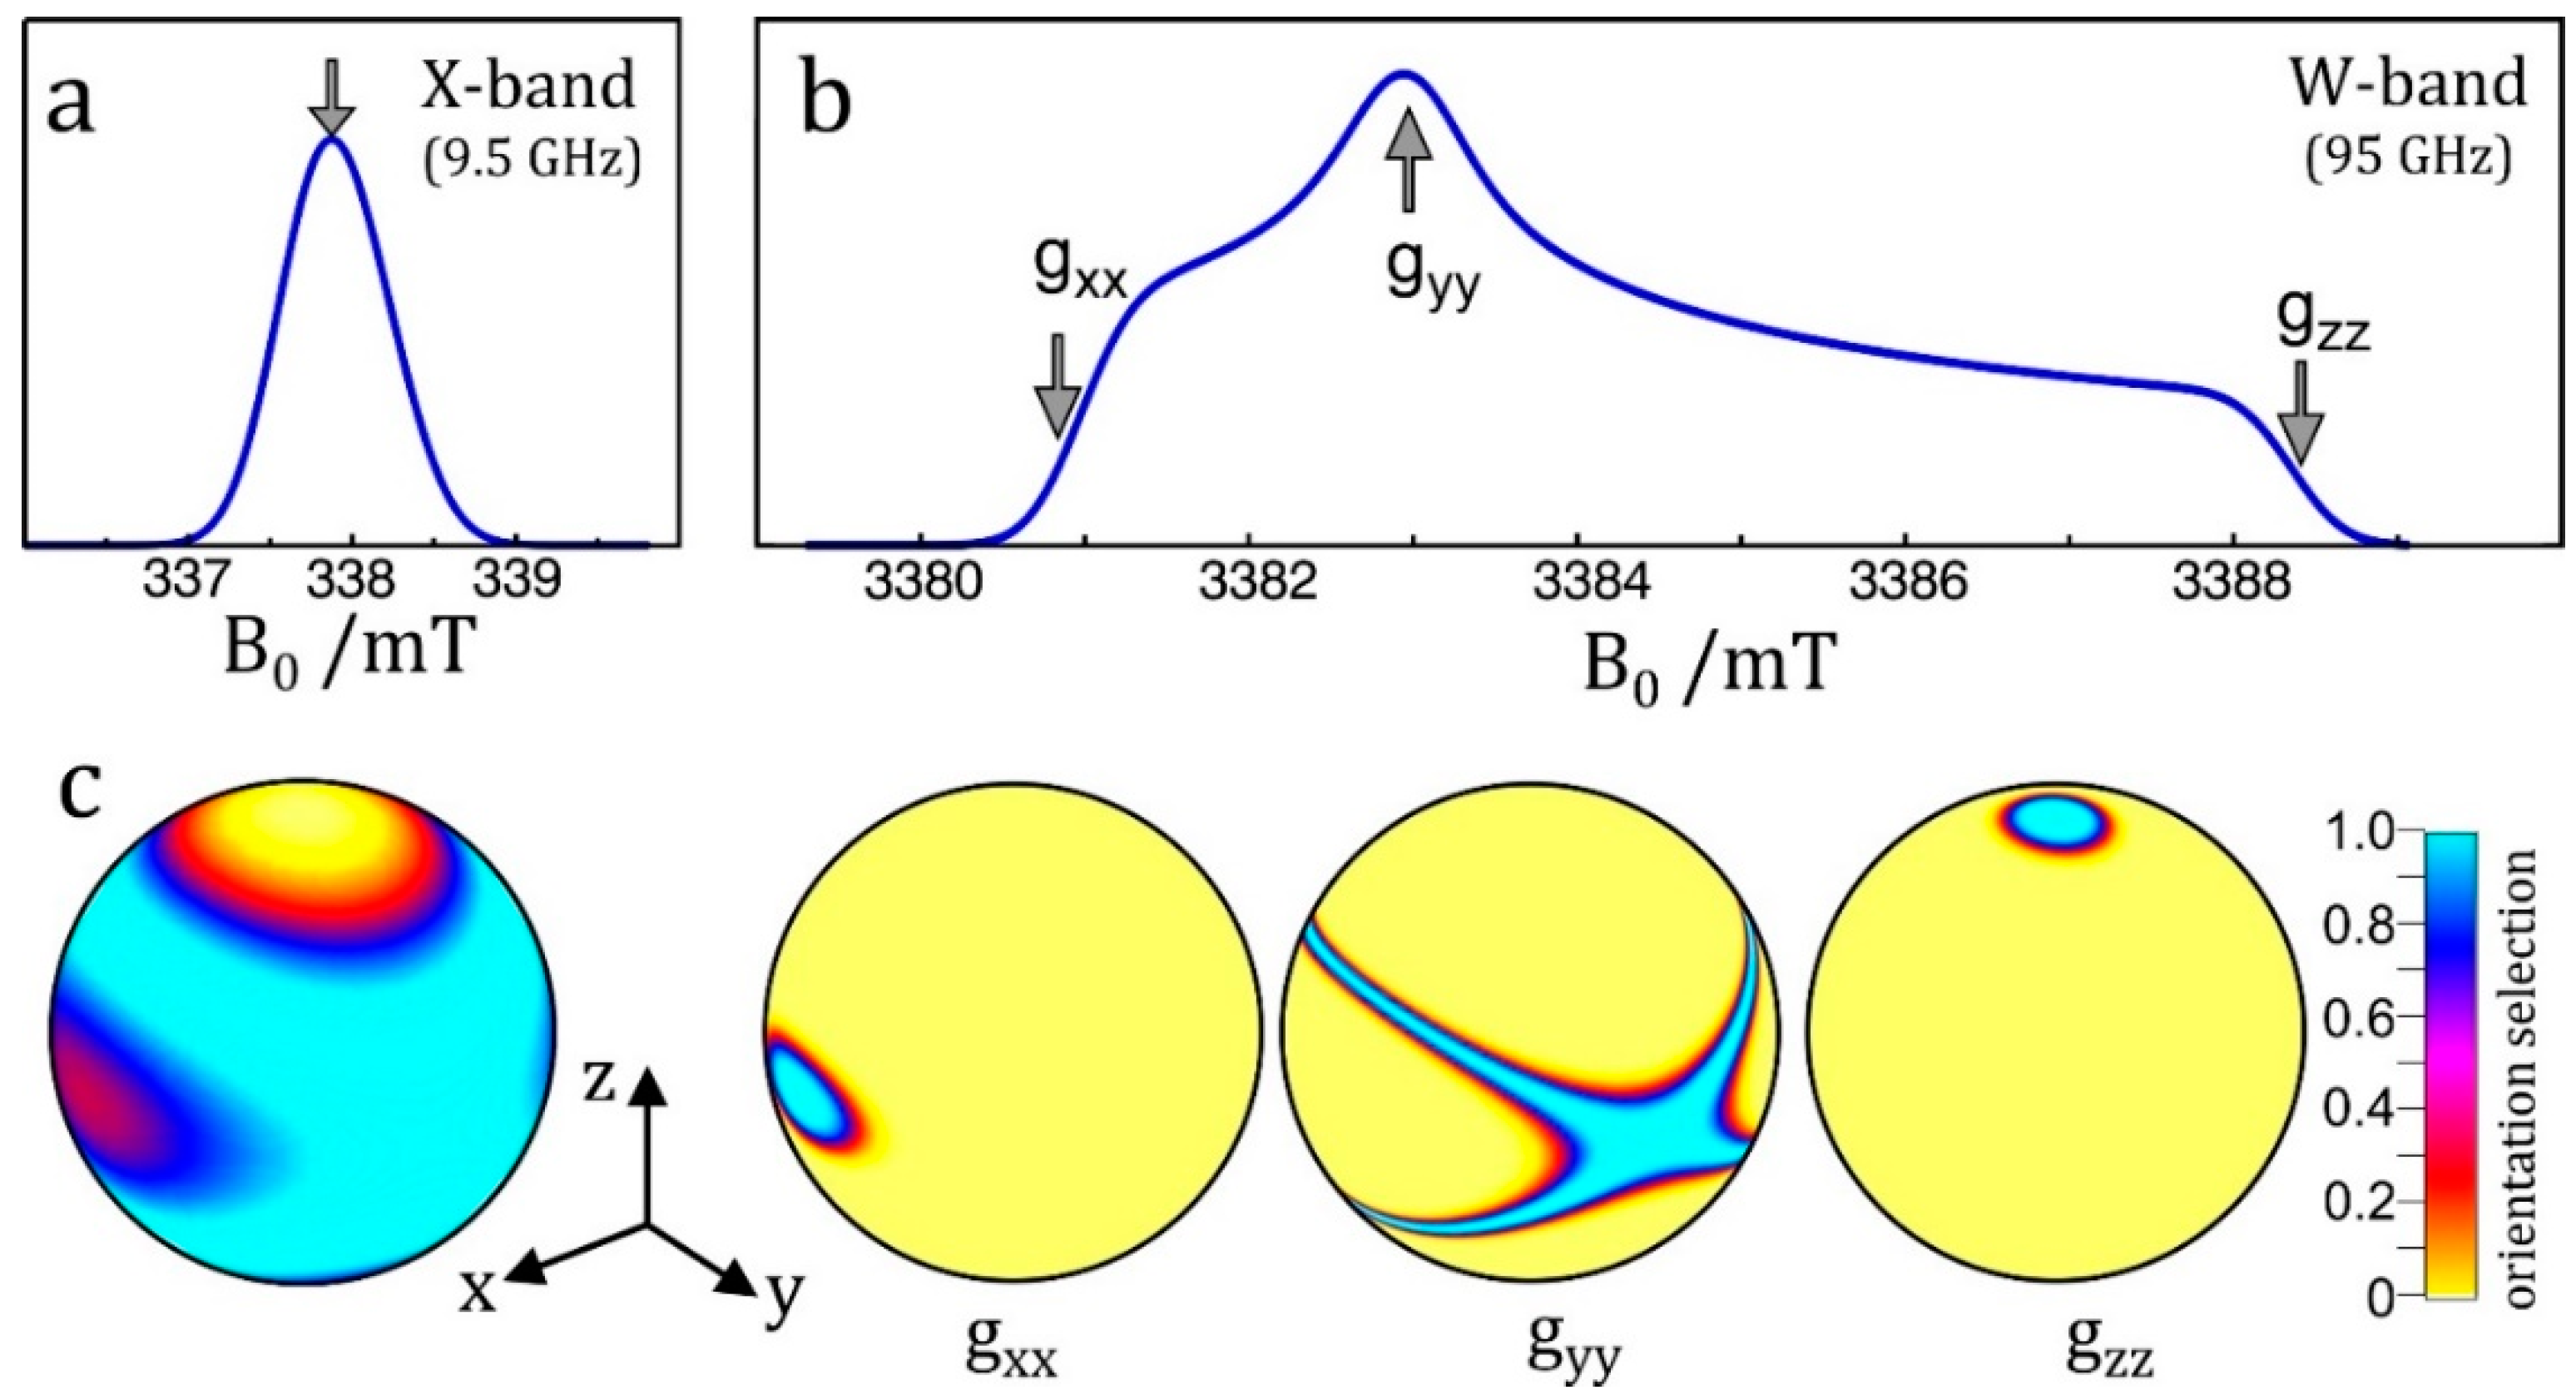
Figure 2.
Microwave (mw) and radio-frequency (rf) cw and pulse irradiation schemes of various time-resolved EPR techniques. For photochemical EPR applications, the initial laser excitation pulse hν starts the photo-reaction creating paramagnetic intermediates. For EPR applications on stable paramagnetic systems, the laser pulse is, of course, omitted. Abbreviations: cw (continuous wave), TR (transient), ENDOR (electron–nuclear double resonance), TRIPLE (electron–nuclear-nuclear triple resonance), ESE (electron spin echo), HYSCORE (hyperfine sublevel correlation spectroscopy), DF (dual frequency) pulsed ELDOR (PELDOR: pulsed electron–electron double resonance), EDNMR (ELDOR-detected NMR, HTA (high turning angle).
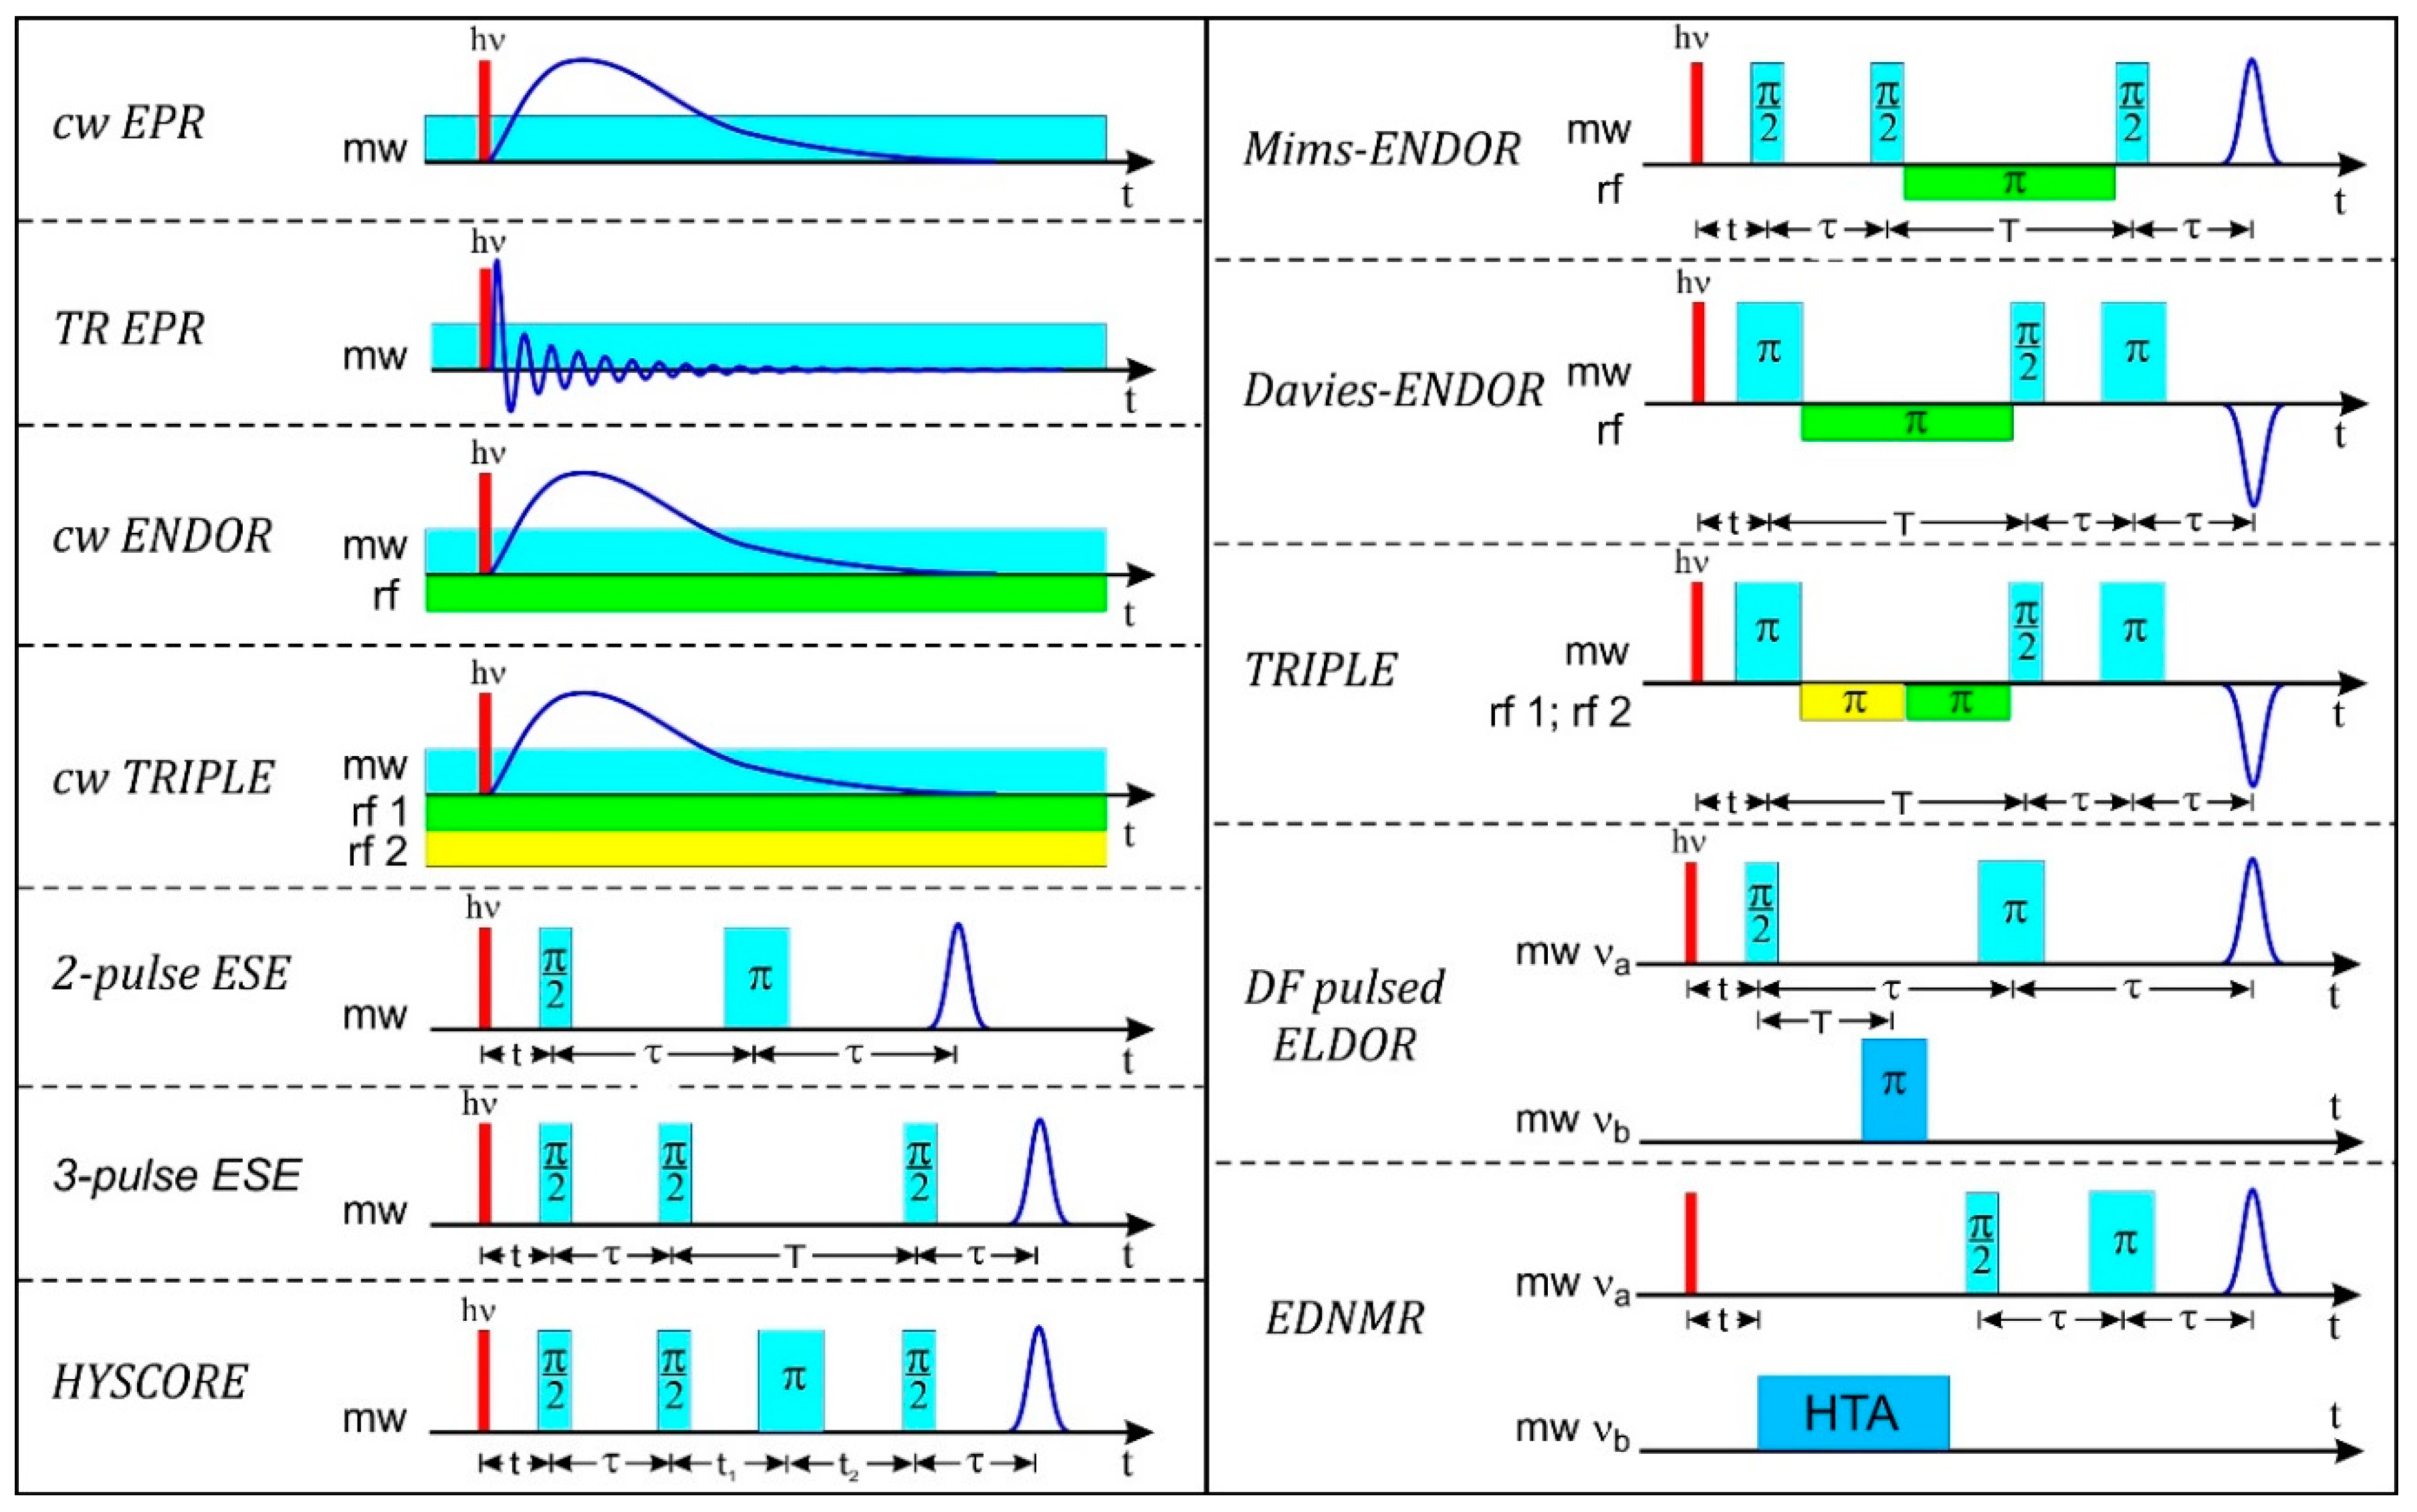
Figure 3.
Gain in ENDOR resolution for systems with doublet states (S = 1/2, g = 2) with increasing Zeeman field B0 and microwave frequency ν. Spectral lines of typical nuclei in organic biomolecules that largely overlap at traditional X-band ENDOR (B0 = 0.34 T, ν = 9.5 GHz) become completely separated at 360 GHz/12.9 T. For details, see [17].
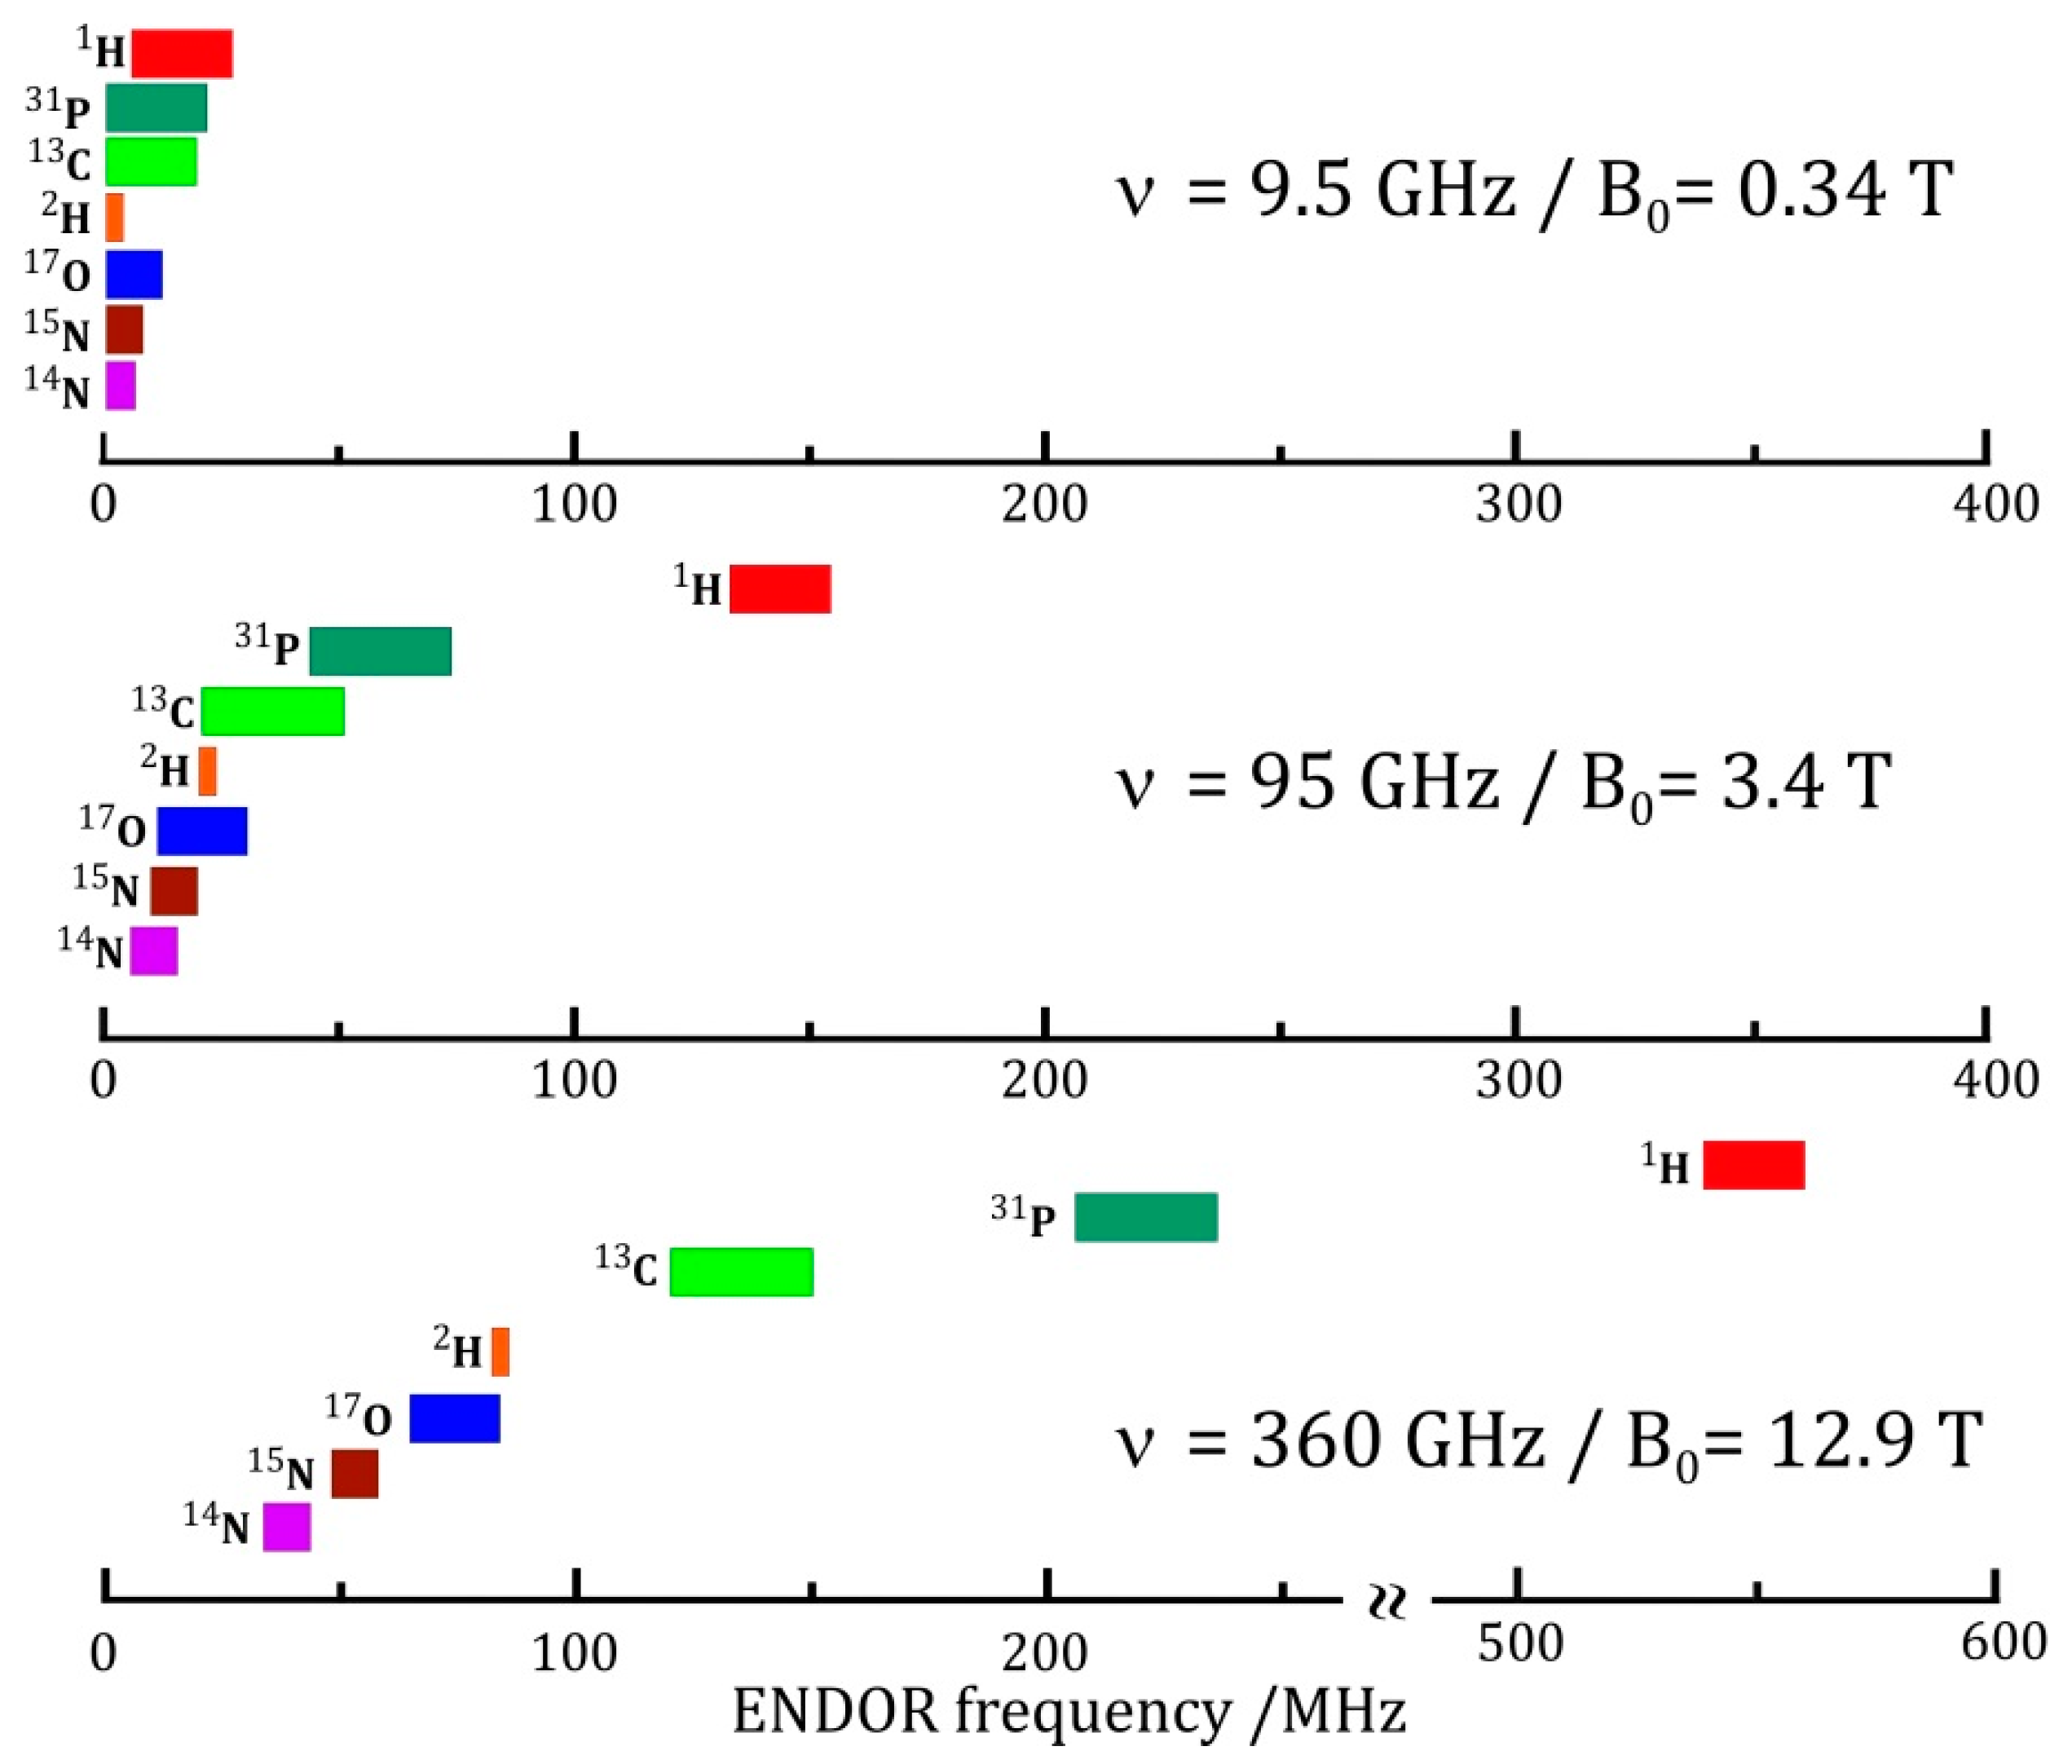
Figure 4.
Comparison of pulsed Davies type ENDOR (a) with pulsed ELDOR-detected NMR (b): Phenomenological description of spin populations after the respective pulses have flipped the spin projections of the electron and nucleus for the case S = 1/2, I = 1/2. The polarization transfer in the Davies-type pulse ENDOR experiment involves allowed electron and nuclear spin transitions. The polarization transfer in the ELDOR-detected NMR experiment involves allowed and forbidden transitions of the hyperfine-coupled electron and nuclear spins. Pulse ENDOR uses a selective microwave pulse train at a frequency ν1, which is in resonance with an allowed electron-spin transition. The change in nuclear polarization occurs when flipping the nuclear spins by the rf pulse with the frequency νRF of an allowed nuclear-spin transition. In pulse ELDOR-detected NMR, following the HTA pulse at a chosen microwave frequency ν2, a selective pulse train with fixed microwave frequency ν1 is applied probing an allowed electron-spin transition. The mw frequency ν2 of the HTA-pulse is varied and once it matches one of the forbidden “cross” transitions (ΔmS = ±1; ΔmI = ±1) a population transfer occurs which is manifested in a change of the Hahn echo intensity. For details, see [1]. The notations πRF and πHTA denote the π-pulses required for optimal polarization transfer. For a detailed discussion, see [2].
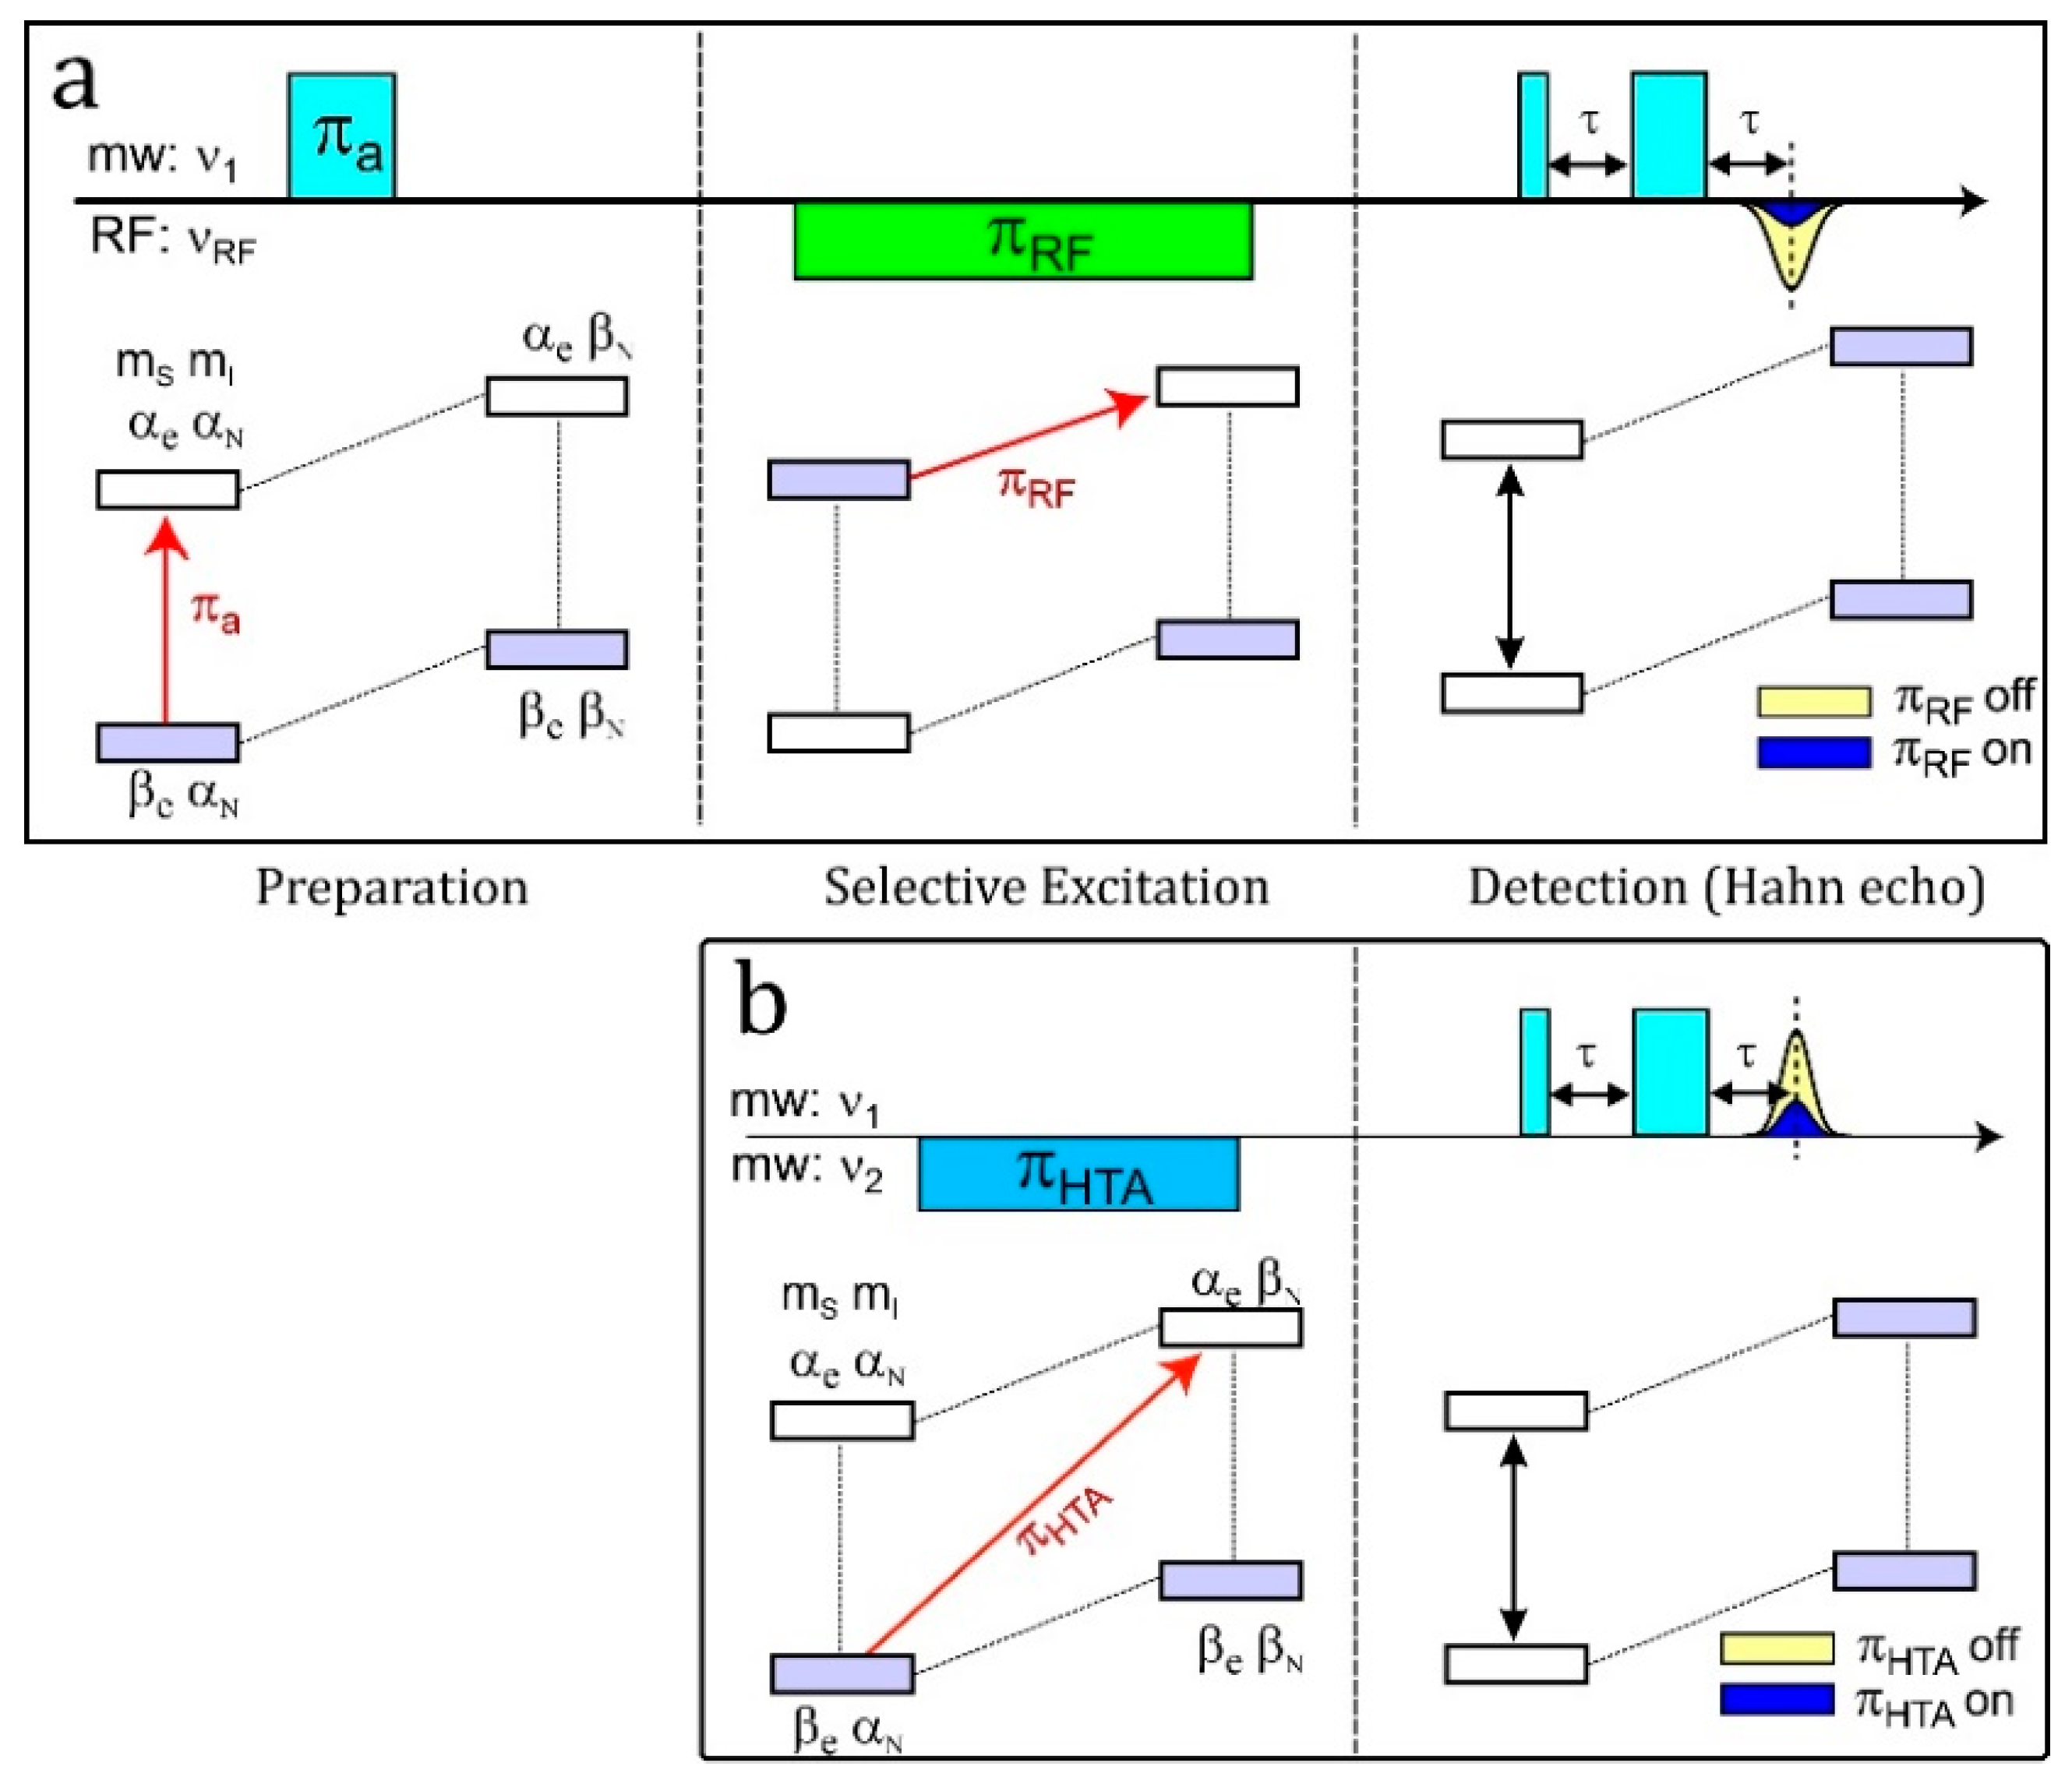
Figure 5.
(a) Experimental W-band cw EPR spectra for a set of bacteriorhodopsin (BR) mutants spin labeled with the methanethiosulfonate (MTSSL) nitroxide side chain (R1); (b) Structural model of BR. The Cα atom of the spin-labeled residues, seven α-helices A to G, the chromophore retinal and D96 and D85 participating in the H+ transfer are indicated; (c) The magnitude of the tensor elements Azz and gxx of the spin labels are plotted as function of the nitroxide location in the protein with respect to position 129. For details, see [494].
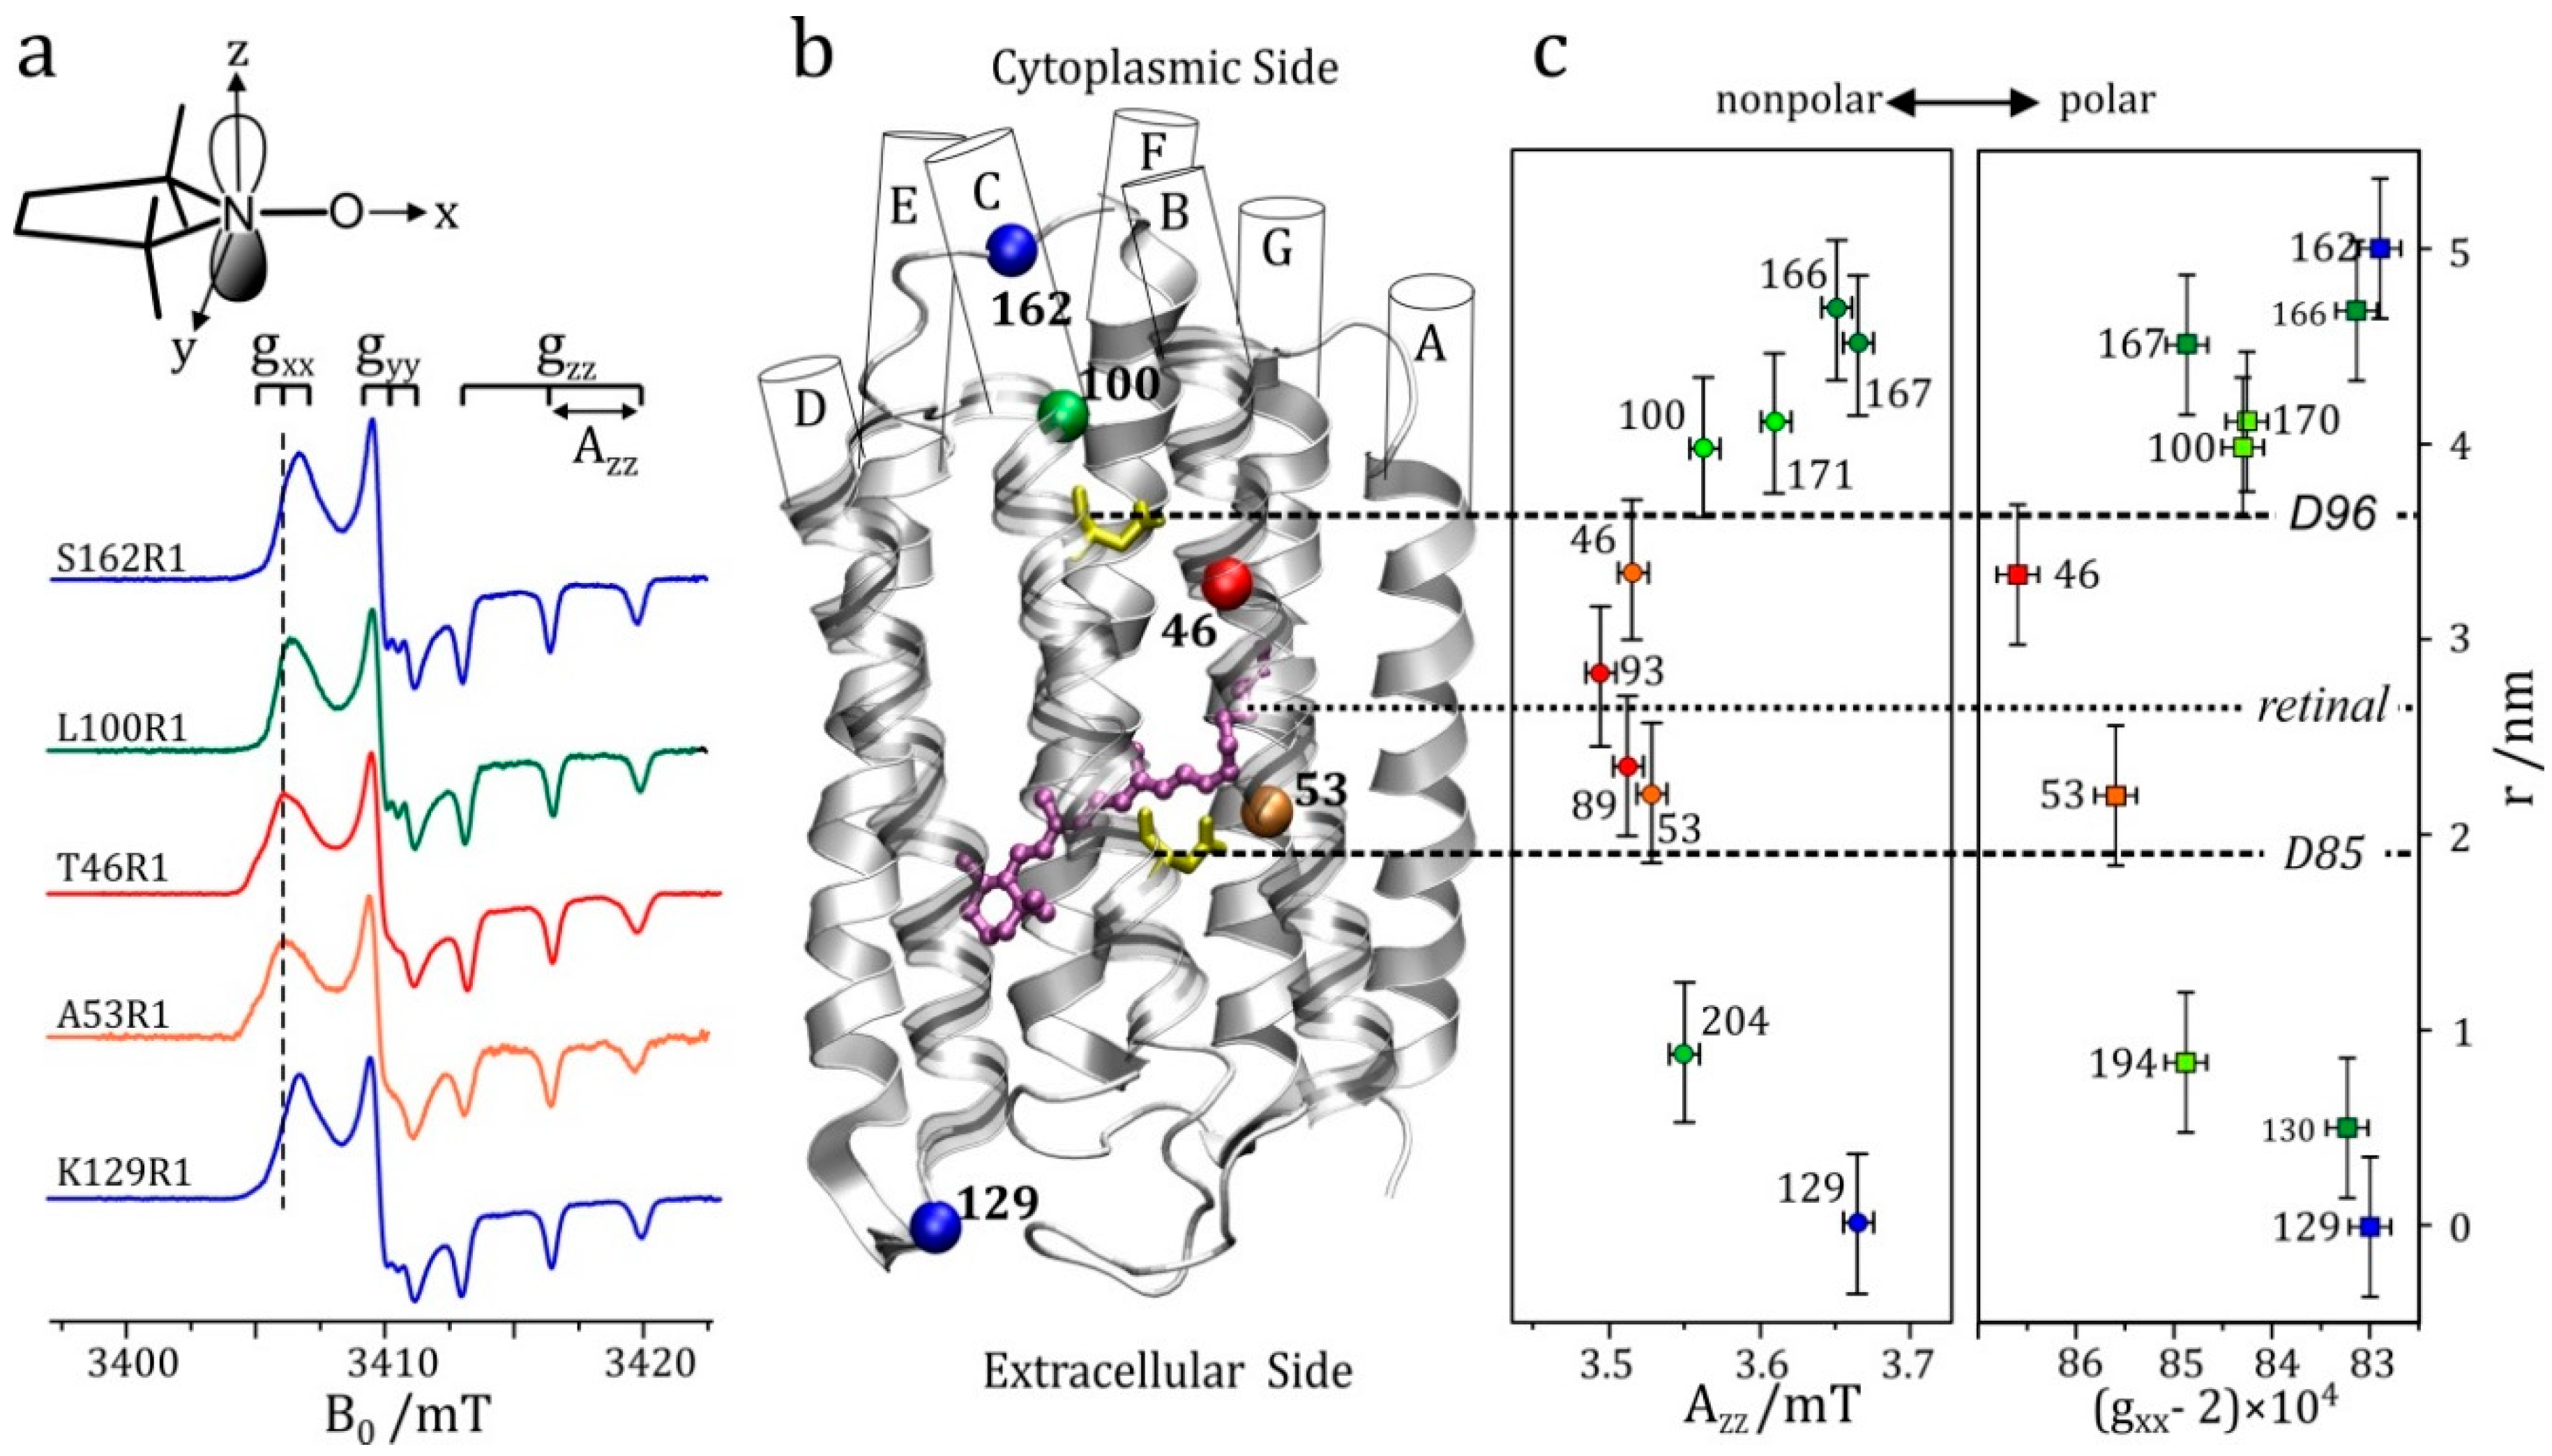
Figure 6.
Experimental plot of gxx versus Azz of the nitroxide side chains for various spin-label positions in bacteriorhodopsin (see text). The “protic” and “aprotic” limiting cases are placed with reference to Molecular Orbital (MO) theory, see [496].
Figure 6.
Experimental plot of gxx versus Azz of the nitroxide side chains for various spin-label positions in bacteriorhodopsin (see text). The “protic” and “aprotic” limiting cases are placed with reference to Molecular Orbital (MO) theory, see [496].
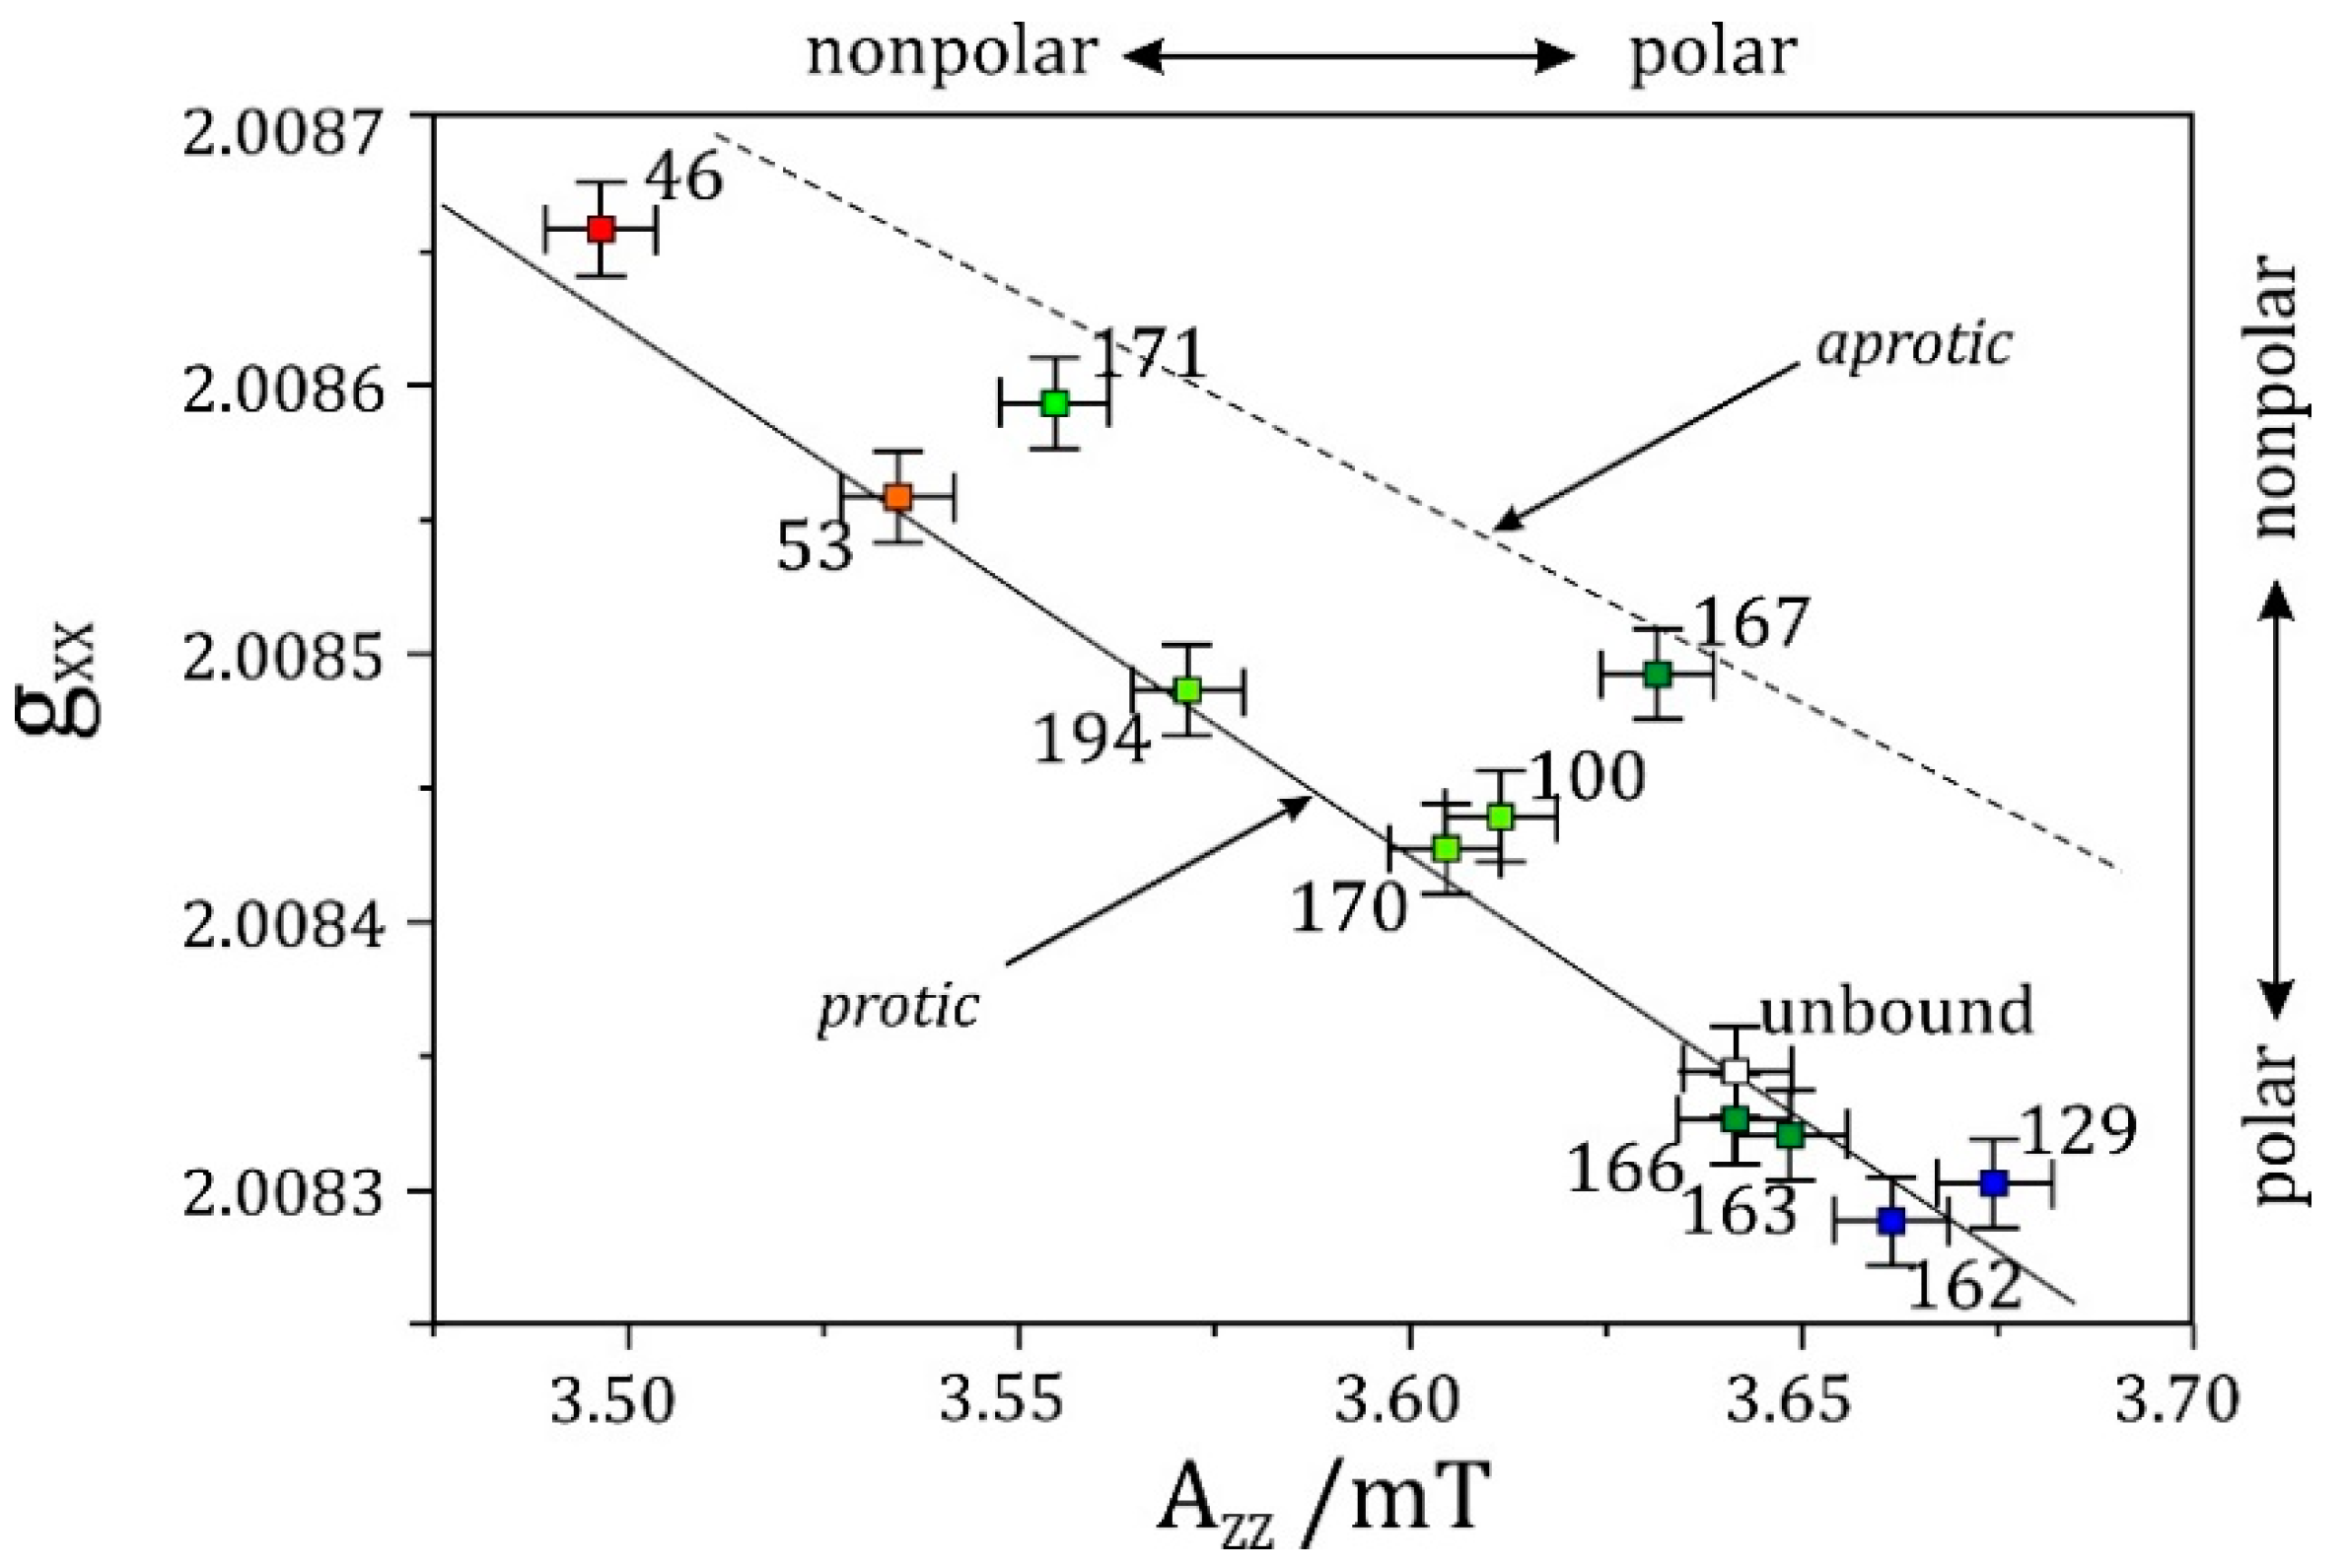
Figure 7.
(a) Four-level energy scheme showing how the EDNMR experiment is realized; ELDOR transitions (blue) related to a particular EPR transition (green) represent the EPR transition plus/minus the NMR (red) transitions; (b) mw pulse sequence used to perform the EDNMR experiment [271]; (c) Typical NMR frequency ranges overlap at low field and frequency (X-band) but are resolved at high field and frequency (W-band); (d) Schematic EDNMR profile at high field, showing that NMR transitions are well-separated from the blind zone (EPR transition).
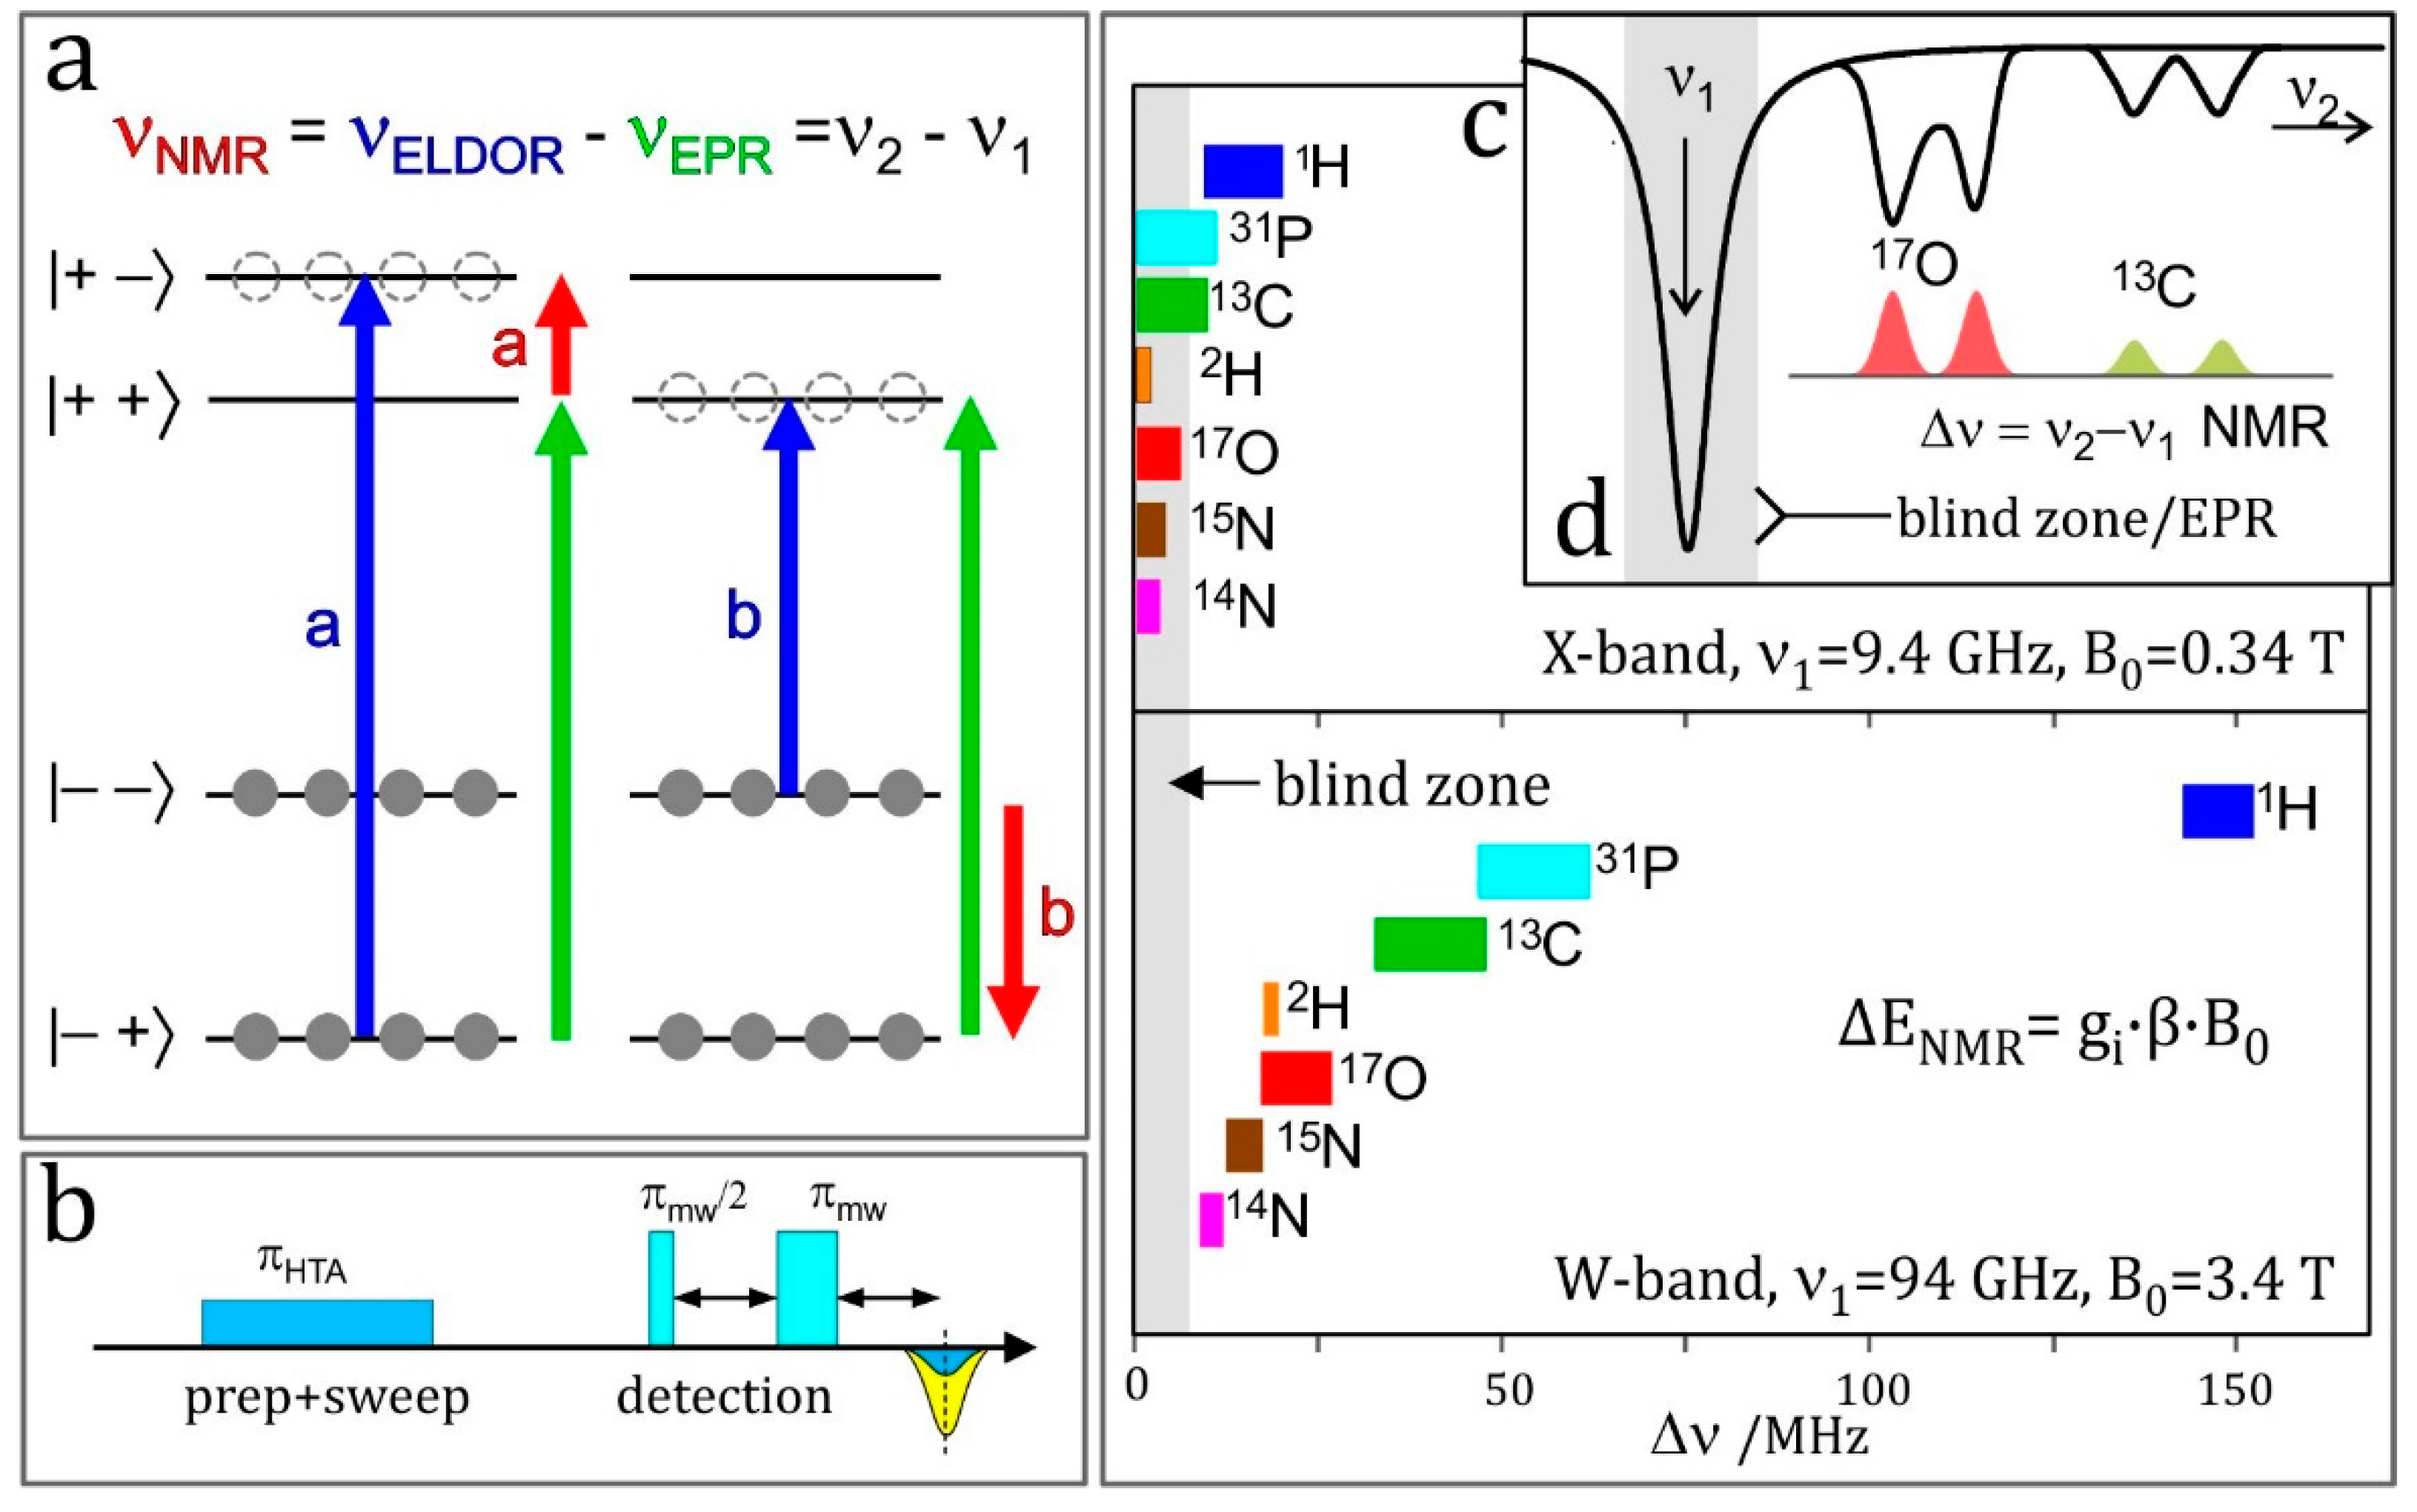
Figure 8.
(a) Microwave pulse sequence for the W-band EDNMR experiment on the nitroxide radical R1 (shown in the left corner) in frozen solution. The echo-detected EPR spectrum of R1 and the mw excitation bandwidth for typical pulse-length settings are shown; (b) Representative example of an EDNMR recording of 1 mM R1-D16 in 2-propanol-D8 at 50 K, acquired at the field position marked with an arrow in the pulse scheme above (c) Contour plot of the field-frequency dependence of W-band EDNMR intensities. The contour lines are shown as isohypses from 0.01 to 1 of the maximum 14N EDNMR intensity. For details see [558].
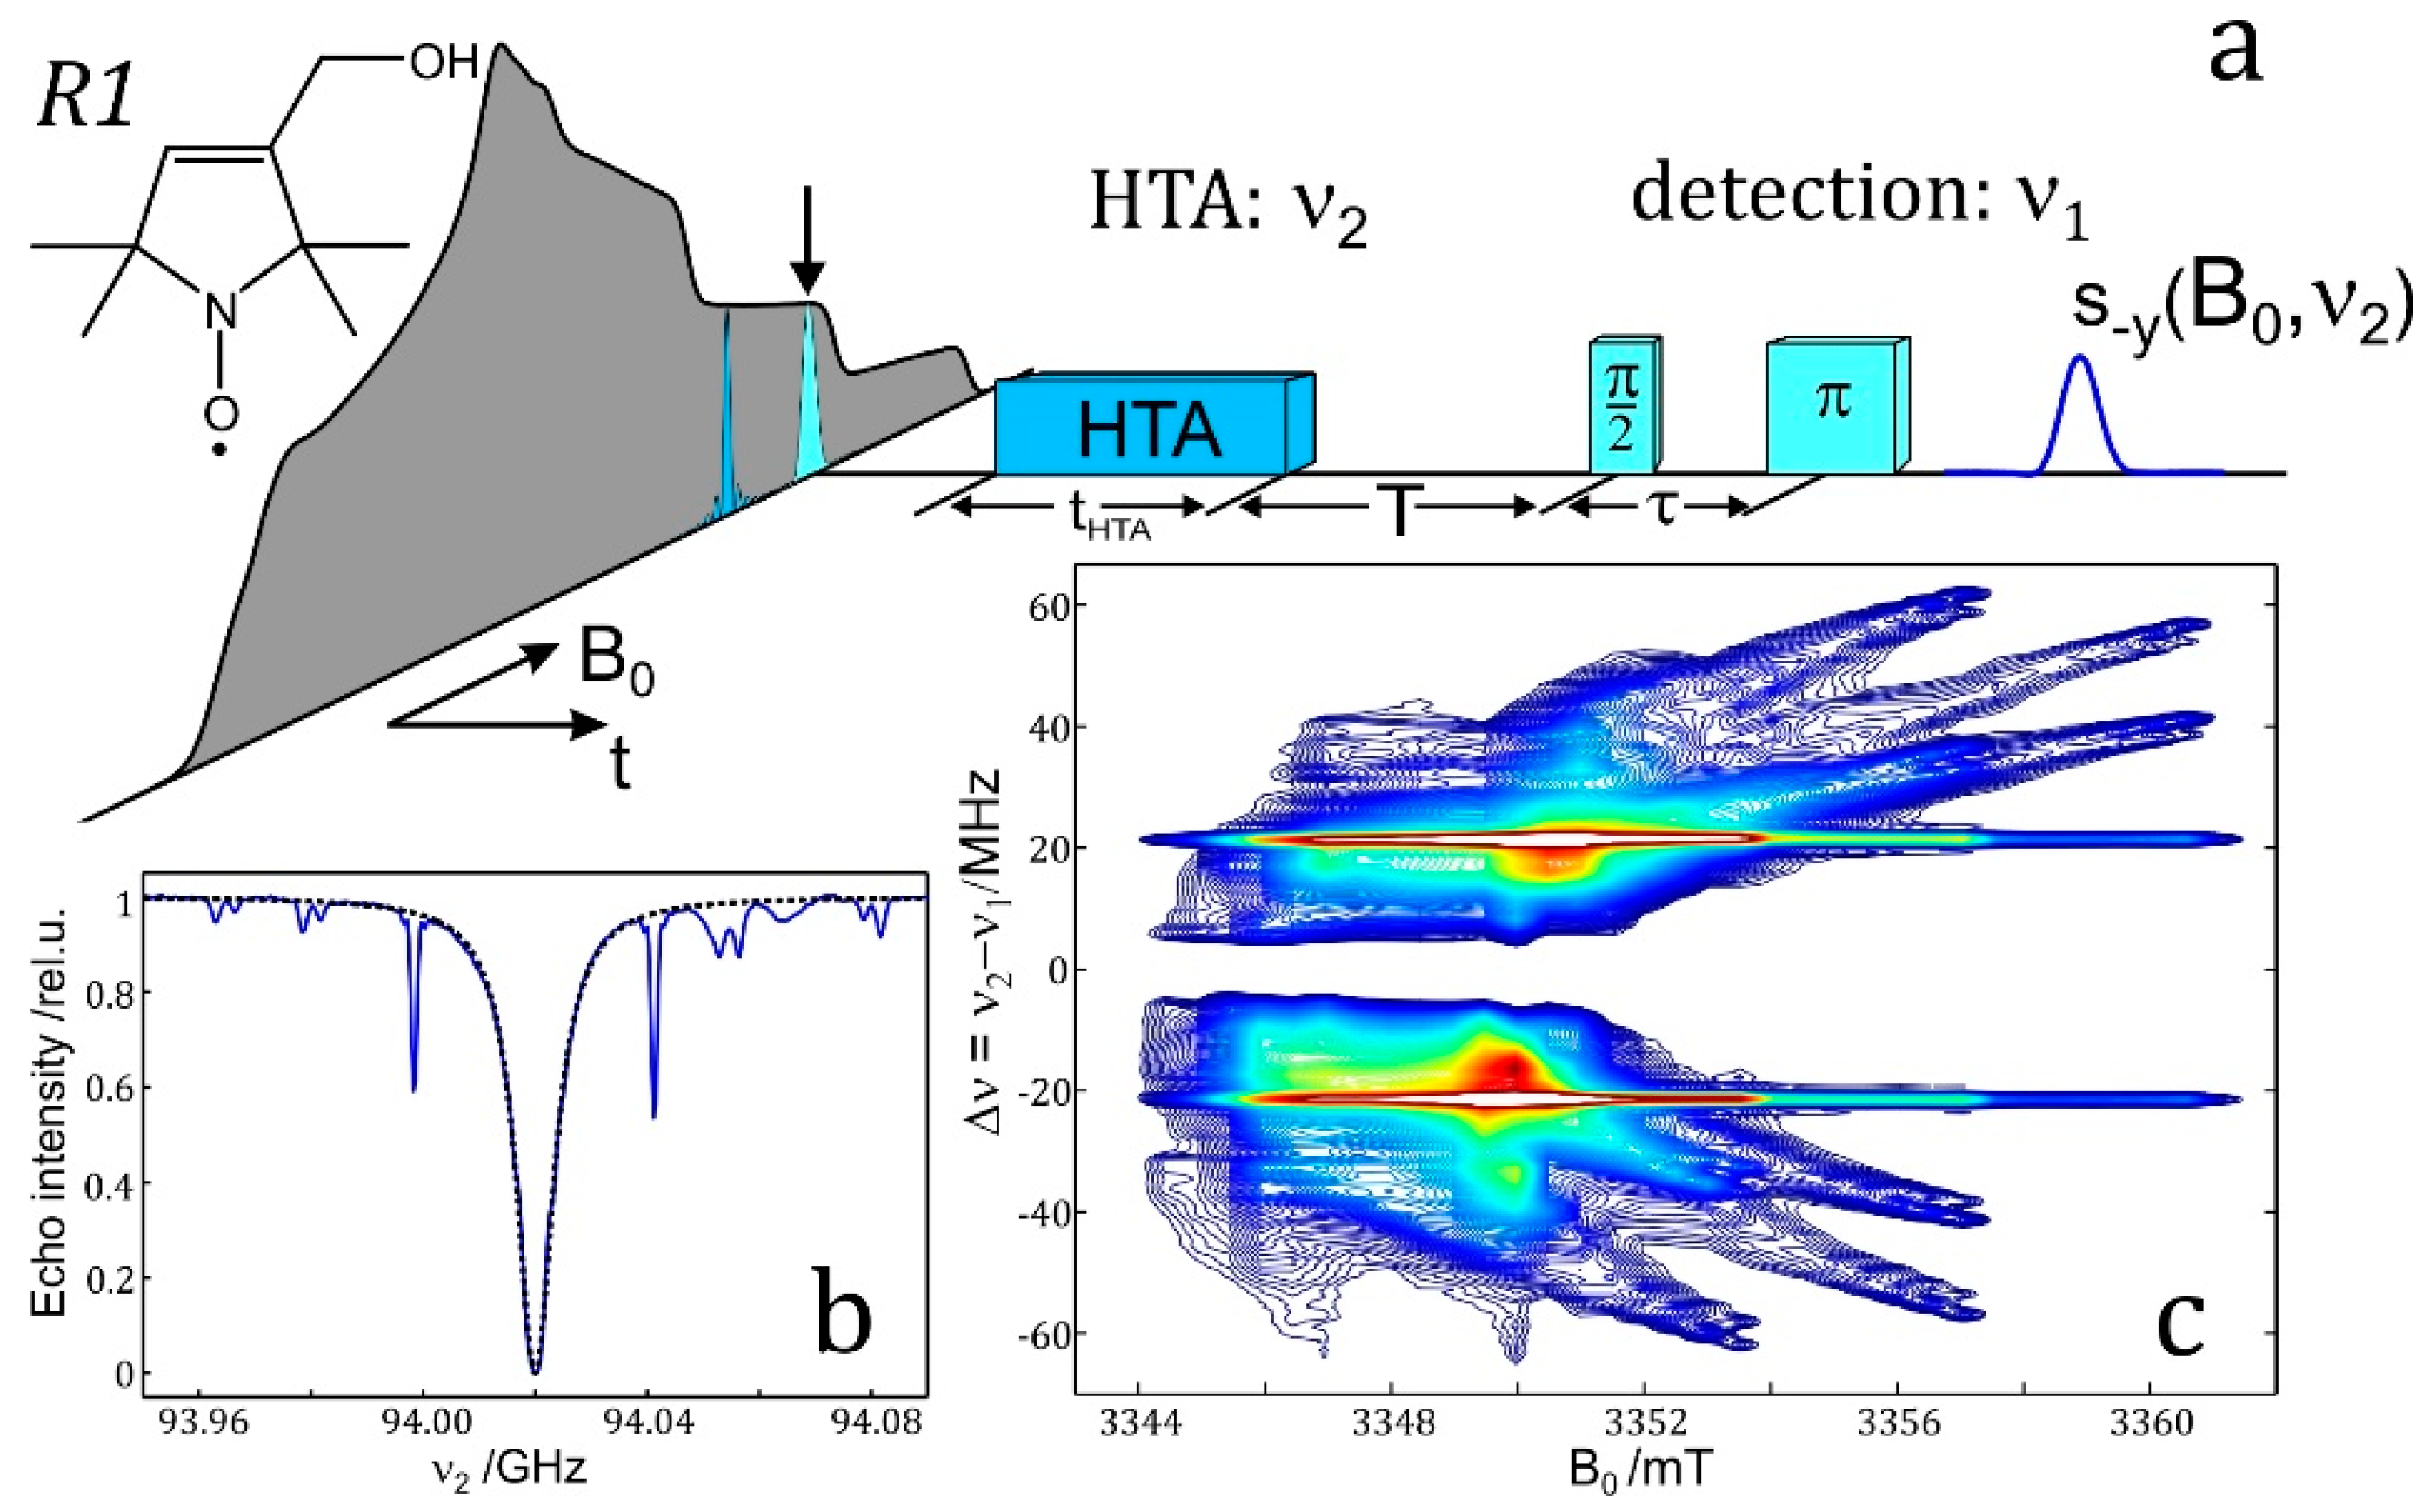
Figure 9.
(a) Comparison of sensitivity and resolution of the W-band EDNMR and ENDOR methods. (a) EDNMR (top) and Davies-ENDOR (bottom) spectra of R1-D16 in frozen ortho-terphenyl-D14/benzene-D6 solution recorded at the same B0 close to the gzz, MI = −1 spectral position at 50 K using 100 and 500 averages per point, respectively. (b) The W-band EDNMR spectra of nitroxide radical R1-D16 in frozen solutions of ortho-terphenyl, aniline, phenol, 2-propanol, methanol, glycerol and water. The spectra were recorded close to the gzz, MI = −1 spectral position at 50 K. The experimental spectra (black traces) are overlaid with best-fit Gaussian lines that are assigned to nitroxide radicals forming either zero (red trace), one (green trace) or two (blue trace) H-bonds with the solvent molecule. The EDNMR lines appear around half the hyperfine coupling in a distance of twice the nuclear Larmor frequency plus quadrupole coupling (for I > 1/2). The fits were performed on the first derivative mode of the experimental traces. For details see [562,563].
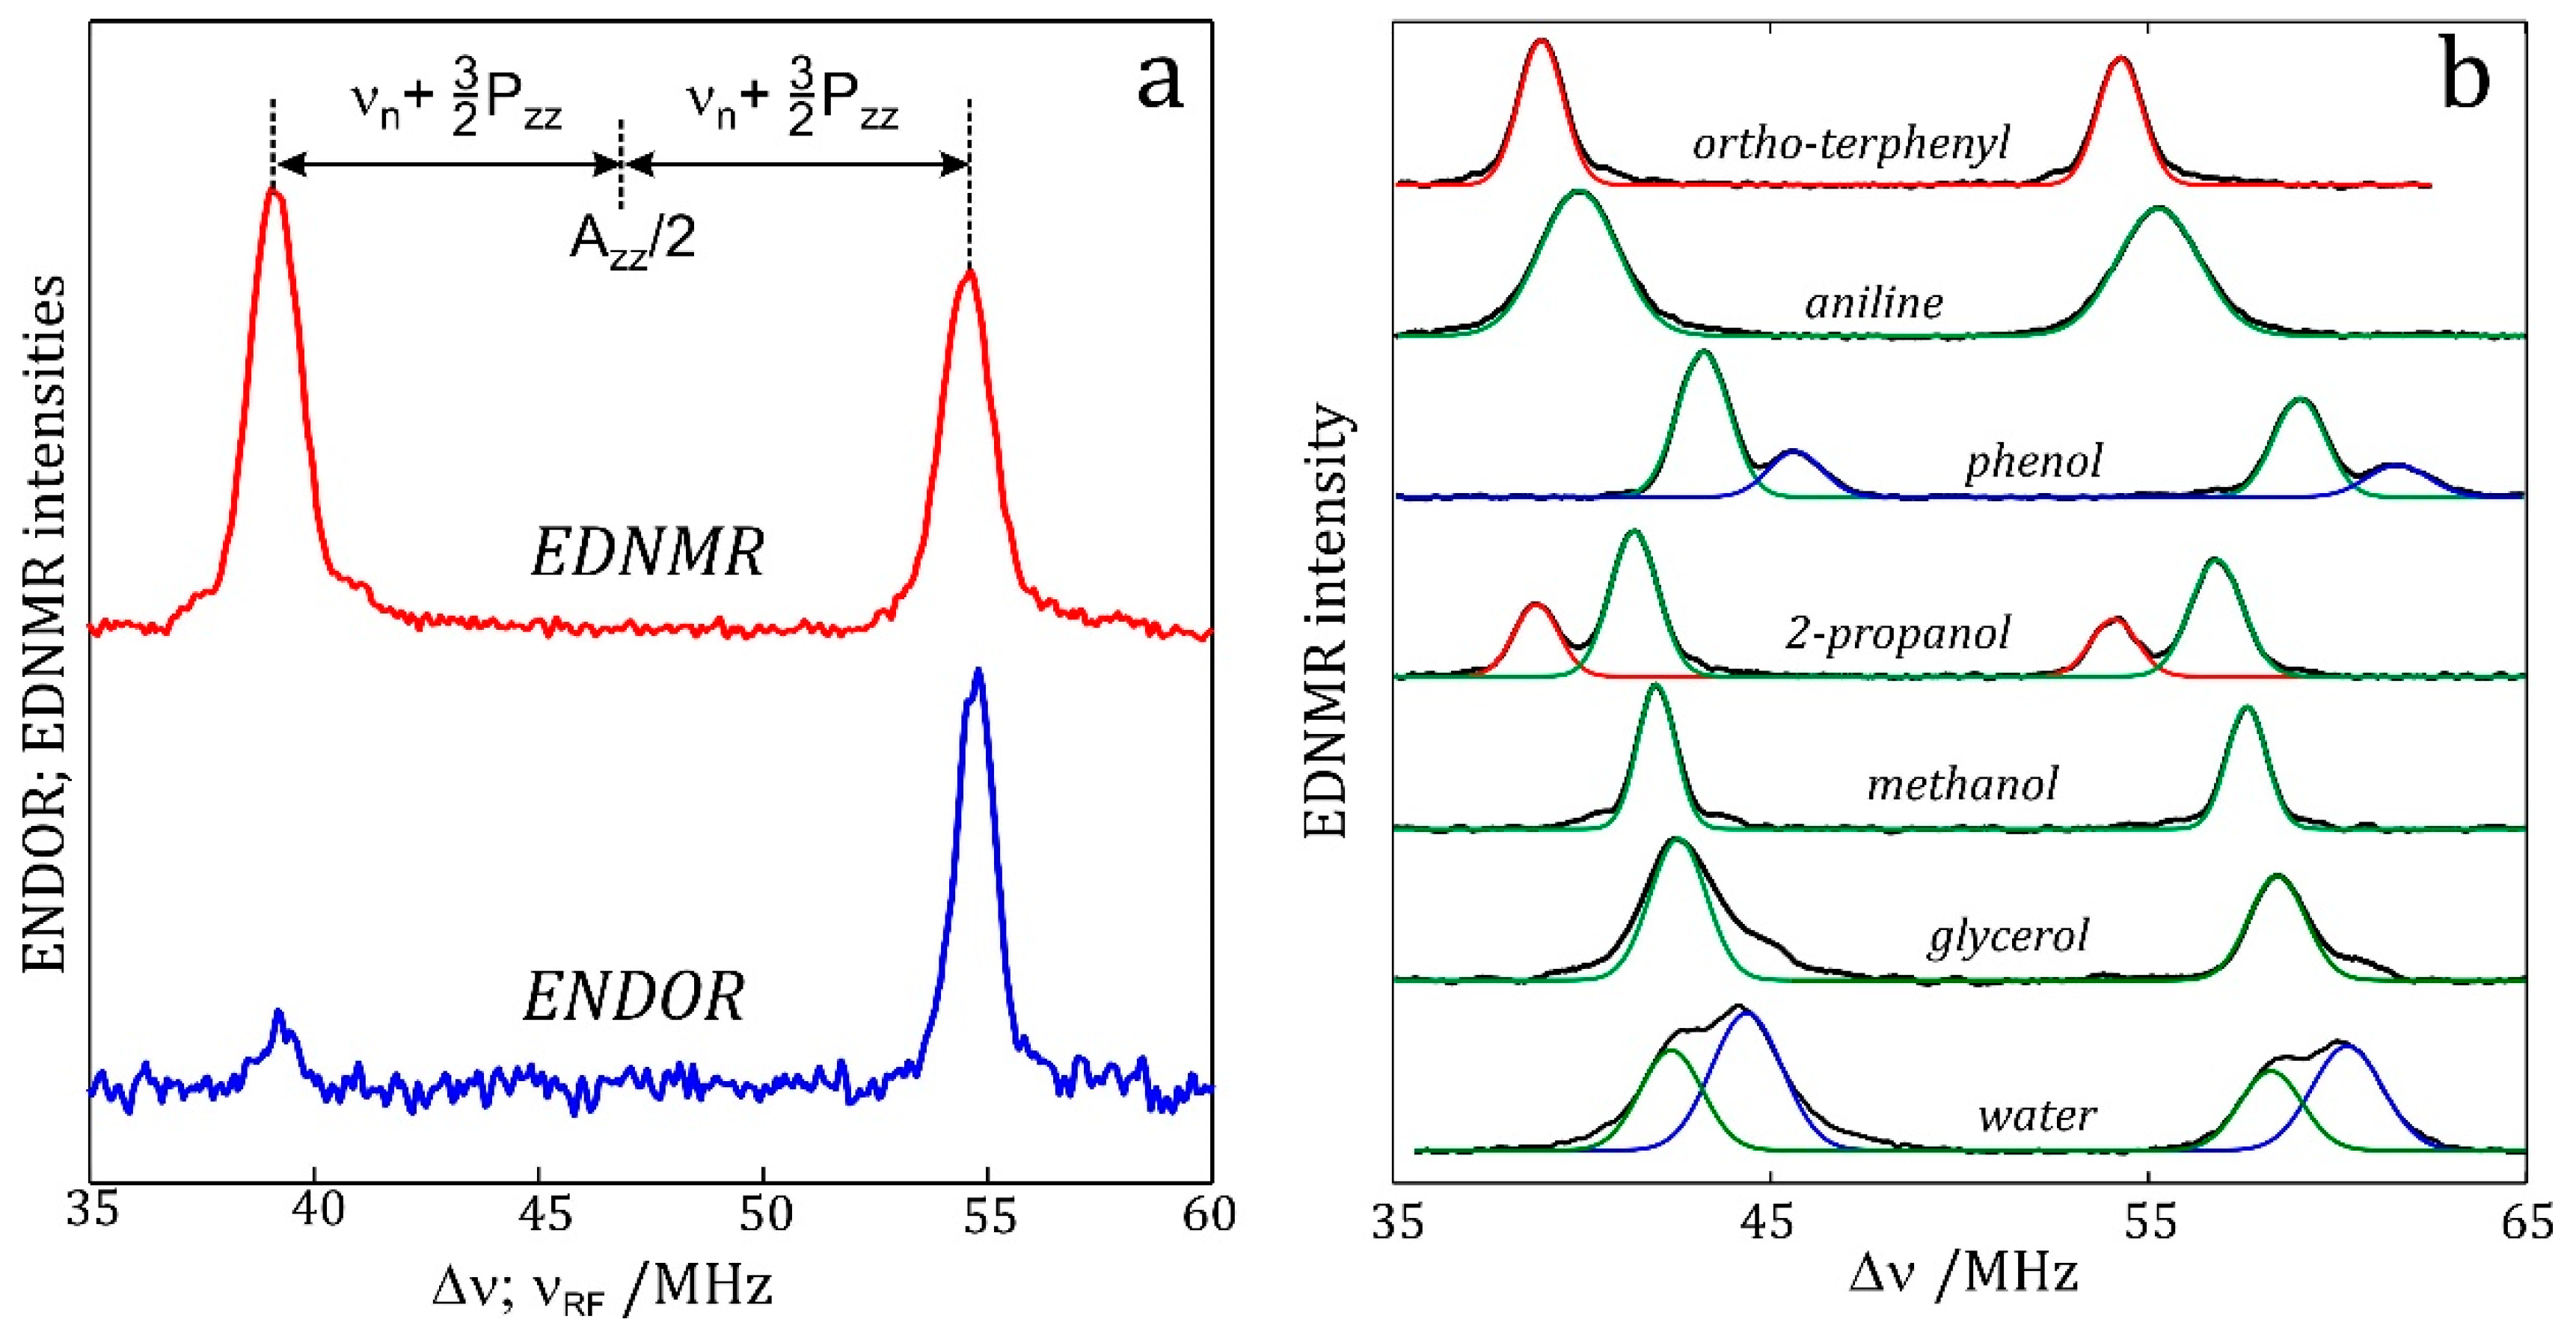
Figure 10.
(a) Molecular surface representation of the bRC from Rb. sphaeroides R26 with indicated the primary electron donor P865 (in blue), the primary electron acceptor QA (in red) and the nitroxide spin label MTSSL attached to Cys156 in the H protein subunit (in green). Strongly bound water molecules within 1 nm radius of each paramagnetic center are shown as green colored spheres, as evaluated from the X-ray structure of highest resolution presently available [603] (pdb: 2J8C). The molecular structure of trehalose is shown in the upper left corner; (b) W-band EDNMR spectra for MTSSL-bRC/trehalose glass samples equilibrated for 70 h at r = 74% (NaCl/H217O) black trace; r = 11% (LiCl/H217O) magenta trace; and r = 11% (LiCl/H2O) red trace. The spectra were recorded at the same nitroxide spectral position (gzz, MI = 0). EDNMR spectra are shown for Δν < 0 to obtain a better separation between 17O and 14N signal contributions; (c) The 17O EDNMR spectra for r = 74% (NaCl/H217O) (black trace) and r = 11% (LiCl/H217O) (magenta trace) samples. The gray dashed lines show the best fit simulations of the experimental recordings to a Gaussian line. For more details, see [545].
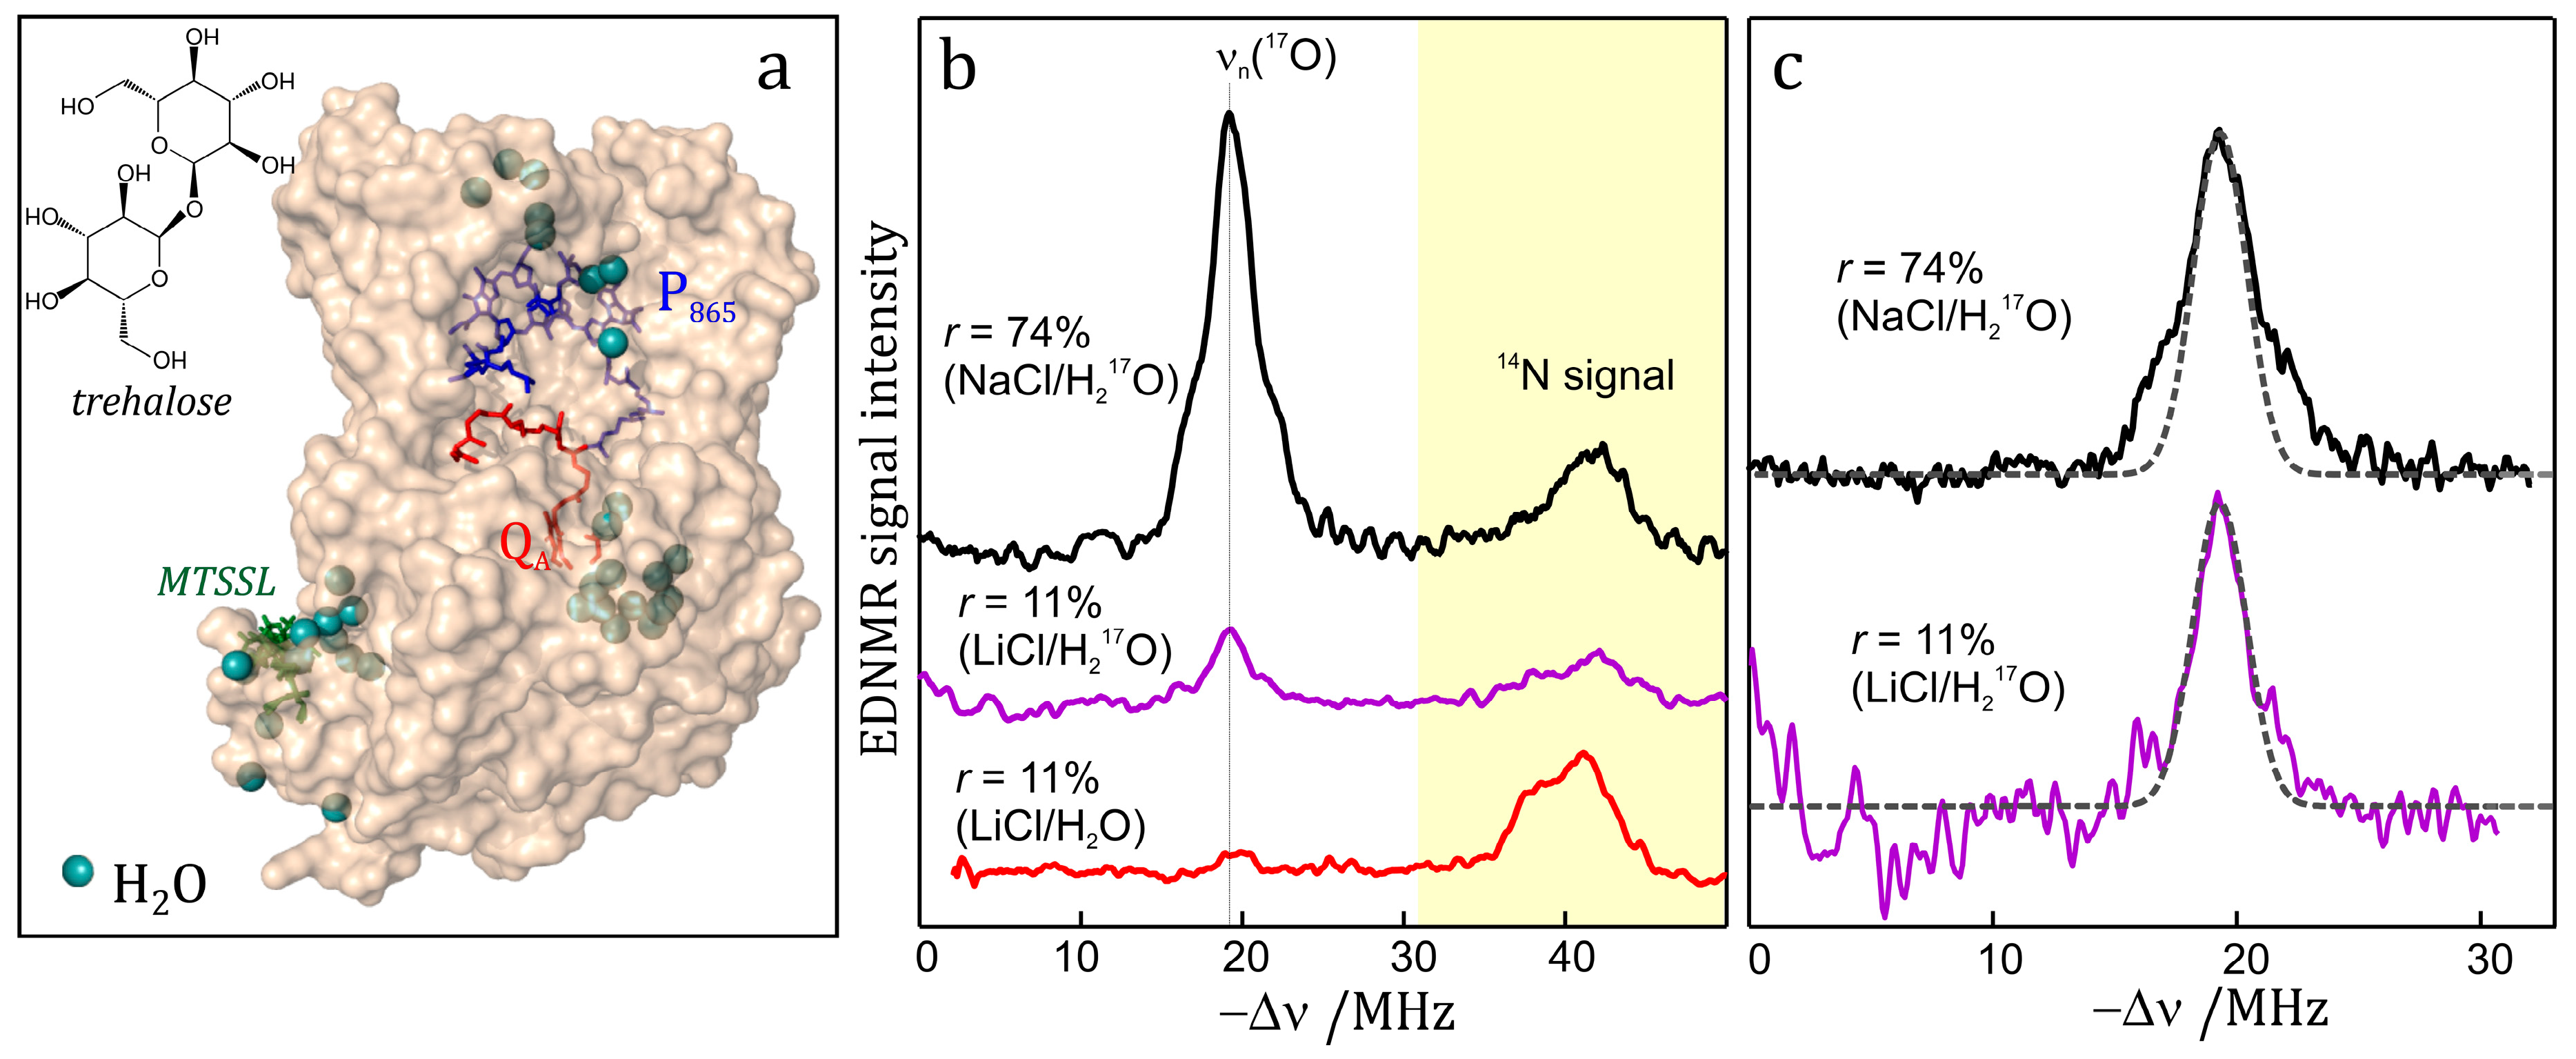
Figure 11.
W-band ELDOR-detected NMR (EDNMR) of MnII(H217O)6 at 20 K. (a) Microwave pulse sequence for the W-band EDNMR experiment; (b) Representative example of an EDNMR recording acquired at the field position shown on the pulse scheme (a). For each ν2 setting 100 echo recordings were averaged with the pulse sequence repeated continuously with 2 kHz. Overall acquisition time for 2048 data points in the range of Δν = 500 MHz was 4 min; (c) The EDNMR spectrum obtained after central blind spot subtraction which is modeled by a Lorentzian line with FWHH of 5.7 MHz, shown by the dashed trace in (b). The right-hand side (RHS, Δν = ν2 − ν1 > 0) and left-hand side (LHS, Δν = ν2 − ν1 < 0) EDNMR spectrum, inverted with the central blind spot subtracted from the raw data which is modeled by a Lorentzian line with FWHH of 5.7 MHz, shown by the dashed trace in (b). Transitions from all three magnetic nuclei of the complex 17O, 55Mn and 1H are marked by red, magenta and gray color respectively. Both single- and double- quantum transitions of the three magnetic nuclei of the complex are observed. For details, see [572].
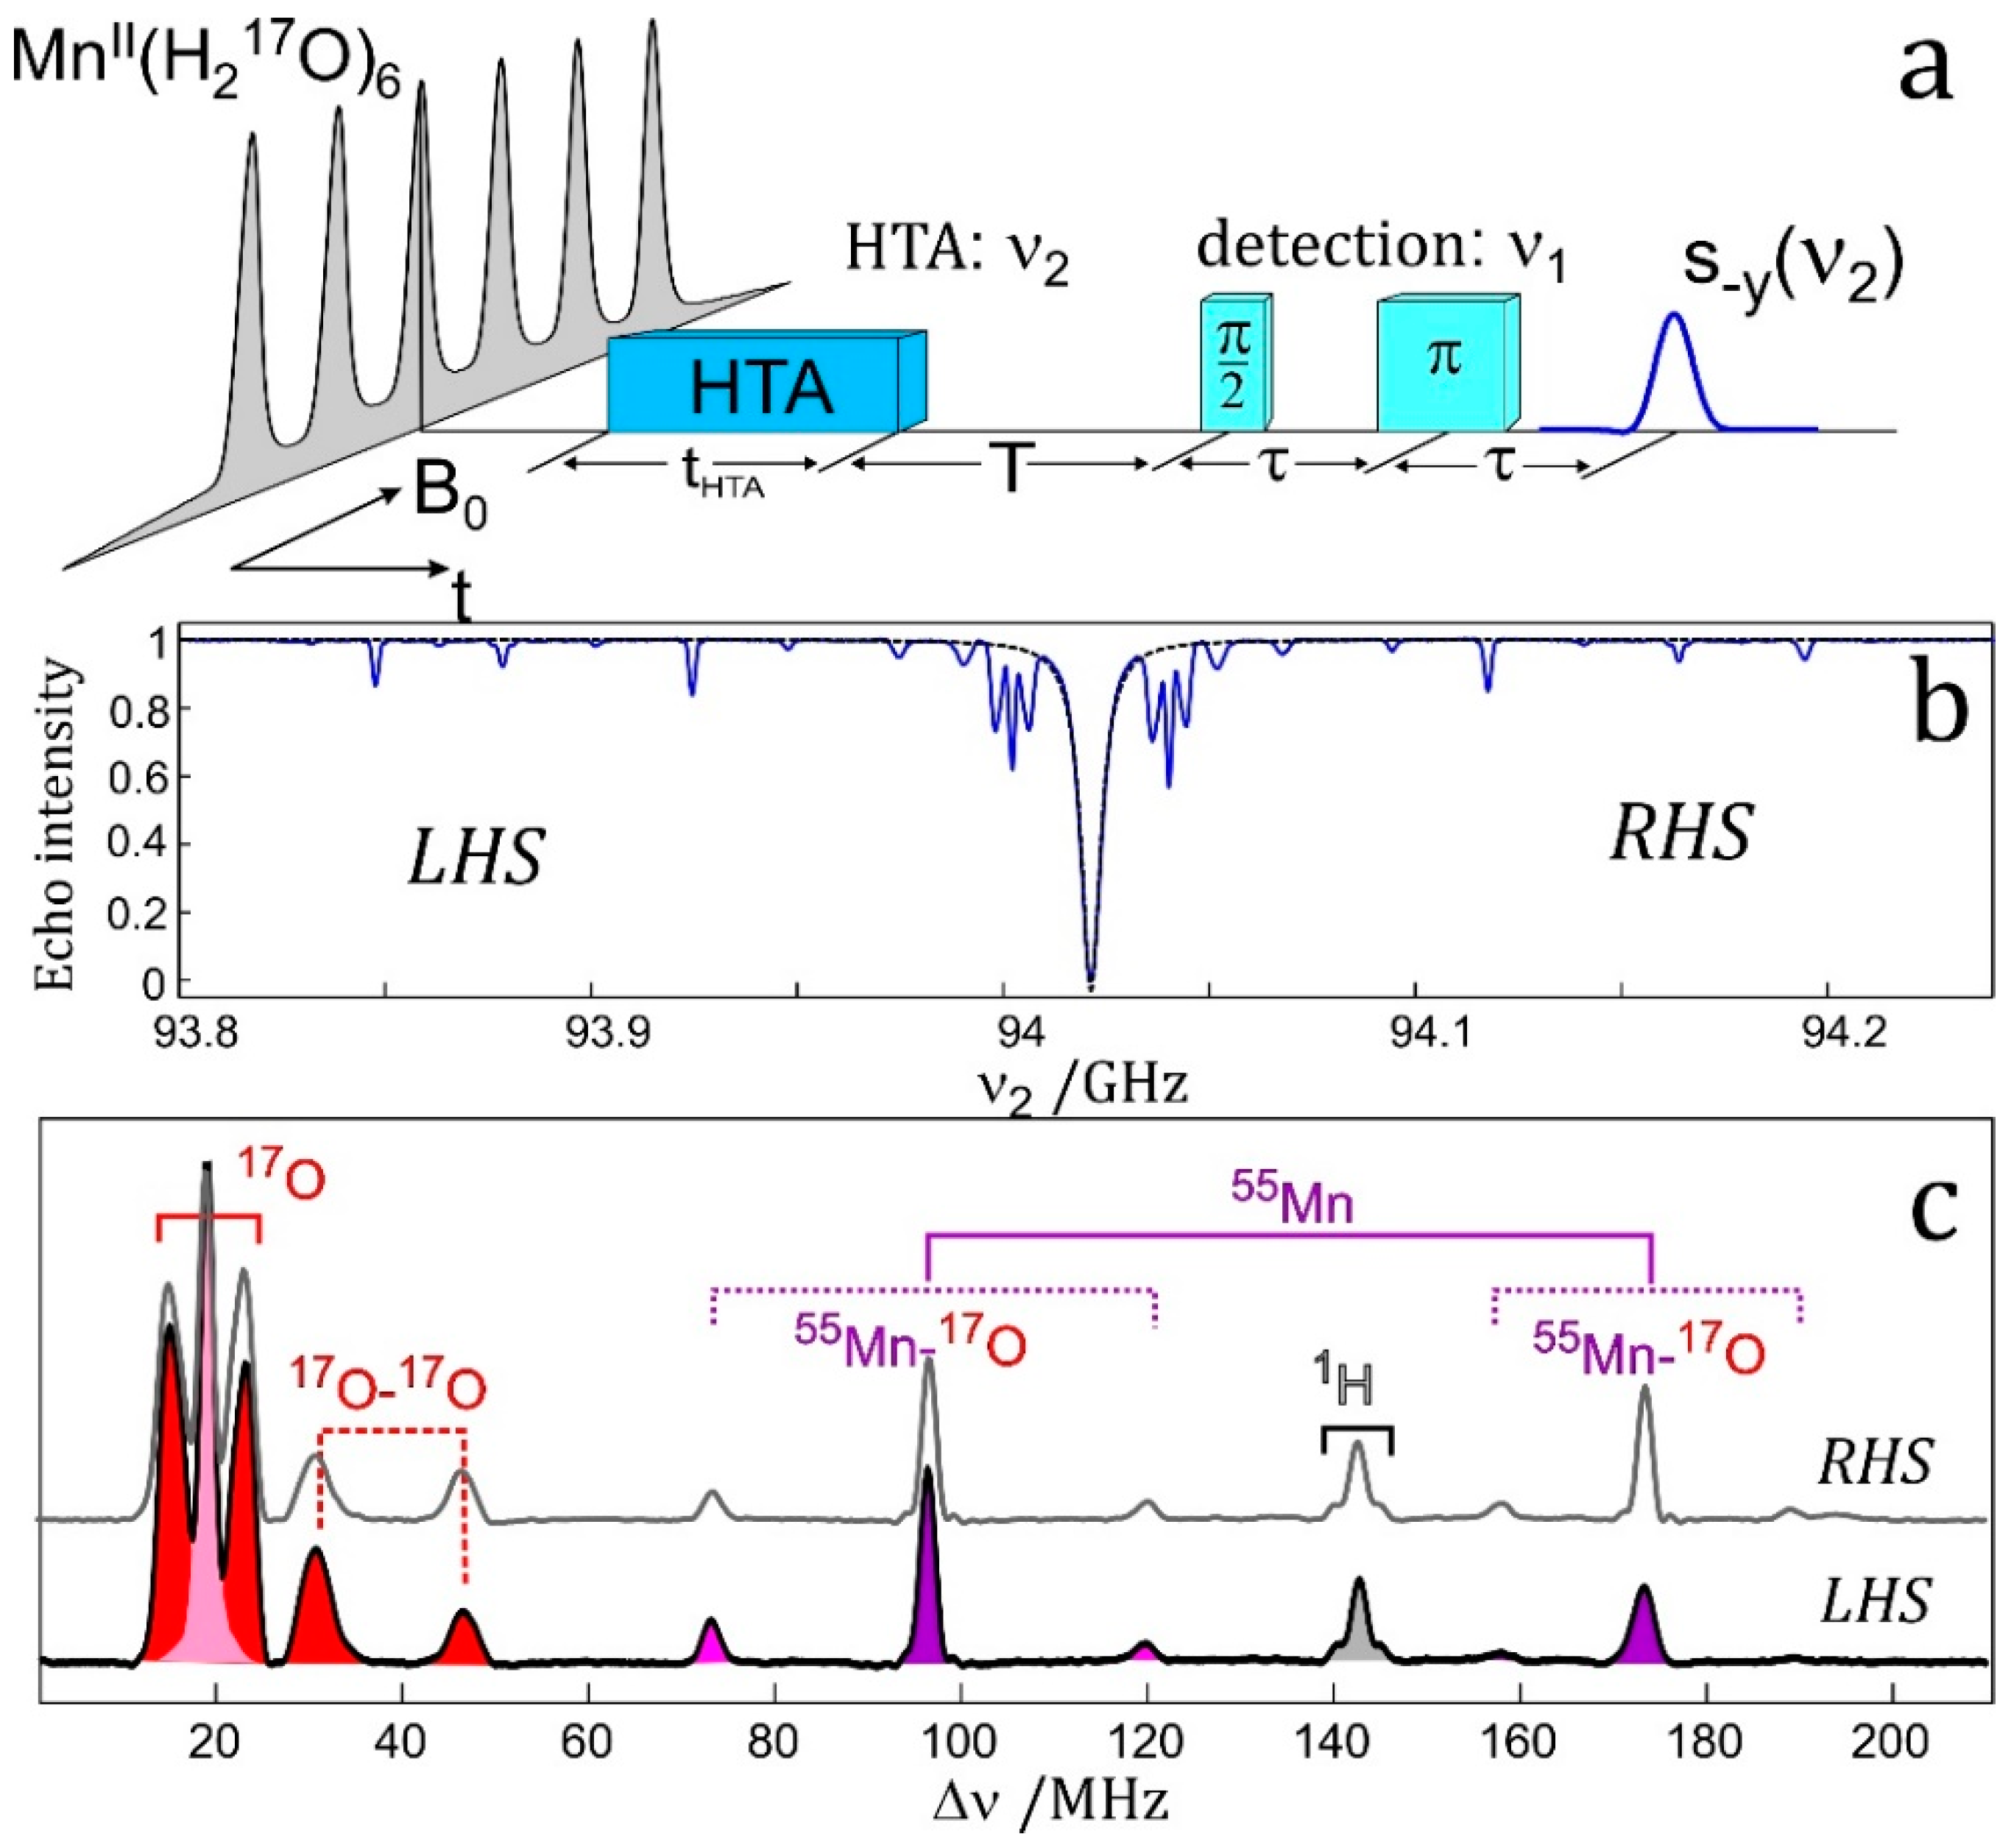
Figure 12.
Q-band EDNMR spectra (Δν > 0) of the solvated transition metal MnII ion with three different isotope enrichments: natural abundance water (top); 17O enriched (90%) water (middle); 2H enriched (99%) water (bottom). The spectra are recorded with the HTA pulse optimized for the detection of double-quantum transitions (ω1 = 3.6·107 rad/s, tHTA = 2 µs). The EDNMR spectra were recorded at the 3rd hyperfine peak of the EPR spectrum. All single-quantum (SQ) and multinuclear double- (DNQ) and triple-quantum (TNQ) transitions are assigned.
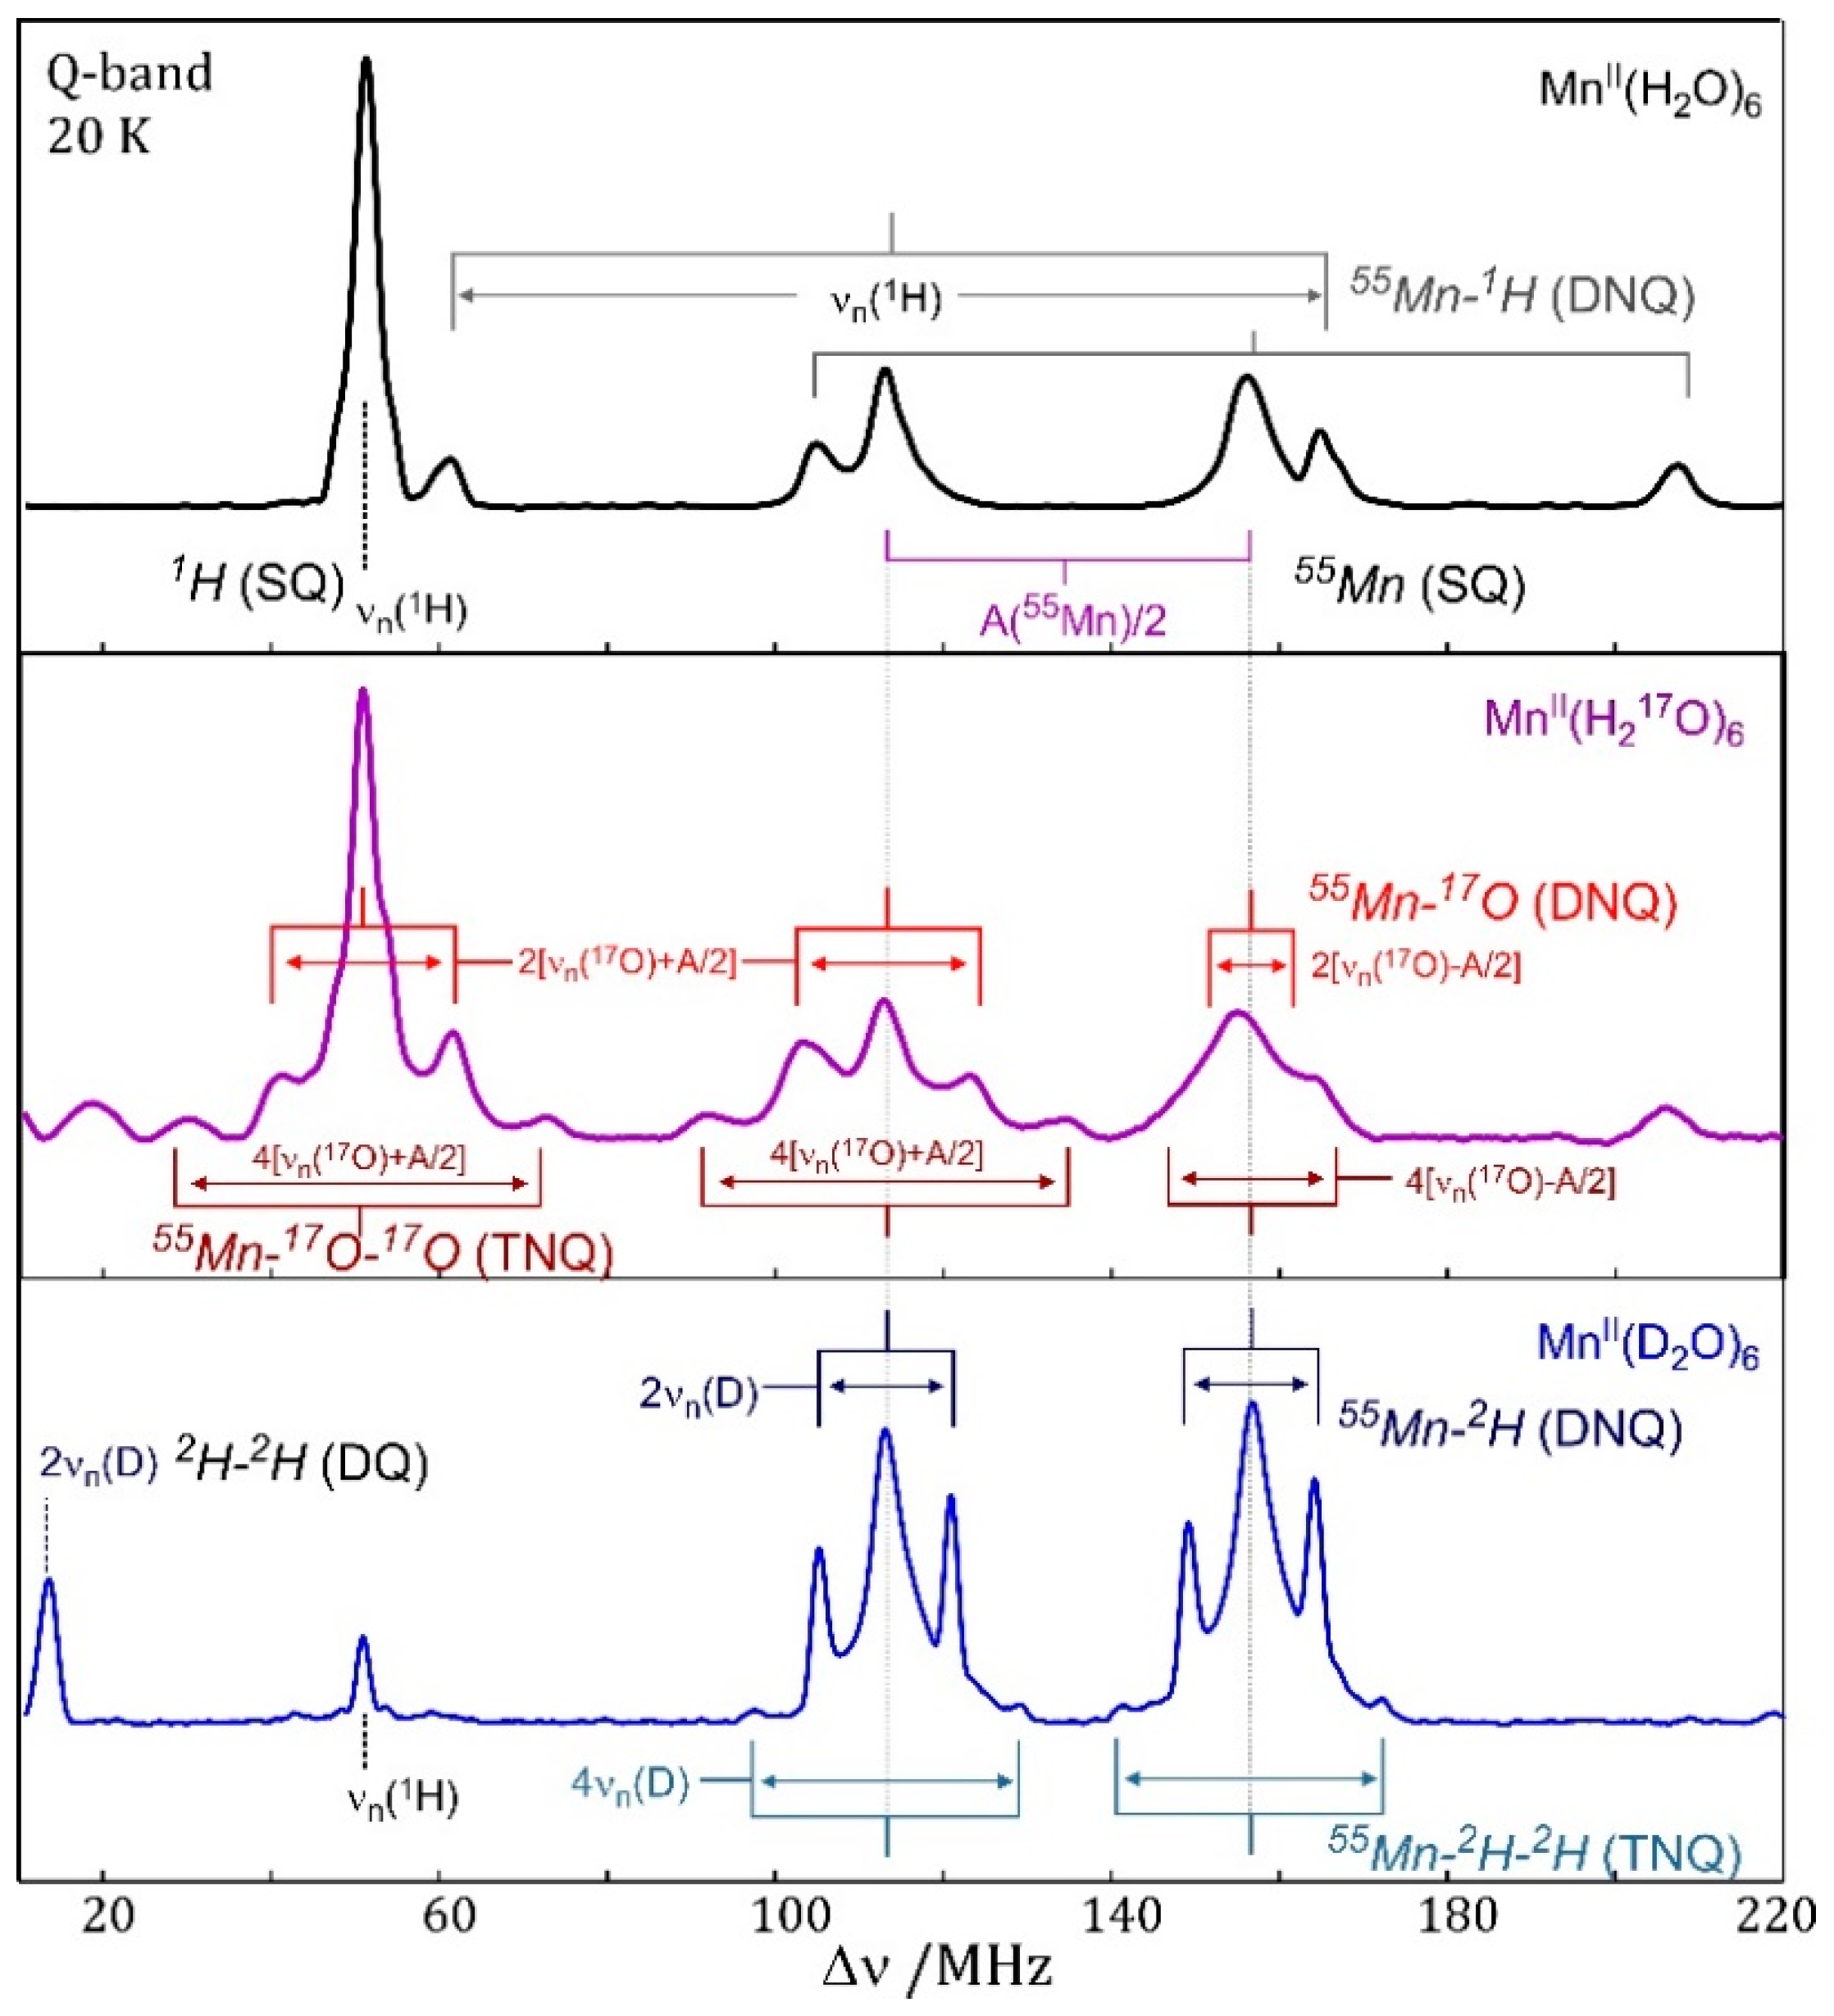
Figure 13.
(a) View of Photosystem II (PS II) embedded in the thylakoid membrane of cyanobacteria, Thermosynechococcus (T.) vulcanus, showing the protein scaffold (grey) with the central transmembrane protein subunits D1 and D2 carrying the cofactors of the reaction center: chlorophylls (dark green), pheophytins (yellow), plastoquinones (purple), carotenoids (red); two tyrosines, YZ, YD (black) and the oxygen evolving complex (Mn4 cluster) [608]; (b) Schematic representation of PS II with the light-induced electron transfer path (red arrows) starting from the primary donor pigment P680 via Pheo to the first and secondary quinone QA, QB. The storage of the positive charge (hole) at in the M4 cluster of the Oxygen Evolving Complex (OEC) using a tyrosine (YZ) as interface is also shown. Kinetic data for the various steps in the RC are given. The protein has channels for entry of water and release of oxygen and protons. The figure shows only the protein subunits required for cofactor binding and stabilization.
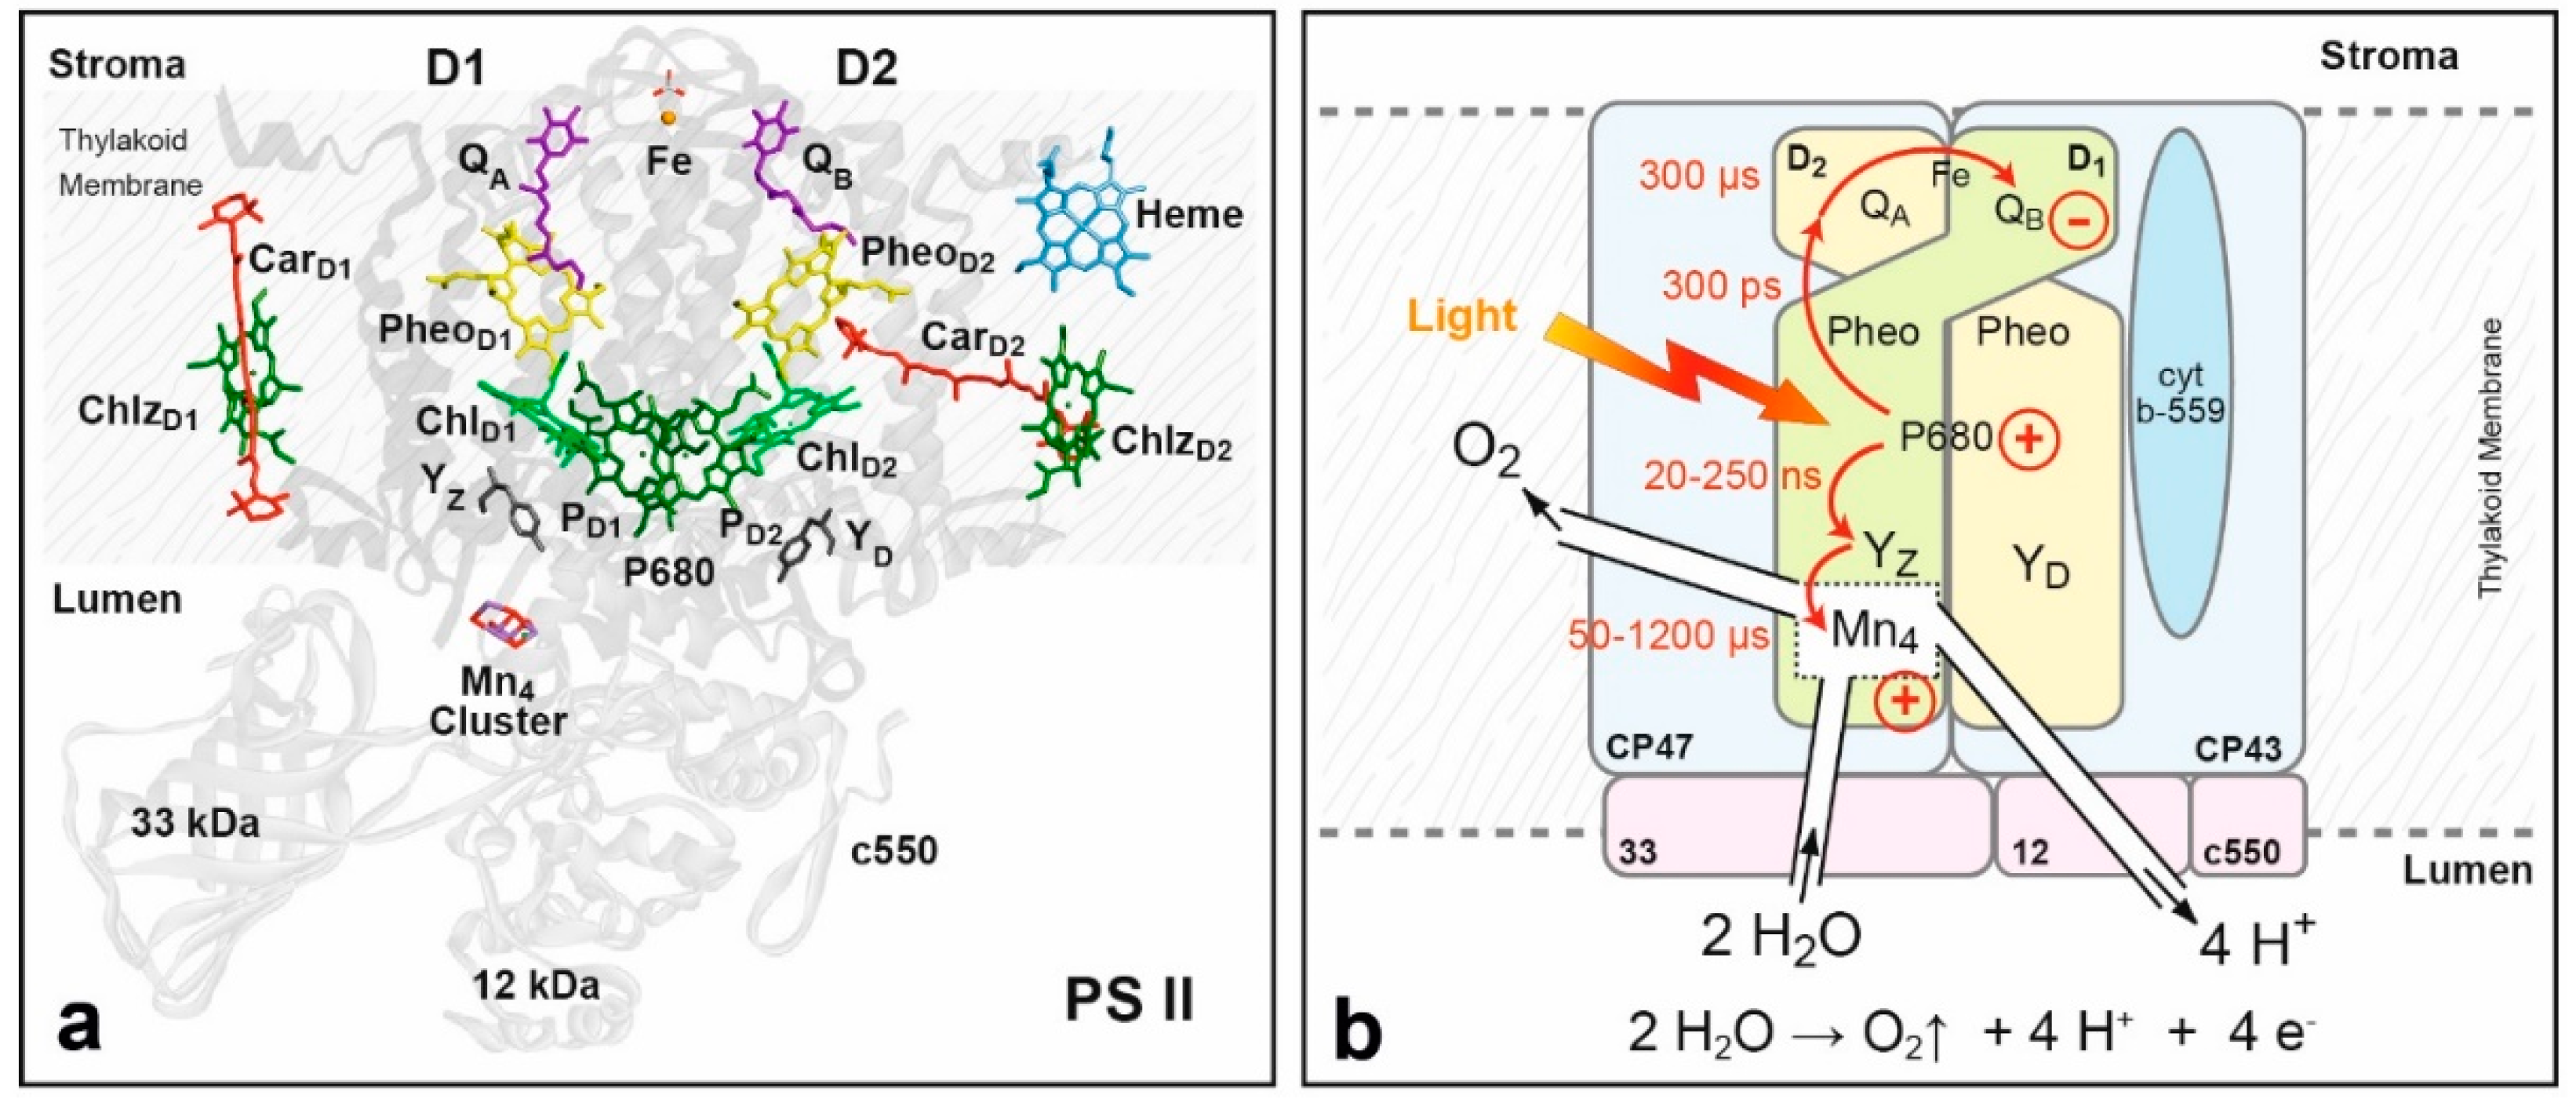
Figure 14.
(a) Structure of the Mn4O5Ca cluster with amino acid ligands according to the 1.9 Å X-ray crystallographic structure of Umena et al. [608] (Protein Data Bank (PDB) entry 3ARC). Note that 2 water molecules are bound to the Ca (W3, W4) and 2 waters to the dangling MnA (W1, W2); (b) S-state cycle originally proposed by B. Kok [615] showing the five S states of the oxygen evolving complex (OEC) S0 to S4. The subscripts of the S states give the number of stored oxidizing equivalents in the Mn cluster. Furthermore, the release of electrons and protons [617] and the entry of water molecules [616] are shown and the kinetic rates are given for the light-driven electronic S state advancement [614,618]; note that the last step S3 to S0 (via S4) is rate limiting (1.6 ms). For further details and leading references, see [555,619,620].
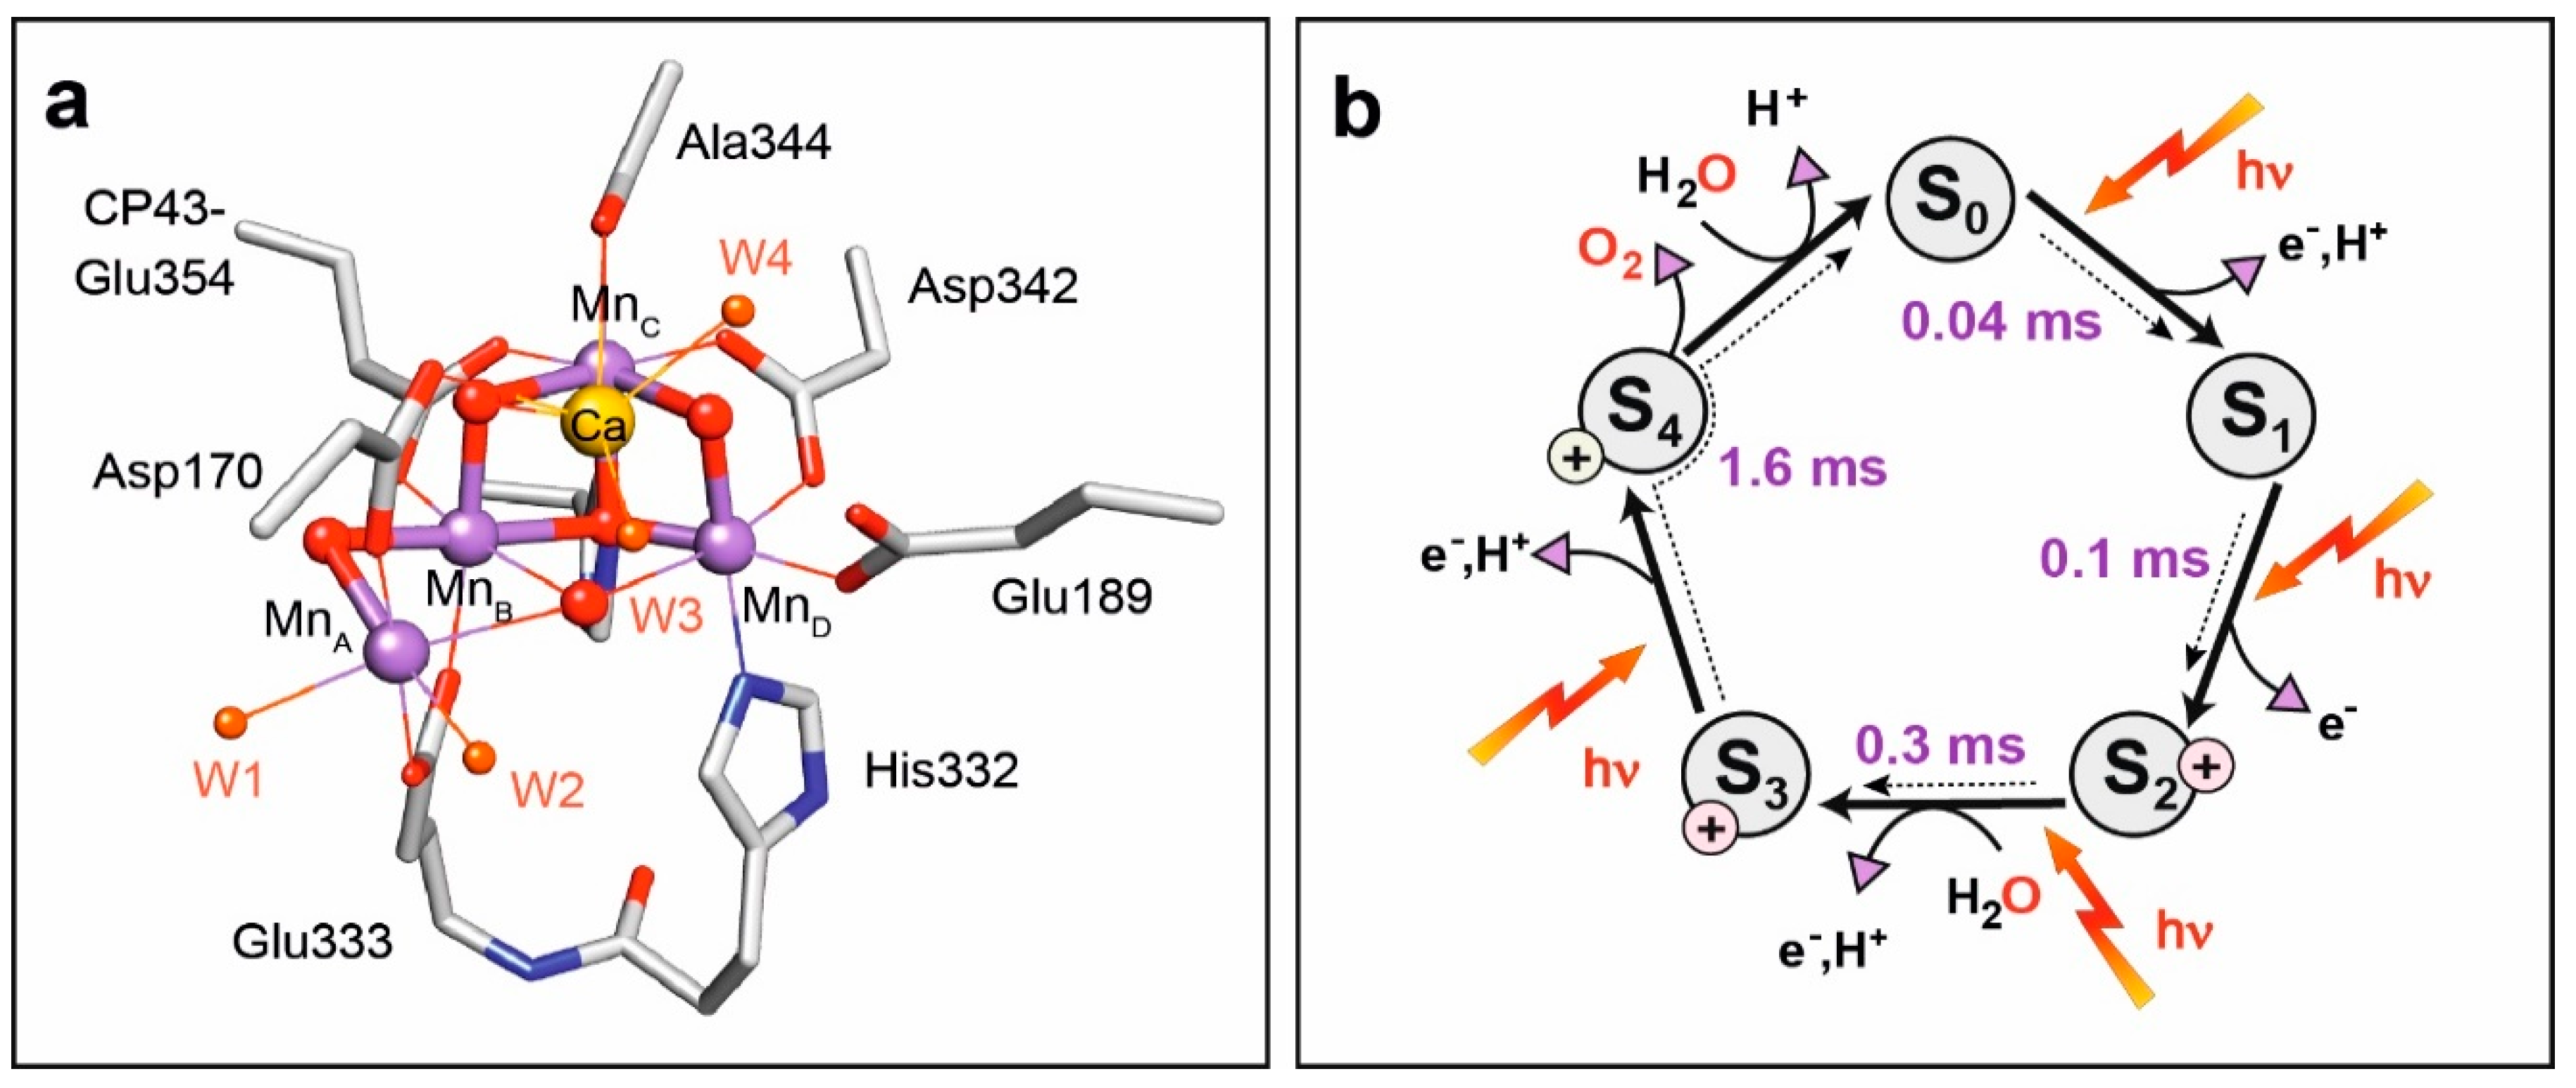
Figure 15.
(c) W band EPR spectrum of the S3 state in PSII of T. elongatus (S3-S1 light-dark difference spectrum). The red dashed line shows a simulation with g and fine structure (ZFS) parameters D and E/D [635]; the shaded curves show the contributions of the allowed EPR transitions to the simulated powder spectrum, the color code is indicated. Due to the low T = 7 K only the lowest 4 transitions contribute; (a) Pulse sequence for EDNMR; (b) W band EDNMR spectrum taken at the indicated field position (arrow) in the EPR, showing two 55Mn hfcs; (d) Structure of the Mn4OxCa cluster how it proceeds from S2 → S3 → S4 including the water binding step and proton release. This new water along with an oxygen (O5) bridge likely represent the two substrates (in green) in the S4 state leading to O2 release.
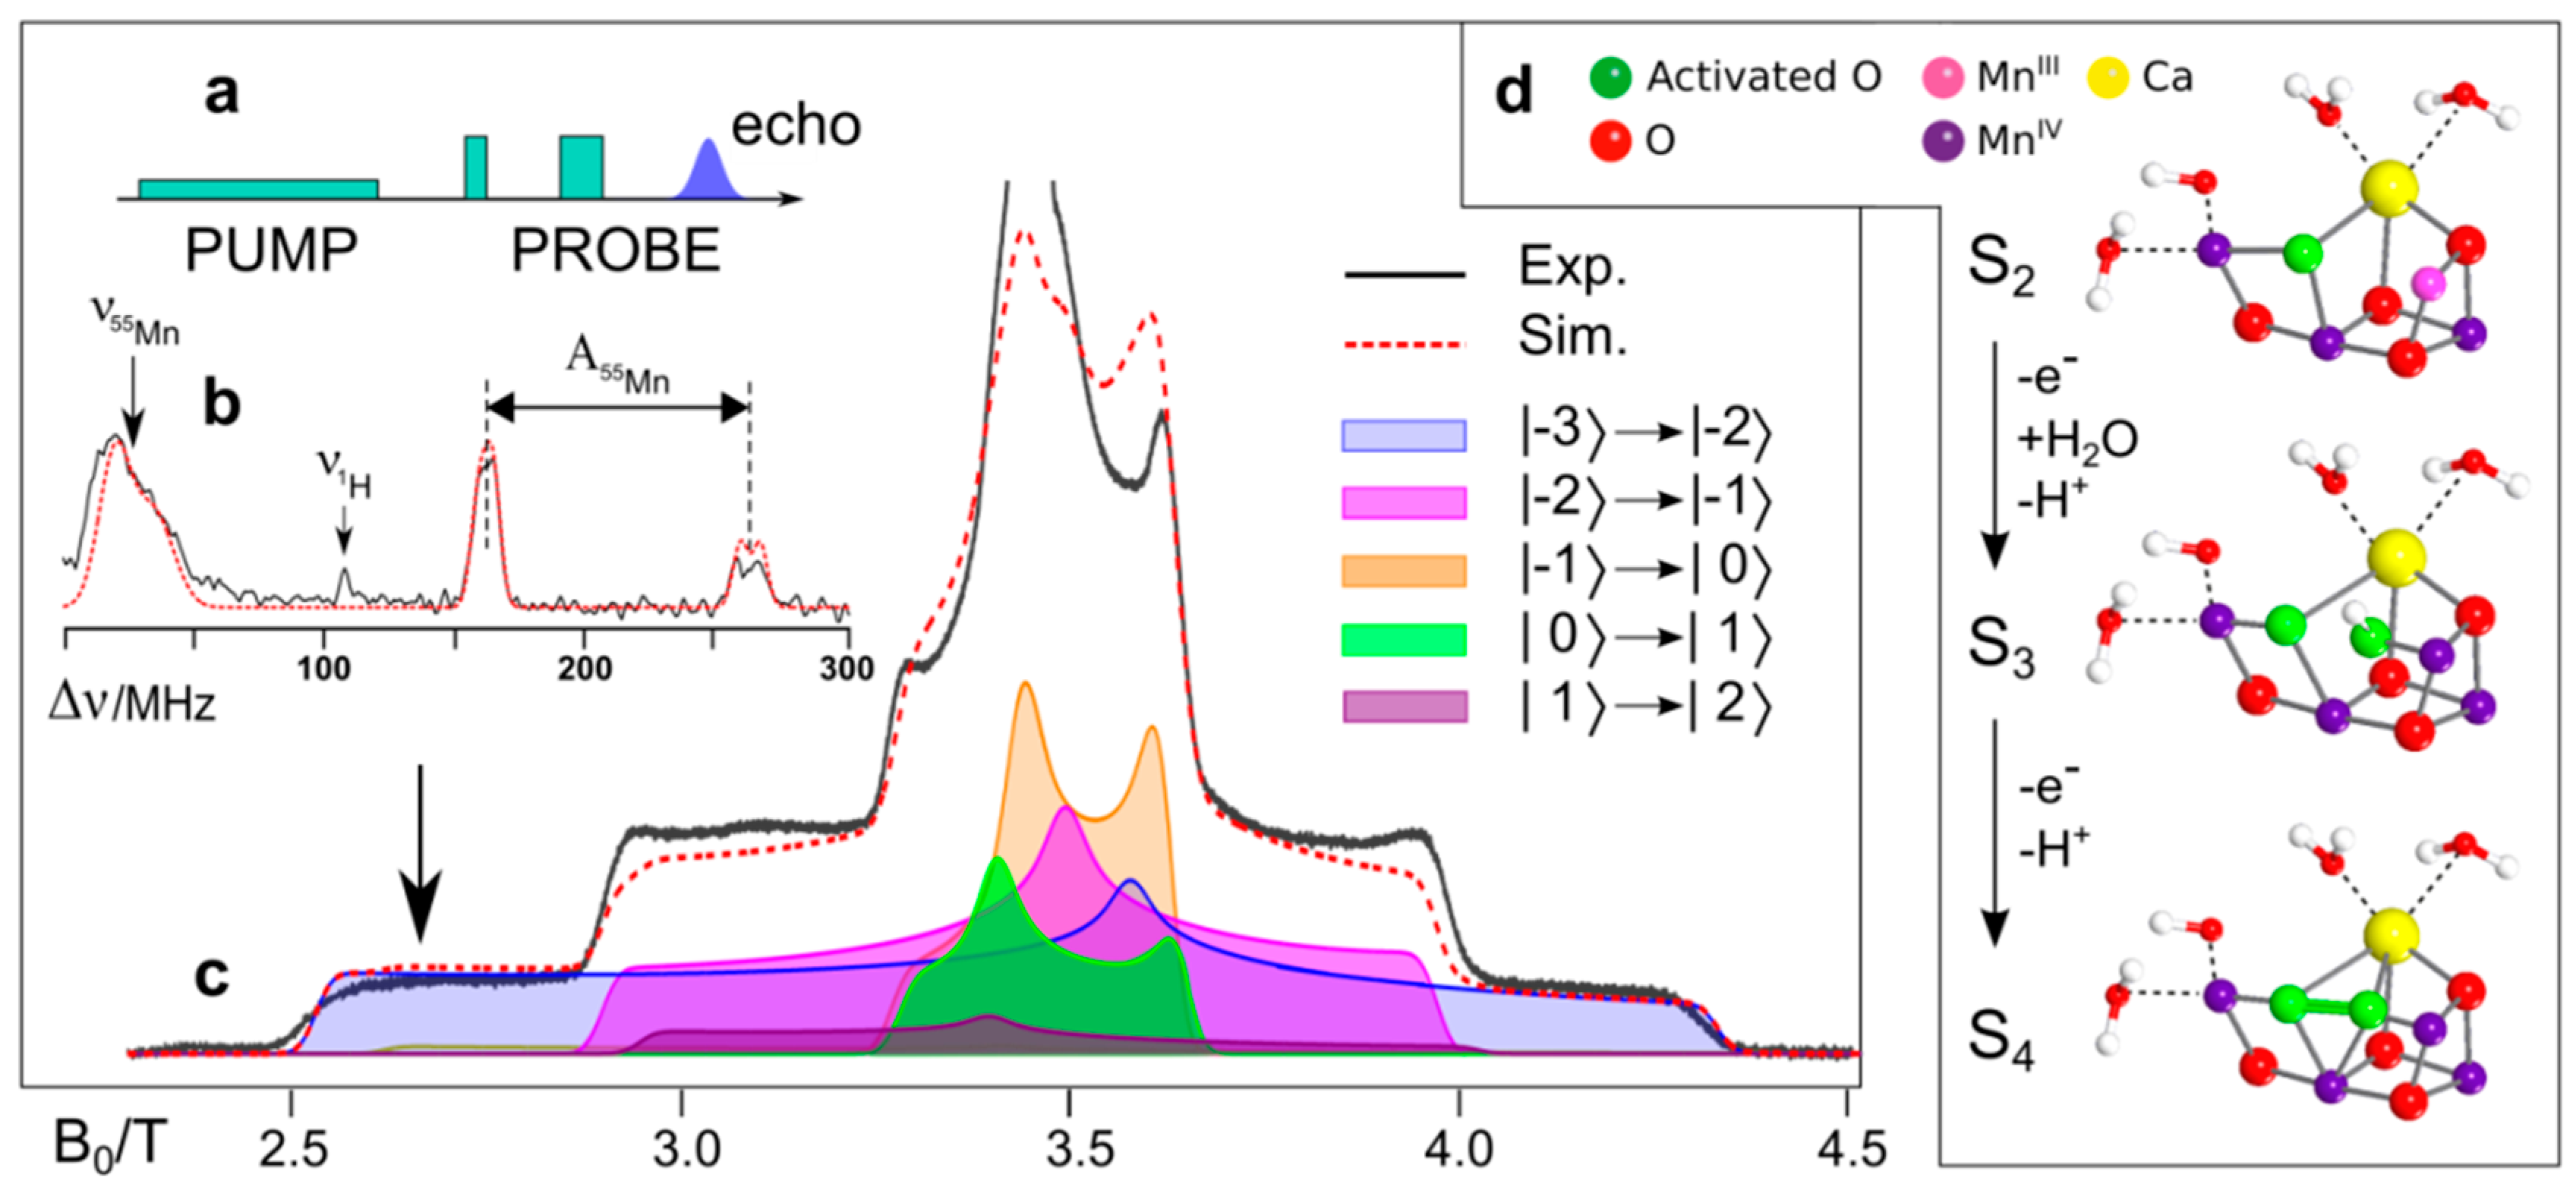
Figure 16.
(a) High-field ELDOR-detected NMR spectrum at W-band (94 GHz) obtained at center field in the W-band EPR spectrum of the S2 state of the OEC (core complexes, T. elongatus), in which the water has been exchanged three times with H217O (90% 17O enrichment). 14N and 17O resonances are detected. The 14N lines stem from the histidine nitrogen bound to MnD. Three types of 17O hyperfine couplings were analyzed (shown in green, orange and purple) from the single-quantum transitions. Double-quantum (DQ) transitions were also observed (not shown) and used to corroborate the analysis. The assignments to the exchangeable oxygen species bound to the Mn4O5Ca cluster are shown in panel (b). For further details, see [273].

Figure 17.
Two dimensional magnetic topology of the OEC in PS II based on spectroscopic [635] and theoretical work [237,620,633,643] detailing the structure of the Mn cluster in the later stages of the cycle, the water binding event in S2 → S3, and the O-O bond formation in S4 [273,619,636,644]. The substrate oxygens leading to O2 formation are colored green in the cycle. The determined oxidation states of the Mn ions in the respective S states are also given. In S3 → S4 a ligand centered oxidation is proposed yielding an oxygen radical. Note that in S2 and possibly also in S3 two states exist (open and closed cubane structures). In the S2 state a switch of the preferred total spin state of the cluster occurs from low to high spin [237,640].
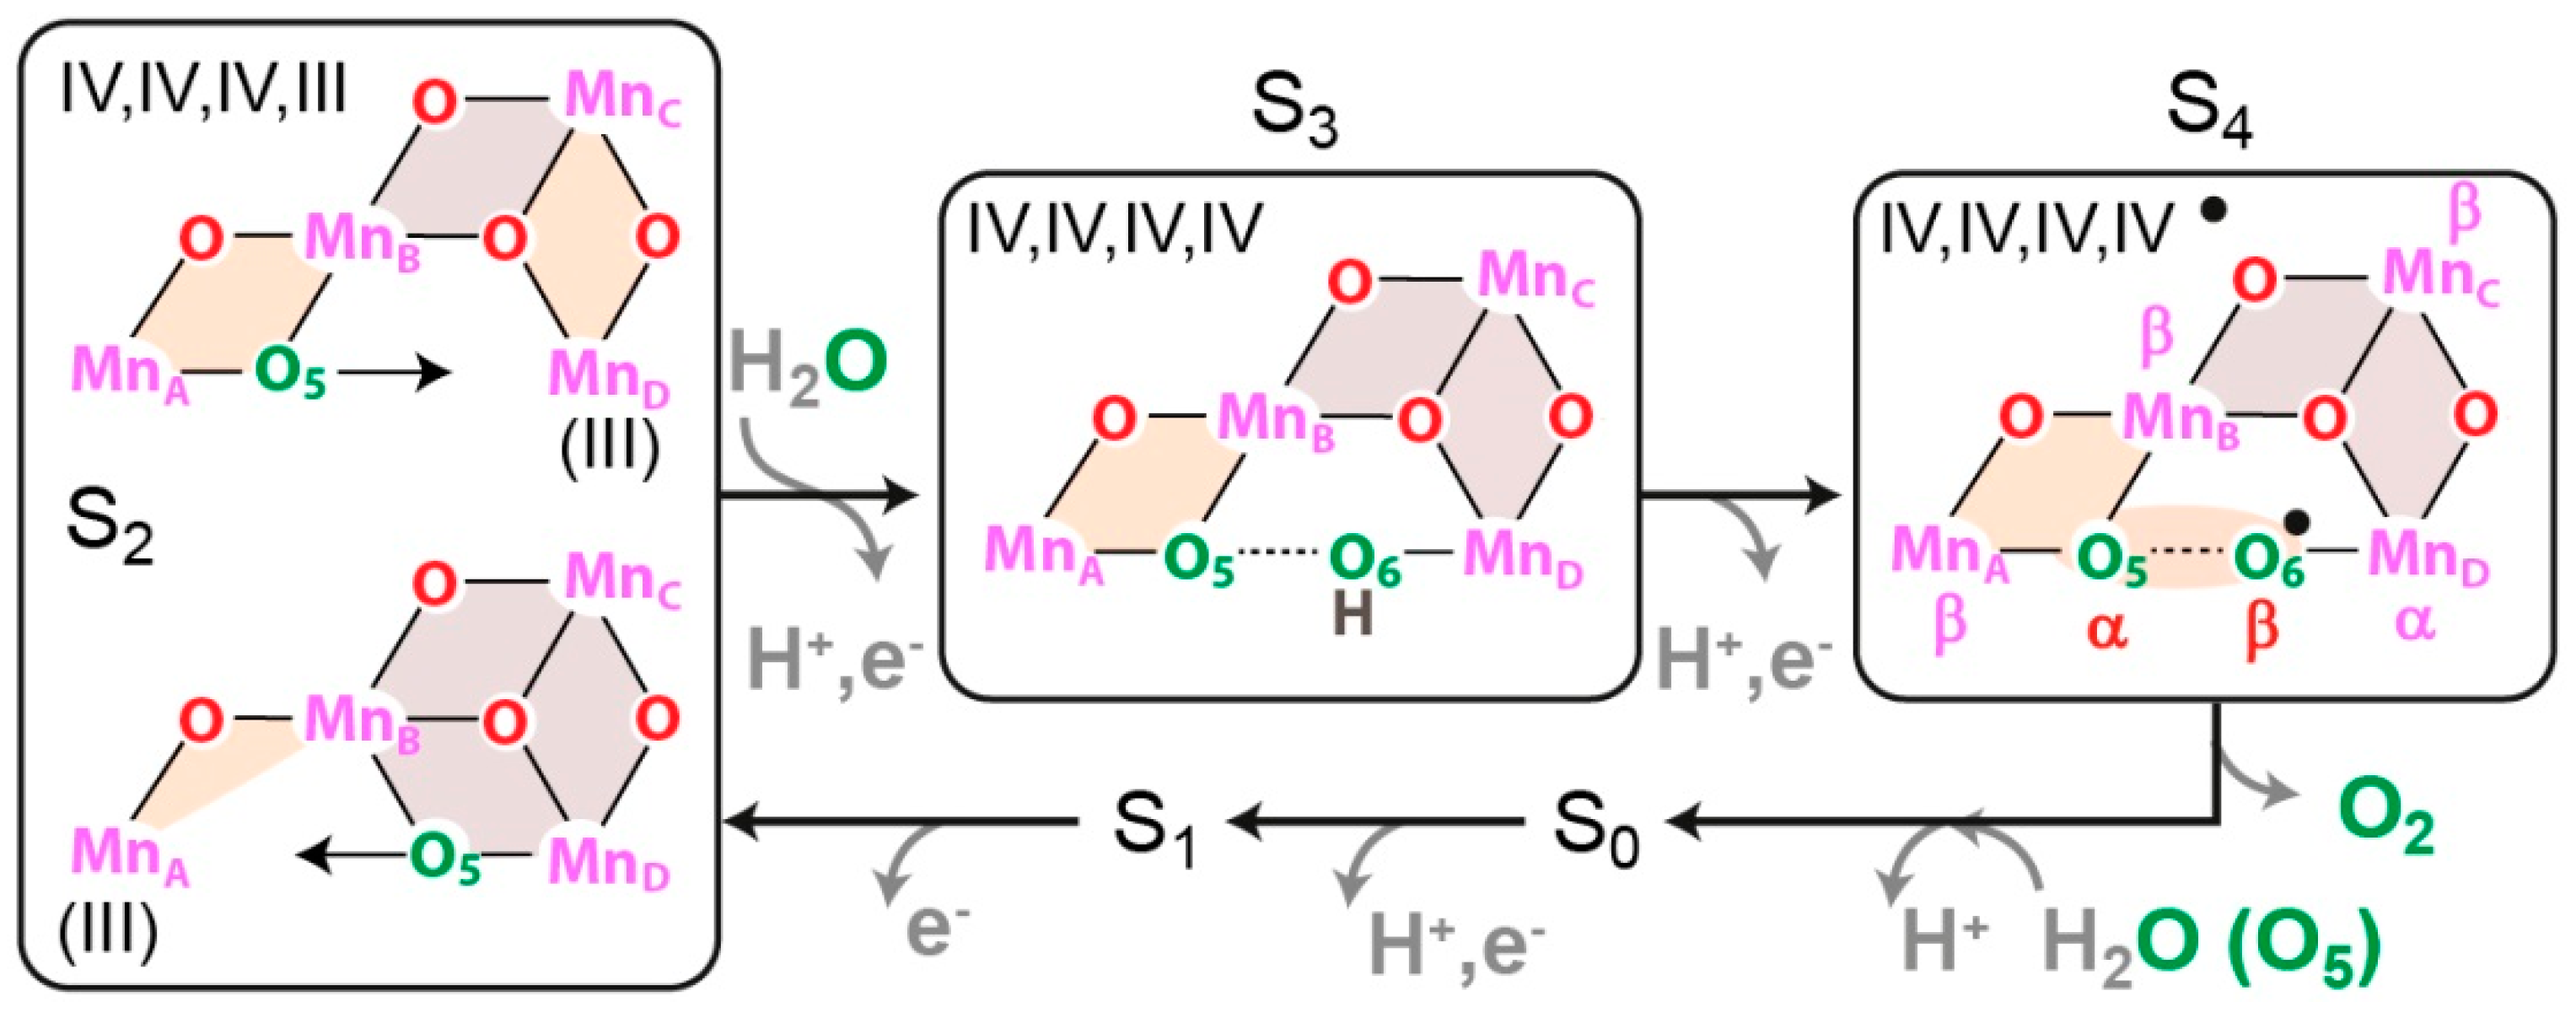

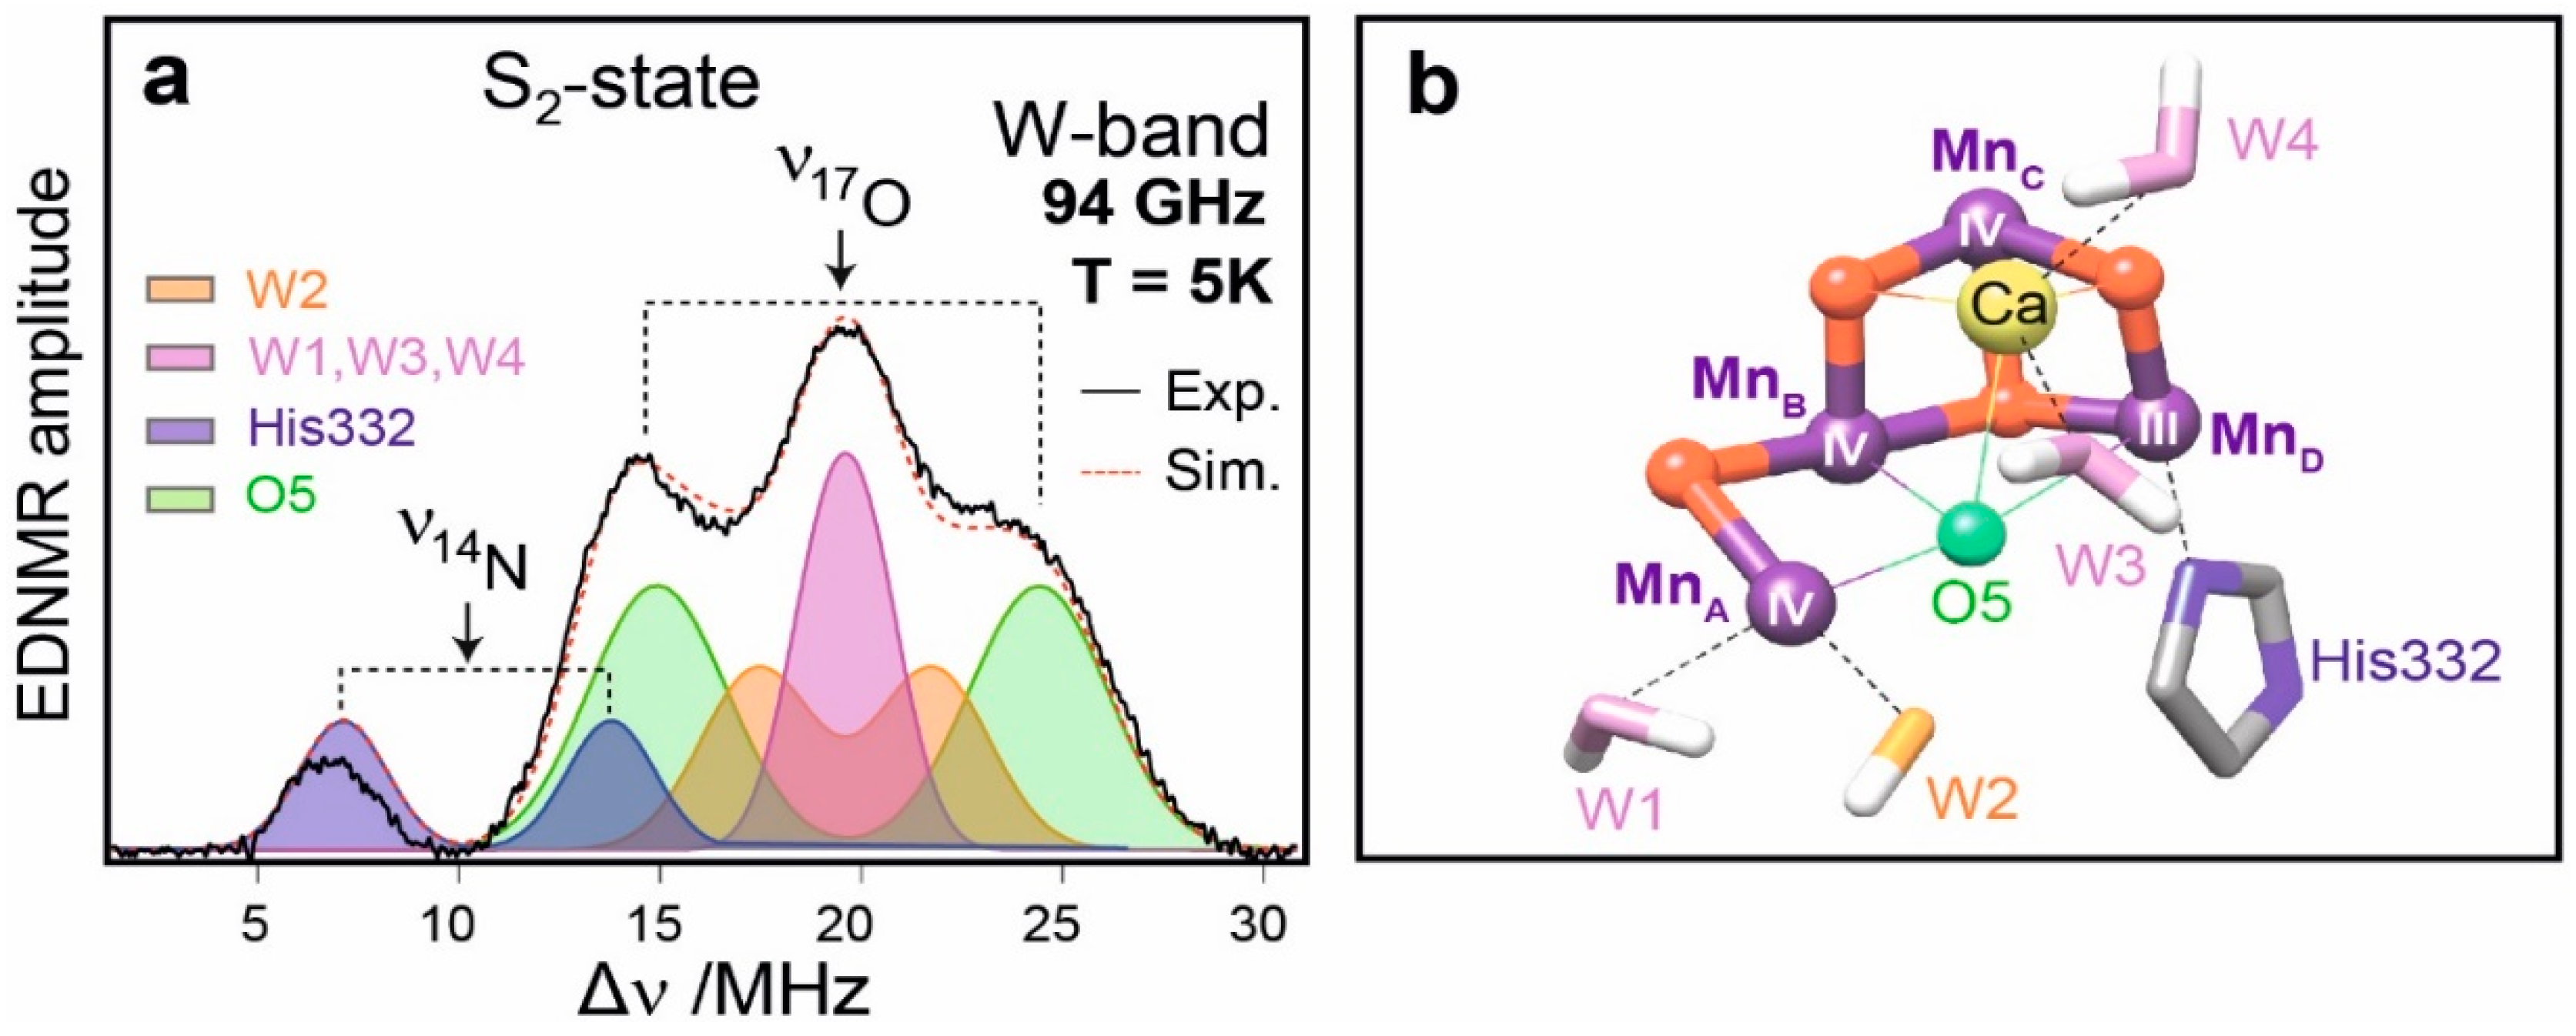
Table 1.
Characteristic performance parameters of EPR versus NMR spectroscopy.
| Resonance frequency | 103 larger in EPR (GHz versus MHz) |
| Spin interactions | 106 stronger in EPR (MHz versus Hz) |
| Relaxation times | 106 shorter in EPR (ns versus ms) |
| Time resolution | 106 shorter in EPR (ns versus ms) |
| Detection sensitivity | 106 higher in EPR (nM versus mM) |
Table 2.
Accessible distance ranges from dipolar spin interactions measured by various EPR methods (see [1] for details).
Table 2.
Accessible distance ranges from dipolar spin interactions measured by various EPR methods (see [1] for details).
| Radical Type | Method | Anisotropic Spin Interaction | Distance Range |
|---|---|---|---|
| Monoradical | EPR | electron–nuclear | 1 Å ≤ r ≤ 3 Å |
| Monoradical | ENDOR | electron–nuclear | 1 Å ≤ r ≤ 10 Å |
| Radical pair | EPR/ESE | electron–electron | 5 Å ≤ r ≤ 30 Å |
| Radical pair | PELDOR | electron–electron | 15 Å ≤ r < 100 Å |
Table 3.
Summary of laboratory-built high-field/high-frequency EPR spectrometers as to 2009 [17] and extended to 2018.
Table 3.
Summary of laboratory-built high-field/high-frequency EPR spectrometers as to 2009 [17] and extended to 2018.
| Frequency GHz | EPR Mode | Detection Scheme | MW Bridge Scheme | Transmiss. Line | Resonator | MW Source | Year | Ref. |
|---|---|---|---|---|---|---|---|---|
| 150 | cw, pulse | HO | WG | OWR | TE011, FP | K, SS, BWO, IMPATT | 1977 | [41,42,43,73,74] |
| 95 | cw, pulse | HE | WG | OWR | TE011, FP | K, SS | 1985 | [44,45,48,49] |
| 95 | cw, pulse | HE | WG | OWR, OWC | FP | IMPATT | 1989 | [46,50,75] |
| 95 | cw, pulse | HE | WG | OWR | TE011 | G | 1992 | [76] |
| 95 | cw | HO | WG | OWR, DWG | TE013 | G | 1994 | [77,78] |
| 95, 140 | cw, pulse | HE | WG | OWR | TE011 | SS | 1999 | [79] |
| 95 | cw, pulse | HE | OQ | CWG | FP | SS, EIKA | 2004 | [80] |
| 95 | cw, pulse | HE | WG | OWR | TE011 | SS | 2006 | [81] |
| 95 | cw | HE | WG | OWR | TE011, LGR | G | 2007 | [82] |
| 30–120 | cw | HO | WG | WR | TE011 | MVNA | 1999 | [83] |
| 130 | cw | HO | WG | OWR | TE011 | G | 1998 | [84] |
| 130 | cw | HE | WG | OWR | TE011 | G | 2002 | [85] |
| 130 | cw | HE | WG | OWR | TE011 | G | 2005 | [86,87] |
| 95–475 | cw | HE | QO | CWG | FP | G | 1998 | [84] |
| 90, 180 | cw | HE | OQ | CWG | FP | G | 1998 | [54] |
| 140 | cw, pulse | HE | WG | OWR | FP | G, EIK | 1992 | [51,88] |
| 140 | cw, pulse | HE | WG | OWR | TE011, FP | G, GTR | 1995 | [89] |
| 180 | cw, pulse | HE | QO | CWG | TE011 | G | 2001 | [90] |
| 220 | cw | HO | QO | LS | FP | G | 1999 | [91] |
| 120, 240 | cw, pulse | HE | QO | CWG | TE011 | G | 2007 | [58] |
| 120, 240 | cw | HE | QO | CWG | FP, NRS | G | 2005 | [92] |
| 275 | cw, pulse | HE | QO | CWG | TE011 | G | 2003 | [93,94] |
| 285 | cw | HO | WG | OWC | NRS | G, SS | 1999 | [95,96] |
| 360 | cw, pulse | HE | QO | CWG | FP | G, O | 1999 | [56,63] |
| 160–525 | cw | HO | QO | CWG | NRS | FIR | 1989 | [57] |
| 240, 316 | cw | HO | QO | OWC | WGD | FIR | 2000 | [97] |
| 95–3000 | cw | HO | QO | OWC, | NRS, FP | G, FIR | 1999 | [98,99,100] |
| 604 | pulse | HE | QO | OWC, DWG | FP | FIR | 1999 | [101] |
| 170, 250 | cw | HO | QO | LS, CWG | FP | G | 1988 | [55,102,103] |
| 250–7000 | cw | HO | QO | OWC | NRS | G, BWO, FIR | 2003 | [104] |
| 38–889 | cw | HO | QO | OWC | NRS | G, GTR | 1998 | [105,106,107] |
| 110, 220, 330 | pulse | HE | QO | CWG | FP | SS | 2008 | [108] |
| 130 | cw | HO | WG | OWR | FP | G | 2018 | [109] |
| 120, 240 | cw, pulse | HE | QO | CWG | NRS | SS | 2014 | [110,111] |
| 240 | cw, pulse | HE | QO | CWG | NRS | FEL, SS | 2008 | [112,113] |
| 82.5–1100 | cw | HO | QO | CWG | NRS | SS | 2018 | [114] |
| 210, 315, 420 | cw | HO | QO | CWG | NRS | SS | 2018 | [115] |
| 150–1200 | cw | HO | QO | CWG | NRS | SIN | 2009 | [116,117] |
| 300–3000 | cw | HO | QO | CWG | NRS | FEL | 2017 | [118] |
| 300–700 | cw | HO | QO | CWG | NRS | BWO | 2015 | [119] |
| 200 | cw, pulse | HE | QO | CWG | NRS | SS | 2016 | [120] |
Abbreviations used: Abs.—absorption mode, HO—homodyne; HE—heterodyne; WG—waveguide; QO—quasioptical; OWR—oversized rectangular waveguide; OWC—oversized cylindrical waveguide; DWG—dielectrical waveguide; CWG—corrugated waveguide; FP—Fabry–Perot; LGR—loop-gap resonator; WGD—whispering gallery dielectric resonator, NRS—non resonant structure; K—klystron; G—Gunn diode (phase-locked or varactor tuned); GTR—gyrotron; EIK—extended interaction klystron; EIKA—extended interaction klystron amplifier; FIR—far infrared laser; SS—solid-state oscillator (based on low frequency transistor oscillators with active multiplication, typically by IMPATT component); O—orotron; BWO—backward wave oscillator, IMPATT—impatt oscillator; FEL—free-electron laser; SIN—synchrotron, MVNA—vector network analyser. For a detailed discussion of technical aspects, see [17].
© 2018 by the authors. Licensee MDPI, Basel, Switzerland. This article is an open access article distributed under the terms and conditions of the Creative Commons Attribution (CC BY) license (http://creativecommons.org/licenses/by/4.0/).
Share and Cite
MDPI and ACS Style
Möbius, K.; Lubitz, W.; Cox, N.; Savitsky, A. Biomolecular EPR Meets NMR at High Magnetic Fields. Magnetochemistry 2018, 4, 50. https://doi.org/10.3390/magnetochemistry4040050
AMA Style
Möbius K, Lubitz W, Cox N, Savitsky A. Biomolecular EPR Meets NMR at High Magnetic Fields. Magnetochemistry. 2018; 4(4):50. https://doi.org/10.3390/magnetochemistry4040050
Chicago/Turabian StyleMöbius, Klaus, Wolfgang Lubitz, Nicholas Cox, and Anton Savitsky. 2018. "Biomolecular EPR Meets NMR at High Magnetic Fields" Magnetochemistry 4, no. 4: 50. https://doi.org/10.3390/magnetochemistry4040050
Note that from the first issue of 2016, this journal uses article numbers instead of page numbers. See further details here.