Exploring the pH-Induced Functional Phase Space of Human Serum Albumin by EPR Spectroscopy

 ,
,
Abstract
:
1. Introduction
2. Materials and Methods
2.1. Materials
2.2. Protein Stability and Charge Calculation
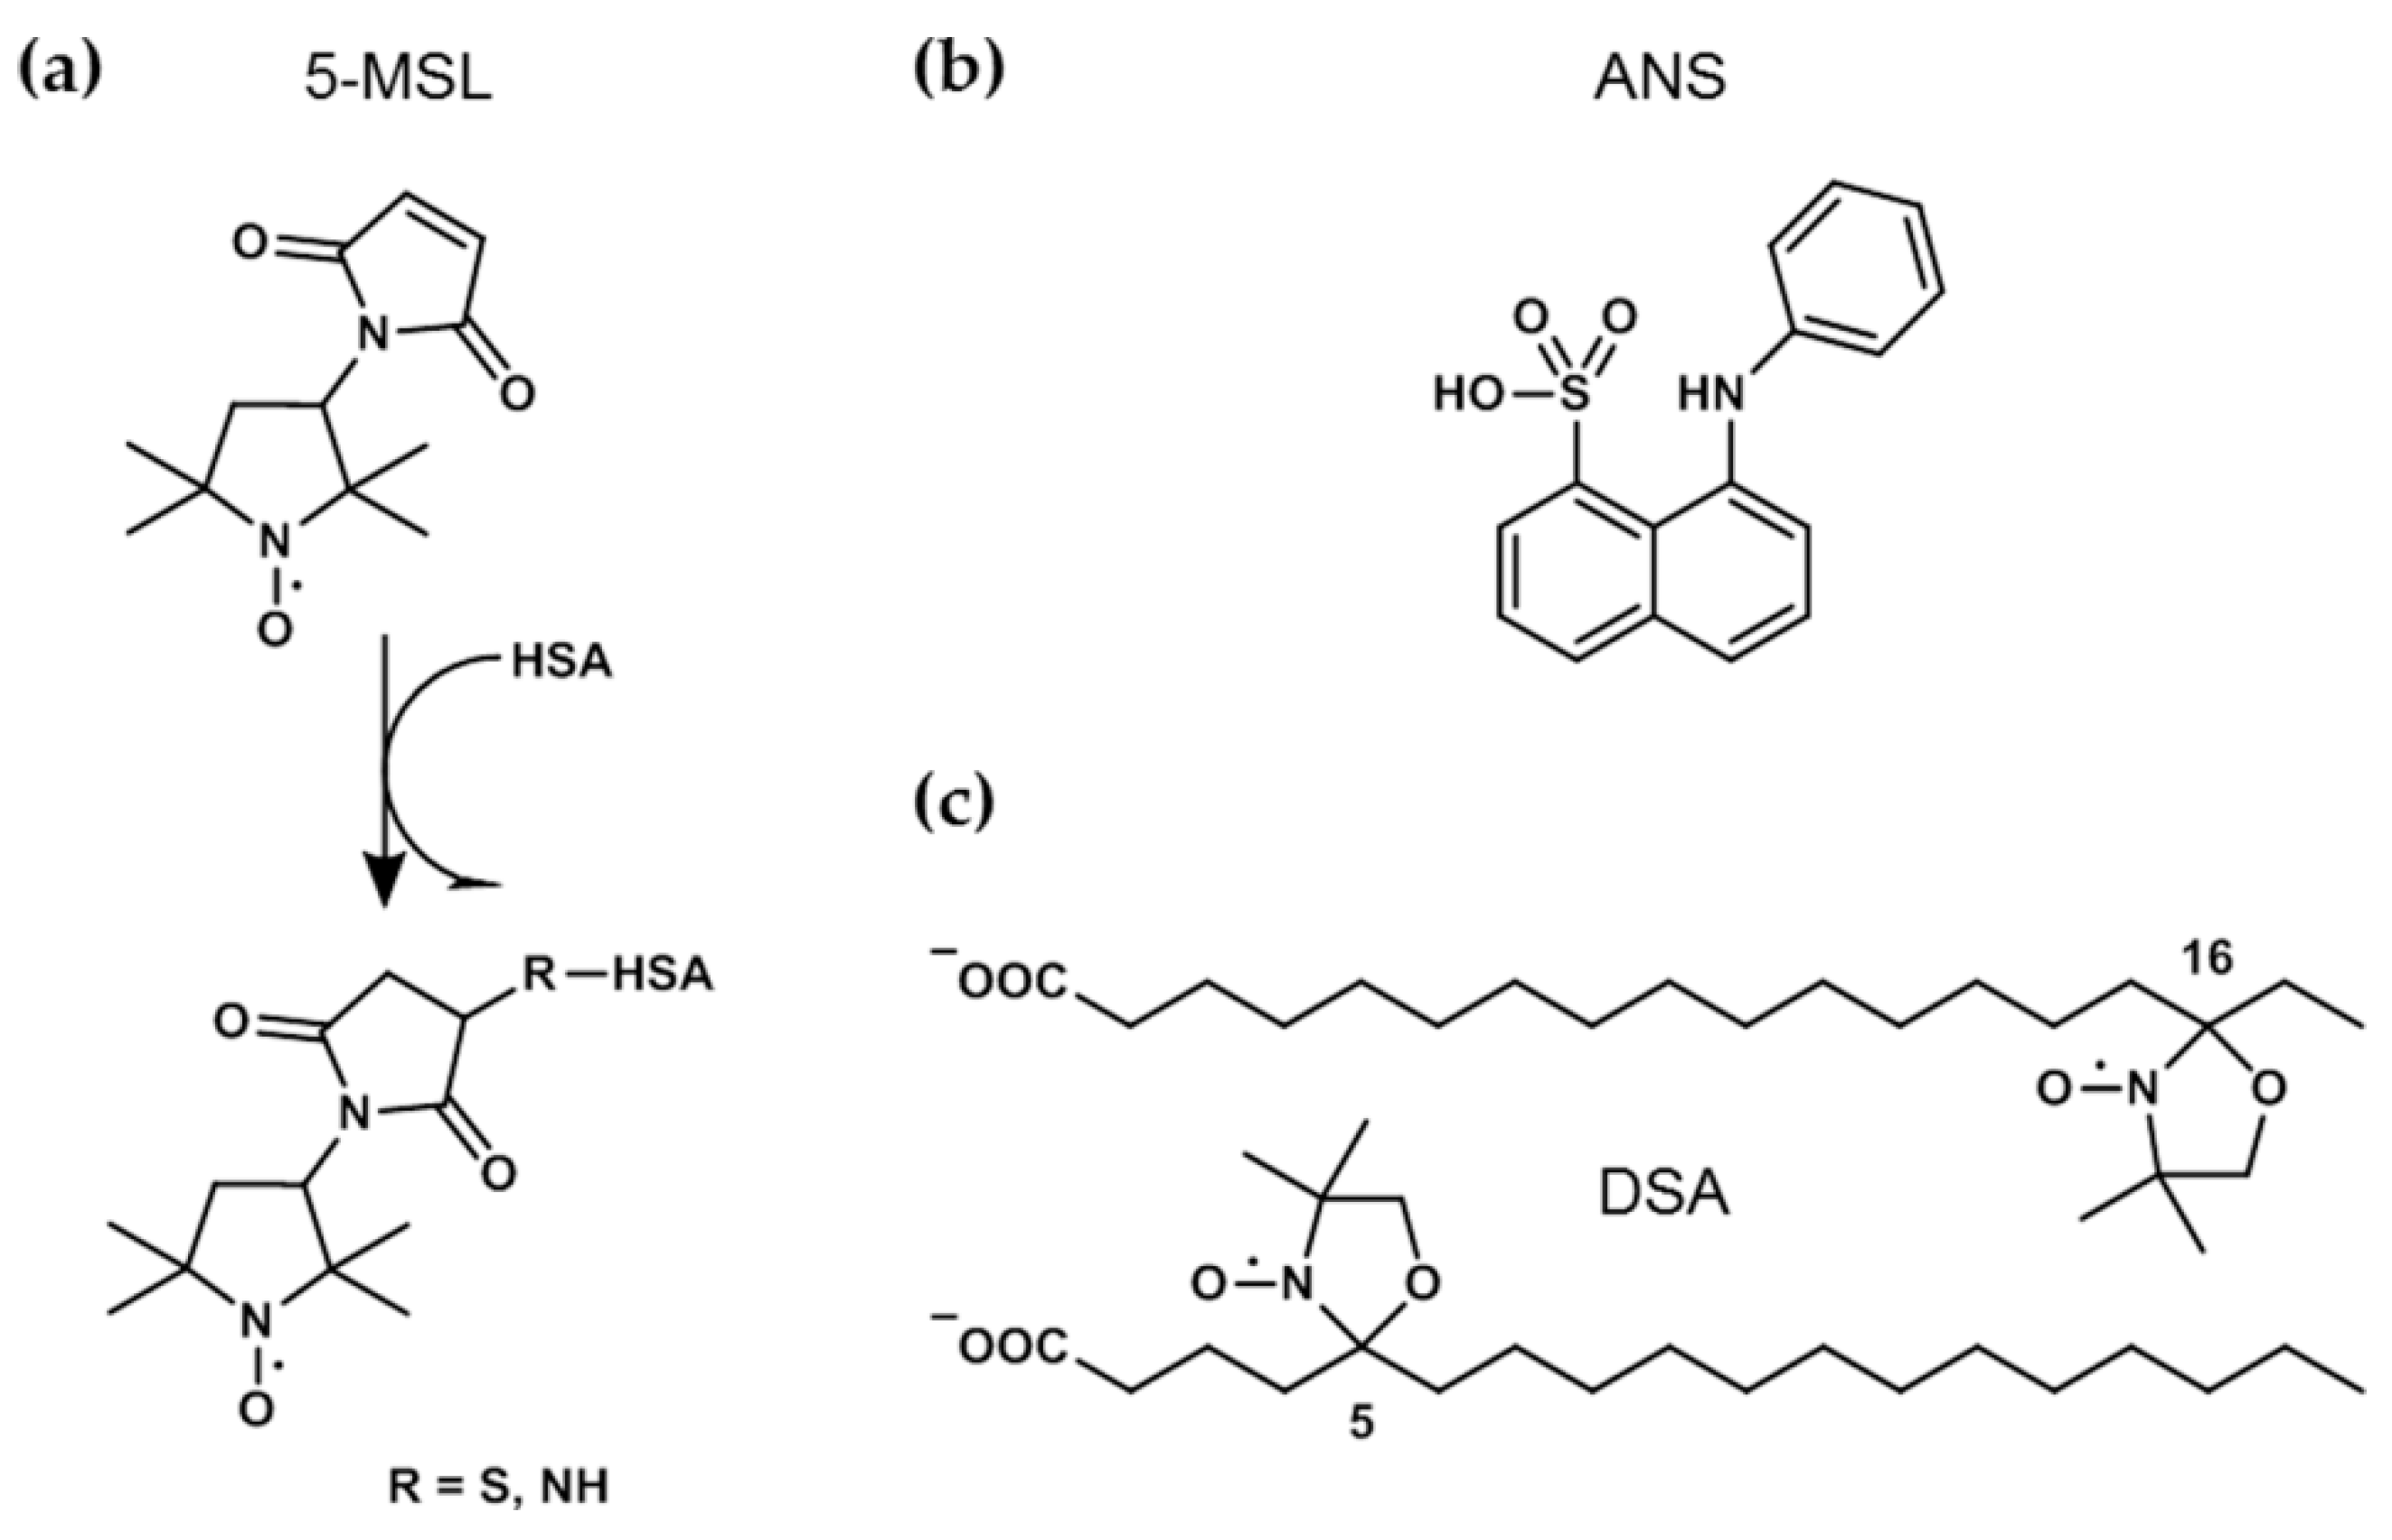
2.3. Spin-Labeling of HSA with 5-MSL
2.4. MALDI-ToF Mass Spectrometry
2.5. Sample Preparation
2.6. ANS Fluorescence Experiments
2.7. Dynamic Light Scattering (DLS)
2.8. EPR Spectroscopy
2.8.1. CW EPR Experiments
2.8.2. DEER Experiments
2.9. Data Analysis
3. Results
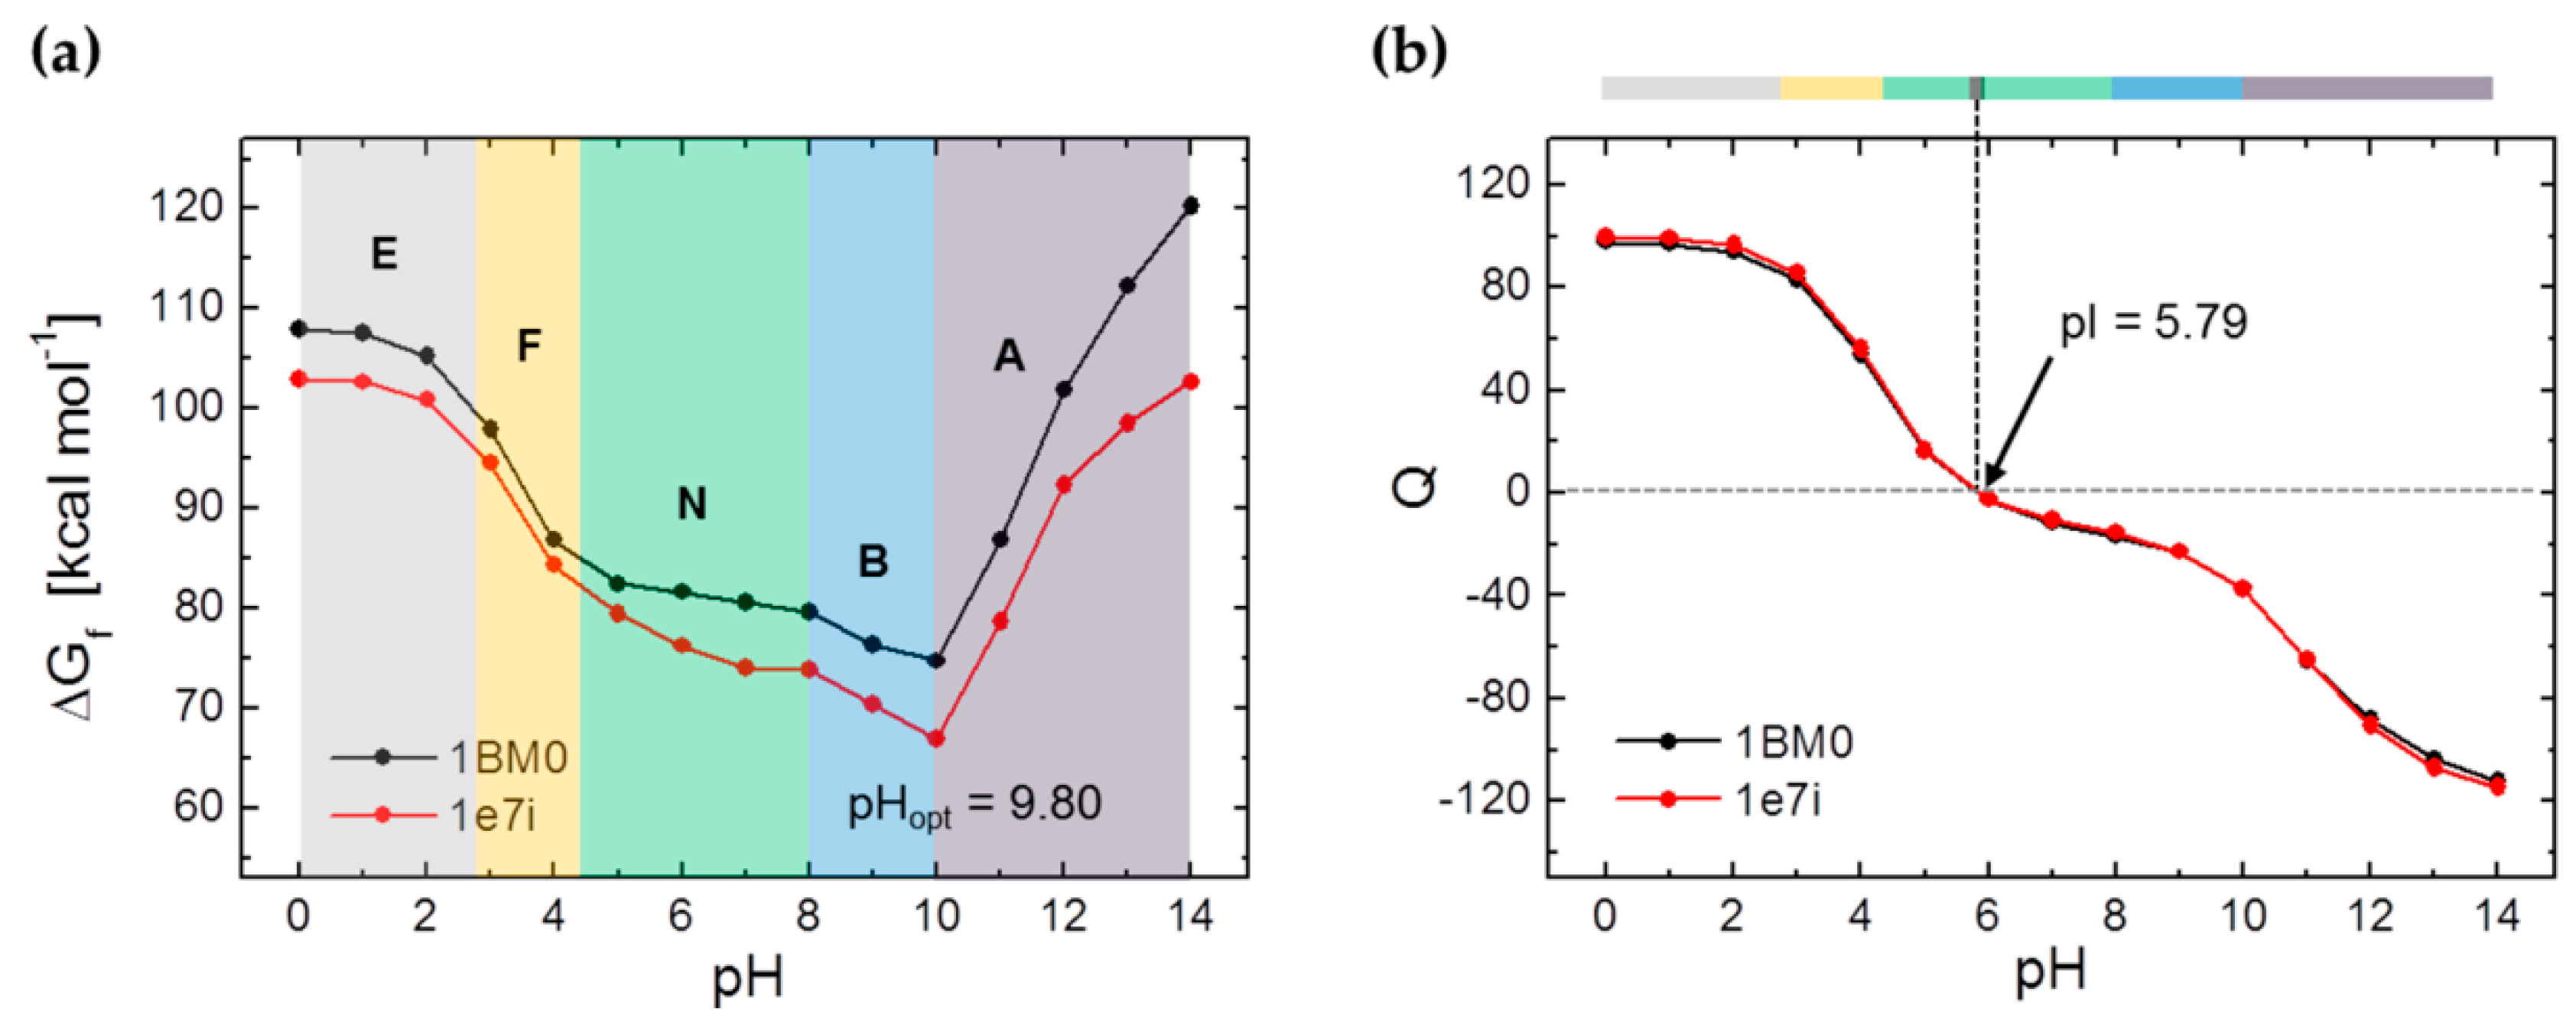
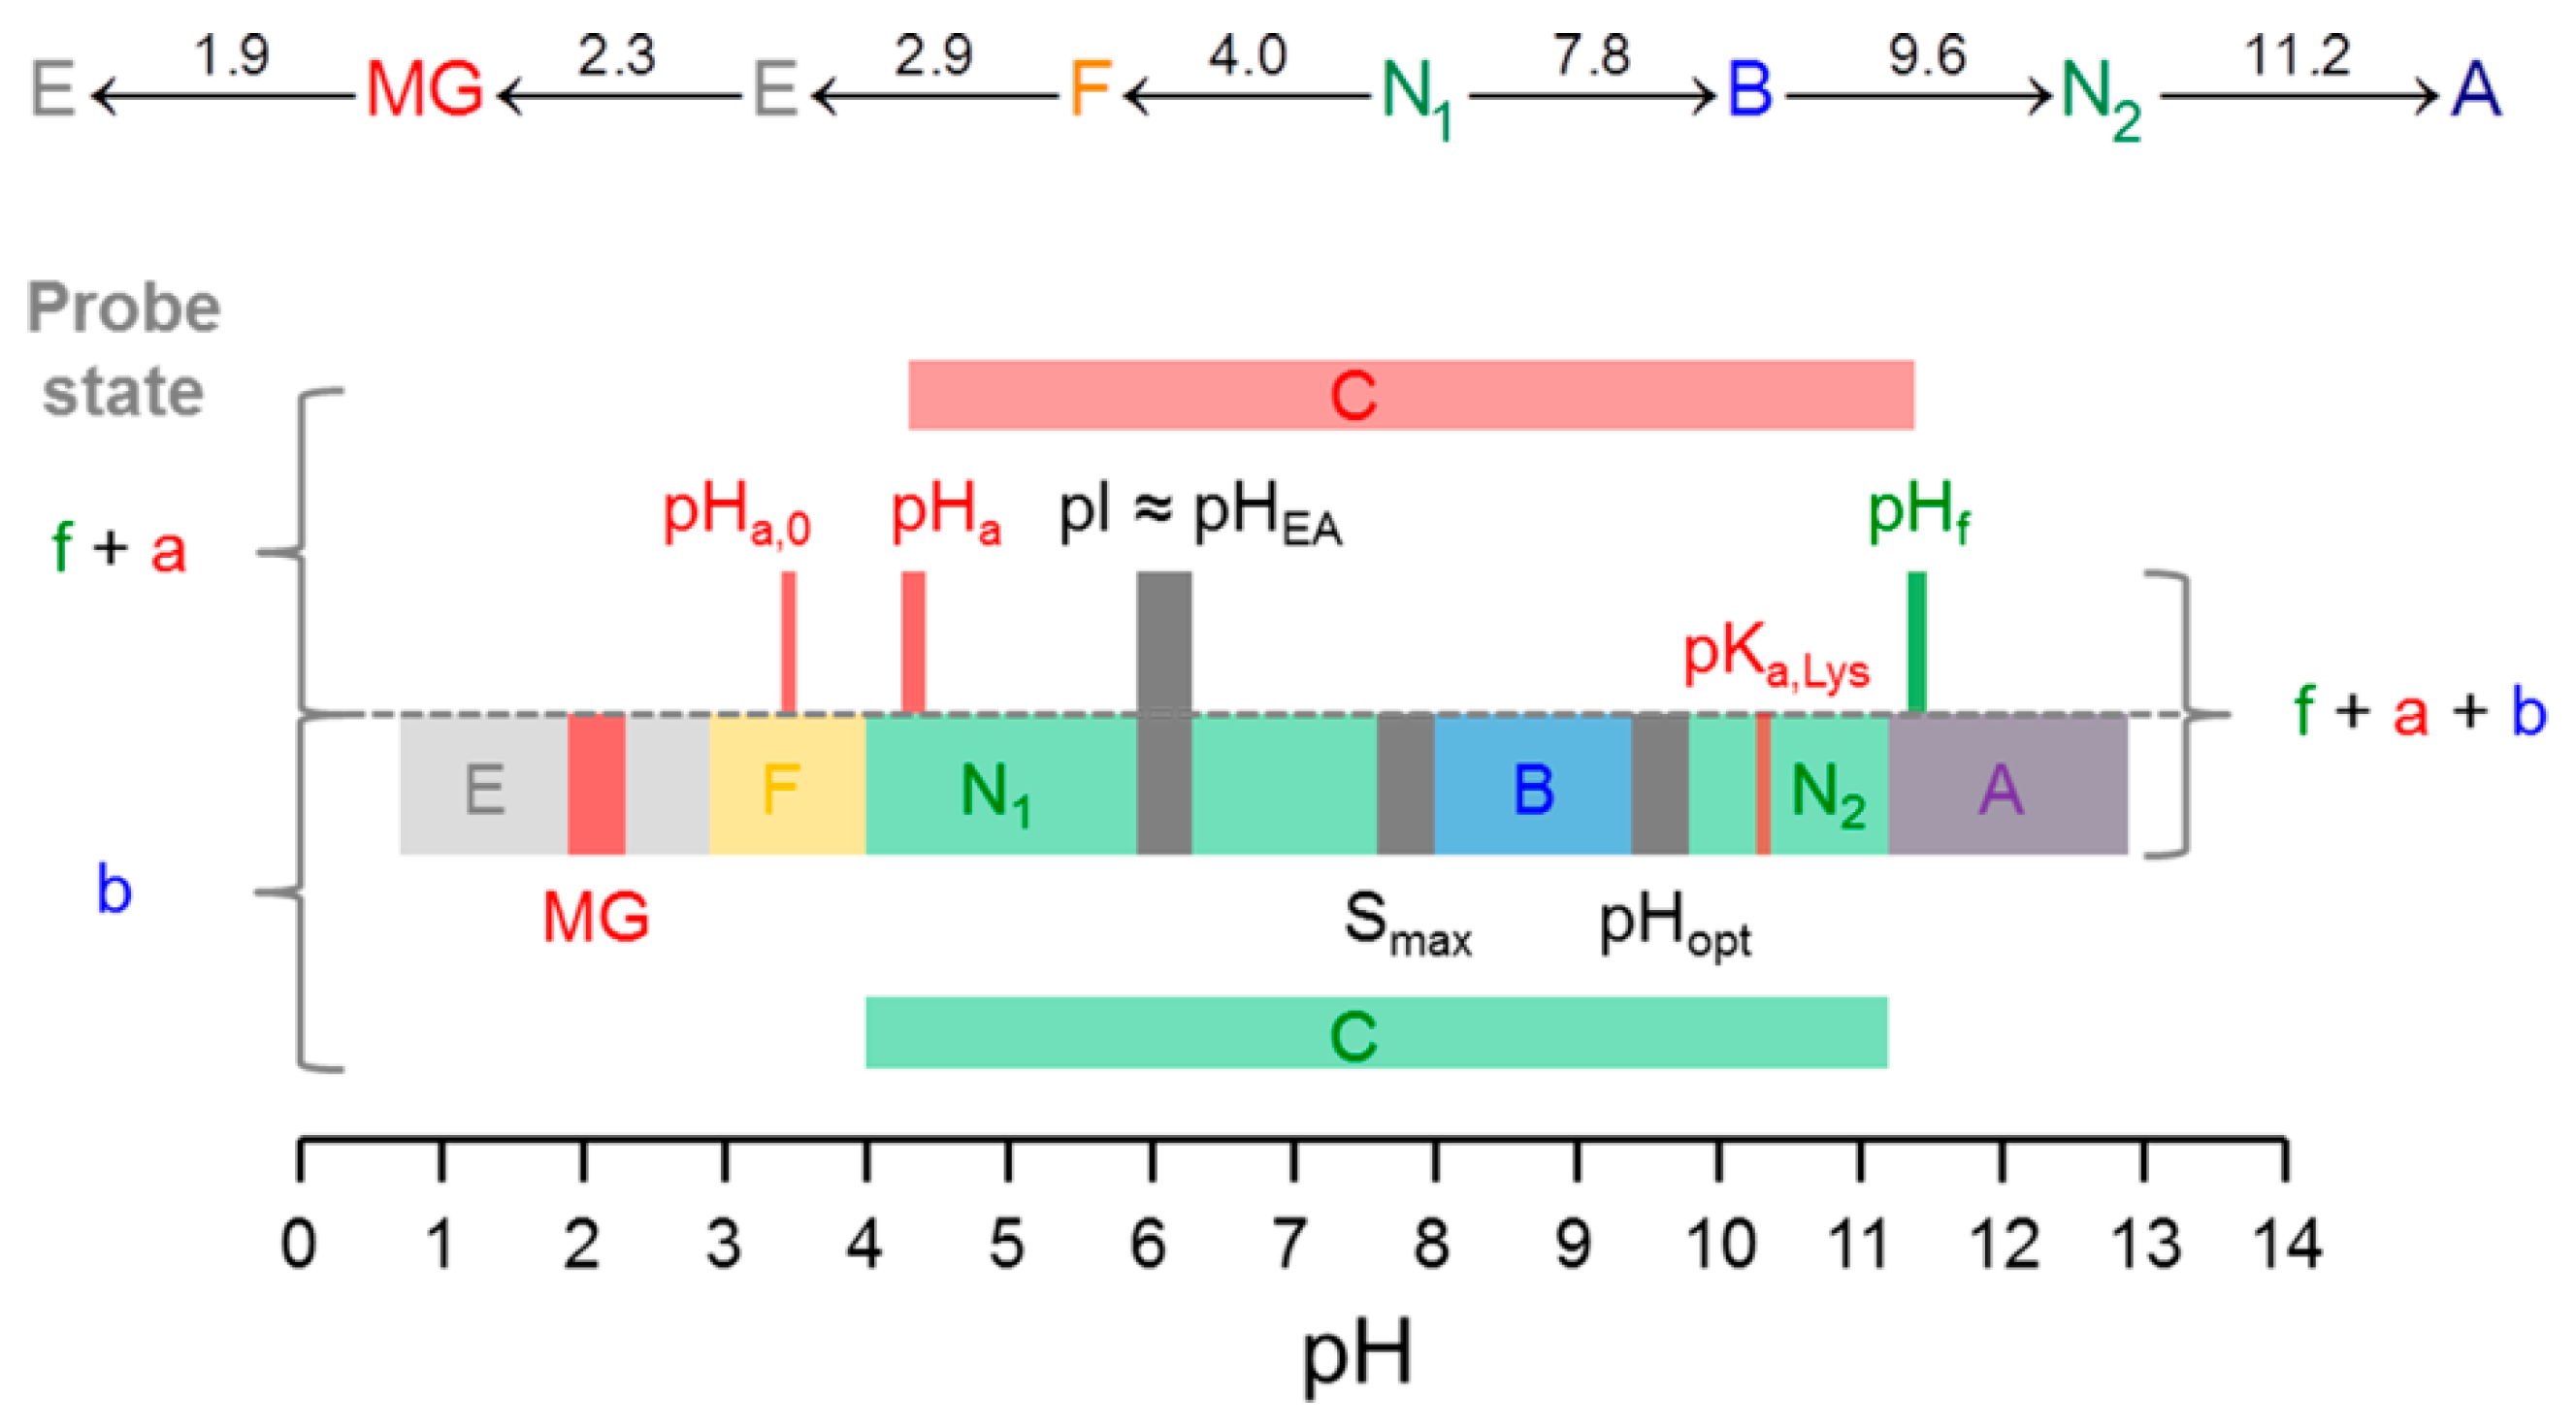
3.1. Calculation of the pH-Dependent Stability and Charge of HSA
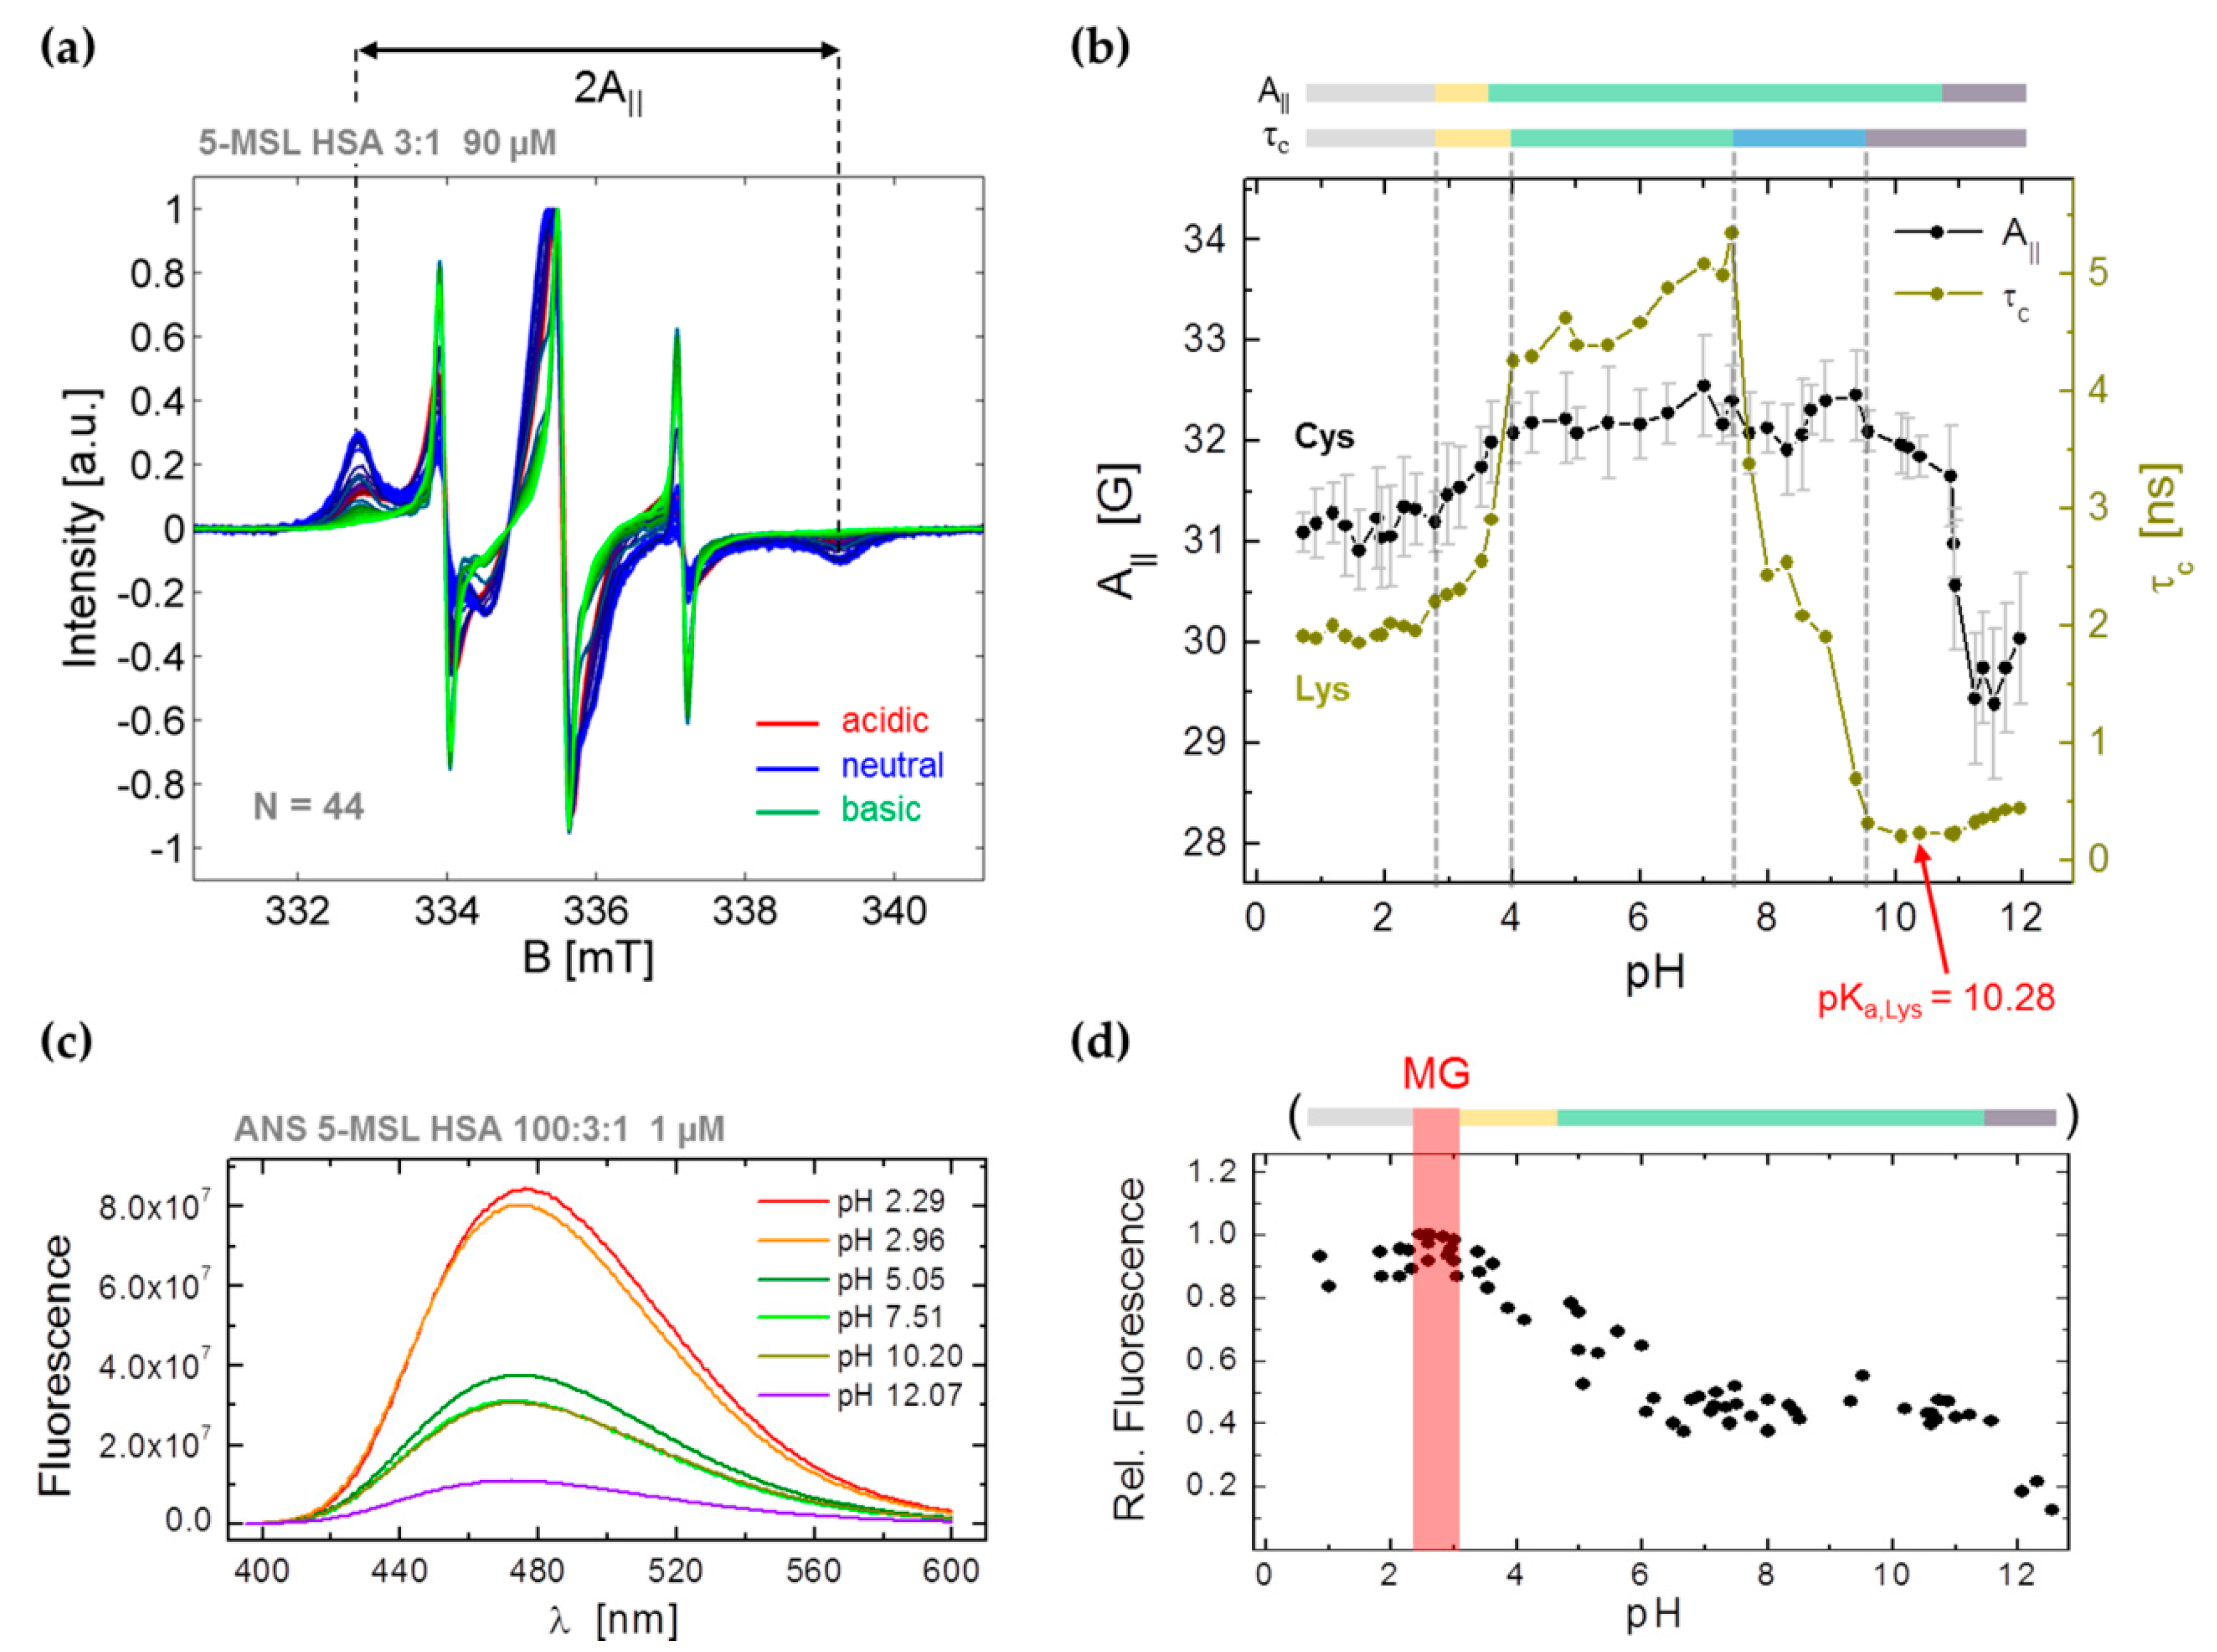
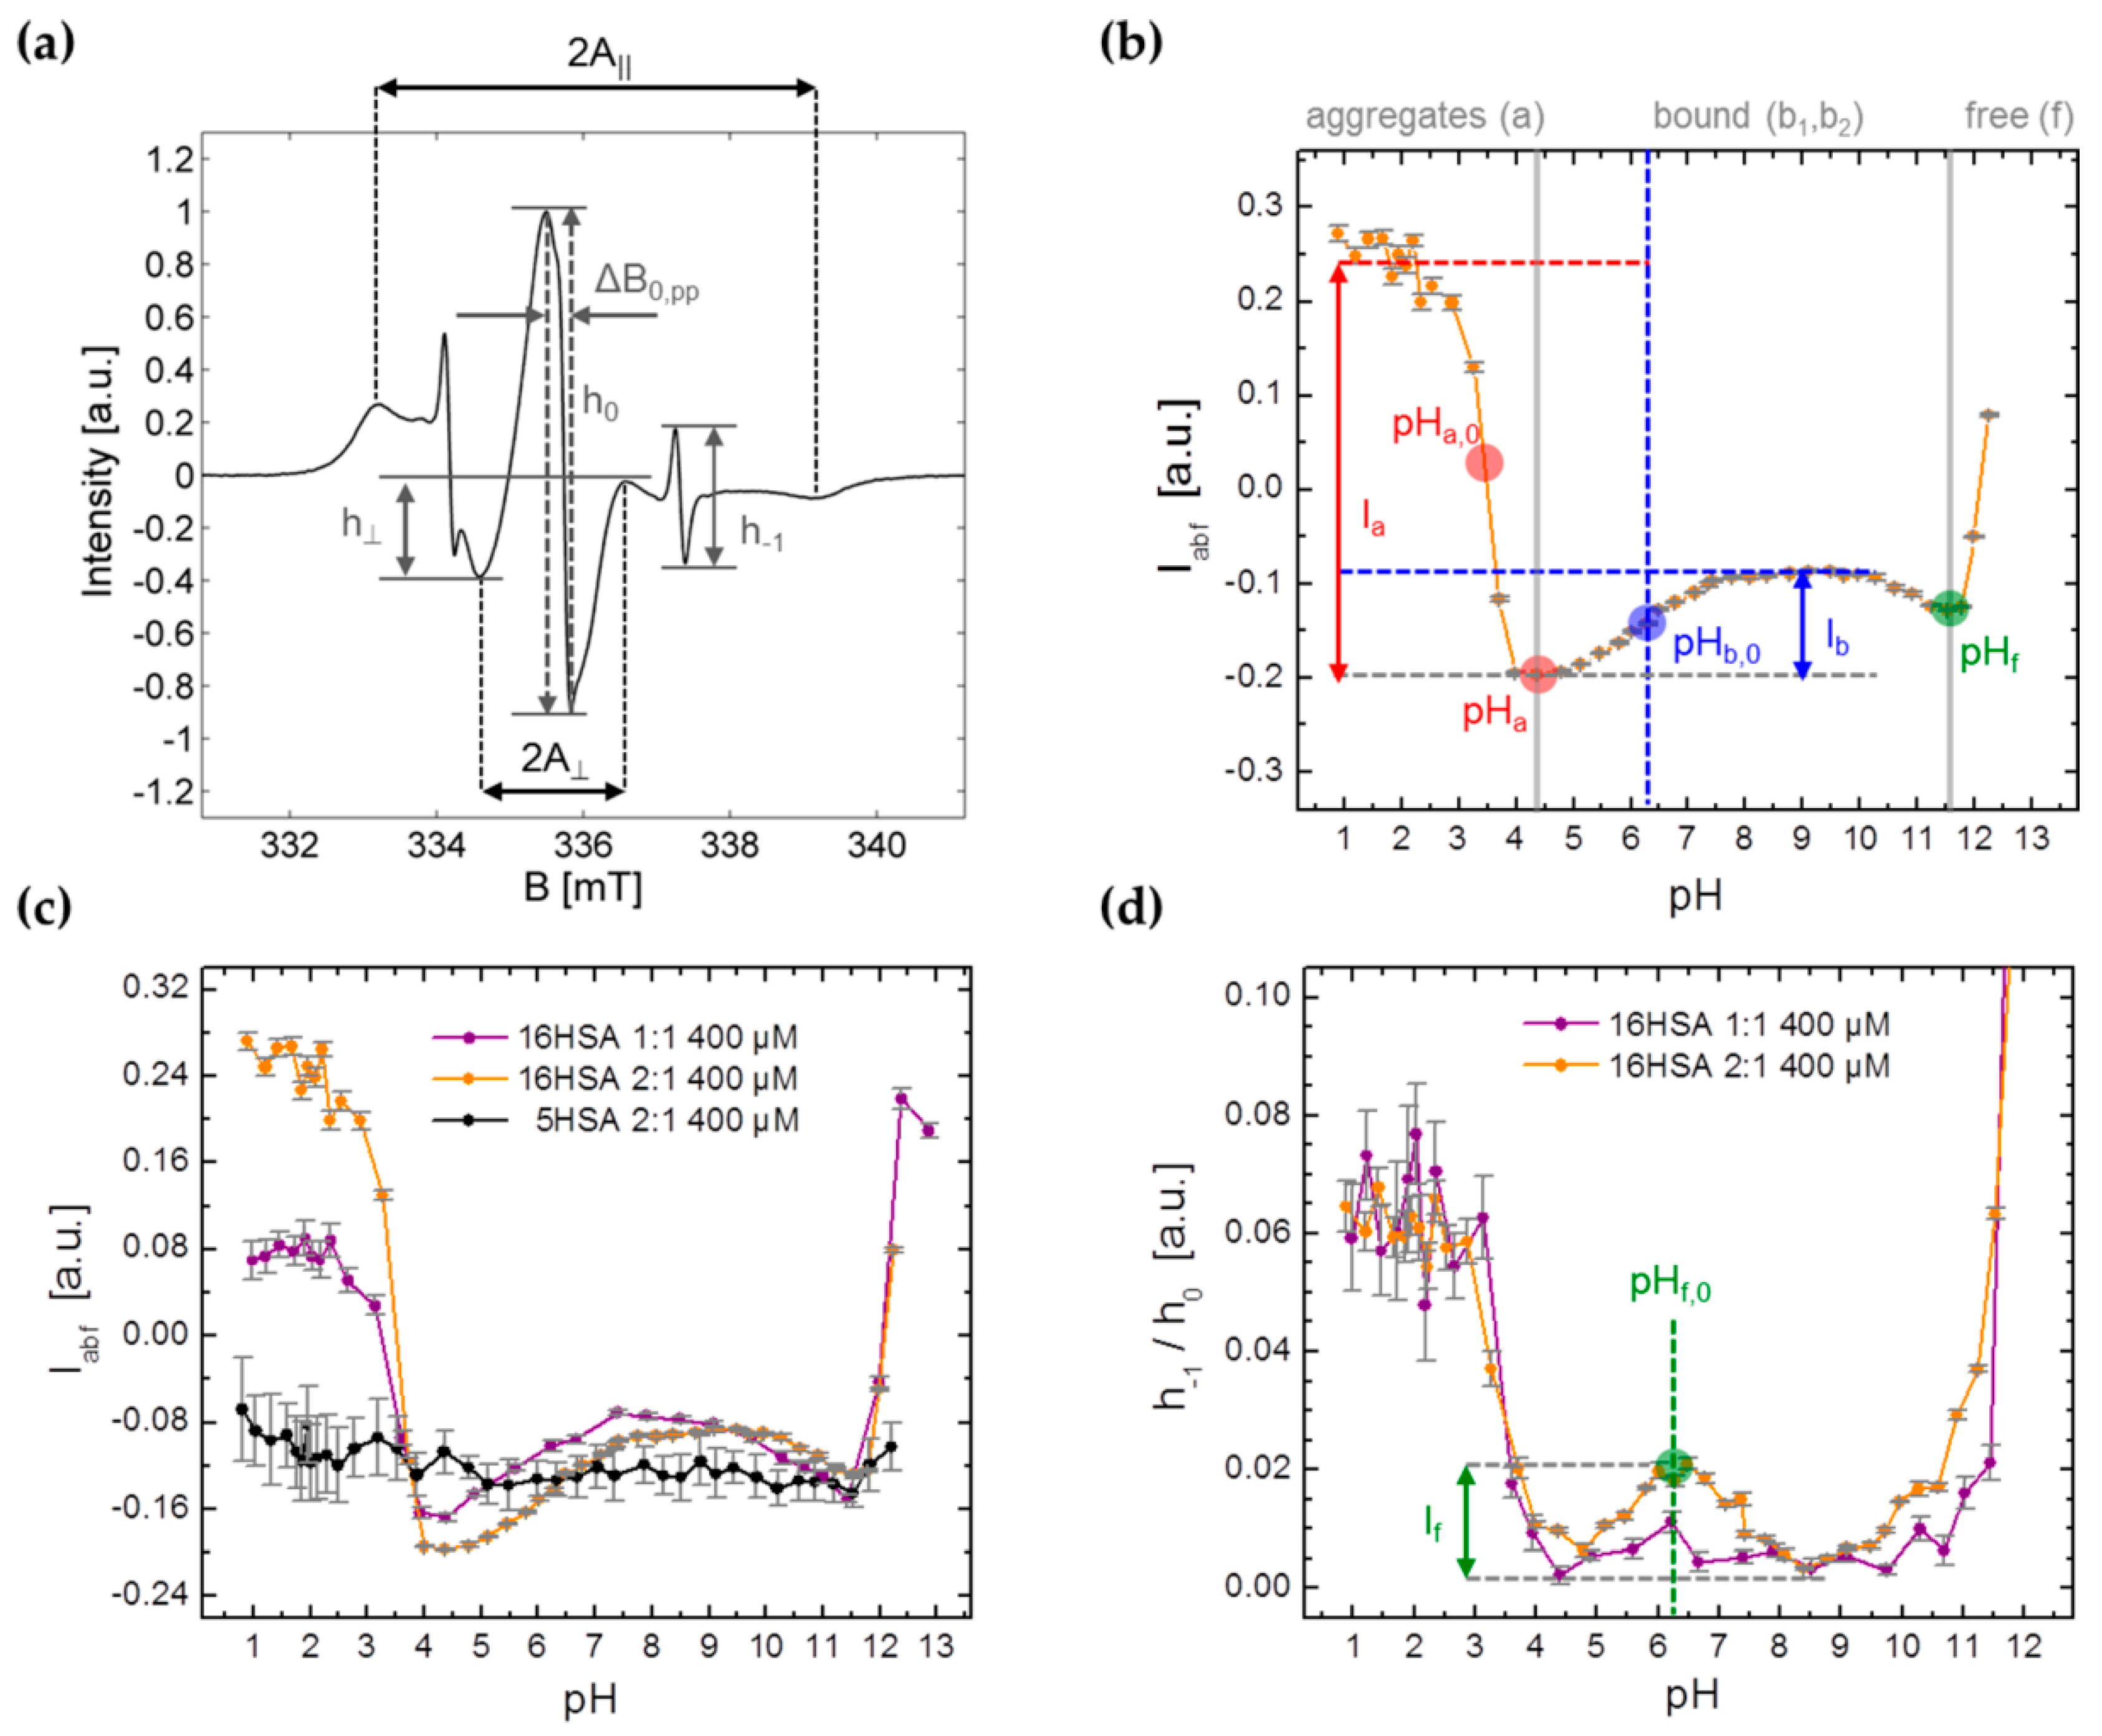
3.2. CW EPR and ANS Fluorescence Experiments on 5-MSL HSA Solutions from pH 0.7–12.5
3.3. CW EPR Experiments on 5- and 16-DSA-Probed HSA Solutions from pH 0.8–12.9
3.3.1. Monitoring Global Spectral Changes from CW EPR Spectra of Spin Probed HSA
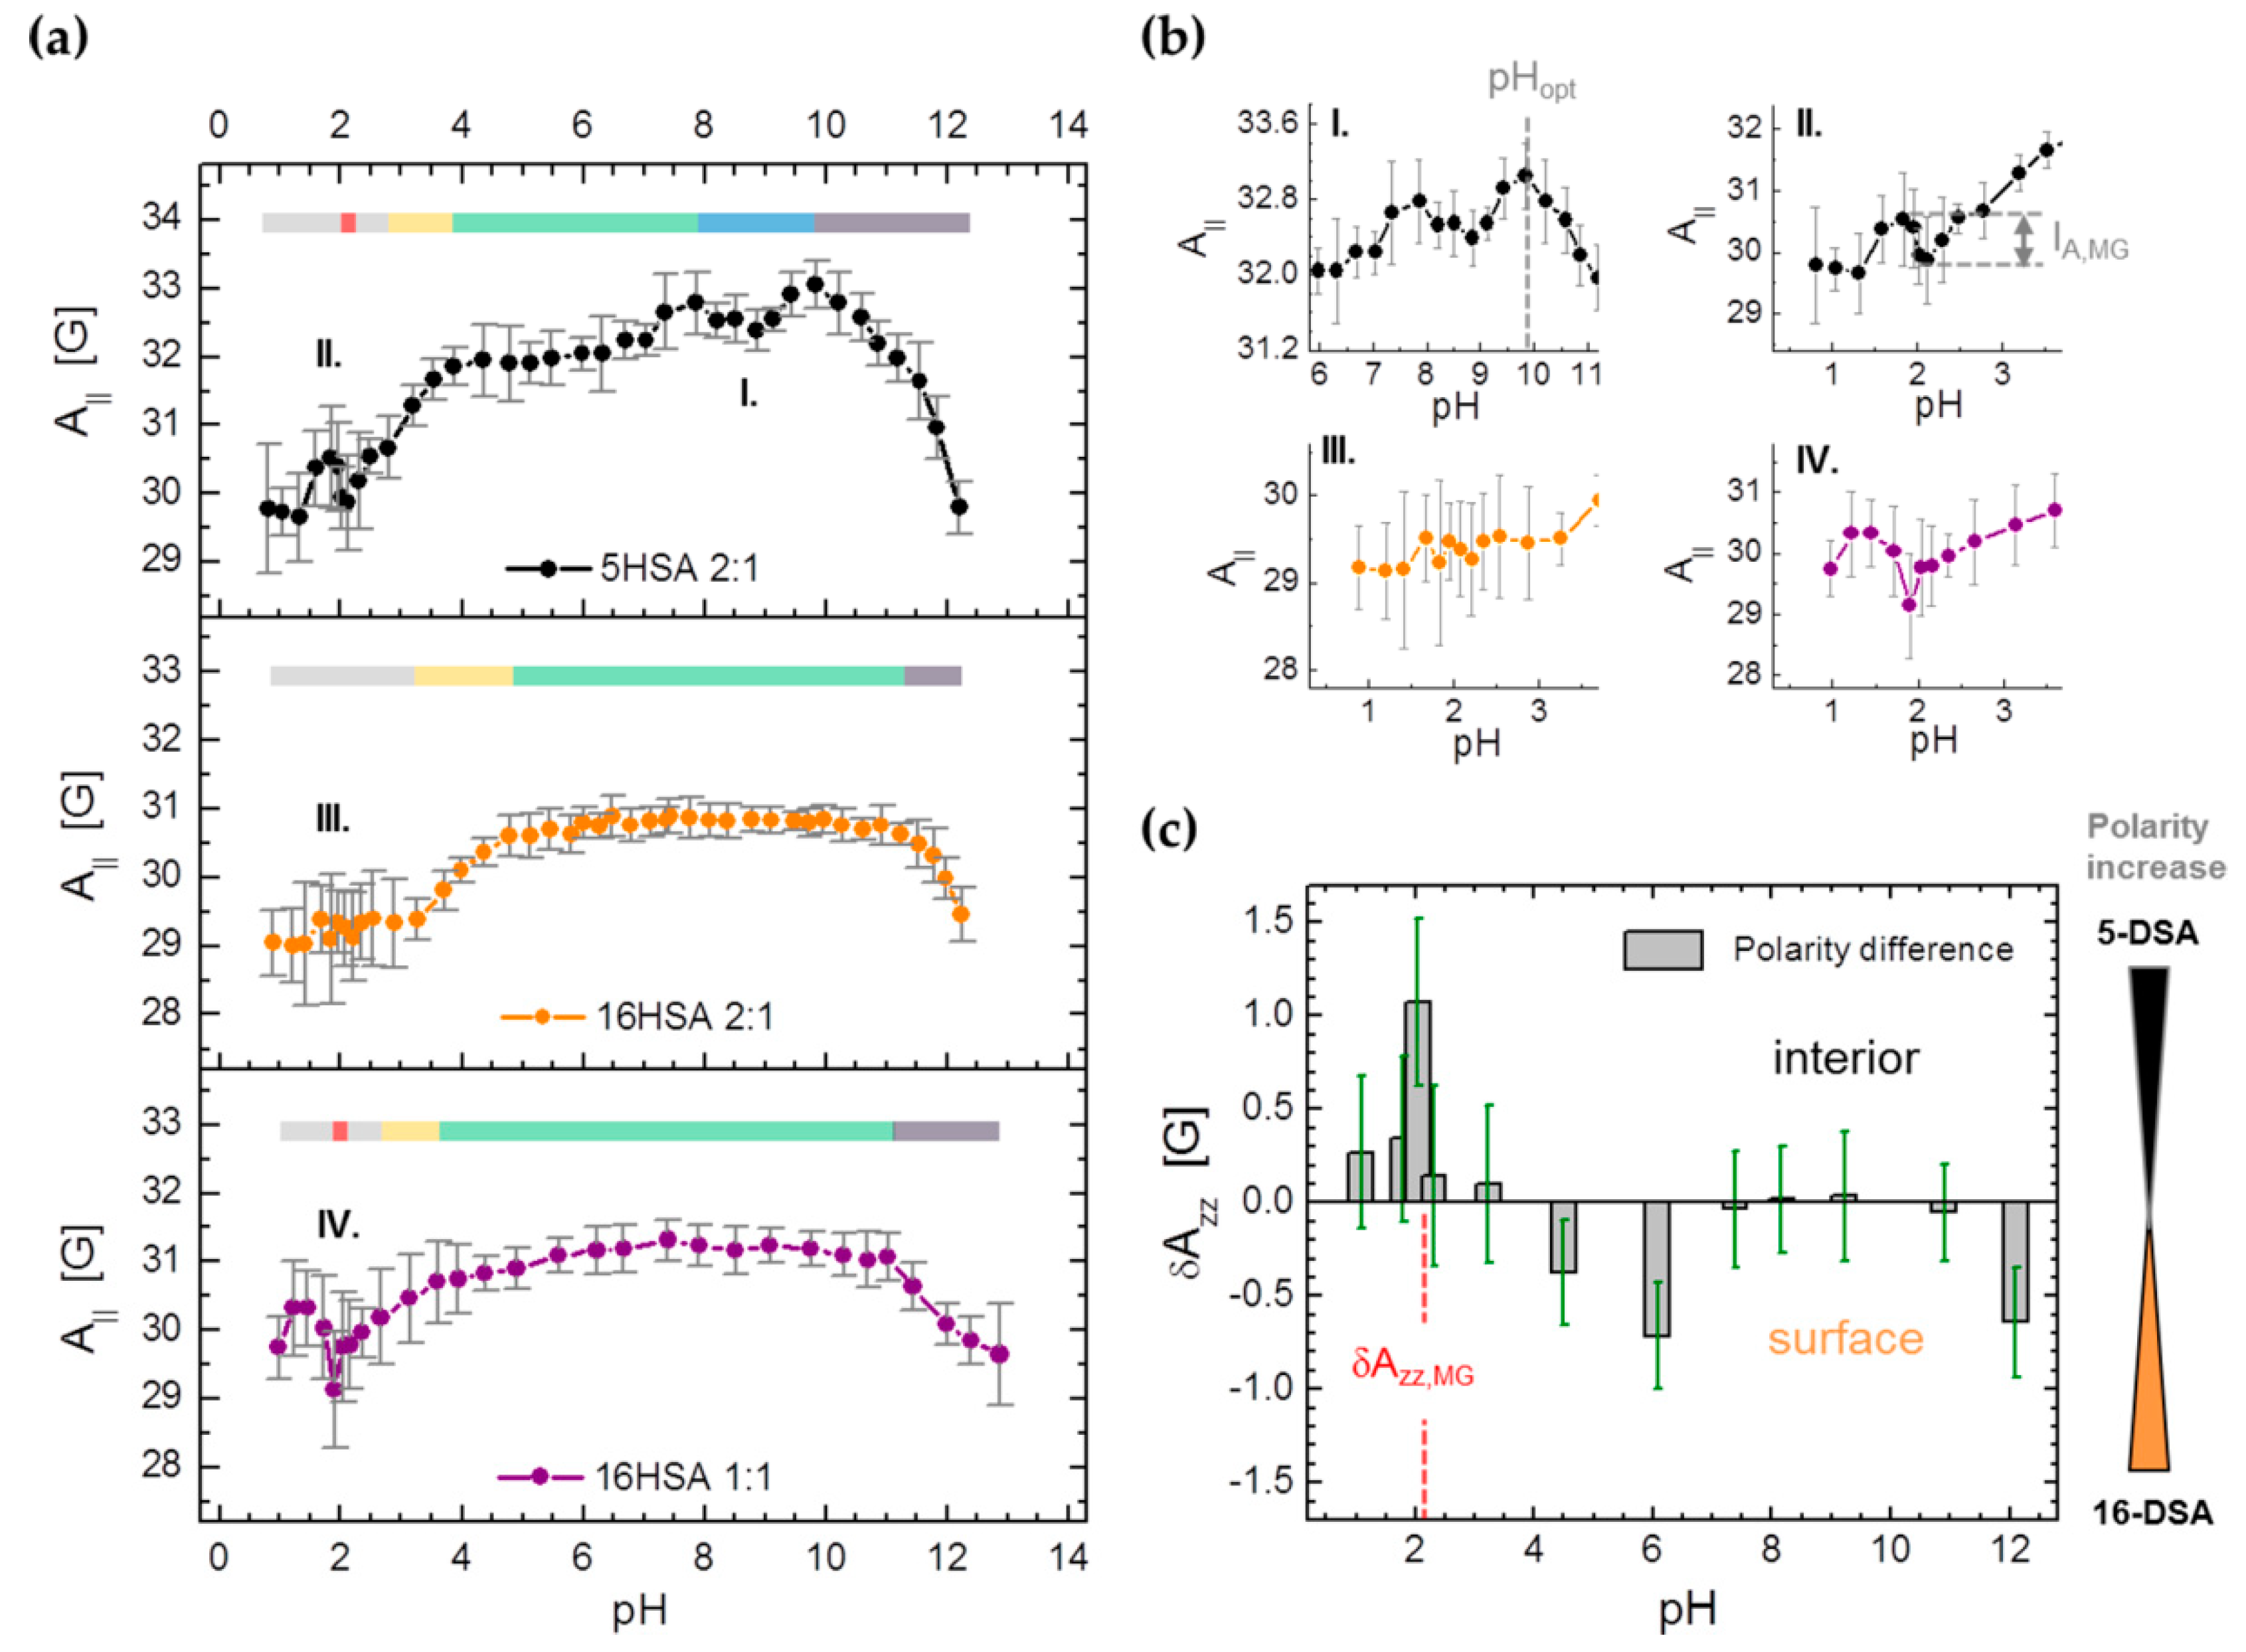
3.3.2. Monitoring Changes in Spin Probe Immobilization (A||) and Polarity (Azz) in HSA
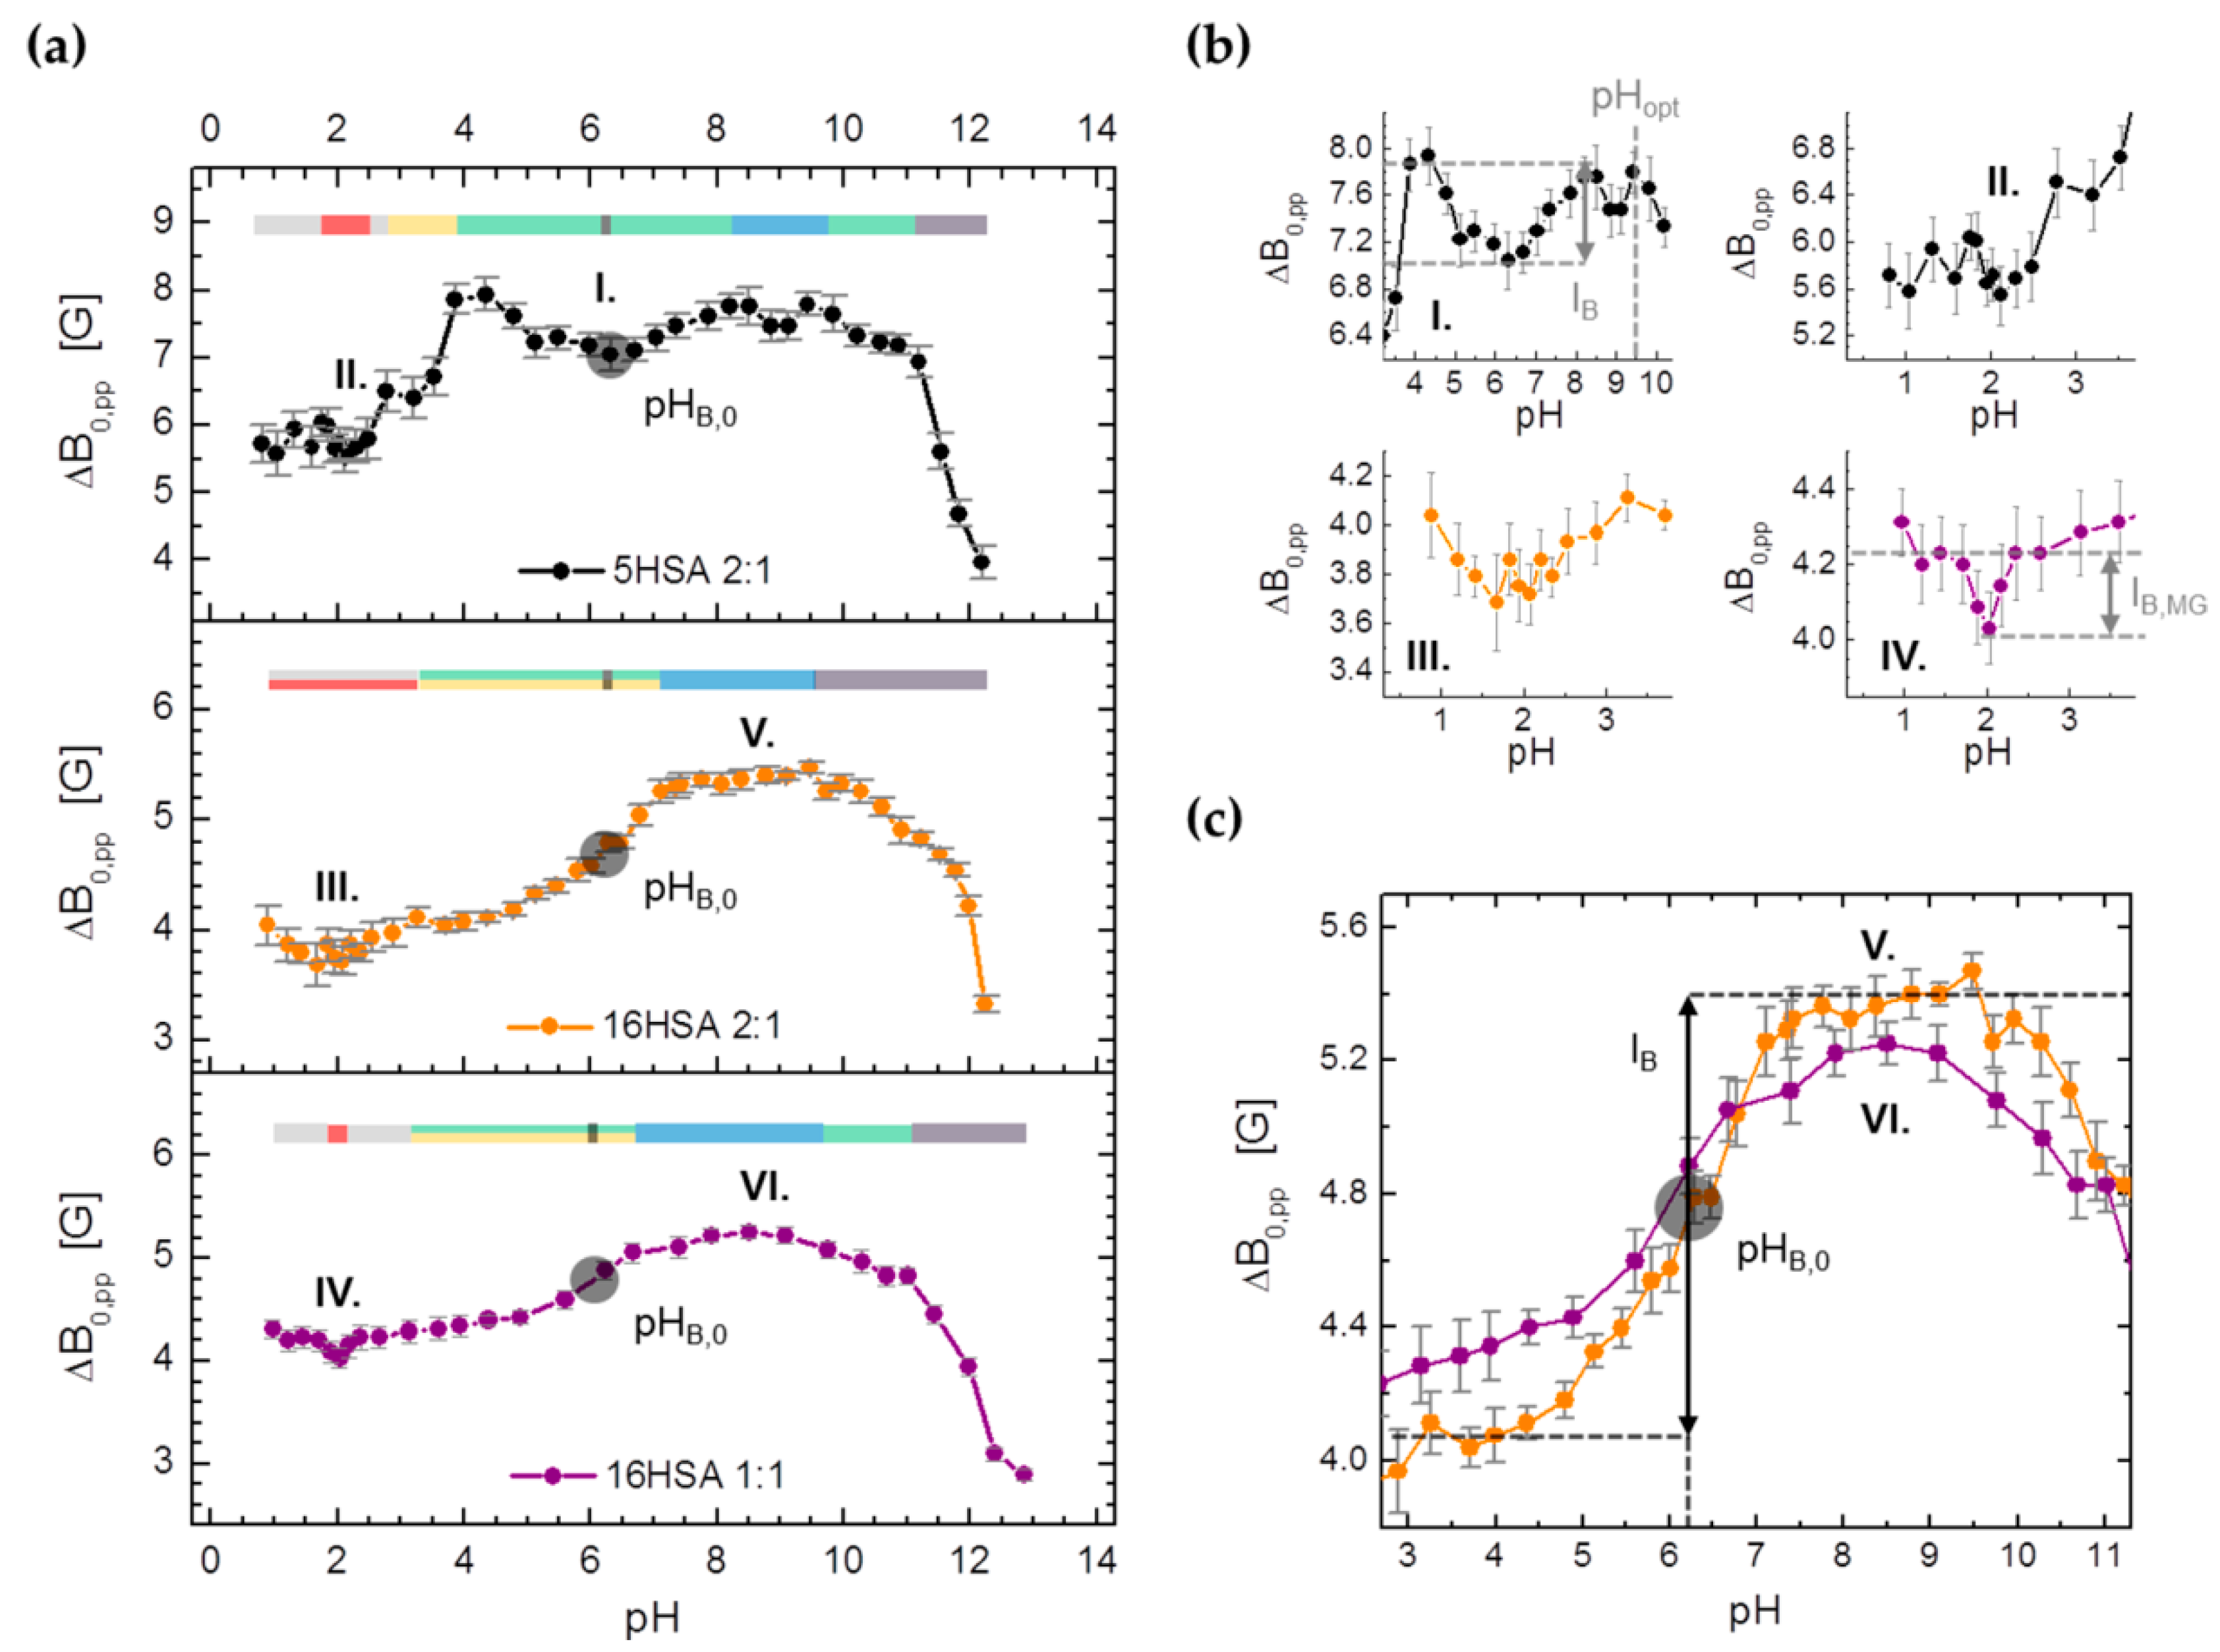
3.3.3. Monitoring Changes in Center-Field Linewidths (ΔB0,pp) from Spin Probed HSA
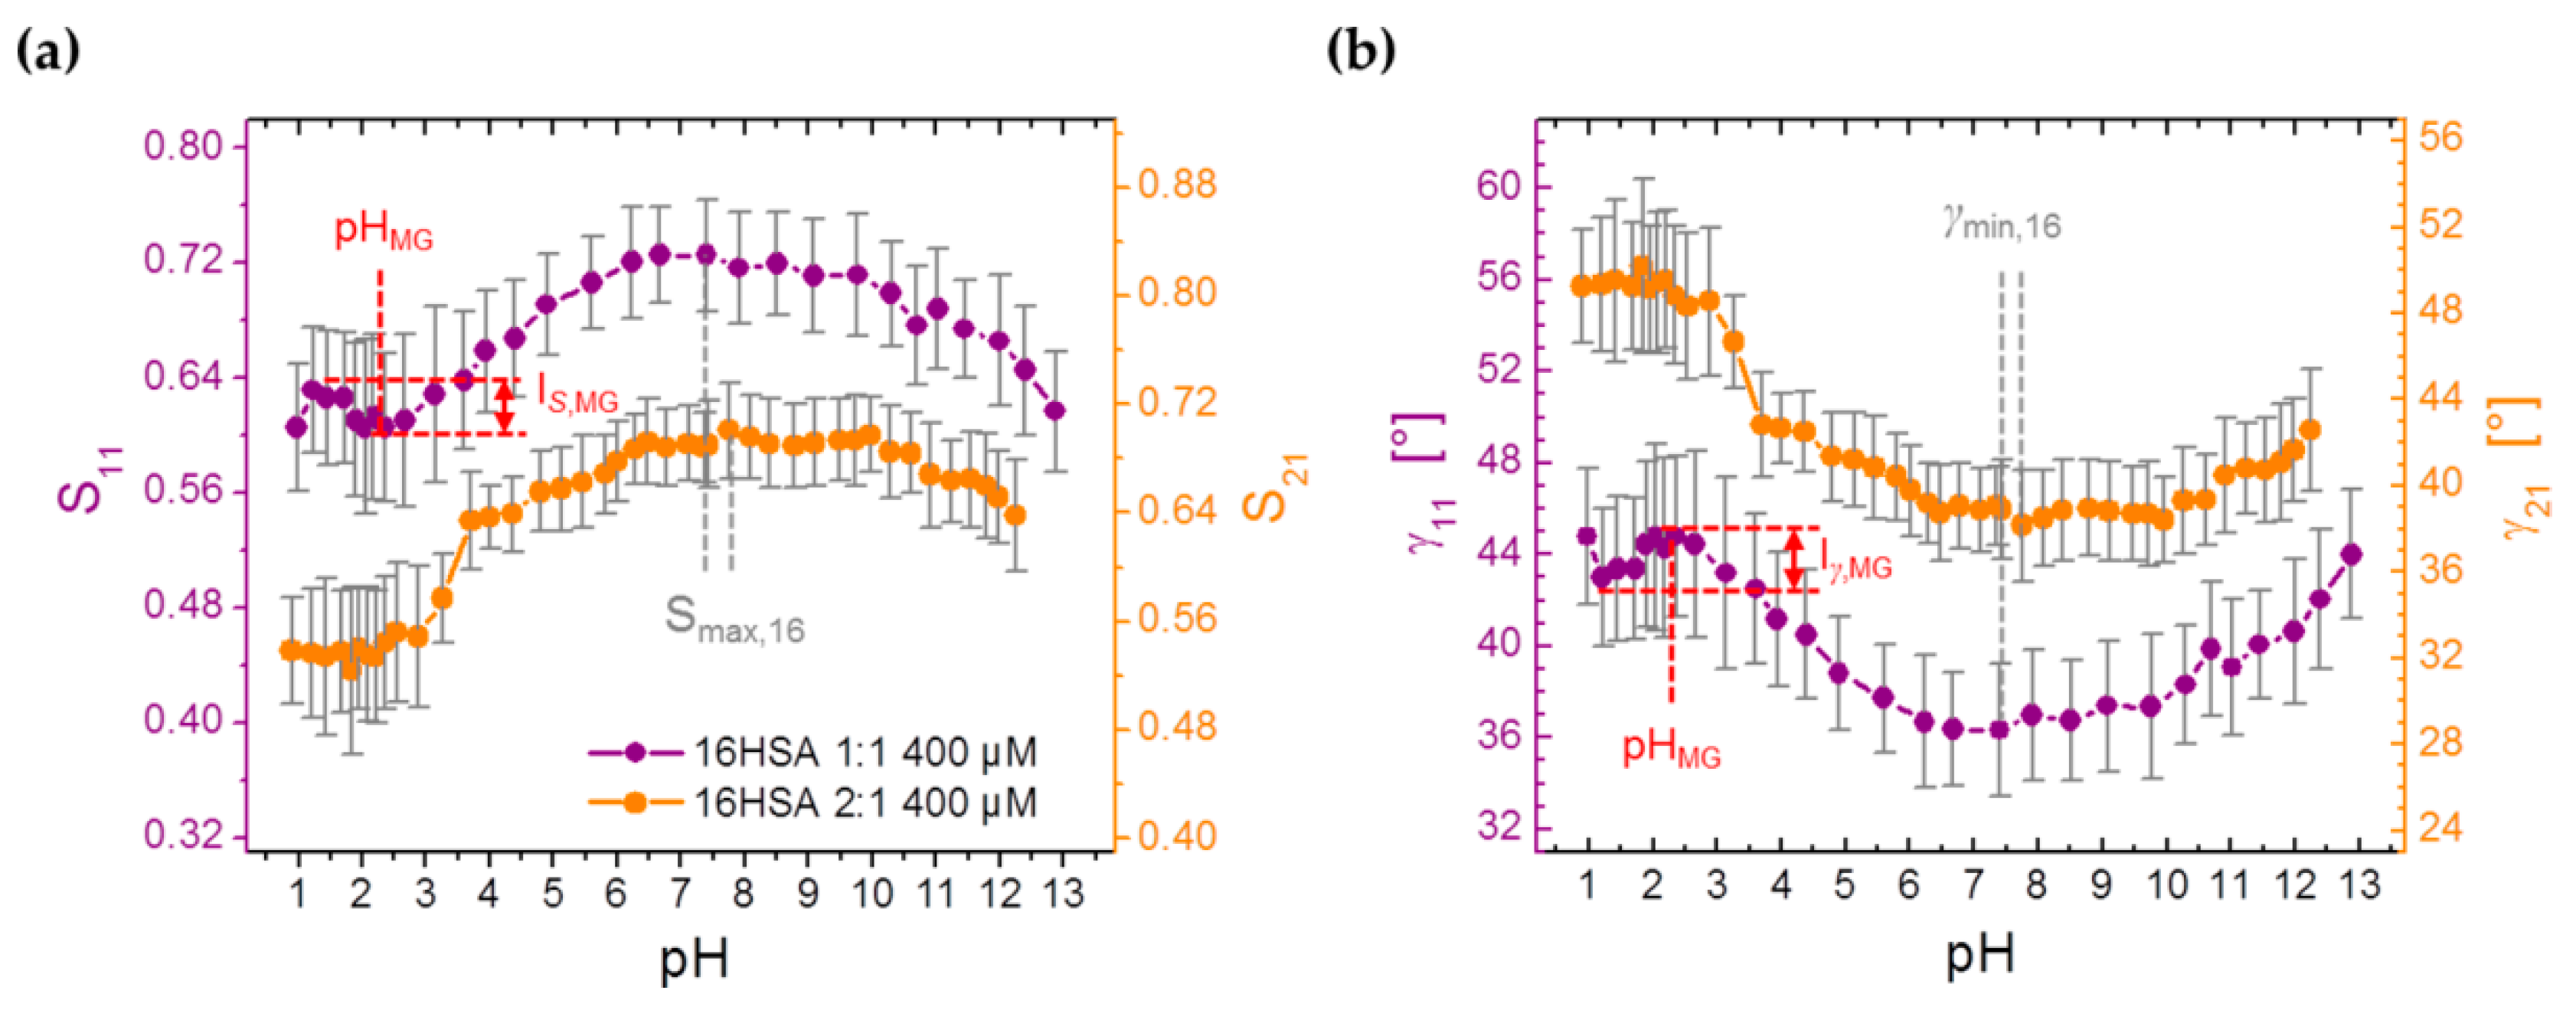
3.3.4. Monitoring Changes from Order Parameters (S) in Spin Probed HSA Solutions
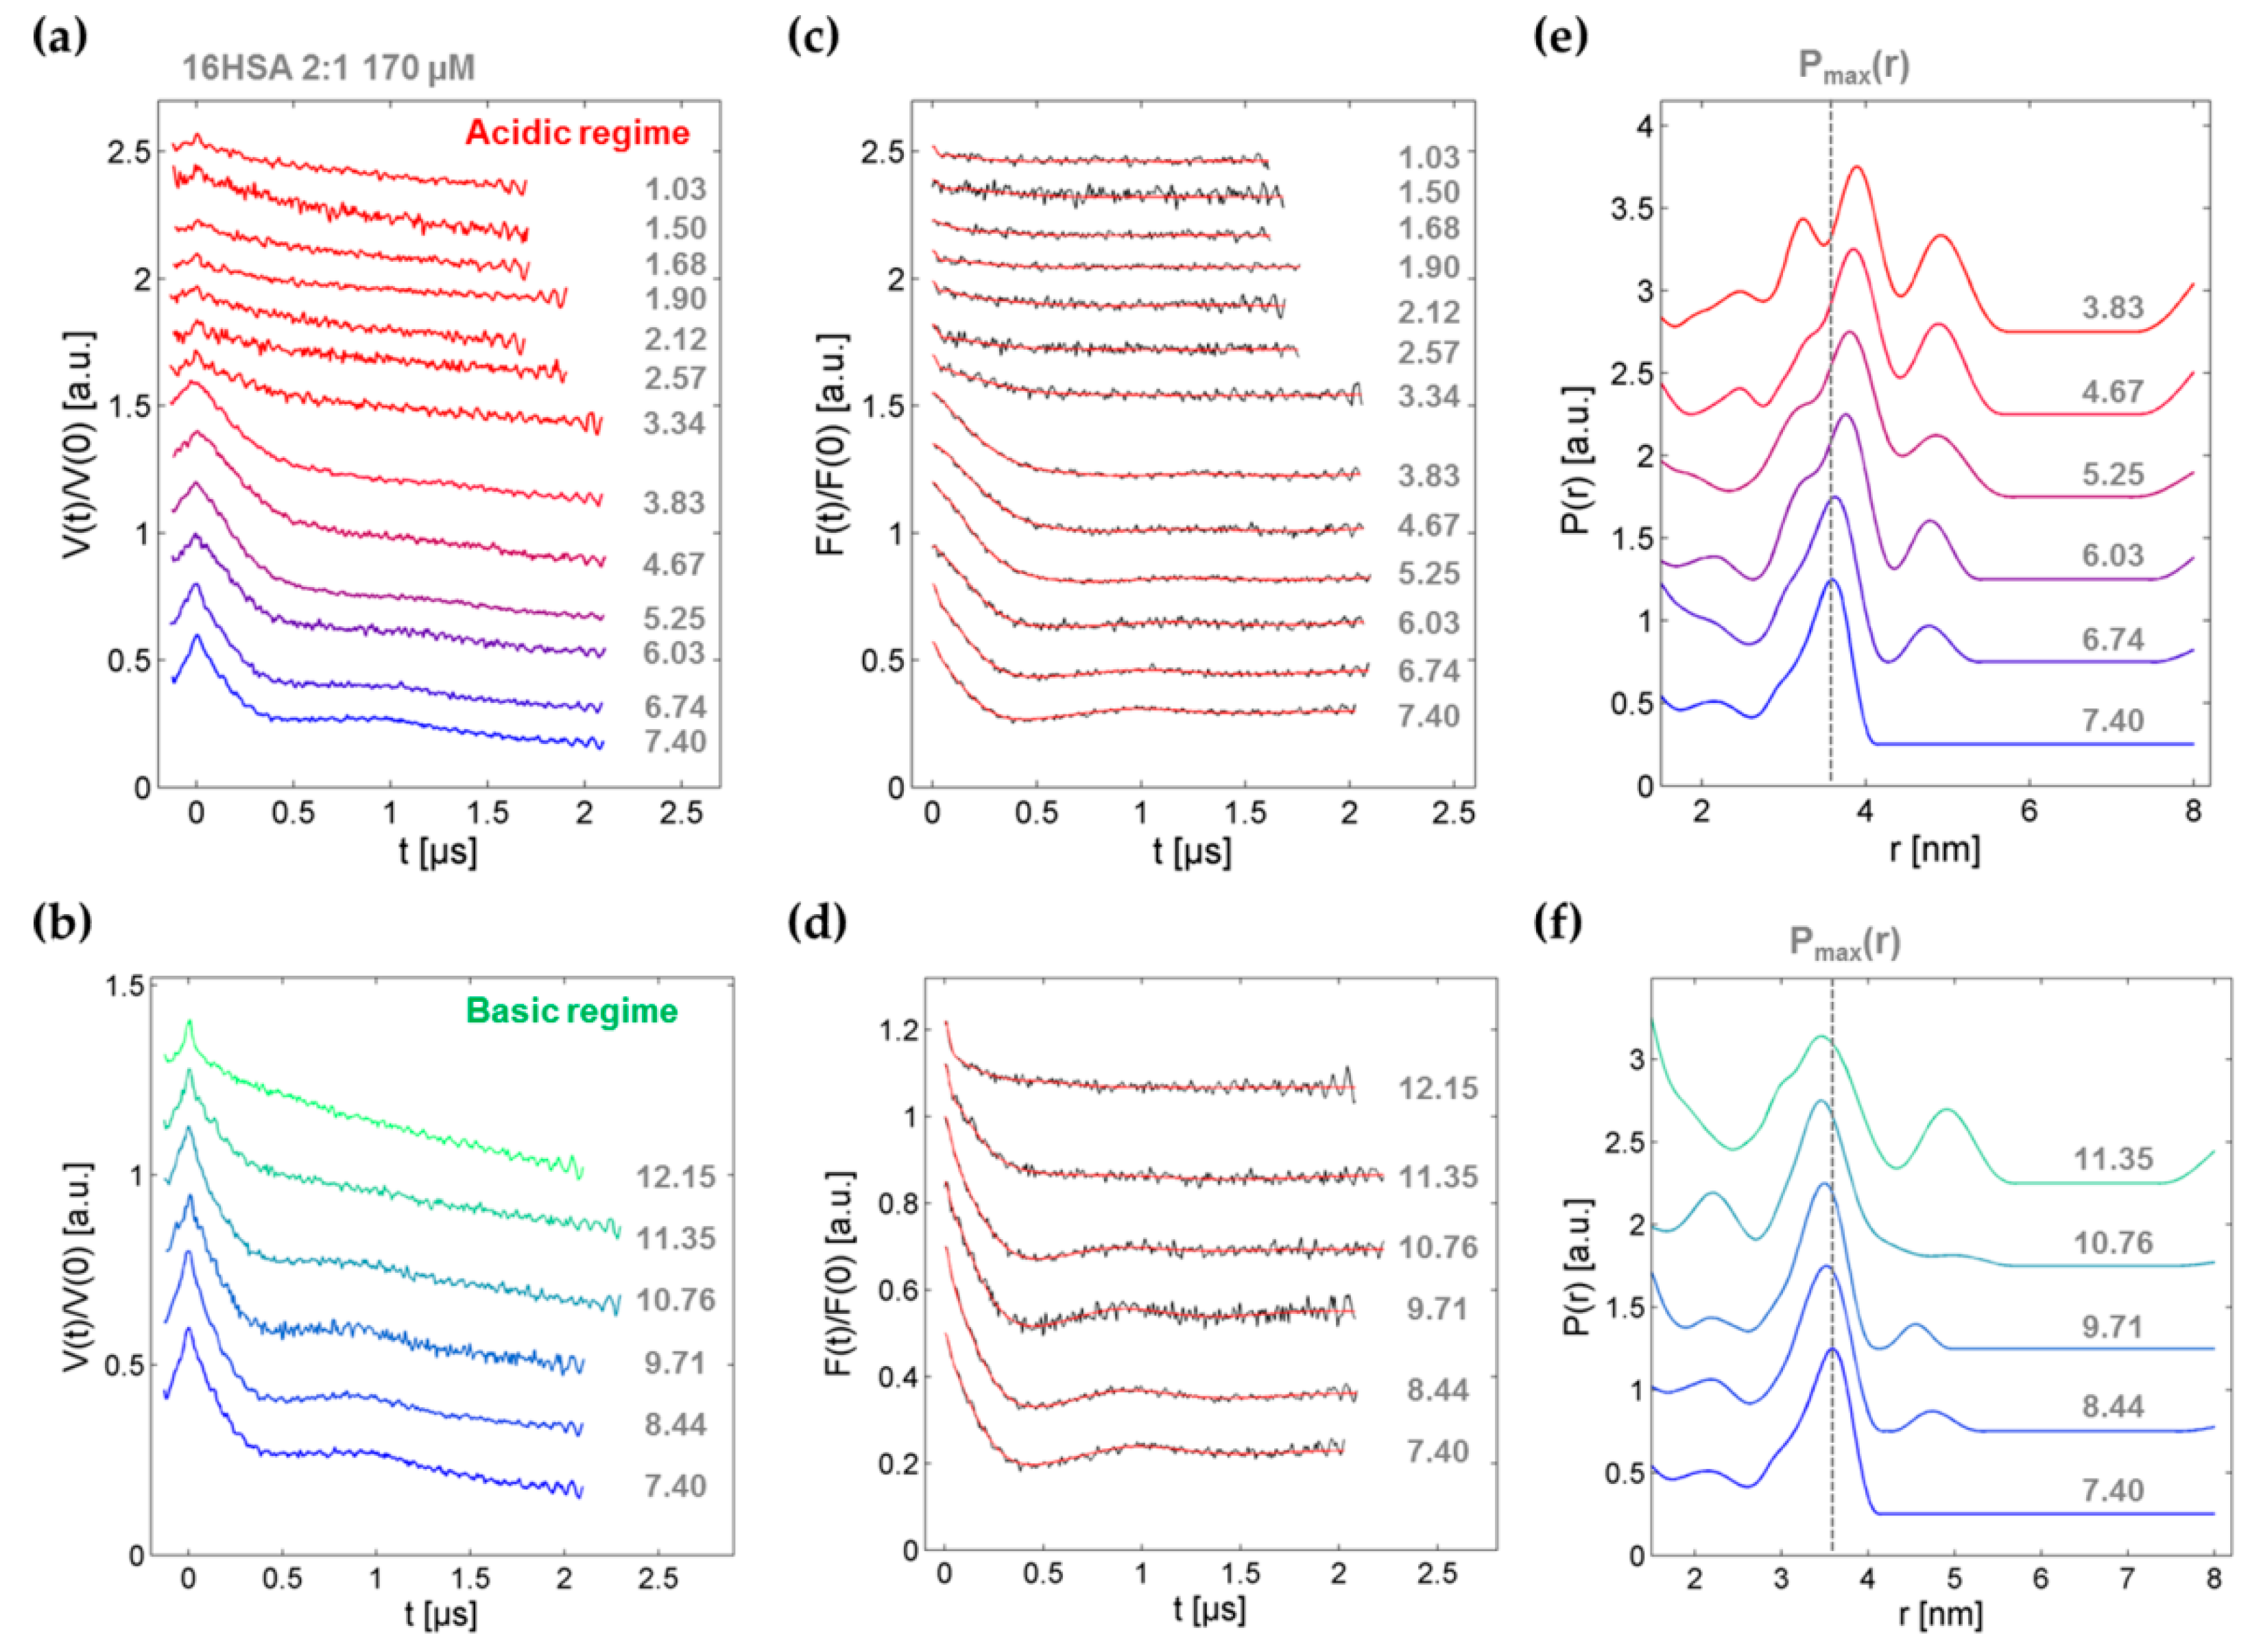
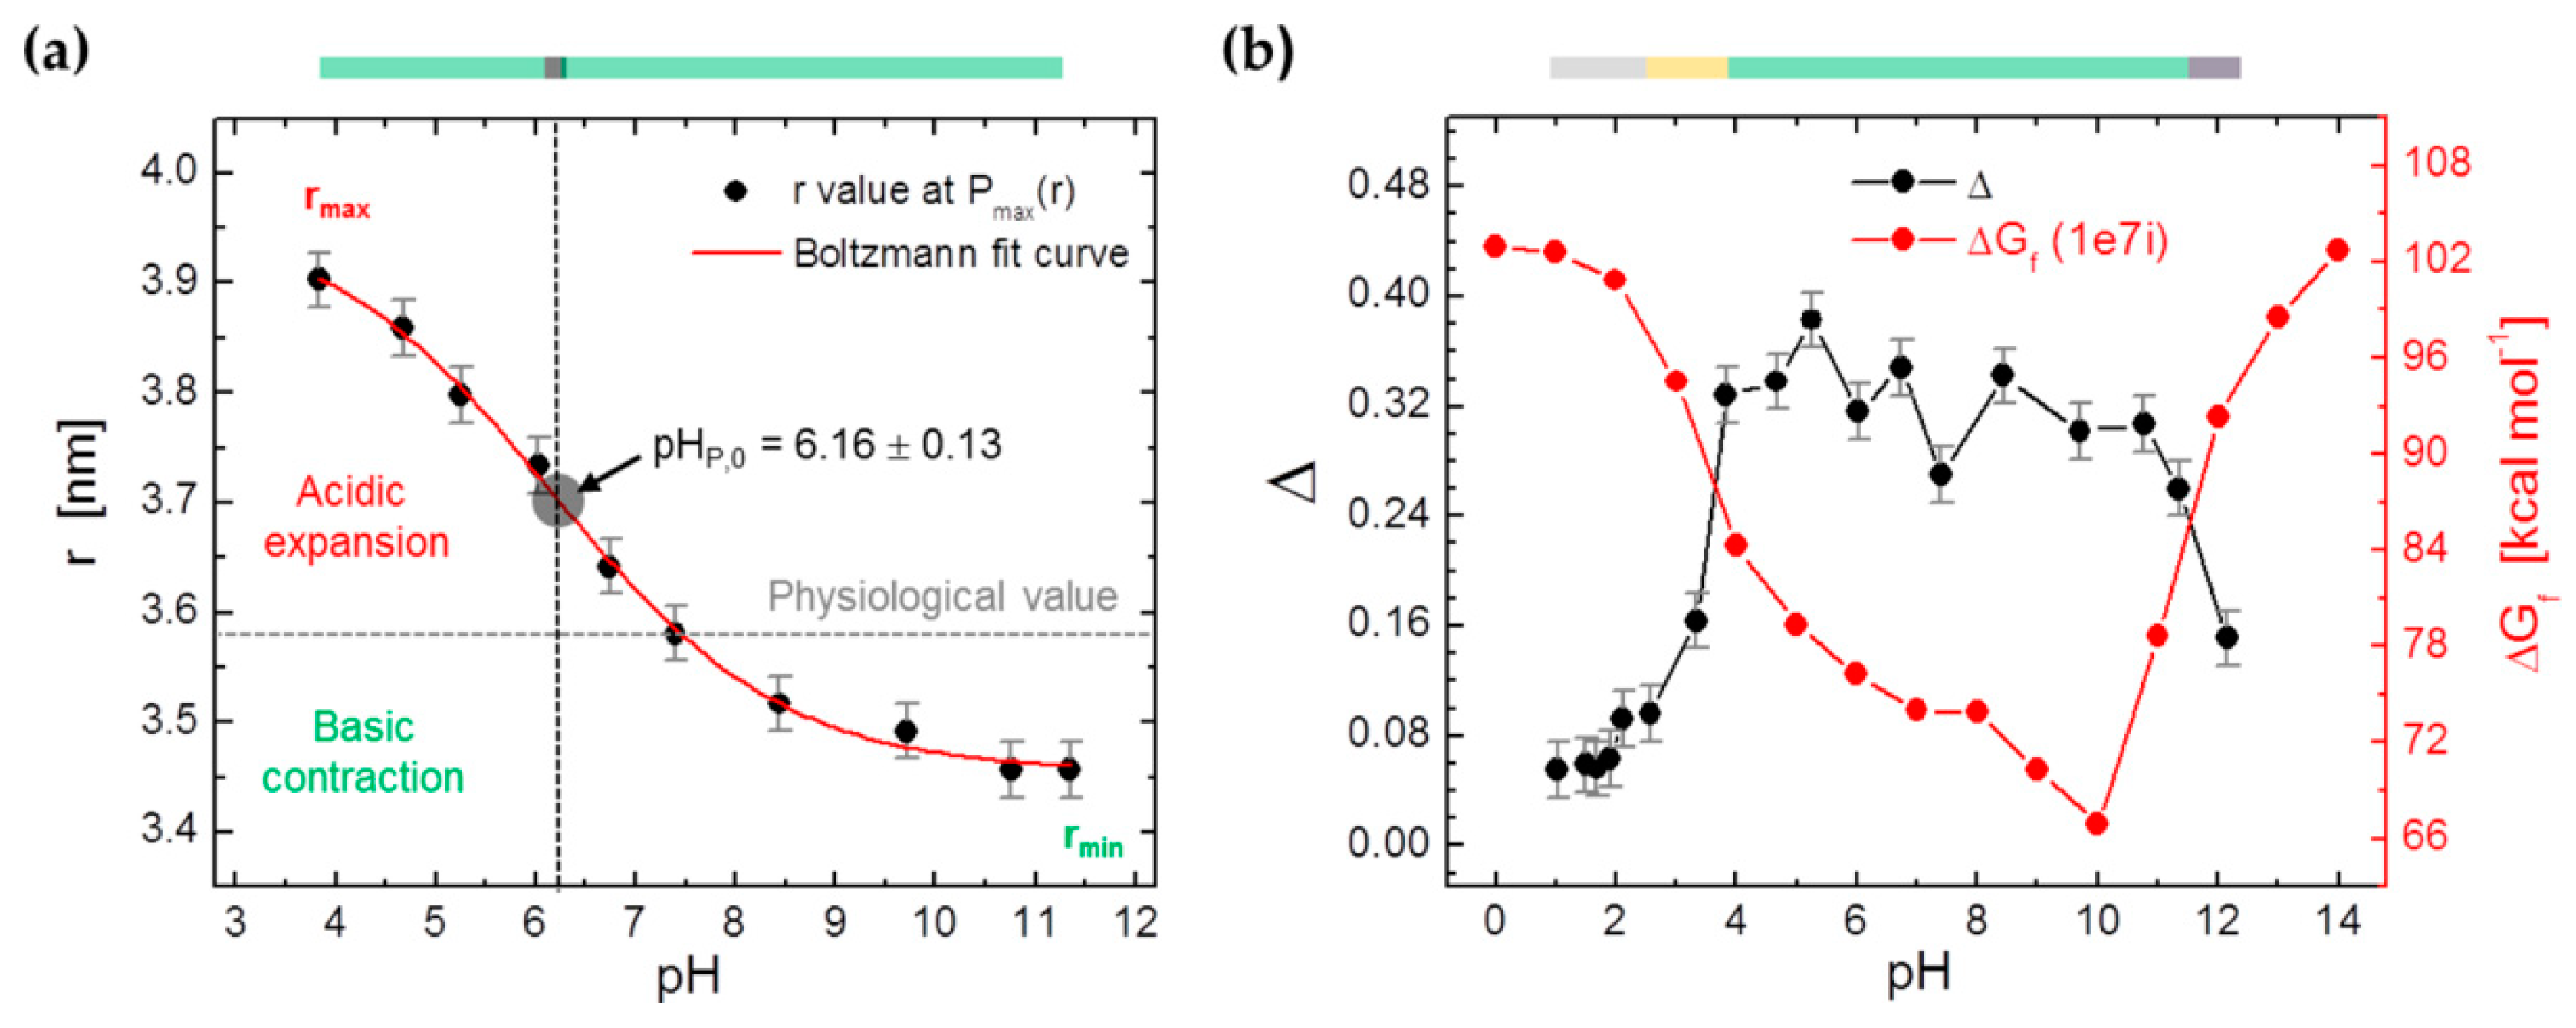
3.4. DEER Experiments on 16-DSA-Probed HSA Solutions at pH 1.03–12.15
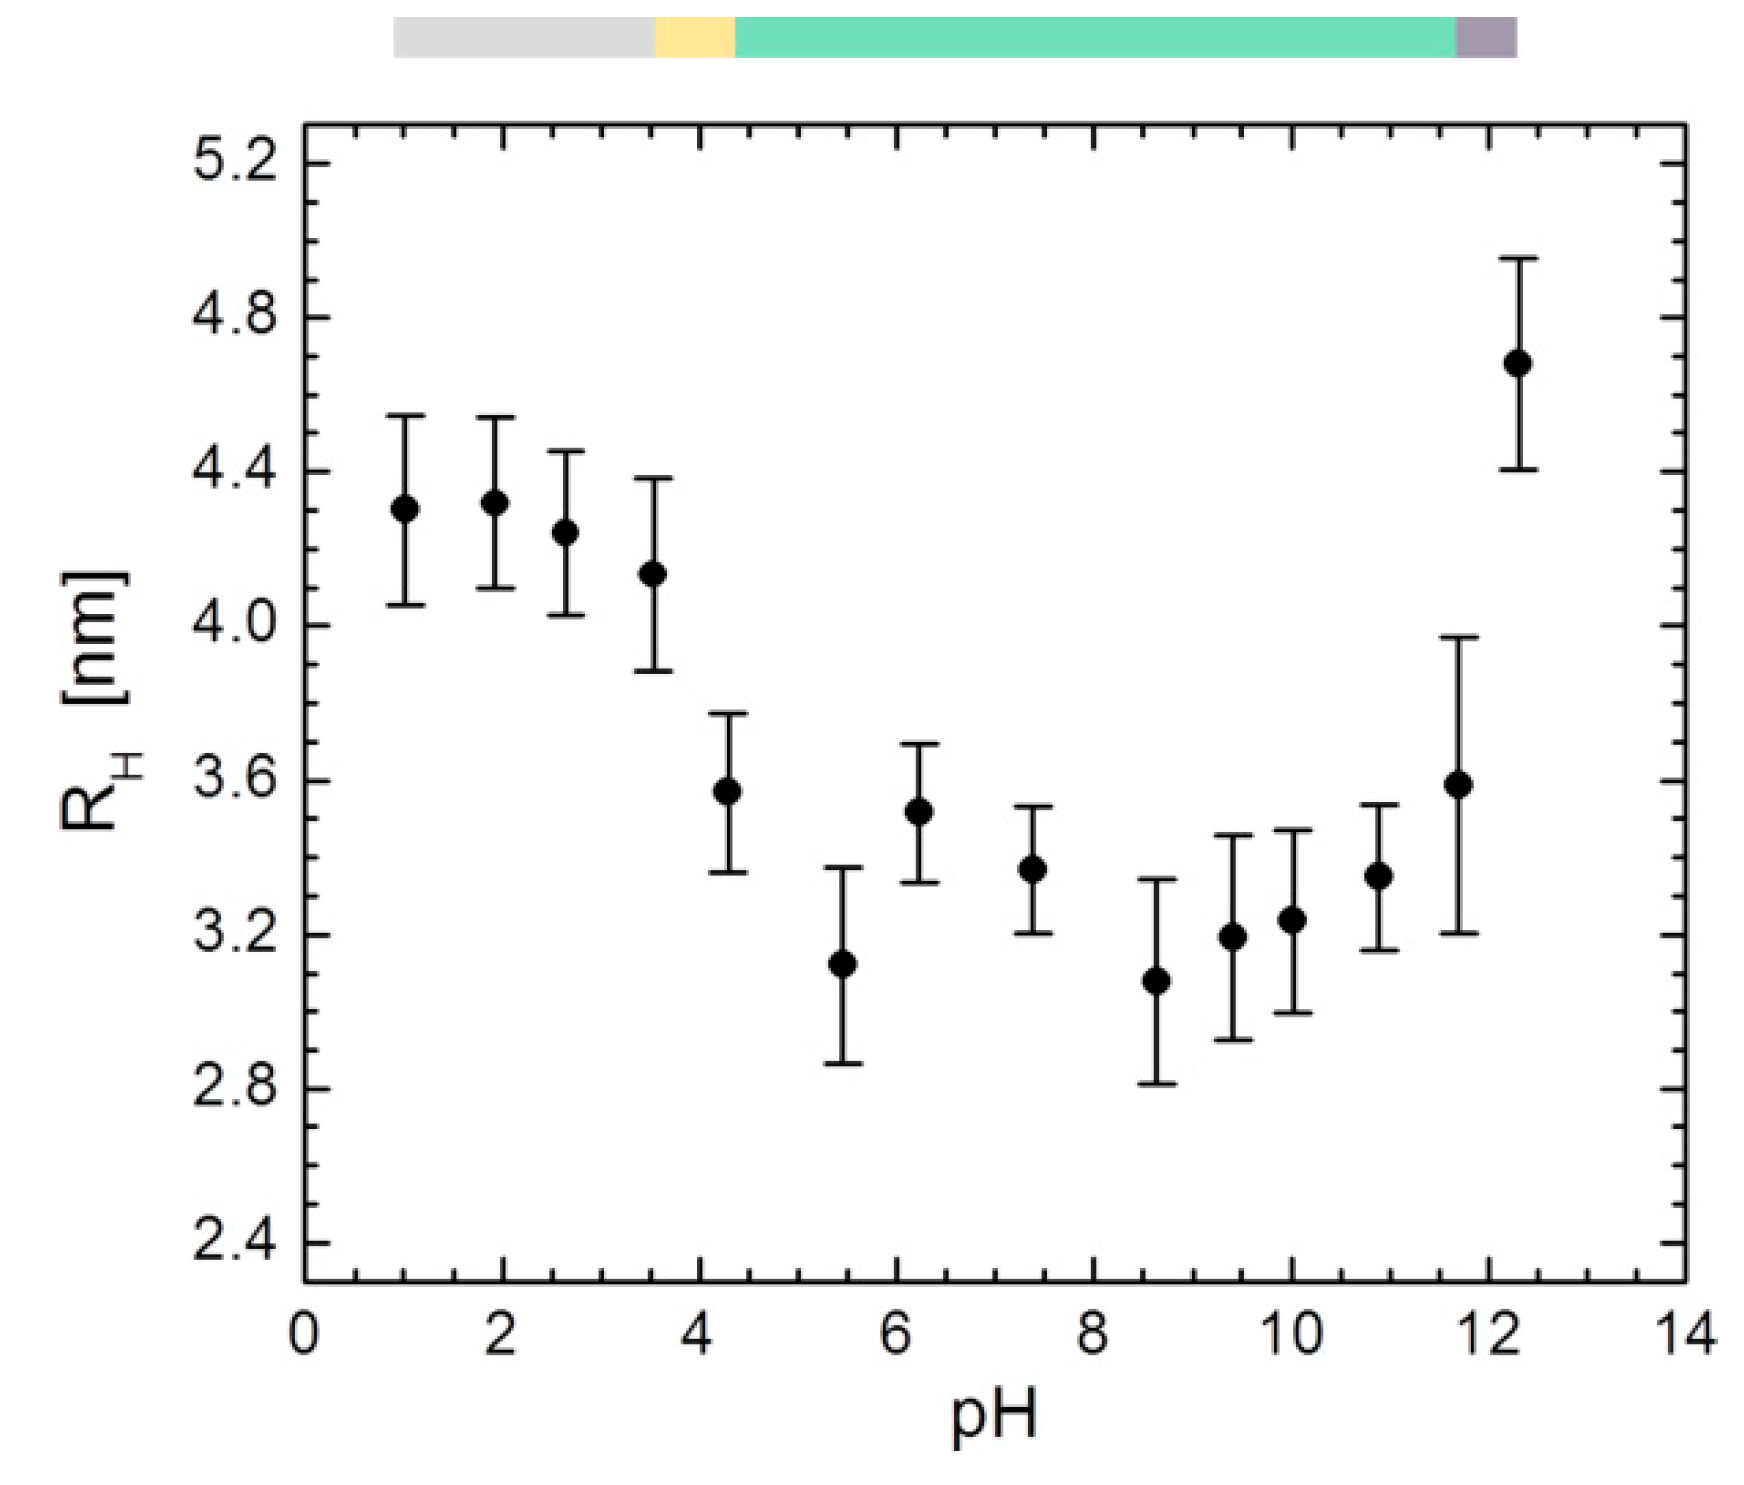
3.5. DLS Experiments on HSA between pH 1.01–12.31
4. Discussion
5. Conclusions
Supplementary Materials
Author Contributions
Funding
Acknowledgments
Conflicts of Interest
References
- Bugarszky, S.; Liebermann, L. Ueber das Bindungsvermögen eiweissartiger Körper für Salzsäure, Natriumhydroxyd und Kochsalz. Archiv für die gesamte Physiologie des Menschen und der Tiere 1898, 72, 51–74. [Google Scholar] [CrossRef]
- Linderström-Lang, K. Some electrochemical properties of a simple protein. Trans. Faraday Soc. 1935, 31, 324–335. [Google Scholar] [CrossRef]
- Tanford, C. Physical Chemistry of Macromolecules, 1st ed.; John Wiley & Sons, Inc.: New York, NY, USA, 1961; pp. 548–573. ISBN 0-471-84447-0. [Google Scholar]
- Yang, A.S.; Honig, B. On the pH Dependence of Protein Stability. J. Mol. Biol. 1993, 231, 459–474. [Google Scholar] [CrossRef] [PubMed]
- Onufriev, A.; Case, D.A.; Ullmann, G.M. A Novel View of pH Titration in Biomolecules. Biochemistry 2001, 40, 3413–3419. [Google Scholar] [CrossRef] [PubMed]
- Finkelstein, A.V.; Ptitsyn, O.B. Protein Physics: A Course of Lectures, 1st ed.; Academic Press: Boston, MA, USA, 2002; pp. 207–225. ISBN 0-12-256781-1. [Google Scholar]
- Berg, J.M.; Tymoczko, J.L.; Stryer, L. Biochemie, 7th ed.; Spektrum Akademischer Verlag: Heidelberg, Germany, 2007; pp. 25–39. ISBN 978-3-8274-2988-9. [Google Scholar]
- Li, H.; Robertson, A.D.; Jensen, J.H. Very Fast Empirical Prediction and Rationalization of Protein pKa Values. Proteins Struct. Funct. Bioinform. 2005, 61, 704–721. [Google Scholar] [CrossRef] [PubMed]
- Oosawa, F. Polyelectrolytes, 1st ed.; Marcel Dekker, Inc.: New York, NY, USA, 1971; ISBN 0824715055. [Google Scholar]
- Goto, Y.; Hagihara, Y.; Hamada, D.; Hoshino, M.; Nishii, I. Acid-Induced Unfolding and Refolding Transitions of Cytochrome c: A Three-State Mechanism in H2O and D2O. Biochemistry 1993, 32, 11878–11885. [Google Scholar] [CrossRef] [PubMed]
- Anfinsen, C.B. The Formation and Stabilization of Protein Structure. Biochem. J. 1972, 128, 737–749. [Google Scholar] [CrossRef] [PubMed]
- Kim, P.S.; Baldwin, R.L. Specific Intermediates in the Folding Reactions of Small Proteins and the Mechanism of Protein Folding. Ann. Rev. Biochem. 1982, 51, 459–489. [Google Scholar] [CrossRef] [PubMed]
- Ptitsyn, O.B. Protein Folding: Hypotheses and Experiments. J. Protein Chem. 1987, 6, 273–293. [Google Scholar] [CrossRef]
- Dill, K.A. Dominant Forces in Protein Folding. Biochemistry 1990, 29, 7133–7155. [Google Scholar] [CrossRef] [PubMed]
- Ohgushi, M.; Wada, A. ‘Molten-globule state’: A compact form of globular proteins with mobile side- chains. FEBS Lett. 1983, 164, 21–24. [Google Scholar] [CrossRef]
- Ptitsyn, O.B.; Uversky, V.N. The molten globule is a third thermodynamical state of protein molecules. FEBS Lett. 1994, 341, 15–18. [Google Scholar] [CrossRef] [Green Version]
- Dolgikh, D.A.; Gilmanshin, R.I.; Brazhnikov, E.V.; Bychkova, V.E.; Semisotnov, G.V.; Venyaminov, S.Y.; Ptitsyn, O.B. α-Lactalbumin: Compact State with Fluctuating Tertiary Structure. FEBS Lett. 1981, 136, 311–315. [Google Scholar] [CrossRef]
- Jennings, P.A.; Wright, P.E. Formation of a Molten Globule Intermediate Early in the Kinetic Folding Pathway of Apomyoglobin. Science 1993, 262, 892–896. [Google Scholar] [CrossRef] [PubMed]
- Stryer, L. The Interaction of a Naphthalene Dye with Apomyoglobin and Apohemoglobin. J. Mol. Biol. 1965, 13, 482–495. [Google Scholar] [CrossRef]
- Semisotnov, G.V.; Rodionova, N.A.; Razgulyaev, O.I.; Uversky, V.N.; Gripas, A.F.; Gilmanshin, R.I. Study of the ‘Molten Globule’ Intermediate State in Protein Folding by a Hydrophobic Fluorescent Probe. Biopolymers 1991, 31, 119–128. [Google Scholar] [CrossRef] [PubMed]
- Sheshadri, S.; Lingaraju, G.M.; Varadarajan, R. Denaturant mediated unfolding of both native and molten globule states of maltose binding protein are accompanied by large ΔCp’s. Protein Sci. 1999, 8, 1689–1695. [Google Scholar] [CrossRef] [PubMed]
- Kuwajima, K. The molten globule state of α-lactalbumin. FASEB J. 1996, 10, 102–109. [Google Scholar] [CrossRef] [PubMed]
- Yeh, Y.Q.; Liao, K.F.; Shih, O.; Shiu, Y.J.; Wu, W.R.; Su, C.J.; Lin, P.C.; Jeng, U.S. Probing the Acid-Induced Packing Structure Changes of the Molten Globule Domains of a Protein near Equilibrium Unfolding. J. Phys. Chem. Lett. 2017, 8, 470–477. [Google Scholar] [CrossRef] [PubMed]
- Del Giudice, A.; Dicko, C.; Galantini, L.; Pavel, N.V. Time-Dependent pH Scanning of the Acid-Induced Unfolding of Human Serum Albumin Reveals Stabilization of the Native Form by Palmitic Acid Binding. J. Phys. Chem. B 2017, 121, 4388–4399. [Google Scholar] [CrossRef] [PubMed]
- Pande, V.S.; Rokhsar, D.S. Is the molten globule a third phase of proteins? Proc. Natl. Acad. Sci. USA 1998, 95, 1490–1494. [Google Scholar] [CrossRef] [PubMed] [Green Version]
- Calciano, L.J.; Escobar, W.A.; Millhauser, G.L.; Miick, S.M.; Rubaloff, J.; Todd, A.P.; Fink, A.L. Side-Chain Mobility of the β-Lactamase A State Probed by Electron Spin Resonance Spectroscopy. Biochemistry 1993, 32, 5644–5649. [Google Scholar] [CrossRef] [PubMed]
- Reichenwallner, J.; Chakour, M.; Indu, S.; Varadarajan, R.; Trommer, W.E. Maltose Binding Protein Is Partially Structured in Its Molten Globule State. Appl. Magn. Reson. 2013, 44, 983–995. [Google Scholar] [CrossRef]
- Selmke, B.; Borbat, P.P.; Nickolaus, C.; Varadarajan, R.; Freed, J.H.; Trommer, W.E. Open and Closed Form of Maltose Binding Protein in Its Native and Molten Globule State as Studied by Electron Paramagnetic Resonance Spectroscopy. Biochemistry 2018. [Google Scholar] [CrossRef] [PubMed]
- Hubbell, W.L.; Altenbach, C. Investigation of structure and dynamics in membrane proteins using site-directed spin labeling. Curr. Opin. Struct. Biol. 1994, 4, 566–573. [Google Scholar] [CrossRef]
- Hubbell, W.L.; Cafiso, D.S.; Altenbach, C. Identifying conformational changes with site-directed spin labeling. Nat. Struct. Biol. 2000, 7, 735–739. [Google Scholar] [CrossRef] [PubMed]
- Morrisett, J.D.; Broomfield, C.A. Active Site Spin-Labeled α-Chymotrypsin. Guanidine Hydrochloride Denaturation Studies Using Electron Paramagnetic Resonance and Circular Dichroism. J. Am. Chem. Soc. 1971, 93, 7297–7304. [Google Scholar] [CrossRef] [PubMed]
- Berengian, A.R.; Parfenova, M.; Mchaourab, H.S. Site-directed Spin Labeling Study of Subunit Interactions in the α-Crystallin Domain of Small Heat-shock Proteins. J. Biol. Chem. 1999, 274, 6305–6314. [Google Scholar] [CrossRef] [PubMed]
- Muzammil, S.; Kumar, Y.; Tayyab, S. Molten globule-like state of human serum albumin at low pH. Eur. J. Biochem. 1999, 266, 26–32. [Google Scholar] [CrossRef] [PubMed] [Green Version]
- Dockal, M.; Carter, D.C.; Rüker, F. Conformational Transitions of the Three Recombinant Domains of Human Serum Albumin Depending on pH. J. Biol. Chem. 2000, 275, 3042–3050. [Google Scholar] [CrossRef] [PubMed] [Green Version]
- Sen, P.; Ahmad, B.; Khan, R.H. Formation of a molten globule like state in bovine serum albumin at alkaline pH. Eur. Biophys. J. 2008, 37, 1303–1308. [Google Scholar] [CrossRef] [PubMed]
- Yang, J.T.; Foster, J.F. Changes in the Intrinsic Viscosity and Optical Rotation of Bovine Plasma Albumin Associated with Acid Binding. J. Am. Chem. Soc. 1954, 76, 1588–1595. [Google Scholar] [CrossRef]
- Stone, T.J.; Buckman, T.; Nordio, P.L.; McConnell, H.M. Spin-Labeled Biomolecules. Proc. Natl. Acad. Sci. USA 1965, 54, 1010–1017. [Google Scholar] [CrossRef] [PubMed]
- Sali, A.; Shakhnovich, E.; Karplus, M. How does a protein fold? Nature 1994, 369, 248–251. [Google Scholar] [CrossRef] [PubMed]
- Rehfeld, S.J.; Eatough, D.J.; Plachy, W.Z. The binding isotherms for the interaction of 5-doxyl stearic acid with bovine and human albumin. J. Lipid Res. 1978, 19, 841–849. [Google Scholar] [PubMed]
- Gantchev, T.G.; Shopova, M.B. Characterization of spin-labelled fatty acids and hematoporphyrin binding sites interactions in serum albumin. Biochim. Biophys. Acta Protein Struct. Mol. Enzymol. 1990, 1037, 422–434. [Google Scholar] [CrossRef]
- Ge, M.; Rananavare, S.B.; Freed, J.H. ESR studies of stearic acid binding to bovine serum albumin. Biochim. Biophys. Acta Gen. Subj. 1990, 1036, 228–236. [Google Scholar] [CrossRef]
- Muravsky, V.; Gurachevskaya, T.; Berezenko, S.; Schnurr, K.; Gurachevsky, A. Fatty acid binding sites of human and bovine albumins: Differences observed by spin probe ESR. Spectrochim. Acta Part A 2009, 74, 42–47. [Google Scholar] [CrossRef] [PubMed]
- Pavicevic, A.A.; Popovic-Bijelic, A.D.; Mojovic, M.D.; Susnjar, S.V.; Bacic, G.G. Binding of Doxyl Stearic Spin Labels to Human Serum Albumin: An EPR Study. J. Phys. Chem. B 2014, 118, 10898–10905. [Google Scholar] [CrossRef] [PubMed]
- Junk, M.J.N.; Spiess, H.W.; Hinderberger, D. The Distribution of Fatty Acids Reveals the Functional Structure of Human Serum Albumin. Angew. Chem. Int. Ed. 2010, 49, 8755–8759. [Google Scholar] [CrossRef] [PubMed]
- Junk, M.J.N.; Spiess, H.W.; Hinderberger, D. Characterization of the Solution Structure of Human Serum Albumin Loaded with a Metal Porphyrin and Fatty Acids. Biophys. J. 2011, 100, 2293–2301. [Google Scholar] [CrossRef] [PubMed]
- Junk, M.J.N.; Spiess, H.W.; Hinderberger, D. DEER in biological multispin-systems: A case study on the fatty acid binding to human serum albumin. J. Magn. Reson. 2011, 210, 210–217. [Google Scholar] [CrossRef] [PubMed]
- Akdogan, Y.; Reichenwallner, J.; Hinderberger, D. Evidence for Water-Tuned Structural Differences in Proteins: An Approach Emphasizing Variations in Local Hydrophilicity. PLoS ONE 2012, 7, e45681. [Google Scholar] [CrossRef] [PubMed]
- Akdogan, Y.; Junk, M.J.N.; Hinderberger, D. Effect of Ionic Liquids on the Solution Structure of Human Serum Albumin. Biomacromolecules 2011, 12, 1072–1079. [Google Scholar] [CrossRef] [PubMed]
- Akdogan, Y.; Hinderberger, D. Solvent-Induced Protein Refolding at Low Temperatures. J. Phys. Chem. B 2011, 115, 15422–15429. [Google Scholar] [CrossRef] [PubMed]
- Reichenwallner, J.; Hinderberger, D. Using bound fatty acids to disclose the functional structure of serum albumin. Biochim. Biophys. Acta Gen. Subj. 2013, 1830, 5382–5393. [Google Scholar] [CrossRef] [PubMed]
- Wallevik, K. Reversible Denaturation of Human Serum Albumin by pH, Temperature, and Guanidine Hydrochloride Followed by Optical Rotation. J. Biol. Chem. 1973, 248, 2650–2655. [Google Scholar] [PubMed]
- Peters, T., Jr. All about Albumin: Biochemistry, Genetics, and Medical Applications, 1st ed.; Academic Press, Inc.: San Diego, CA, USA; New York, NY, USA; Boston, MA, USA, 1996; pp. 54–75. ISBN 0-12-552110-3. [Google Scholar]
- Qiu, W.; Zhang, L.; Okobiah, O.; Yang, Y.; Wang, L.; Zhong, D.; Zewail, A.H. Ultrafast Solvation Dynamics of Human Serum Albumin: Correlations with Conformational Transitions and Site-Selected Recognition. J. Phys. Chem. B 2006, 110, 10540–10549. [Google Scholar] [CrossRef] [PubMed] [Green Version]
- Griffith, O.H.; McConnell, H.M. A Nitroxide-Maleimide Spin Label. Proc. Natl. Acad. Sci. USA 1966, 55, 8–11. [Google Scholar] [CrossRef] [PubMed]
- Barratt, M.D.; Davies, A.P.; Evans, M.T.A. Maleimide and Isomaleimide Pyrrolidine-Nitroxide Spin Labels. Eur. J. Biochem. 1971, 24, 280–283. [Google Scholar] [CrossRef] [PubMed]
- Cornell, C.N.; Kaplan, L.J. Spin-Label Studies of the Sulfhydryl Environment in Bovine Plasma Albumin. 1. The N–F Transition and Acid Expansion. Biochemistry 1978, 17, 1750–1754. [Google Scholar] [CrossRef] [PubMed]
- Cornell, C.N.; Kaplan, L.J. Spin-Label Studies of the Sulfhydryl Environment in Bovine Plasma Albumin. 2. The neutral transition and the A isomer. Biochemistry 1978, 17, 1755–1758. [Google Scholar] [CrossRef] [PubMed]
- Marzola, P.; Pinzino, C.; Veracini, C.A. Spin-Labeling Study of Human Serum Albumin in Reverse Micelles. Langmuir 1991, 7, 238–242. [Google Scholar] [CrossRef]
- Livshits, V.A.; Marsh, D. Fatty acid binding sites of serum albumin probed by non-linear spin-label EPR. Biochim. Biophys. Acta Biomembr. 2000, 1466, 350–360. [Google Scholar] [CrossRef]
- Alonso, A.; dos Santos, W.P.; Leonor, S.J.; dos Santos, J.G.; Tabak, M. Stratum Corneum Protein Dynamics as Evaluated by a Spin-Label Maleimide Derivative: Effect of Urea. Biophys. J. 2001, 81, 3566–3576. [Google Scholar] [CrossRef] [Green Version]
- De Simone, F.; Guzzi, R.; Sportelli, L.; Marsh, D.; Bartucci, R. Electron spin-echo studies of spin-labelled lipid membranes and free fatty acids interacting with human serum albumin. Biochim. Biophys. Acta Biomembr. 2007, 1768, 1541–1549. [Google Scholar] [CrossRef] [PubMed] [Green Version]
- Anjos, J.L.V.; Santiago, P.S.; Tabak, M.; Alonso, A. On the interaction of bovine serum albumin with ionic surfactants: Temperature induced EPR changes of a maleimide nitroxide reflect local protein dynamics and probe solvent accessibility. Colloids Surf. B 2011, 88, 463–470. [Google Scholar] [CrossRef] [PubMed]
- Pavicevic, A.; Luo, J.; Popovic-Bijelic, A.; Mojovic, M. Maleimido-proxyl as an EPR spin label for the evaluation of conformational changes of albumin. Eur. Biophys. J. 2017, 46, 773–787. [Google Scholar] [CrossRef] [PubMed]
- Dulbecco, R.; Vogt, M. Plaque Formation and Isolation of Pure Lines with Poliomyelitis Viruses. J. Exp. Med. 1954, 99, 167–182. [Google Scholar] [CrossRef] [PubMed]
- Bas, D.C.; Rogers, D.M.; Jensen, J.H. Very fast prediction and rationalization of pKa values for protein-ligand complexes. Proteins Struct. Funct. Bioinform. 2008, 73, 765–783. [Google Scholar] [CrossRef] [PubMed]
- Olsson, M.H.M.; Sondergaard, C.R.; Rostkowski, M.; Jensen, J.H. PROPKA3: Consistent Treatment of Internal and Surface Residues in Empirical pKa Predictions. J. Chem. Theory Comput. 2011, 7, 525–537. [Google Scholar] [CrossRef] [PubMed]
- Sugio, S.; Kashima, A.; Mochizuki, S.; Noda, M.; Kobayashi, K. Crystal structure of human serum albumin at 2.5 Å resolution. Protein Eng. 1999, 12, 439–446. [Google Scholar] [CrossRef] [PubMed] [Green Version]
- Bhattacharya, A.A.; Grüne, T.; Curry, S. Crystallographic Analysis Reveals Common Modes of Binding of Medium and Long-chain Fatty Acids to Human Serum Albumin. J. Mol. Biol. 2000, 303, 721–732. [Google Scholar] [CrossRef] [PubMed]
- Bradford, M.M. A Rapid and Sensitive Method for the Quantitation of Microgram Quantities of Protein Utilizing the Principle of Protein-Dye Binding. Anal. Biochem. 1976, 72, 248–254. [Google Scholar] [CrossRef]
- Smith, P.K.; Krohn, R.I.; Hermanson, G.T.; Mallia, A.K.; Gartner, F.H.; Provenzano, M.D.; Fujimoto, E.K.; Goeke, N.M.; Olson, B.J.; Klenk, D.C. Measurement of Protein Using Bicinchoninic Acid. Anal. Biochem. 1985, 150, 76–85. [Google Scholar] [CrossRef]
- Provencher, S.W. A Constrained Regularization Method for Inverting Data Represented by Linear Algebraic or Integral Equations. Comput. Phys. Commun. 1982, 27, 213–227. [Google Scholar] [CrossRef]
- Schiebener, P.; Straub, J.; Levelt Sengers, J.M.H.; Gallagher, J.S. Refractive index of water and steam as function of wavelength, temperature and density. J. Phys. Chem. Ref. Data 1990, 19, 677–717. [Google Scholar] [CrossRef]
- Sheely, M.L. Glycerol Viscosity Tables. Ind. Eng. Chem. 1932, 24, 1060–1064. [Google Scholar] [CrossRef]
- Booth, F. The electroviscous effect for suspensions of solid spherical particles. Proc. R. Soc. Lond. Ser. A 1950, 203, 533–551. [Google Scholar] [CrossRef]
- Tanford, C.; Buzzell, J.G. The Viscosity of Aqueous Solutions of Bovine Serum Albumin between pH 4.3 and 10.5. J. Phys. Chem. 1956, 60, 225–231. [Google Scholar] [CrossRef]
- Steinhoff, H.J.; Lieutenant, K.; Schlitter, J. Residual Motion of Hemoglobin-Bound Spin Labels as a Probe for Protein Dynamics. Z. Naturforsch. C 1989, 44, 280–288. [Google Scholar] [CrossRef] [PubMed]
- Martin, R.E.; Pannier, M.; Diederich, F.; Gramlich, V.; Hubrich, M.; Spiess, H.W. Determination of End-to-End Distances in a Series of TEMPO Diradicals of up to 2.8 nm Length with a New Four-Pulse Double Electron Electron Resonance Experiment. Angew. Chem. Int. Ed. 1998, 37, 2834–2837. [Google Scholar] [CrossRef]
- Pannier, M.; Veit, S.; Godt, A.; Jeschke, G.; Spiess, H.W. Dead-Time Free Measurement of Dipole-Dipole Interactions between Electron Spins. J. Magn. Reson. 2000, 142, 331–340. [Google Scholar] [CrossRef] [PubMed]
- Waggoner, A.S.; Griffith, O.H.; Christensen, C.R. Magnetic Resonance of Nitroxide Probes in Micelle-Containing Solutions. Proc. Natl. Acad. Sci. USA 1967, 57, 1198–1205. [Google Scholar] [CrossRef] [PubMed]
- Bulla, I.; Törmälä, P.; Lindberg, J.J. Spin Probe Studies on the Dynamic Structure of Dimethyl Sulfoxide- Water Mixtures. Acta Chem. Scand. Ser. A 1975, 29, 89–92. [Google Scholar] [CrossRef]
- Meirovitch, E.; Freed, J.H. Analysis of Slow-Motional Electron Spin Resonance Spectra in Smectic Phases in Terms of Molecular Configuration, Intermolecular Interactions, and Dynamics. J. Phys. Chem. 1984, 88, 4995–5004. [Google Scholar] [CrossRef]
- Navari-Izzo, F.; Quartacci, M.F.; Pinzino, C.; Rascio, N.; Vazzana, C.; Sgherri, C.L.M. Protein Dynamics in Thylakoids of the Desiccation-Tolerant Plant Boea hygroscopica during Dehydration and Rehydration. Plant Physiol. 2000, 124, 1427–1436. [Google Scholar] [CrossRef] [PubMed]
- Stoll, S.; Schweiger, A. EasySpin, a comprehensive software package for spectral simulation and analysis in EPR. J. Magn. Reson. 2006, 178, 42–55. [Google Scholar] [CrossRef] [PubMed] [Green Version]
- Reichenwallner, J.; Thomas, A.; Nuhn, L.; Johann, T.; Meister, A.; Frey, H.; Hinderberger, D. Tunable dynamic hydrophobic attachment of guest molecules in amphiphilic core-shell polymers. Polym. Chem. 2016, 7, 5783–5798. [Google Scholar] [CrossRef]
- Strancar, J.; Koklic, T.; Arsov, Z.; Filipic, B.; Stopar, D.; Hemminga, M.A. Spin Label EPR-Based Characteri-zation of Biosystem Complexity. J. Chem. Inf. Model. 2005, 45, 394–406. [Google Scholar] [CrossRef] [PubMed]
- Jeschke, G.; Chechik, V.; Ionita, P.; Godt, A.; Zimmermann, H.; Banham, J.; Timmel, C.R.; Hilger, D.; Jung, H. DeerAnalysis2006—A Comprehensive Software Package for Analyzing Pulsed ELDOR Data. Appl. Magn. Reson. 2006, 30, 473–498. [Google Scholar] [CrossRef]
- Kattnig, D.R.; Reichenwallner, J.; Hinderberger, D. Modeling Excluded Volume Effects for the Faithful Description of the Background Signal in Double Electron-Electron Resonance. J. Phys. Chem. B 2013, 117, 16542–16557. [Google Scholar] [CrossRef] [PubMed]
- Gumpen, S.; Hegg, P.O.; Martens, H. Thermal Stability of Fatty Acid-Serum Albumin Complexes Studied by Differential Scanning Calorimetry. Biochim. Biophys. Acta Lipids Lipid Metab. 1979, 574, 189–196. [Google Scholar] [CrossRef]
- Shrake, A.; Ross, P.D. Biphasic Denaturation of Human Albumin Due to Ligand Redistribution during Unfolding. J. Biol. Chem. 1988, 263, 15392–15399. [Google Scholar] [PubMed]
- Evenson, M.A.; Deutsch, H.F. Influence of Fatty Acids on the Isoelectric Point Properties of Human Serum Albumin. Clin. Chim. Acta 1978, 89, 341–354. [Google Scholar] [CrossRef]
- Dockal, M.; Carter, D.C.; Rüker, F. The Three Recombinant Domains of Human Serum Albumin. Structural Characterization and Ligand Binding Properties. J. Biol. Chem. 1999, 274, 29303–29310. [Google Scholar] [CrossRef] [PubMed]
- Langer, K.; Balthasar, S.; Vogel, V.; Dinauer, N.; von Briesen, H.; Schubert, D. Optimization of the preparation process for human serum albumin (HSA) nanoparticles. Int. J. Pharm. 2003, 257, 169–180. [Google Scholar] [CrossRef] [Green Version]
- Jachimska, B.; Wasilewska, M.; Adamczyk, Z. Characterization of Globular Protein Solutions by Dynamic Light Scattering, Electrophoretic Mobility, and Viscosity Measurements. Langmuir 2008, 24, 6866–6872. [Google Scholar] [CrossRef] [PubMed]
- Hubbell, W.L.; McConnell, H.M. Molecular Motion in Spin-Labeled Phospholipids and Membranes. J. Am. Chem. Soc. 1971, 93, 314–326. [Google Scholar] [CrossRef] [PubMed]
- Wa, C.; Cerny, R.L.; Clarke, W.A.; Hage, D.S. Characterization of glycation adducts on human serum albumin by matrix-assisted laser desorption/ionization time-of-flight mass spectrometry. Clin. Chim. Acta 2007, 385, 48–60. [Google Scholar] [CrossRef] [PubMed] [Green Version]
- Oettl, K.; Marsche, G. Redox State of Human Serum Albumin in Terms of Cysteine-34 in Health and Disease. Methods Enzymol. 2010, 474, 181–195. [Google Scholar] [CrossRef] [PubMed]
- Anraku, M.; Chuang, V.T.G.; Maruyama, T.; Otagiri, M. Redox properties of serum albumin. Biochim. Biophys. Acta Gen. Subj. 2013, 1830, 5465–5472. [Google Scholar] [CrossRef] [PubMed]
- Bonanata, J.; Turell, L.; Antmann, L.; Ferrer-Sueta, G.; Botasini, S.; Mendez, E.; Alvarez, B.; Coitino, E.L. The thiol of human serum albumin: Acidity, microenvironment and mechanistic insights on its oxidation to sulfenic acid. Free Radic. Biol. Med. 2017, 108, 952–962. [Google Scholar] [CrossRef] [PubMed]
- Wurm, F.; Steinbach, T.; Klok, H.A. One-pot squaric acid diester mediated aqueous protein conjugation. Chem. Commun. 2013, 49, 7815–7817. [Google Scholar] [CrossRef] [PubMed]
- Khan, M.N.; Khan, A.A. Kinetics and Mechanism of Hydrolysis of Succinimide under Highly Alkaline Medium. J. Org. Chem. 1975, 40, 1793–1794. [Google Scholar] [CrossRef]
- Matsui, S.; Aida, H. Hydrolysis of Some N-Alkylmaleimides. J. Chem. Soc. Perkin Trans. 1978, 2, 1277–1280. [Google Scholar] [CrossRef]
- Boyatzis, A.E.; Bringans, S.D.; Piggott, M.J.; Duong, M.N.; Lipscombe, R.J.; Arthur, P.G. Limiting the Hydrolysis and Oxidation of Maleimide-Peptide Adducts Improves Detection of Protein Thiol Oxidation. J. Proteome Res. 2017, 16, 2004–2015. [Google Scholar] [CrossRef] [PubMed]
- Applequist, J.; Doty, P. α-Helix Formation in Poly-ε-Carbobenzoxy-l-Lysine and Poly-l-Lysine. In Polyamino Acids, Polypeptides, and Proteins; Stahmann, M.A., Ed.; The University of Wisconsin Press: Madison, WI, USA, 1962; pp. 161–177. ISBN 0299026205. [Google Scholar]
- Cistola, D.P.; Small, D.M.; Hamilton, J.A. Ionization behavior of aqueous short-chain carboxylic acids: A carbon-13 NMR study. J. Lipid Res. 1982, 23, 795–799. [Google Scholar] [PubMed]
- Cistola, D.P.; Small, D.M.; Hamilton, J.A. Carbon 13 NMR Studies of Saturated Fatty Acids Bound to Bovine Serum Albumin. II. Electrostatic Interactions in Individual Fatty Acid Binding Sites. J. Biol. Chem. 1987, 262, 10980–10985. [Google Scholar] [PubMed]
- Sukhija, P.S.; Palmquist, D.L. Nutrition, Feeding, and Calves. Dissociation of Calcium Soaps of Long- Chain Fatty Acids in Rumen Fluid. J. Dairy Sci. 1990, 73, 1784–1787. [Google Scholar] [CrossRef]
- de la Caba, K.; Pena, C.; Ciannamea, E.M.; Stefani, P.M.; Mondragon, I.; Ruseckaite, R.A. Characterization of Soybean Protein Concentrate—Stearic Acid/Palmitic Acid Blend Edible Films. J. Appl. Polym. Sci. 2012, 124, 1796–1807. [Google Scholar] [CrossRef]
- Scheider, W.; Fuller, J.K. An effective method for defatting albumin using resin columns. Biochim. Biophys. Acta Protein Struct. 1970, 221, 376–378. [Google Scholar] [CrossRef]
- Molin, Y.N.; Salikhov, K.M.; Zamaraev, K.I. Spin Exchange: Principles and Applications in Chemistry and Biology, 1st ed.; Springer: Berlin/Heidelberg, Germany, 1980; ISBN 3-540-10095-4. [Google Scholar]
- Gurachevsky, A.; Shimanovitch, E.; Gurachevskaya, T.; Muravsky, V. Intra-albumin migration of bound fatty acid probed by spin label ESR. Biochem. Biophys. Res. Commun. 2007, 360, 852–856. [Google Scholar] [CrossRef] [PubMed]
- Seelig, J. Anisotropic Motion in Liquid Crystalline Structures. In Spin Labeling: Theory and Applications, 1st ed.; Berliner, L.J., Ed.; Academic Press, Inc.: New York, NY, USA, 1976; Volume 1, pp. 373–409. ISBN 0-12-092350-5. [Google Scholar]
- Reichenwallner, J.; Schwieger, C.; Hinderberger, D. Probing the Nanoscopic Thermodynamic Fingerprint of Paramagnetic Ligands Interacting with Amphiphilic Macromolecules. Polymers 2017, 9, 324. [Google Scholar] [CrossRef]
- Nelder, J.A. Inverse Polynomials, a Useful Group of Multi-Factor Response Functions. Biometrics 1966, 22, 128–141. [Google Scholar] [CrossRef]
- Sutherland, R.A.; Wright, C.C.; Verstraeten, L.M.J.; Greenwood, D.J. The deficiency of the ‘economic optimum’ application for evaluating models which predict crop yield response to nitrogen fertilizer. Fertil. Res. 1986, 10, 251–262. [Google Scholar] [CrossRef]
- Catillo, G.; Macciotta, N.P.P.; Carretta, A.; Cappio-Borlino, A. Effects of Age and Calving Season on Lactation Curves of Milk Production Traits in Italian Water Buffaloes. J. Dairy Sci. 2002, 85, 1298–1306. [Google Scholar] [CrossRef]
- Griffith, O.H.; Jost, P.C. Lipid Spin Labels in Biological Membranes. In Spin Labeling: Theory and Applications, 1st ed.; Berliner, L.J., Ed.; Academic Press, Inc.: New York, NY, USA, 1976; Volume 1, pp. 453–523. ISBN 0-12-092350-5. [Google Scholar]
- Griffith, O.H.; Dehlinger, P.J.; Van, S.P. Shape of the Hydrophobic Barrier of Phospholipid Bilayers (Evidence for Water Penetration in Biological Membranes). J. Membr. Biol. 1974, 15, 159–192. [Google Scholar] [CrossRef] [PubMed]
- Steinhoff, H.J.; Savitsky, A.; Wegener, C.; Pfeiffer, M.; Plato, M.; Möbius, K. High-field EPR studies of the structure and conformational changes of site-directed spin labeled bacteriorhodopsin. Biochim. Biophys. Acta Bioenerg. 2000, 1457, 253–262. [Google Scholar] [CrossRef]
- Gumbel, E.J. Bivariate Logistic Distributions. J. Am. Stat. Assoc. 1961, 56, 335–349. [Google Scholar] [CrossRef]
- Caramelo, J.J.; Castro, O.A.; Alonso, L.G.; de Prat-Gay, G.; Parodi, A.J. UDP-Glc:glycoprotein glucosyl-transferase recognizes structured and solvent accessible hydrophobic patches in molten globule-like folding intermediates. Proc. Natl. Acad. Sci. USA 2003, 100, 86–91. [Google Scholar] [CrossRef] [PubMed]
- Saupe, A.; Maier, W. Methoden zur Bestimmung des Ordnungsgrades nematischer kristallinflüssiger Schichten. Der Ordnungsgrad von Azoxyanisol. Z. Naturforsch. A Phys. Sci. 1961, 16, 816–824. [Google Scholar] [CrossRef]
- Saupe, A. Kernresonanzen in kristallinen Flüssigkeiten und in kristallinflüssigen Lösungen. Teil I. Z. Naturforsch. A Phys. Sci. 1964, 19, 161–171. [Google Scholar] [CrossRef]
- Chin, J.H.; Goldstein, D.B. Drug Tolerance in Biomembranes: A Spin Label Study of the Effects of Ethanol. Science 1977, 196, 684–685. [Google Scholar] [CrossRef] [PubMed]
- Shin, Y.K.; Freed, J.H. Dynamic imaging of lateral diffusion by electron spin resonance and study of rotational dynamics in model membranes. Biophys. J. 1989, 55, 537–550. [Google Scholar] [CrossRef]
- Birmachu, W.; Voss, J.C.; Louis, C.F.; Thomas, D.D. Protein and Lipid Rotational Dynamics in Cardiac and Skeletal Sarcoplasmic Reticulum Detected by EPR and Phosphorescence Anisotropy. Biochemistry 1993, 32, 9445–9453. [Google Scholar] [CrossRef] [PubMed]
- Cassera, M.B.; Silber, A.M.; Gennaro, A.M. Differential effects of cholesterol on acyl chain order in erythrocyte membranes as a function of depth from the surface. An electron paramagnetic resonance (EPR) spin label study. Biophys. Chem. 2002, 99, 117–127. [Google Scholar] [CrossRef]
- Subczynski, W.K.; Widomska, J.; Feix, J.B. Physical properties of lipid bilayers from EPR spin labeling and their influence on chemical reactions in a membrane environment. Free Radic. Biol. Med. 2009, 46, 707–718. [Google Scholar] [CrossRef] [PubMed] [Green Version]
- Stepien, P.; Polit, A.; Wisniewska-Becker, A. Comparative EPR studies on lipid bilayer properties in nanodiscs and liposomes. Biochim. Biophys. Acta Biomembr. 2015, 1848, 60–66. [Google Scholar] [CrossRef] [PubMed]
- Rozenfeld, J.H.K.; Duarte, E.L.; Oliveira, T.R.; Lamy, M.T. Structural insights on biologically relevant cationic membranes by ESR spectroscopy. Biophys. Rev. 2017, 9, 633–647. [Google Scholar] [CrossRef] [PubMed] [Green Version]
- Vieria, E.D.; Basso, L.G.M.; Costa-Filho, A.J. Non-linear van’t Hoff behavior in pulmonary surfactant model membranes. Biochim. Biophys. Acta Biomembr. 2017, 1859, 1133–1143. [Google Scholar] [CrossRef] [PubMed]
- Gaffney, B.J. The Paramagnetic Resonance Spectra of Spin Labels in Phospholipid Membranes. J. Magn. Reson. 1974, 16, 1–28. [Google Scholar] [CrossRef]
- Morrisett, J.D.; Pownall, H.J.; Gotto, A.M., Jr. Bovine Serum Albumin: Study of the Fatty Acid and Steroid Binding Sites Using Spin-Labeled Lipids. J. Biol. Chem. 1975, 250, 2487–2494. [Google Scholar] [PubMed]
- Goodman, D.S. The Interaction of Human Serum Albumin with Long-chain Fatty Acid Anions. J. Am. Chem. Soc. 1958, 80, 3892–3898. [Google Scholar] [CrossRef]
- Spector, A.A. Fatty acid binding to plasma albumin. J. Lipid Res. 1975, 16, 165–179. [Google Scholar] [PubMed]
- Jost, P.; Libertini, L.J.; Hebert, V.C. Lipid Spin Labels in Lecithin Multilayers. A Study of Motion Along Fatty Acid Chains. J. Mol. Biol. 1971, 59, 77–98. [Google Scholar] [CrossRef]
- Van, S.P.; Birrell, G.B.; Griffith, O.H. Rapid Anisotropic Motion of Spin Labels. Models for Motion Averaging of the ESR Parameters. J. Magn. Reson. 1974, 15, 444–459. [Google Scholar] [CrossRef]
- Israelachvili, J.; Sjösten, J.; Eriksson, L.E.G.; Ehrström, M.; Gräslund, A.; Ehrenberg, A. Theoretical Analysis of the Molecular Motion of Spin Labels in Membranes. ESR Spectra of Labeled Bacillus Subtilis Membranes. Biochim. Biophys. Acta Biomembr. 1974, 339, 164–172. [Google Scholar] [CrossRef]
- Hilger, D.; Jung, H.; Padan, E.; Wegener, C.; Vogel, K.P.; Steinhoff, H.J.; Jeschke, G. Assessing Oligomeri-zation of Membrane Proteins by Four-Pulse DEER: pH-Dependent Dimerization of NhaA Na+/H+ Antiporter of E. coli. Biophys. J. 2005, 89, 1328–1338. [Google Scholar] [CrossRef] [PubMed]
- Mao, Q.; Schleidt, S.; Zimmermann, H.; Jeschke, G. A pulsed EPR study of surfactant layer structure in composites of a synthetic layered silicate with polystyrene and polycaprolactone. Phys. Chem. Chem. Phys. 2008, 10, 1156–1167. [Google Scholar] [CrossRef] [PubMed]
- Bode, B.E.; Dastvan, R.; Prisner, T.F. Pulsed electron-electron double resonance (PELDOR) distance measurements in detergent micelles. J. Magn. Reson. 2011, 211, 11–17. [Google Scholar] [CrossRef] [PubMed]
- Kattnig, D.R.; Hinderberger, D. Analytical distance distributions in systems of spherical symmetry with applications to double electron-electron resonance. J. Magn. Reson. 2013, 230, 50–63. [Google Scholar] [CrossRef] [PubMed]
- Bode, B.E.; Margraf, D.; Plackmeyer, J.; Dürner, G.; Prisner, T.F.; Schiemann, O. Counting the Monomers in Nanometer-Sized Oligomers by Pulsed Electron-Electron Double Resonance. J. Am. Chem. Soc. 2007, 129, 6736–6745. [Google Scholar] [CrossRef] [PubMed]
- Rescic, J.; Vlachy, V.; Jamnik, A.; Glatter, O. Osmotic Pressure, Small-Angle X-Ray, and Dynamic Light Scattering Studies of Human Serum Albumin in Aqueous Solutions. J. Colloid Interface Sci. 2001, 239, 49–57. [Google Scholar] [CrossRef] [PubMed]
- Taboada, P.; Gutierrez-Pichel, M.; Mosquera, V. Effects of the Molecular Structure of Two Amphiphilic Antidepressant Drugs on the Formation of Complexes with Human Serum Albumin. Biomacromolecules 2004, 5, 1116–1123. [Google Scholar] [CrossRef] [PubMed]
- Wang, W.; Tang, J.; Peng, X.; Hu, Z.; Chen, X. A laser light scattering study of the interaction between human serum albumin and ampicillin sodium. Sci. China Ser. B Chem. 2006, 49, 332–337. [Google Scholar] [CrossRef]
- Tanford, C.; Buzzell, J.G.; Rands, D.G.; Swanson, S.A. The Reversible Expansion of Bovine Serum Albumin in Acid Solutions. J. Am. Chem. Soc. 1955, 77, 6421–6428. [Google Scholar] [CrossRef]
- Kaszuba, M.; McKnight, D.; Connah, M.T.; McNeil-Watson, F.K.; Nobbmann, U. Measuring sub nanometre sizes using dynamic light scattering. J. Nanopart. Res. 2008, 10, 823–829. [Google Scholar] [CrossRef]
- Giannoulis, A.; Ackermann, K.; Spindler, P.E.; Higgins, C.; Cordes, D.B.; Slawin, A.M.Z.; Prisner, T.F.; Bode, B.E. Nitroxide-nitroxide and nitroxide-metal distance measurements in transition metal complexes with two or three paramagnetic centres give access to thermodynamic and kinetic stabilities. Phys. Chem. Chem. Phys. 2018, 20, 11196–11205. [Google Scholar] [CrossRef] [PubMed]
- Saroff, H.A. A Theory for the Binding of Chloride Ions to Serum Albumin Based on a Hydrogen Bonded Model. J. Phys. Chem. 1957, 61, 1364–1368. [Google Scholar] [CrossRef]
- Wallach, D.F.H.; Verma, S.P.; Weidekamm, E.; Bieri, V. Hydrophobic Binding Sites in Bovine Serum Albumin and Erythrocyte Ghost Proteins. Study by Spin-Labelling, Paramagnetic Fluorescence Quen-ching and Chemical Modification. Biochim. Biophys. Acta Biomembr. 1974, 356, 68–81. [Google Scholar] [CrossRef]
- Curry, S.; Mandelkow, H.; Brick, P.; Franks, N. Crystal structure of human serum albumin complexed with fatty acid reveals an asymmetric distribution of binding sites. Nat. Struct. Biol. 1998, 5, 827–835. [Google Scholar] [CrossRef] [PubMed]
- Curry, S.; Brick, P.; Franks, N.P. Fatty acid binding to human serum albumin: New insights from crystallo- graphic studies. Biochim. Biophys. Acta Mol. Cell. Biol. Lipids 1999, 1441, 131–140. [Google Scholar] [CrossRef]
- Jeschke, G. DEER Distance Measurements on Proteins. Annu. Rev. Phys. Chem. 2012, 63, 419–446. [Google Scholar] [CrossRef] [PubMed] [Green Version]
- Lamm, G.; Pack, G.R. Counterion Condensation and Shape within Poisson-Boltzmann Theory. Biopolymers 2010, 93, 619–639. [Google Scholar] [CrossRef] [PubMed]
- Michnik, A.; Michalik, K.; Drzazga, Z. Stability of Bovine Serum Albumin at different pH. J. Therm. Anal. Calorim. 2005, 80, 399–406. [Google Scholar] [CrossRef]
- Arabi, S.H.; Aghelnejad, B.; Schwieger, C.; Meister, A.; Kerth, A.; Hinderberger, D. Serum albumin hydrogels in broad pH and temperature ranges: Characterization of their self-assembled structures and nanoscopic and macroscopic properties. Biomater. Sci. 2018, 6, 478–492. [Google Scholar] [CrossRef] [PubMed]
- Khramtsov, V.V.; Weiner, L.M.; Eremenko, S.I.; Belchenko, O.I.; Schastnev, P.V.; Grigorev, I.A.; Reznikov, V.A. Proton Exchange in Stable Nitroxyl radicals of the Imidazoline and Imidazolidine Series. J. Magn. Reson. 1985, 61, 397–408. [Google Scholar] [CrossRef]
- Voinov, M.A.; Kirilyuk, I.A.; Smirnov, A.I. Spin-Labeled pH-Sensitive Phospholipids for Interfacial pKa Determination: Synthesis and Characterization in Aqueous and Micellar Solutions. J. Phys. Chem. B 2009, 113, 3453–3460. [Google Scholar] [CrossRef] [PubMed]
- Khramtsov, V.V.; Marsh, D.; Weiner, L.; Reznikov, V.A. The application of pH-sensitive spin labels to studies of surface potential and polarity of phospholipid membranes and proteins. Biochim. Biophys. Acta Biomembr. 1992, 1104, 317–324. [Google Scholar] [CrossRef]
- Smirnov, A.I.; Ruuge, A.; Reznikov, V.A.; Voinov, M.A.; Grigorev, I.A. Site-directed Electrostatic Measurements with a Thiol-Specific pH-Sensitive Nitroxide: Differentiating Local pK and Polarity Effects by High-Field EPR. J. Am. Chem. Soc. 2004, 126, 8872–8873. [Google Scholar] [CrossRef] [PubMed]
- Thetiot-Laurent, S.; Gosset, G.; Clement, J.L.; Cassien, M.; Mercier, A.; Siri, D.; Gaudel-Siri, A.; Rockenbauer, A.; Culcasi, M.; Pietri, S. New Amino-Acid-Based β-Phosphorylated Nitroxides for Probing Acidic pH in Biological Systems by EPR Spectroscopy. ChemBioChem 2017, 18, 300–315. [Google Scholar] [CrossRef] [PubMed]
- Tian, M.; Peng, X.; Fan, J.; Wang, J.; Sun, S. A fluorescent sensor for pH based on rhodamine fluorophore. Dyes Pigments 2012, 95, 112–115. [Google Scholar] [CrossRef]
- Gao, F.; Tang, L.; Dai, L.; Wang, L. A fluorescence ratiometric nano-pH sensor based on dual-fluorophore- doped silica nanoparticles. Spectrochim. Acta Part A 2007, 67, 517–521. [Google Scholar] [CrossRef] [PubMed]
- Uyeda, H.T.; Medintz, I.L.; Jaiswal, J.K.; Sanford, M.S.; Mattoussi, H. Synthesis of Compact Multidentate Ligands to Prepare Stable Hydrophilic Quantum Dot Fluorophores. J. Am. Chem. Soc. 2005, 127, 3870–3878. [Google Scholar] [CrossRef] [PubMed]

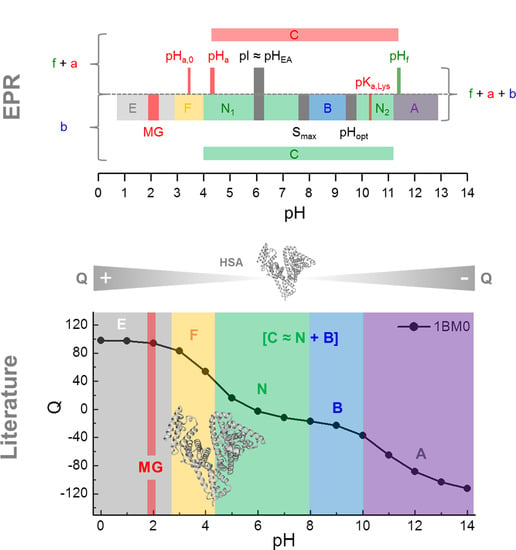
| PDB ID | pHopt | ΔGf/kcal mol−1 | pI |
|---|---|---|---|
| 1BM0 | 9.7 | 74.2 | 5.79 |
| 1e7i | 9.9 | 66.7 | 5.79 |
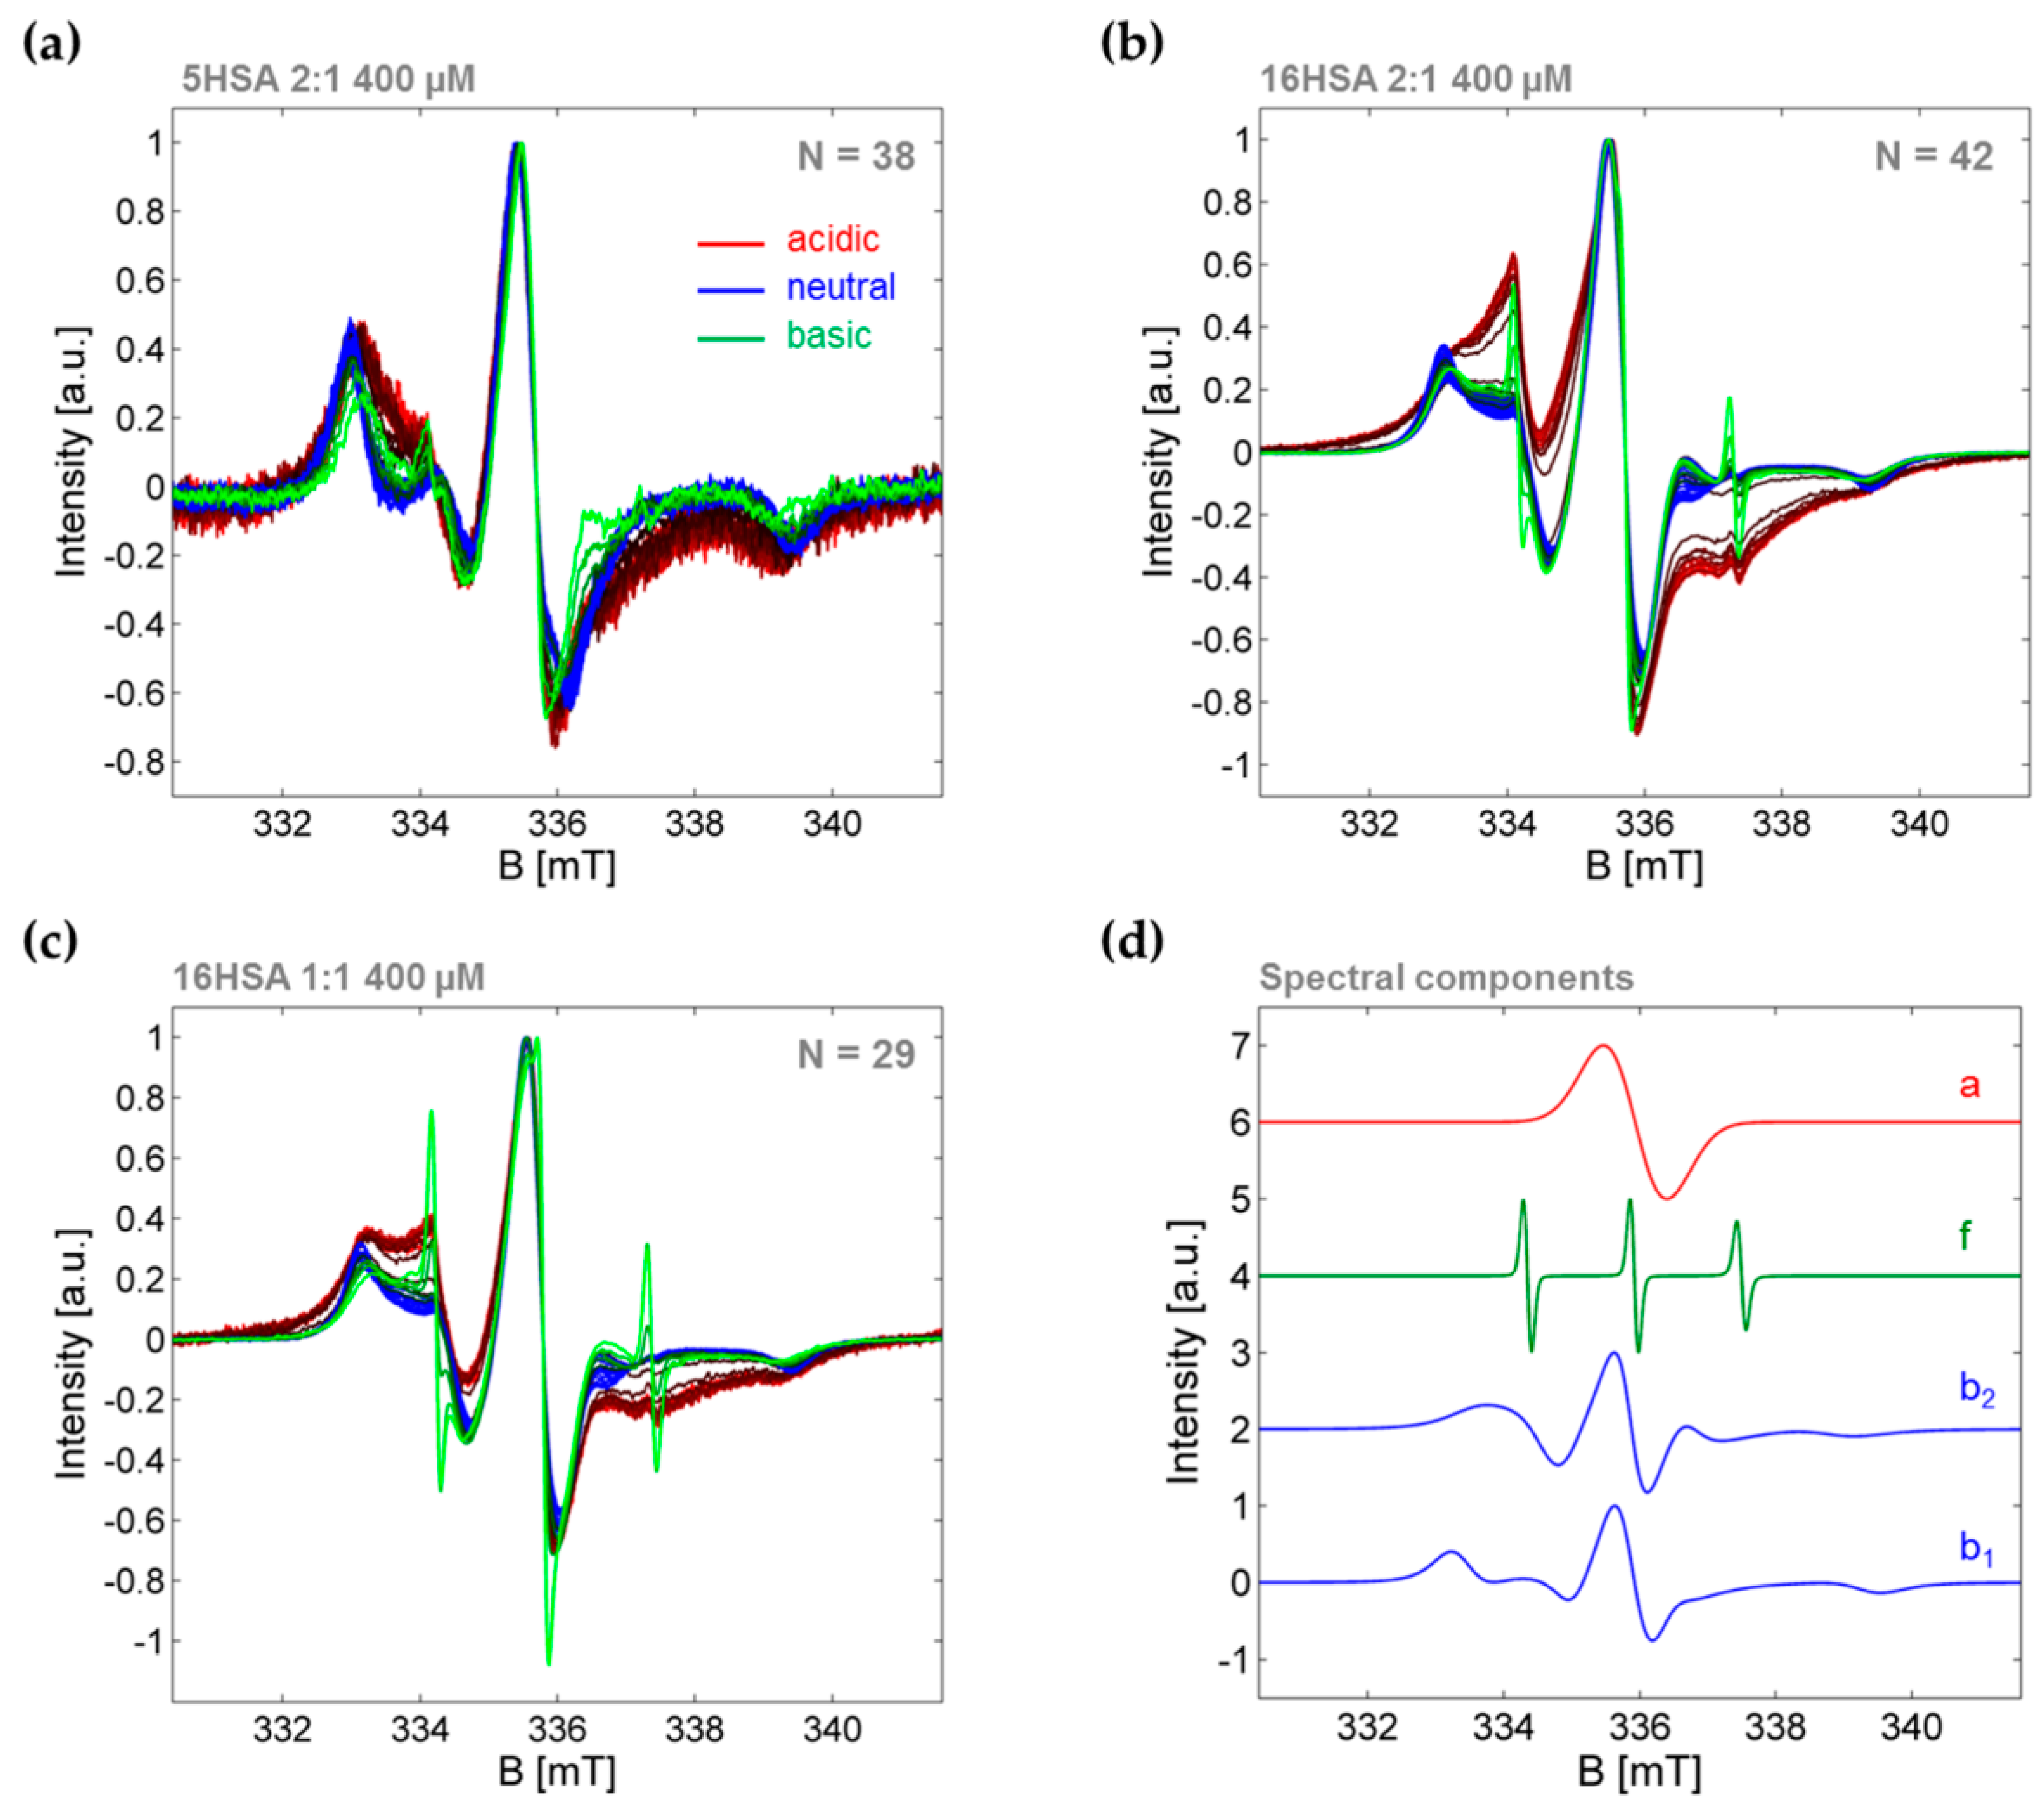
| Model | Parameter | 1:1 | 2:1 |
|---|---|---|---|
| Boltzmann | Ia | 0.247 ± 0.009 | 0.443 ± 0.011 |
| Ib | 0.103 ± 0.017 | 0.110 ± 0.002 | |
| pHa,0 | 3.44 ± 0.03 | 3.45 ± 0.03 | |
| pHb,0 | 5.60 ± 0.21 | 6.19 ± 0.03 | |
| Gauss | If | 0.00891 | 0.0178 ± 0.0011 |
| pHf,0 | 6.20 ± 0.21 | 6.33 ± 0.04 | |
| Nelder | pHa | 4.26 ± 0.15 | 4.39 ± 0.14 |
| pHf | 11.36 ± 0.04 | 11.46 ± 0.10 |
| Observable | Parameter | 5HSA 2:1 | 16HSA 2:1 | 16HSA 1:1 |
|---|---|---|---|---|
| A|| | pHMG | 2.13 ± 0.13 | – | 1.90 ± 0.14 |
| IA,MG/G | −0.80 ± 0.02 | – | ‒1.05 ± 0.18 | |
| Azz | Azz,MG/G | 34.6 ± 0.5 | 33.6 ± 0.4 | 33.5 ± 0.4 |
| Azz,pH/G a | 34.1 ± 0.3 | 34.0 ± 0.3 | 34.0 ± 0.3 | |
| ΔB0,pp | pHMG | 2.16 ± 0.37 | 1.87 ± 0.95 | 2.01 ± 0.13 |
| IB,MG/G | (≤‒0.50) | (≤‒0.20) | ‒0.20 ± 0.01 | |
| pHB,0 | 6.25 ± 0.08 | 6.21 ± 0.06 | 6.01 ± 0.07 | |
| IB/G | −0.76 ± 0.05 | 1.37 ± 0.03 | 0.92 ± 0.02 | |
| S | pHMG | – | – | 2.31 ± 0.57 |
| IS,MG | – | – | 0.033 ± 0.006 | |
| Iγ,MG/deg | – | – | 2.21 ± 0.43 | |
| P(r) | pHP,0 | – | 6.16 ± 0.13 | – |
© 2018 by the authors. Licensee MDPI, Basel, Switzerland. This article is an open access article distributed under the terms and conditions of the Creative Commons Attribution (CC BY) license (http://creativecommons.org/licenses/by/4.0/).
Share and Cite
Reichenwallner, J.; Oehmichen, M.-T.; Schmelzer, C.E.H.; Hauenschild, T.; Kerth, A.; Hinderberger, D. Exploring the pH-Induced Functional Phase Space of Human Serum Albumin by EPR Spectroscopy. Magnetochemistry 2018, 4, 47. https://doi.org/10.3390/magnetochemistry4040047
Reichenwallner J, Oehmichen M-T, Schmelzer CEH, Hauenschild T, Kerth A, Hinderberger D. Exploring the pH-Induced Functional Phase Space of Human Serum Albumin by EPR Spectroscopy. Magnetochemistry. 2018; 4(4):47. https://doi.org/10.3390/magnetochemistry4040047
Chicago/Turabian StyleReichenwallner, Jörg, Marie-T. Oehmichen, Christian E. H. Schmelzer, Till Hauenschild, Andreas Kerth, and Dariush Hinderberger. 2018. "Exploring the pH-Induced Functional Phase Space of Human Serum Albumin by EPR Spectroscopy" Magnetochemistry 4, no. 4: 47. https://doi.org/10.3390/magnetochemistry4040047