Article

Regulatory Mechanisms of Pollen Development: Transcriptomic and Bioinformatic Insights into the Role of β-1,3 Glucanase Gene (LbGlu1) in Lycium barbarum

1
College of Biological Science and Engineering, North Minzu University, Yinchuan 750021, China
2
Innovation Team for Genetic Improvement of Economic Forests, North Minzu University, Yinchuan 750021, China
3
Ministry of Education Key Laboratory for Biodiversity Science and Ecological Engineering, Institute of Biodiversity Science, School of Life Sciences, Fudan University, Shanghai 200437, China
4
School of Life Sciences, Inner Mongolia University, Hohhot 010070, China
*
Author to whom correspondence should be addressed.
Horticulturae 2024, 10(5), 512; https://doi.org/10.3390/horticulturae10050512
Submission received: 13 March 2024 / Revised: 7 May 2024 / Accepted: 11 May 2024 / Published: 16 May 2024
(This article belongs to the Special Issue Horticultural Crops Genetics and Genomics)

Abstract

:
Pollen fertility is a critical factor in seed development and crop breeding. Extensive studies have explored the mechanisms of pollen fertility in model plants and economic crops. However, the mechanisms of pollen abortion in medicinal and edible plants, including Lycium barbarum, remain elusive. This study utilized transcriptome analysis to identify key genes and regulatory networks implicated in pollen fertility in L. barbarum. The results demonstrated differential expression of 12,185 genes (DEGs) between the sterile and fertile lines, encompassing 489 genes that exhibited variation across the five stages of pollen development. Additionally, GO and KEGG enrichment analyses indicated that the DEGs were predominantly associated with energy metabolism, carbohydrate metabolism, and notably, hydrolase activity. Co-expression network analysis unveiled two modules intimately associated with fertility, each comprising 908 and 756 hub genes, incorporating β-1,3-glucanase genes (Glu) and co-expressed transcription factors (TFs). Phylogenetic analysis implied that LbGlu1 was a potential candidate gene implicated in regulating pollen abortion in L. barbarum. This work advances a novel understanding of pollen abortion in L. barbarum and offers theoretical support for the utilization of sterility genes to enhance crop improvement.

1. Introduction

Pollen development is a crucial stage for successful breeding and seed formation in flowering plants, with pollen fertility recognized for its role in facilitating crossbreeding and enhancing crop yield [1]. Extensive studies have explored anther and pollen development in Arabidopsis thaliana, a dicotyledon, and rice, a monocotyledon, significantly contributing to our understanding of this process [2].
Numerous genes associated with anther and pollen fertility have been identified, and their potential regulatory pathways have been elucidated based on available expression data [3,4]. Specifically, certain genes linked to energy metabolism, including no primexine and plasma membrane undulation gene (AtNPU) [5], ADP-glucose pyrophosphorylase gene (OsAGPL4) [6], UDP-Glucose Pyrophosphorylase gene (AtUGP1, AtUGP2) [7], sucrose phosphate synthase gene (OsSPS1) [8], and sucrose transporter (AtSUC1) [9], have been confirmed to influence pollen fertility. AtNPU, an ATP-dependent helicase, demonstrates that mutations can induce pollen abortion. OsAGPL4, a large subunit of ADP glucose pyrophosphorylase, has been shown to cause male sterility. Moreover, the processes of callose synthesis and degradation, catalyzed by callose synthase (CalS) and β-1,3 glucanase gene (Glu), respectively, play a crucial role in microspore development and protection [10,11]. Genes such as AtCalS5/AtCalS11, AtA6 [12], OsG1 [13], OsGSL5 [14], and ZmMs8 [15] affect pollen fertility by influencing tapetal development and callose metabolism [16,17]. Glu, a hydrolytic enzyme responsible for glycoside hydrolysis into oligosaccharides or glucose, has been studied in A. thaliana and rice, revealing that mutant tetrapospores are unable to be released into the pollen sac in a timely manner, leading to pollen abortion [14,15].
While studies on the molecular mechanisms of anthers and pollen development in model plants such as Arabidopsis and rice have been extensive, similar processes in other plants remain poorly understood [2]. With the advancement of molecular biology technology, especially omics technology, it is anticipated that research on pollen fertility will transition from model plants to other economically important crops. This transition will enable a more comprehensive understanding and application of improvement strategies for these crops. This shift in focus will contribute to a more comprehensive understanding of plant reproduction, thereby aiding in the development of innovative approaches for enhancing the yield and adaptability of a wide range of agricultural species.
Lycium barbarum, commonly known as goji berries, is a versatile economic crop extensively utilized in both traditional medicine and cuisine. Within Chinese medicinal theory, L. barbarum is esteemed for its numerous therapeutic effects, encompassing the nourishment of the liver and kidneys, enhancement of visual acuity, fortification of blood vitality, and reinforcement of the human immune system. Consequently, it is frequently integrated into diverse Chinese medicine formulas [18,19]. With an increasing focus on health and lifestyle quality, the demand for goji berries has consistently risen, presenting a lucrative market opportunity. To obtain comprehensive insights into the pollen sterility mechanism of L. barbarum, we scrutinized the anther development process of a fertile line, Ningqi No. 1, and its natural mutant line, Ningqi No. 5 (Figure A1). In the comparative analysis of tapetum morphology and developmental dynamics between Ningqi No. 5 and Ningqi No. 1, no significant morphological differences were observed during the archesporial cell stage (Ar) and the sporogenous cell stage (Sp). However, divergences become apparent from the pollen mother cell stage (Pm) onward. Obvious changes in anther structure can be observed during both tetrad stage (Te) and pollen grain stage (Po). In Ningqi No. 1, the tapetum layer undergoes characteristic inward shrinkage toward the pollen mother cells, accompanied by morphological changes indicative of functional tapetal activity and subsequent apoptosis. Conversely, in Ningqi No. 5, such tapetal dynamics are disrupted; the tapetum fails to reposition appropriately and exhibits delayed apoptotic features, as evidenced by the absence of granular bodies and persistent callose deposition. This altered tapetal behavior in Ningqi No. 5 underscores the morphogenetic and physiological deviations leading to pollen sterility, highlighting the critical role of tapetal integrity and function in pollen development [20] (Figure S1). To delve deeper into the molecular basis of these observations, we conducted RNA-seq analysis on the five developmental stages of anthers from both strains. This study aims to establish a foundation for comprehending the pollen abortion mechanism of Ningqi No. 5, with the intention of enhancing crop breeding methods.

2. Materials and Methods

2.1. Plant Materials

L. barbarum were cultivated at Yuxin Wolfberry Garden, Yinchuan, Ningxia (China), during the blooming period (May–August) with standard cultivation practices. Anthers were harvested at five developmental time points based on anther length and developmental stage, as delineated by Zhang et al. [20]. The development of microspores was categorized into five stages based on the length of the flower buds: archesporial cell stage (Ar, ≤1.3 mm), sporogenous cell stage (Sp, 1.31–1.89 mm), pollen mother cell stage (Pm, 1.90–2.93 mm), tetrad stage (Te, 2.94–4.0 mm), and pollen grain stage (Po, 4.01–5.0 mm). All samples were promptly frozen in liquid nitrogen and subsequently stored at −80 °C. Ninety flower buds were collected at each developmental stage. These were then grouped into sets of 30 flower buds to form individual biological replicates. Three biological replicates were established for each developmental time point.

2.2. RNA Sequencing

RNA extraction for each sample was carried out using TRIzol reagent (Invitrogen, Carlsbad, CA, USA), with three biological replicates per treatment in two lines (Ar, Sp, Pm, Te, and Po) [21]. The RNA quality assessment involved 1% agarose gel electrophoresis, Nanodrop (Thermo Fisher Scientific, Shanghai, China), and bioanalyzer (Agilent 2100). A quantity of 200 ng of poly(A) mRNA was used to construct libraries using the MGIEasy RNA Library Prep Kit V3.0 (BGI, Shenzhen, China). The mRNA with poly-A tails was enriched using magnetic oligo-dT beads, and the resulting RNA was fragmented with fragmentation buffer and reverse-transcribed with random N6 primers. Single cDNA strands were synthesized to form double-stranded DNA. Thereafter, the synthesized double-stranded DNA was blunted and phosphorylated at the 5′-end. In addition, a cohesive end with a protruding “A” was formed at the 3′-end, which was ligated to a blister-like linker with a protruding “T” at the 3′-end. The ligation product was amplified by PCR with specific primers. The PCR product was thermally denatured into single strands. The single-stranded DNA was circularized with bridge primer to obtain a single-stranded circular DNA library. The constructed sequencing library was sequenced on the MGISEQ-2000RS platform (BGI, Shenzhen, China) using the MGISEQ-2000RS Sequencing Flow Cell v3.0 (MGI Tech). The construction and sequencing of cDNA libraries was completed by BGI in Shenzhen, China. The measurement mode was paired-end sequencing, with a fragment length of 150.

2.3. Sequential Data Processing, Mapping, and Annotation

SOAPnuke (version 1.6.5, Shenzhen Huada Gene Research Institute, Shenzhen, China), which was independently developed by BGI, was utilized to process raw reads post-sequencing, filtering out low-quality reads, contaminated joints, and sequences with a high content of unknown base N (reads with unknown base N content greater than 1%), thereby yielding clean reads. In this step, bases with mass values less than 15 accounting for more than 40% of the total bases in the adapter read were considered to be low-quality bases and were discarded. The clean reads were mapped to the reference genome using HISAT2 (v2.0.4) [22]. The reference genome was obtained from the National Center for Biotechnology Information (NCBI) database accession number PRJNA640228. Bowtie2 (version 2.4.5) was applied to align the clean reads to the gene set [23], in which known and novel and coding and noncoding transcripts were included, and RSEM (version 1.3.1) was subsequently utilized to quantify the gene and transcript expression levels [24]. The sequencing data for each sample can be found in Table S1 and Figure S1 and have been uploaded to the National Genomics Data Center (NGDC). Sequence annotation was performed using the NCBI Non-Redundant Protein Sequence Database (Nr database), available at http://www.uniprot.org (accessed on 21 April 2022) and the Kyoto Encyclopedia of Genes and Genomes (KEGG) pathway database, accessible via http://www.genome.jp/kegg/kegg2.html (accessed on 10 May 2022). Following alignment, sequences underwent further annotation with InterPro to identify functional domains in nucleic acids or proteins. The annotations from the Nr database were then integrated and converted into Gene Ontology (GO) terms, version 20220509, using the Blast2GO platform found at http://www.Blast2go.com (accessed on 27 February 2024) [25]. To enhance the reliability of our analysis, we applied a stringent significance threshold of <10−5 during the enrichment analysis process to minimize potential errors.

2.4. Quantitative Reverse Transcription (qRT)-PCR Verification

cDNA synthesis was performed using a rapid RT kit (Tiangen Bio, Beijing, China). Differential expressed gene (DEG) reliability testing was performed using Biorad IQ5 (Bio RAD, Shanghai, China). The quantitative reagent was SYBR®Premium Ex TaqTM Kit (Takara, Dalian, China). Lbactin was used as the internal reference gene, and the relative gene expression levels were determined using the 2–ΔΔCt method [26]. The PCR program was as follows: step 1 (pre-denaturation), 95 °C, 30 s; step 2, 95 °C, 5 s; step 3, 60 °C, 30 s; repeated 40 cycles in total. Primer Premier 6.0 was used for all primer designs (see Appendix A). The primers were synthesized by Sangon Biotechnology (Shanghai, China) Co., Ltd. (Shanghai, China). The primer sequences of qRT-PCR are detailed in the Supplementary Material Table S4.

2.5. Expression Annotation and Enrichment Analysis of DEGs

The DEseq2 R package function estimation factor was utilized for the identification of DEGs. The p-values were calculated considering a normal distribution, and then, the p-values were corrected to Q-values. The threshold for identifying DEGs was set as a Q-value ≤0.05 and an absolute |log2FoldChang| > 2 [27]. Venn diagrams, heat maps, and dendrograms were created using the Rpackage “venn” and “pheatmap”, respectively. Gene Ontology (GO, version 20220509) enrichment analysis was conducted using agriGO v2, with significantly enriched GO terms identified at a p-value < 0.01 and a q-value < 0.05. Visualization of GO and Kyoto Encyclopedia of Genes and Genomes (KEGG, version 101.0) enrichment results was achieved using the R package “ClusterProfiler” (version 3.8.1). In this experiment, for the control group setup, anthers from both strains were compared simultaneously. Each comparison involved the same developmental stage of two different strains, resulting in five distinct comparison groups: Ar of Ningqi No. 5 vs. Ningqi No. 1 (N1-1VSN5-1); Sp of Ningqi No. 5 vs. Ningqi No. 1 (N1-2VSN5-2); Pm of Ningqi No. 5 vs. Ningqi No. 1 (N1-3VSN5-3); Te of Ningqi No. 5 vs. Ningqi No. 1 (N1-4VSN5-4); and Po of Ningqi No. 5 vs. Ningqi No. 1 (N1-5VSN5-5).

2.6. WGCNA

The weighted gene co-expression network analysis (WGCNA, version 1.71) was conducted using the R package (version 3.6) [28]. Initially, the optimal soft threshold power β was determined based on the lowest power that achieved the highest value of the scale-free topological fitting index. Subsequently, the “blockwiseModules” function was utilized for constructing the topology overlap matrix (TOM) and for module detection. Correlations between modules and traits were assessed by calculating Pearson correlation coefficients between module characteristic genes and phenotypes. The expression patterns of modules associated with the two traits were depicted using “ggplot2” [29]. Hub genes were determined based on gene significance and module membership. Module membership (MM) represents the correlation between a gene’s expression profile and the module’s characteristic gene, while gene significance (GS) reflects the correlation between a single gene and the trait. For identifying hub genes, a threshold of GS and MM greater than 0.8 was established [30].

2.7. Identification of Glu Gene Family Related to Callose Metabolism in L. barbarum

From the Arabidopsis database (www.arabidopsis.org, accessed on 10 June 2022), a set of 50 coding DNA sequences of endo-β-1,3-Glu were retrieved and utilized as queries for the initial search in L. barbarum’s genome. SMART (http://smart.embl-heidelberg.de/, accessed on 21 June 2022) was employed to analyze each protein’s structural domains and functional sites. All endo-β-1,3-Glu protein sequences that included the Glyco_hydro_17 sequence (Pfam00332) were identified as candidate genes. The GeneBank non-redundant protein database (version 20220807) was utilized for searching for candidate genes. DNAMAN software (version 6.0, LynnonBiosoft, San Ramon, CA, USA) was applied to assess the homology between L. barbarum and Arabidopsis thaliana.

2.8. Phylogenetic Analysis of Glu

The T-coffee program (https://www.ebi.ac.uk/jdispatcher/msa/tcoffee (accessed on 27 February 2024)) was employed to conduct multiple sequence alignment of the full-length Glu protein sequences from L. barbarum. Furthermore, the phylogeny of the conserved domains was reconstructed using MEGA 7 software [31]. Bootstrap values (with 1000 replicates) were estimated to evaluate the relative support for each branch. Sequence alignment (Table S11) and a tree with branch length (Table S12) can be found in the Supplementary Materials.

3. Results

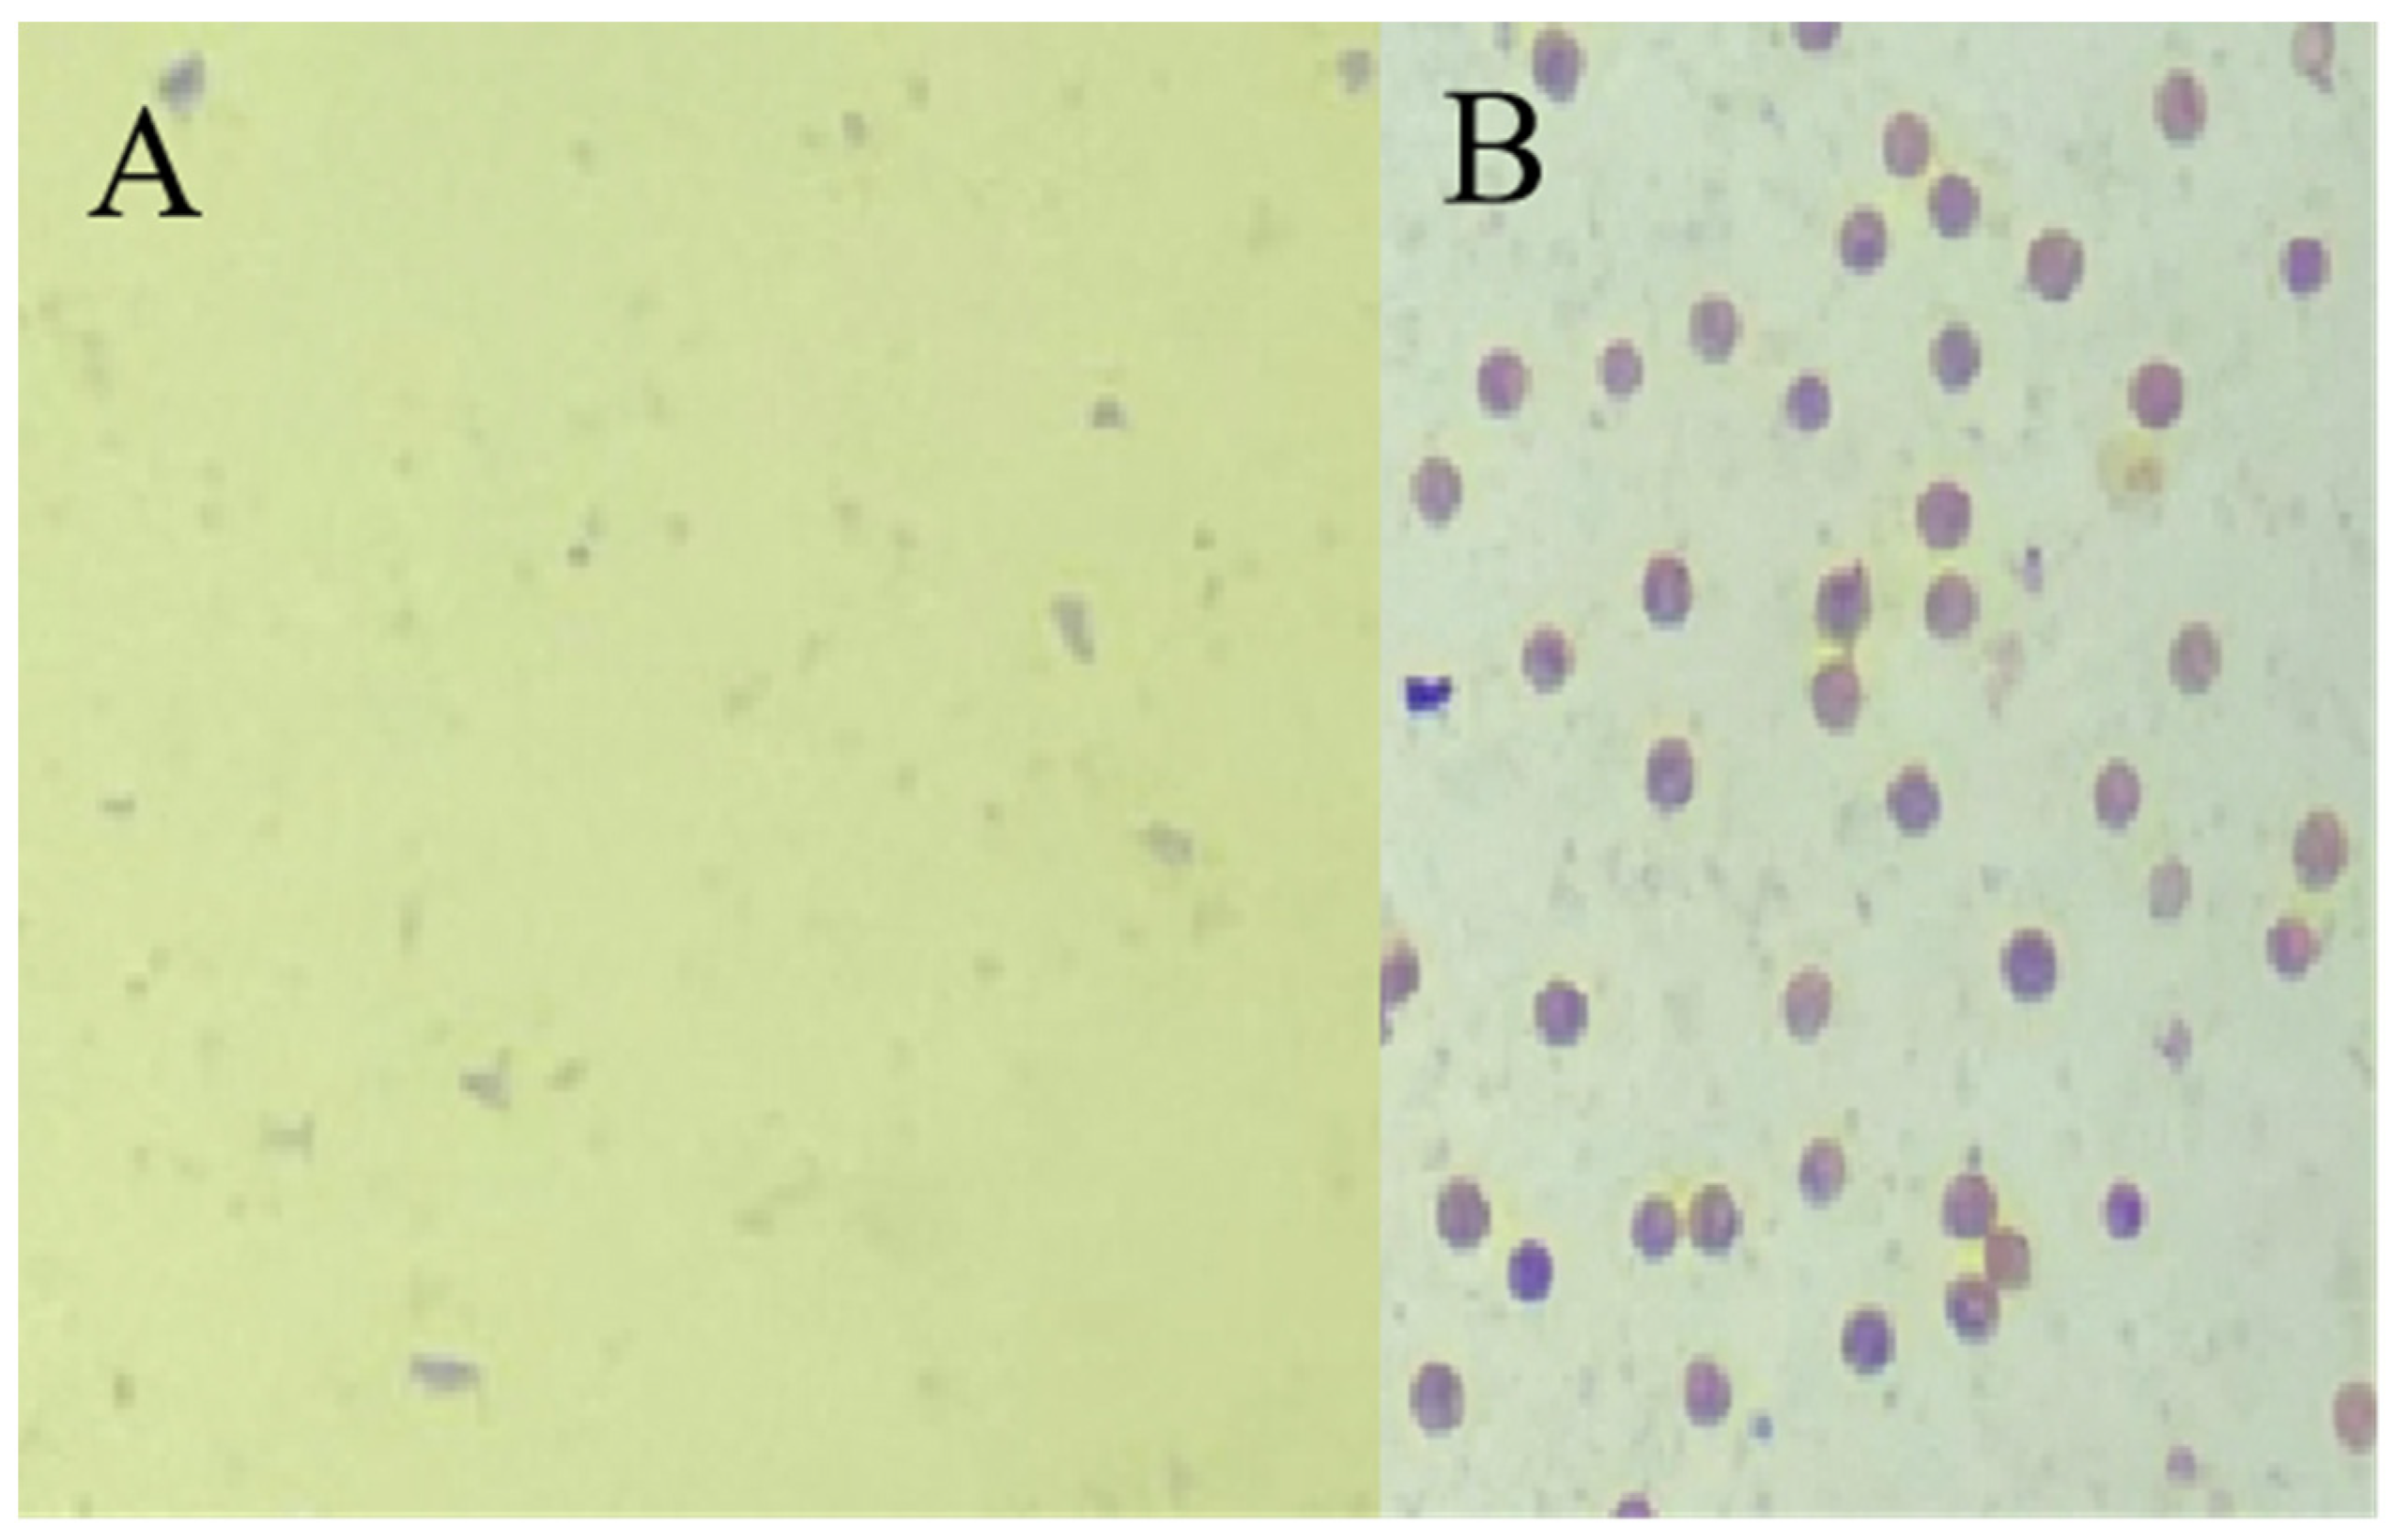
3.1. DEGs in Sterile Line Ningqi No. 5 and Fertile Line Ningqi No. 1

Building on the team’s prior research [20], we categorized the pollen development of L. barbarum into five stages: the archesporial cell stage (Ar), the sporogenous cell stage (Sp), the pollen mother cell stage (Pm), the tetrad stage (Te), and the pollen grain stage (Po). Subsequently, we conducted a transcriptome analysis to elucidate the molecular mechanisms underpinning each developmental stage. The original reads underwent filtration to eliminate low-quality reads, resulting in an average of 6.37G total clean reads per sample. The percentages of clean reads Q20(%) and Q30(%) ranged from 97.4 to 97.7 and 93.09 to 93.72, respectively. The clean reads obtained from each sample were aligned to the reference genome, achieving a matching rate between 65.34% and 69.29% (Table S1, Figure S3). The correlation thermograph analysis revealed a high correlation between biological replicates, affirming the reproducibility of the RNA-seq data and their suitability for subsequent analysis. In this analysis, a total of 31,870 genes were detected (Table S2), comprising 27,142 known genes and 4728 newly predicted genes.
A total of 12,185 DEGs were identified in the sterile Ningqi No. 5 and the fertile Ningqi No. 1. The distribution of DEGs across the stages of Ar, Sp, Pm, Te, and Po in Ningqi No. 5 and Ningqi No. 1 was as follows: 1743, 2082, 191, 2152, and 4298, respectively (Figure 1A, Table S3 and Figure S4). To validate the RNA-seq results, twenty genes were randomly selected for qRT-PCR confirmation, and the expression patterns of these genes were found to be consistent between the two methods (Figure S9).
In comparison with Ningqi No. 1, Ningqi No. 5 exhibited a higher number of DEGs in anthers, comprising 5416 up-regulated genes and 6769 down-regulated genes. During the initial three stages of anther development, the counts of up-regulated and down-regulated differential genes were nearly equivalent. However, at the tetrad stage, there was a notable increase in the number of DEGs. In the Po stage, Ningqi No. 5 was observed to have 1656 up-regulated genes and 2642 down-regulated genes (Figure 1A).

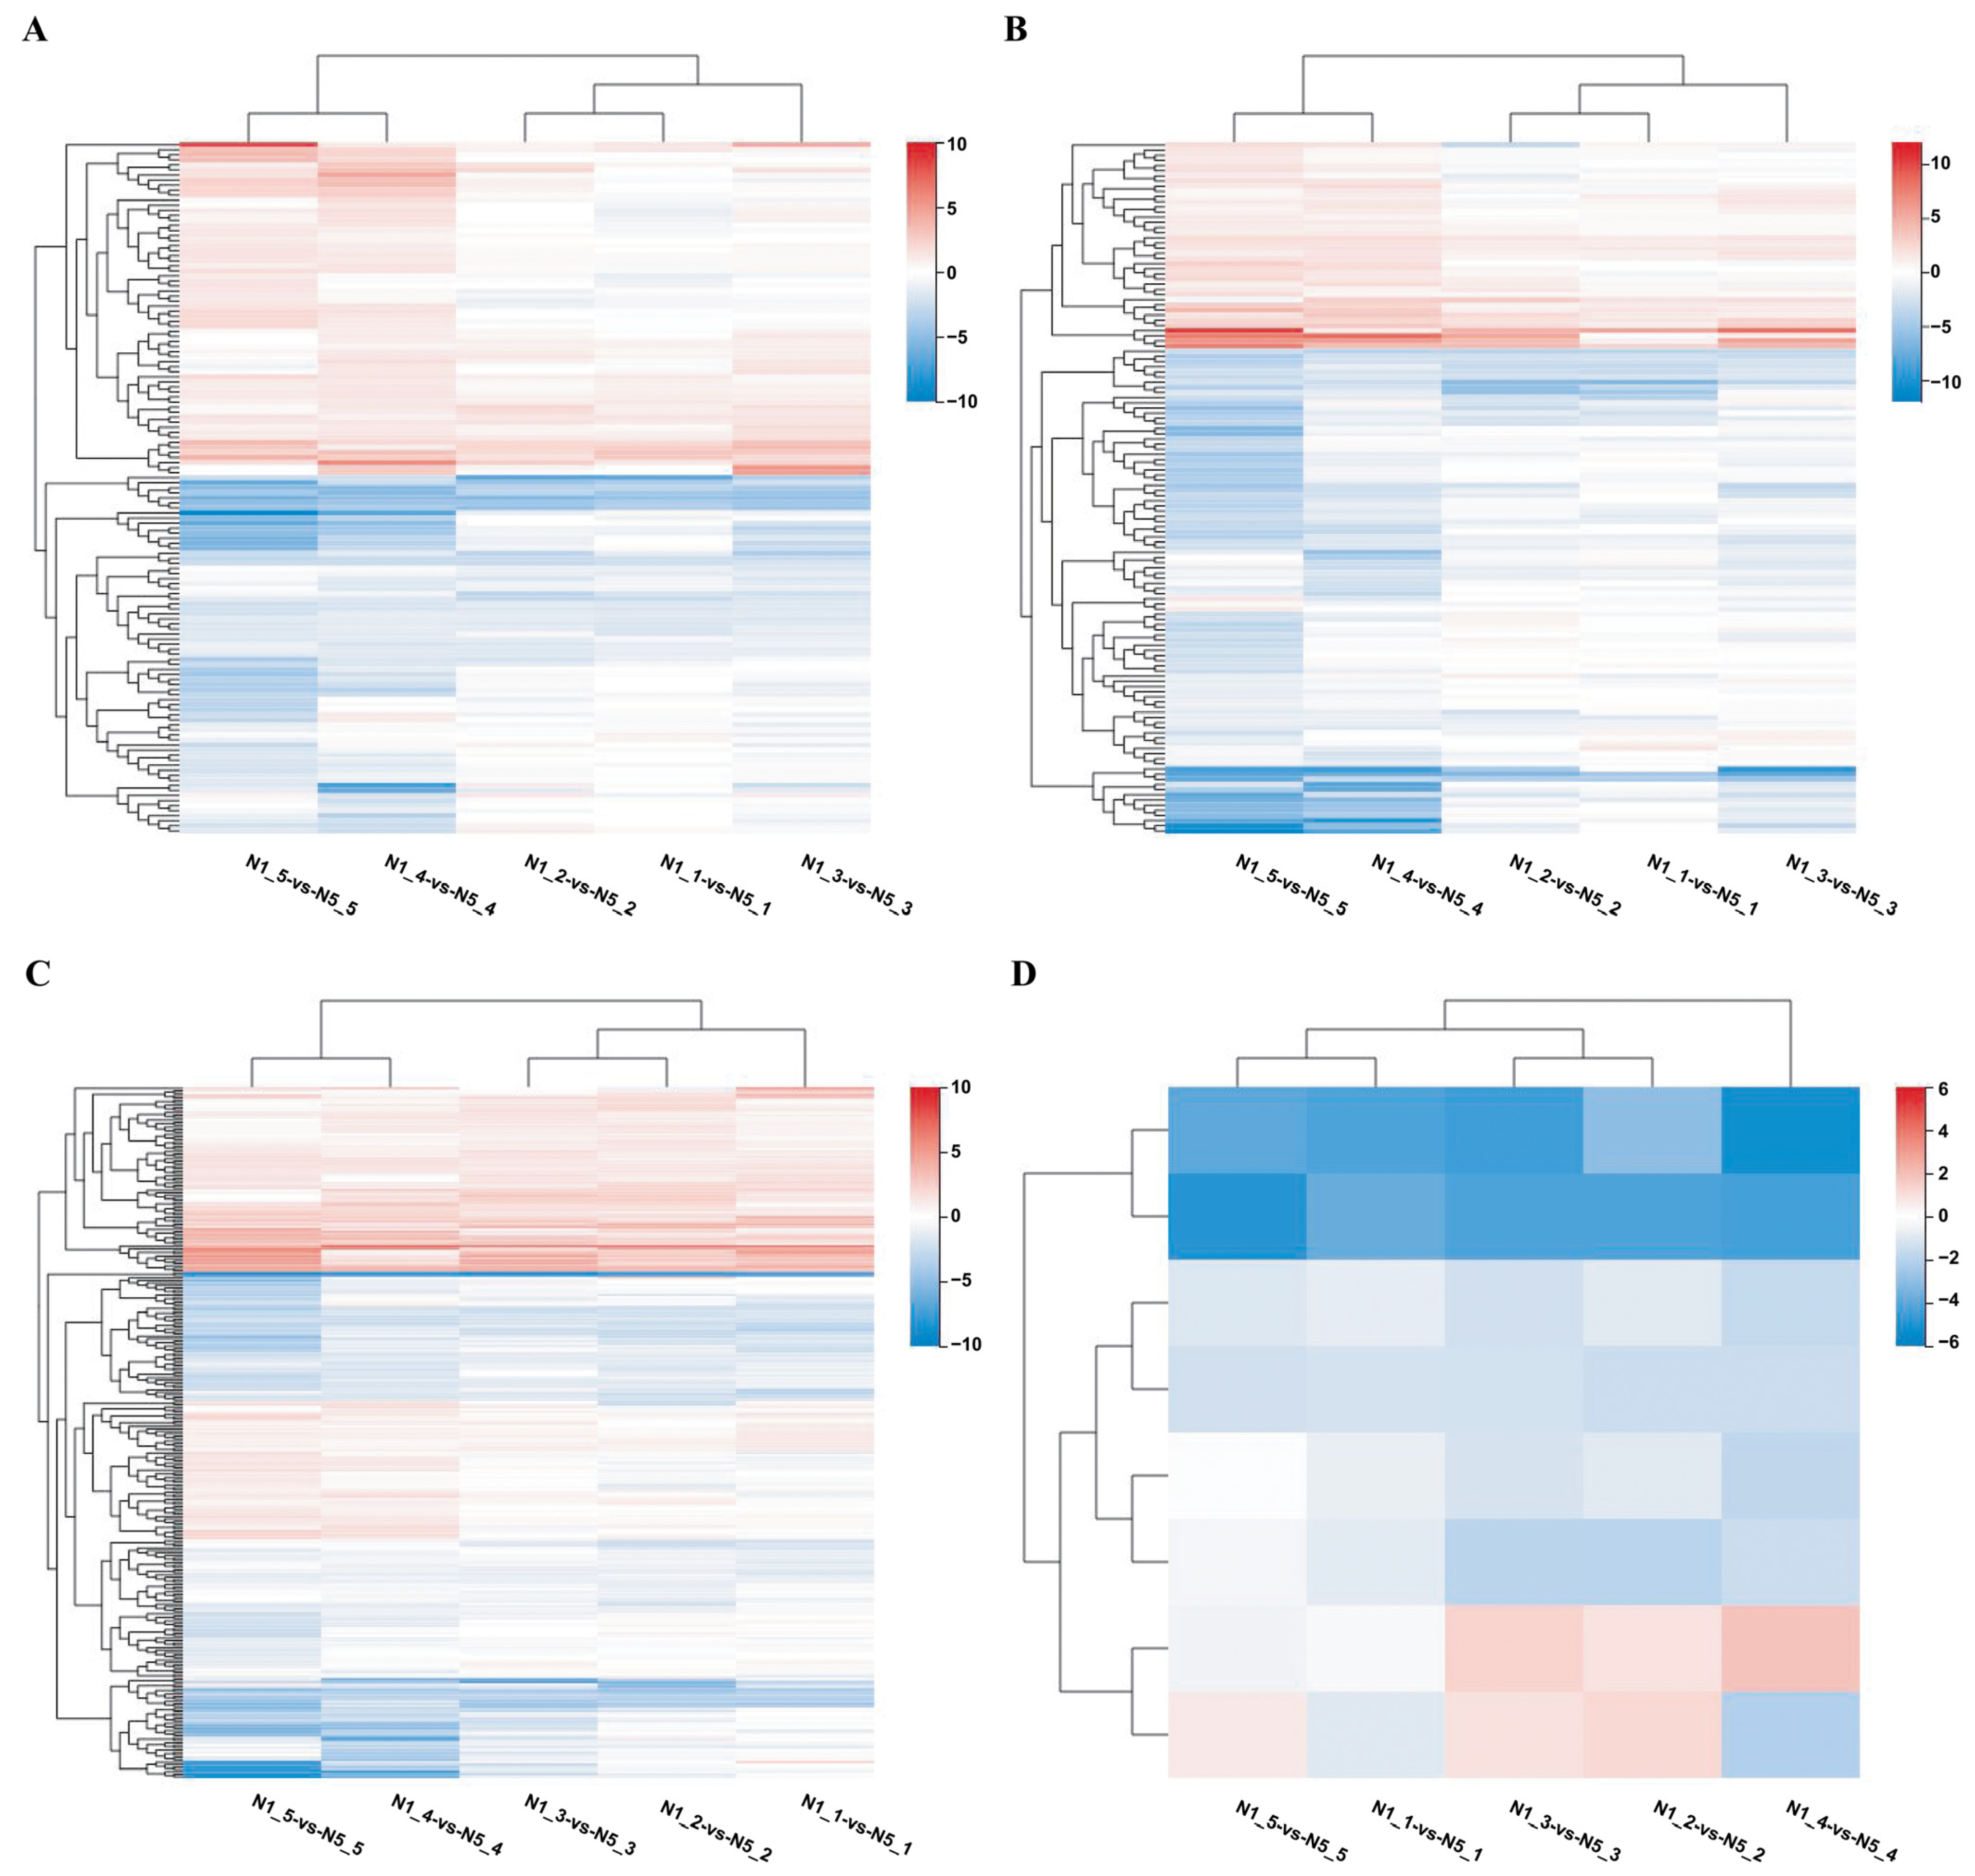
3.2. Anther DEGs in All Control Groups

To scrutinize the distribution of DEGs in the two strains, we conducted an analysis of overlapping genes of DEGs in all comparison groups. The number of DEGs at the Ar, Sp, Pm, Te, and Po stages in Ningqi No. 5 and Ningqi No. 1 was 1743, 2082, 191, 2152, and 4298, respectively (Figure 1A). There are a total of 489 DEGs in all control groups (Figure 1B). A majority of these genes (334 out of 489) were down-regulated in Ningqi No. 5 (Table S3). The GO and KEGG pathways of these DEGs were predominantly associated with biological regulation, cellular process, signaling, and catalytic activity (Figure 1C, Table S5, Figure S5). Furthermore, genes influencing hydrolase activity and energy metabolism were identified. These included genes with hydrolase activity, alcohol dehydrogenase activity, cysteine-type endopeptidase inhibitor activity, adenosylhomocysteinase activity, and ADP binding. For instance, Lba01g00221 is a glutathione S-transferase gene, Lba01g00363 encodes a diacylglycerol kinase (ATP), Lba01g02474 is a UDP-glucosyl transferase gene, Lba02g02803 encodes a S-(hydroxymethyl) glutathione dehydrogenase enzyme, and Lba03g00100 encodes a monodehydroascorbate reductase (NADH). These findings suggest that hydrolase metabolism and energy metabolism may be pivotal factors influencing pollen development. The genes identified in this study are likely to play a crucial role in anther development and pollen formation of L. barbarum.

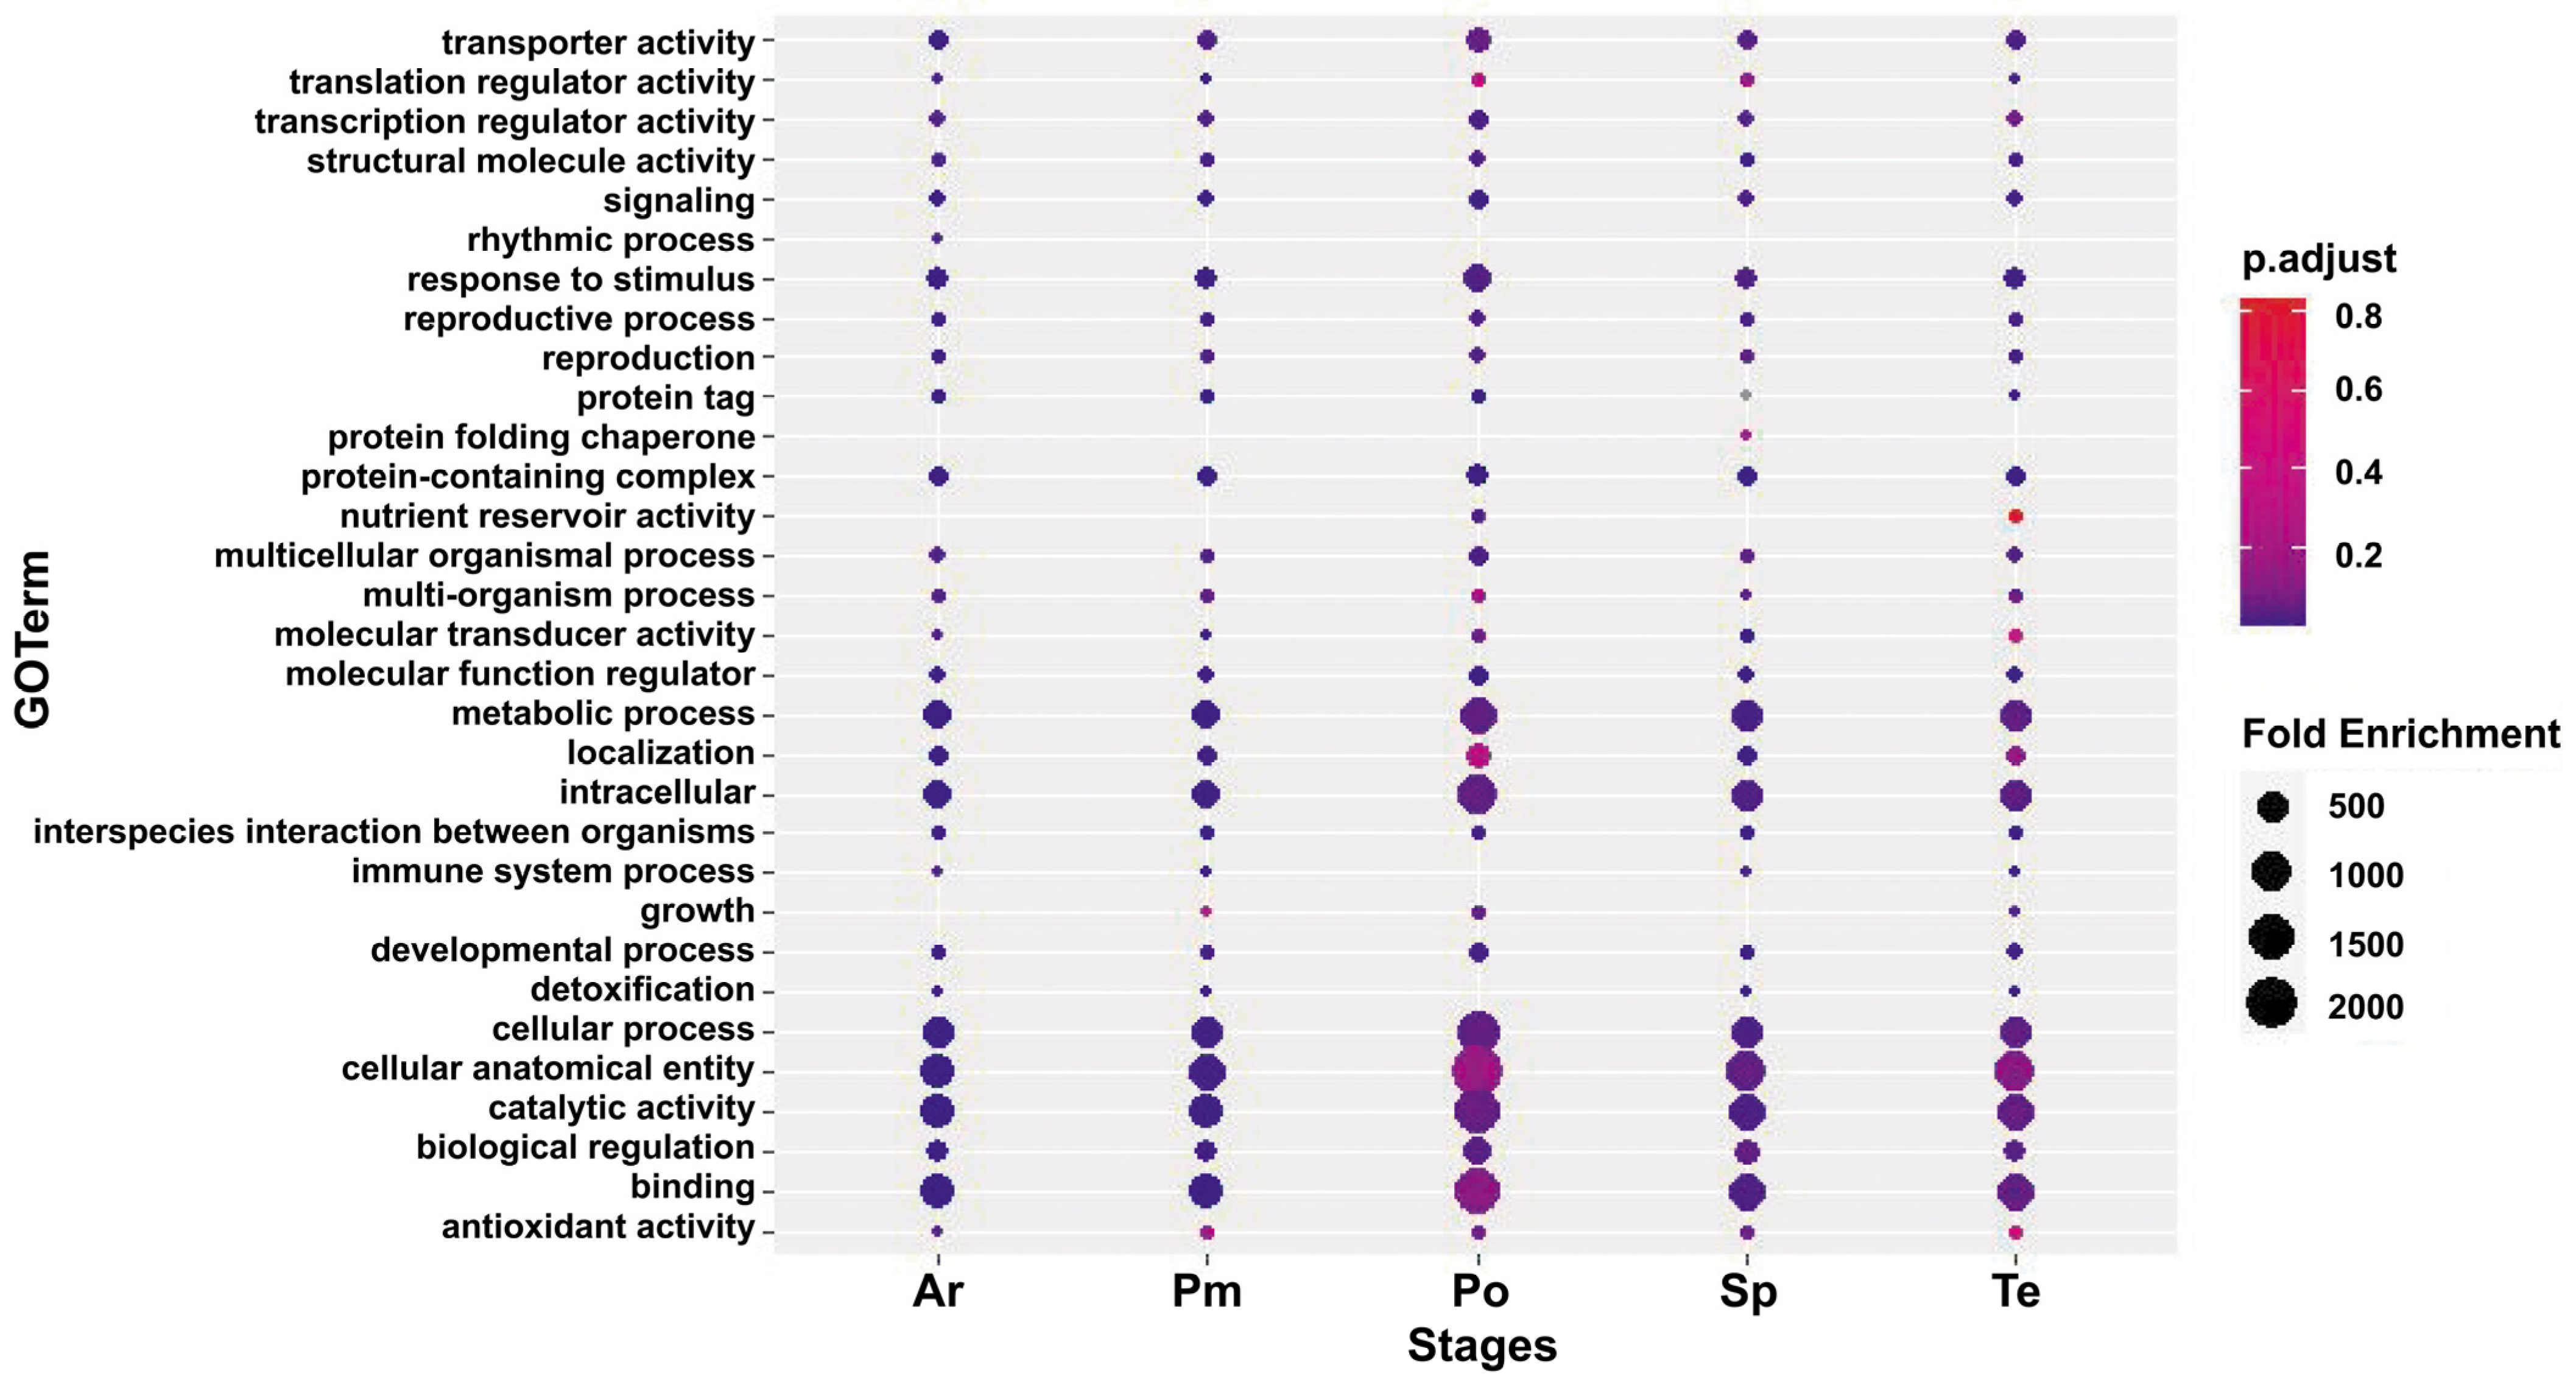
3.3. Functional Annotation and Classification of DEGs

GO analysis and KEGG annotation analysis unveiled notable distinctions in genes related to cellular processes, hydrolase activity, and carbohydrate metabolism across different pollen fertility stages. GO analysis indicated that while the enriched terms were similar among the five comparison groups, the number of enriched genes exhibited significant differences (Figure 2). Within “biological processes”, a substantial number of DEGs were enriched in cellular processes, metabolic processes, and biological regulation. The count of DEGs involved in biological regulation increased with pollen development, and those participating in metabolic process were expressed at the Te and Po stages. In “molecular function”, binding and catalytic activity were highly enriched. Transporter activity was abundant in the Te and Po stages, whereas transcription regulator activity was prevalent in the Ar, Sp, and Po stages. Concerning “cell component”, the expression of three subcategories was observed consistently, all associated with protein complexes.
To gain deeper insights into the metabolic pathways involving these DEGs, we mapped them to GO and KEGG enrichment for comprehensive analysis (Figure 3). In the initial three stages, the metabolic pathways exhibited a degree of similarity (Figure 3A–C). Notably, cyanoamino acid metabolism, glucosinolate biosynthesis, ascorbate and aldarate metabolism, and galactose metabolism were consistently enriched in all comparison groups. Further enrichment analysis highlighted disparities in the ADP binding pathway associated with energy metabolism and the mitotic pathway from the Ar to Pm stages between the two strains. Regarding cell division, distinctions were observed in mitotic cytokinesis, plant-type primary cell wall biogenesis, cytoskeleton-dependent cytokinesis, and cysteine-type endopeptidase inhibitor activity related to defense response. Regarding glycometabolism, variations were noted in cellulose synthase activity, cellulose synthase (UDP-forming) activity, hydrolase activity acting on ester bonds, and cellulose biosynthesis process. A noteworthy finding was the pronounced involvement of the concentration pathway in hydrolase activity during the tetrad phase. This encompassed hydrolase activity hydrolyzing O-glycosyl compounds, hydrolase activity, and glycosyl bonds. Lba10g01499 (β-1,3 glucanase gene, LbGlu1), implicated in glucan endo-1,3-beta-D-glucosidase activity and associated with rice fertility, was identified as relevant to pollen development. Components associated with pollen wall assembly, cell wall organization or biogenesis, pollen exine formation, and cell wall biogenesis were also prominently observed (Figure 3D). During pollen grain development, concentration differences were chiefly observed in cell microtubule metabolism, encompassing cytoskeletal protein binding, microtubule binding, microtubule-based movement, microtubule motor activity, integral components of the membrane, and tubulin binding (Figure 3E). Based on the identified differential metabolic pathways, the principal physiological functions of the two strains at each developmental stage exhibited inconsistency. In the initial three stages, the differential pathways were highly similar, primarily comprising energy metabolism, cell division metabolism, and glycometabolism pathways. This observation suggested that the fertile strains were engaged in significant cell metabolism during this period. Notably, during the Te stage, substantial differences in hydrolase metabolism were evident, while during the Po stage, microtubule metabolism displayed significant distinctions.

3.4. DEGs Related to Energy Metabolism

Concentration analysis of DEGs across all comparison groups revealed 158 genes associated with energy metabolism that were differentially expressed in at least one stage, with 24 genes exhibiting differential expression across all five stages of anther development (Figure 4A). Remarkably, the majority of these 24 genes (18) were down-regulated in sterile lines, while only 6 were up-regulated (Table S6). A pronounced difference in expression profiles was observed for genes involved in energy metabolism, such as glycolysis/gluconeogenesis, fatty acid degradation, and starch and sucrose metabolism, between fertile and sterile lines from the Sp stage to the Po stage. Notably, genes including S-(hydroxymethyl)glutathione dehydrogenase (Lba02g02803), histone arginine demethylase (Lba03g00757), and beta-fructofuranosidase (Lba10g02312) exhibited a substantial fold difference (log2FC > 4) in expression values between the fertile and sterile lines. Additionally, a distinct surge in expression was observed for glyceraldehyde 3-phosphate dehydrogenase (BGI_novel_G004381) at the Te stage of sterile lines, followed by a recovery at the Po stage. Furthermore, glyceraldehyde 3-phosphate dehydrogenase (Lba01g02374) was significantly down-regulated at the Te stage compared with the other stages. Collectively, these findings underscored a close correlation between energy metabolism and the fertility of Ningqi No. 5.

3.5. DEGs Related to Pollen Development

A total of 134 genes associated with pollen development exhibited differential expression in at least one stage of anther development, with 21 genes displaying differential expression across all five stages. Among these genes, 14 were down-regulated in Ningqi No. 5, while 7 were up-regulated in Ningqi No. 5 (Figure 4B, Table S6). Notably, cellulose synthase A emerged as the most significantly differently expressed gene, demonstrating a substantial difference in expression between the two strains. Intriguingly, a reported mutation in the cellulose synthase A gene in Arabidopsis thaliana has been linked to the development of a male sterile line. These findings suggest a potential role for cellulose synthase A in influencing fertility in Ningqi No. 5.

3.6. DEGs Related to Hydrolase Activity

A total of 286 genes associated with hydrolase activity exhibited differential expression at least once, constituting 60.4% of all DEGs. Among them, 65 genes displayed differential expression across all five stages of anther development (Figure 4C, Table S6). Notably, 23 genes were up-regulated expressed, while 42 genes were down-regulated. Key hydrolase enzymes including ribonuclease T2, mRNA-capping enzyme, 6-phosphogluconolactonase, beta-galactosidase, and polygalacturonase were predominantly down-regulated. Interestingly, robust expression of 6-phosphogluconolactonase and serine/threonine-protein phosphatase 5 was observed in Ningqi No. 5. The differential expression of hydrolase activity suggested a pivotal role in the regulation of anther development. LbGlu1 was not detected in the first three stages of anther development but exhibited high expression in the Te stage (log2FC > 6), consistent with a previous report indicating that the Glu gene induced callose metabolism in the anther only during the Te stage, leading to male sterility in A. thaliana. These results underscored the specificity of hydrolase in the anther development of L. barbarum.

3.7. DEGs Related to Active Oxygen Metabolism

Eight genes associated with active oxygen metabolism exhibited differential expression in at least one stage of anther development, and these DEGs were predominantly down-regulated in Ningqi No. 5 (Figure 4D, Table S6). Notably, three genes displayed differential expression across all five stages of anther development. One of these genes, S-(hydroxymethyl)glutathione dehydrogenase, is involved in glycolysis and is associated with active oxygen metabolism. These findings strongly indicate a close association between active oxygen metabolism and the fertility of Ningqi No. 5. The down-regulation of these genes in Ningqi No. 5 may potentially impact the efficiency of reactive oxygen species (ROS) scavenging, leading to fertility defects.

3.8. Identification of Hub Genes

Weighted gene co-expression network analysis (WGCNA), an efficient method for identifying gene modules and genes that affect traits, was employed to correlate DEGs with traits and identify modules and genes within modules associated with traits. Non-redundant DEGs were chosen for WGCNA to deepen the understanding of the genes related to male sterility in Ningqi No. 5. All genes were categorized into 57 modules based on their expression patterns, and the expression of these genes in different samples is illustrated as a heat map (Figure 5 and Figure S7). Model and character correlation analysis demonstrated a significant correlation between the MEbrown module and fertility, whereas the MEred module was notably associated with sterility. The MEbrown module comprised 2000 genes, whereas the MEred module included 1109 genes (Table S7). KEGG analysis indicated that the MEbrown module was linked to glucosinolate biosynthesis, glutathione metabolism, and cyanoamino acid metabolism. The MEred module was involved in histidine metabolism, N-glycine biosynthesis, and biotin metabolism (Figure 5 and Figure S8). These results implied that beyond the observed differences in gene expression related to glucan metabolism, amino acid metabolism played a role in pollen development.
Based on the module members and gene significance, a total of 908 hub genes in the MEbrown module and 756 hub genes in the MEred module were identified (Table S8). GO and KEGG analyses of these hub genes demonstrated their involvement in energy metabolism, carbohydrate metabolism, and hydrolase metabolism. Upon analyzing 489 common DEGs and hub genes in all comparison groups, 392 overlapping genes were identified. Lba10g01499 (LbGlu1), Lba01g02472 (UDP glucosyltransferase), Lba02g01769 (UDP-sugar pyrophosphorylase), and cellulose synthase, among others, were featured in the hub gene list, suggesting the efficacy of the aforementioned method in hub gene selection.

3.9. TFs Co-Expressed with Glu

Glu plays a role in callose metabolism and influences rice fertility. When RNA interference was utilized to inhibit the expression of rice β-1, 3-glucanase gene Osg1, although the mutant plants’ pollen mother cells seemed normal, enhanced callose degradation was observed around the microspore in the mutant plants’ anthers, resulting in pollen abortion. These results indicated that Glu was crucial for the degradation of callose in the Te stage. In our transcriptomic analysis, LbGlu1 (Lba10g01499) exhibited high expression and was specific to anthers only at the Te stage of fertile strains, a finding consistent with Arabidopsis studies [32]. Coupled with the morphological observation of Ningqi No. 5, observations of abnormal tapetum and callose metabolism in Ningqi No. 5 were noted, along with abnormal LbGlu1 expression in transcriptomic data. Therefore, we postulated that the pollen sterility of Ningqi No. 5 may be closely related to the abnormal expression of LbGlu1. To illustrate genes co-expressed with LbGlu1 over time, a collective of 2764 genes was found to share the same expression pattern with LbGlu1 (Figure 5B,C, Table S9). Given that Glu may exert a physiological role upon binding with anchor proteins to form a complex [33], attention was directed toward the TFs co-expressed with LbGlu1. The results revealed that 140 TFs exhibited the same expression pattern as LbGlu1 (Table S10), comprising 19 MYB, 17 AP2, 15 NAC, and 8 MADS-box, which were implicated in pollen fertility. These results imply that Glu may control the pollen fertility of L. barbarum.

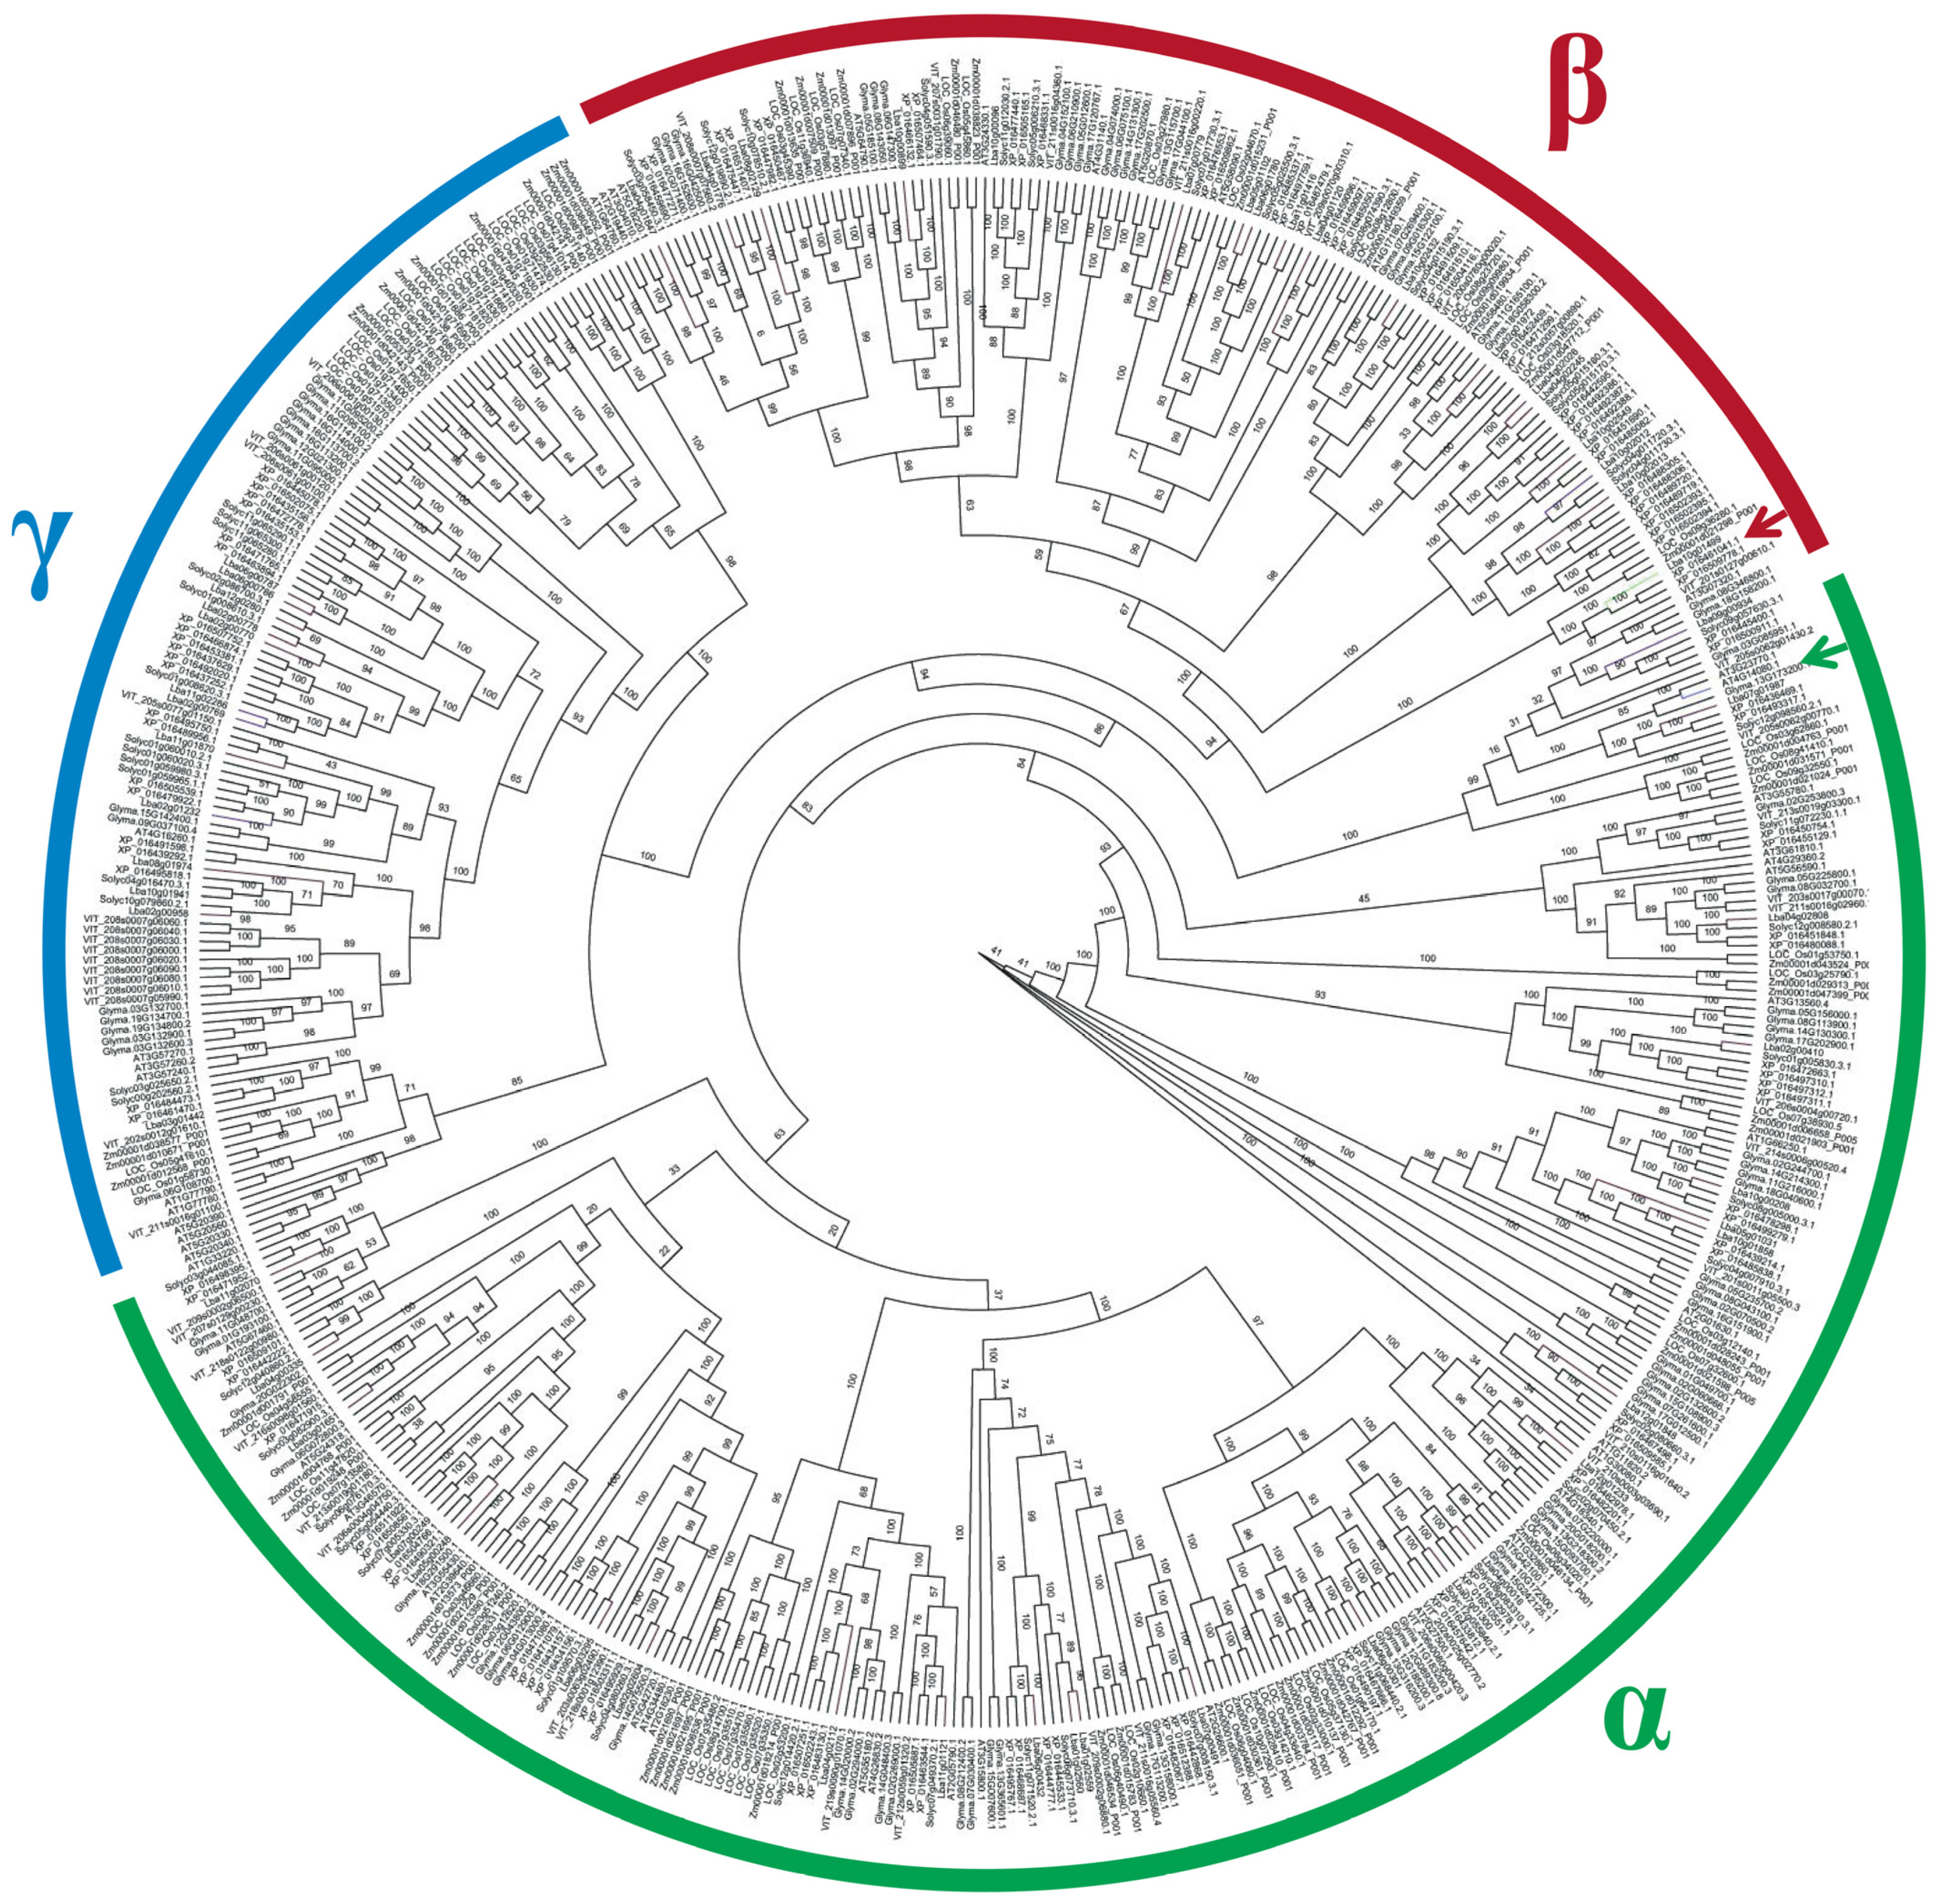
3.10. Analysis of the Phylogenetic Relationship of Glu Protein System

The systematic analysis of the Glu gene family in Arabidopsis and L. barbarum demonstrated that the Glu gene family could be divided into three major branches, aligning with the α, β, and γ branches identified in the systematic analysis of Arabidopsis Glu proteins by Doxey et al. [32] (Figure 6). From the perspective of systematic evolution, LbGlu1 is categorized within the β group and is grouped together with two genes from tobacco (IDs XP016509778.1 and XP016461041.1) and one gene from rice (Os09g36280) on the same branch. It has previously been reported that Os09g36280 is associated with allergens in rice pollen. Additionally, At4g14080 located in the α branch has been identified as a factor causing pollen abortion in Arabidopsis, which implies that LbGlu1 might also influence the process of flower development in L. barbarum.

4. Discussion

4.1. Abnormal Glycometabolism Can Affect Pollen Fertility

In plants, carbohydrates, comprising sucrose, glucose, fructose, trehalose, and their derivatives (e.g., callose, cellulose, and hemicellulose), primarily function as structural components of plant cells and fundamental sources of energy metabolism [34,35]. Glycometabolism in plants, encompassing carbohydrate biosynthesis, degradation, transport, and regulation, is pivotal in plant male reproduction. During blooming, carbohydrates are conveyed to anthers to facilitate the normal development of microspores, which involves callose formation and starch accumulation. Consequently, the abnormal expression of genes involved in glucose metabolism frequently results in pollen abortion [36]. Numerous genes associated with glucose metabolism play a role in male sterility across various plants. For instance, glucan synthase (callose synthase gene 5 (AtCalS5) [16], AtCalS11 [17], and glucan synthase gene 5 (OsGSL5) [14]) are implicated in pollen fertility in rice and A. thaliana. β-1, 3-galactosyltransferase (male sterility gene 8 (ZmMs8) [15] mutants in maize and A. thaliana and UNEVEN PATTERN OF EXINE 1 (AtKNS4) [37]) has been found to cause male sterility or decreased fertility. AtQRT3 has been shown to lead to pollen grain abnormalities [38]. Mutants impairing callose Glu degradation in A. thaliana (β-1,3-glucanases gene (AtA6) [12]) and rice (β-1,3-glucanases gene (OsG1) [13]) can potentially lead to male sterility. In the present study, an extensive array of DEGs related to glucose metabolism was identified. The differential expression of cellulose synthase A, β-1, 3-galactosyltransferase, cellulose synthase A, and β-glucosidase between the two strains is associated with pollen fertility in various plants. Based on the presence of numerous DEGs related to glucose metabolism, it was hypothesized that the pollen abortion in L. barbarum may be predominantly associated with glucose metabolism.

4.2. Hydrolase Activity Can Regulate the Release of Microspores from Callus

Glycosidic hydrolases are enzymes that hydrolyze the glycosidic bonds of carbohydrates and play a role in regulating abiotic and biological stresses and various developmental processes in plants [39,40]. The analysis of glycoside hydrolase families in A. thaliana and rice revealed that many glycoside hydrolase families demonstrated tissue specificity and functional differences [41,42]. Beta-glucosidase 6 (AtBGLU6) participates in flavonoid metabolism [43,44], AtBGLU7 participates in anthocyanin metabolism [45], and AtBGLU8 and AtBGLU33 are involved in regulating ABA levels by hydrolyzing glucose [45]. During pollen development, the tapetum secretes various components into the pollen sac, comprising hydrolases that regulate polysaccharide metabolism and supply nutrients for microspore development [46]. These enzymes, including β-1,3 glucanase [47], endogalacturonase [34], and pectin methylesterase [48], exhibit hydrolase activities and are implicated in pollen abortion. Previous studies identified abnormal tapestrum development and callose metabolism in sterile Ningqi No. 5 and fertile Ningqi No. 1 (Figures S1 and S2) [20]. In the current study, numerous DEGs exhibited enrichment in hydrolase activity, particularly during the Te stage. Hence, tapetal development was associated with abnormal callose metabolism and hydrolase activity potentially contributing to the pollen sterilization of L. barbarum. Specifically, the β-glucanase gene secreted by the tapetum and released into the pollen sac lumen acted upon the callose surrounding the tetraspore and facilitated the release of microspores following degradation. In this study, Glu expression was limited to the tetrad stage of Ningqi No. 1 but remained undetected throughout the anther development of Ningqi No. 5, aligning with observations in A. thaliana [49,50]. Therefore, Glu, possessing hydrolase activity, was significant in influencing the male sterility of L. barbarum.

4.3. TFs Can Affect Pollen Fertility by Regulating Gene Expression

Numerous TFs participate in anther and pollen development. Auxin response factor 17 (AtARF17) influences pollen fertility through the regulation of AtCalS5 in A. thaliana [51]. The A. thaliana CALLOSE DEFECTIVE MICROSPORE1 (CDM1) gene, which encodes a tandem CCCH-type zinc finger protein, regulates callose metabolism in male meiocytes and contributes to the integrity of newly formed microspores. cdm1 mutants impact the expression of callose synthesis genes (CALLOSE SYNTHASE5 and CALLOSE synthetase 12), as well as potential callose-related genes (A6 and MYB80) and three other β-1,3-glucanase genes [52]. AtMYB103 [53] and Defective Microspore Development 1 (OsDMD1) [54] influence callose metabolism through the regulation of the Arabidopsis β-1, 3-glucanase gene AtA6 and rice OsG4, subsequently affecting pollen fertility. In the current study, multiple TFs were identified as being co-expressed with the candidate sterility gene LbGlu1, with a consistent time series. Therefore, it was hypothesized that the pollen abortion in L. barbarum may be attributable to the differential expression of LbGlu1 as regulated by TFs.

4.4. Addressing Alignment Challenges through Enhanced Genome Assembly and Annotation

In this study, we observed an alignment rate of less than 70% in our RNA-seq data. Having confirmed the high quality of our RNA samples and the correct match between our study species and the reference genome, we attribute this lower-than-expected mapping rate primarily to potential limitations in the assembly and annotation quality of the reference genome used. The presence of incomplete or erroneous assembly, misassembled regions, or outdated annotations in the reference genome can significantly impact the alignment efficiency [55,56].
To address this critical issue and improve the robustness of our transcriptomic analysis, we plan to undertake a de novo assembly of our study species’ genome. This effort will develop a more accurate and representative reference that captures the unique genetic features of our specific sample population, potentially identifying regions where the current reference may be lacking. Concurrently, a comprehensive re-annotation of the genome will be crucial. This re-annotation will utilize updated bioinformatics tools and integrate recent genomic data from related species, which might provide better insights into previously unannotated or incorrectly annotated genes.
Additionally, we will refine our bioinformatics workflows to include more rigorous quality checks and adjust alignment parameters that are better suited to our specific dataset. This involves using alignment software that can handle more complex genome features and variances, ensuring that our transcriptomic data are interpreted with the highest degree of accuracy. Improved assembly and annotation will not only enhance the mapping rate but also provide a more reliable foundation for identifying and characterizing gene functions, thus advancing our understanding of the biological processes involved.

5. Conclusions

Transcriptomic analysis of anther development in both sterile Ningqi No. 5 and fertile Ningqi No. 1 was undertaken to systematically investigate the potential causes of pollen sterilization in L. barbarum and to refine the selection of candidates for the identification of novel sterility genes, informed by DEGs analysis and WGCNA. LbGlu1 and TFs were identified as primary candidates for further analysis. Subsequent research is expected to elucidate the biological functions of these genes and clarify the molecular mechanisms contributing to pollen abortion in L. barbarum.

Supplementary Materials

The following supporting information can be downloaded at https://www.mdpi.com/article/10.3390/horticulturae10050512/s1: Figure S1: Paraffin sections of Ningqi No. 5 and Ningqi No. 1 pollen sacs at different development stages; Figure S2: Callose development in Ningqi No. 5 and Ningqi No. 1 at different development stages: red is nuclear material, and yellow is callose; Figure S3: Gene expression levels and number of expression genes; Figure S4: Volcano plots of all time points’ DEGs; Figure S5: DEGs of all control groups; Figure S6: The relationship between genes in the module and the representative traits of the module; Figure S7: The expression of genes in the MEbrown and MEred modules in different samples; Figure S8: KEGG enrichment bubble map of genes in MEbrown and MEred Modules; Figure S9: Verification of qRT-PCR expression of some genes; Table S1: Clean reads; Table S2: All genes; Table S3: DEGs; Table S4: qRT-PCR primer; Table S5: Anther DEGs at all control groups; Table S6: Functional genes; Table S7: WGCNA; Table S8: Red-brown-hub; Table S9: Co-expressed genes with LbGlu1; Table S10: Co-expressed TFs with LbGlu1; Table S11: Phylogenetic tree of Glu; Table S12: Sequence file of phylogenetic tree.

Author Contributions

Conceptualization, X.Z. and Z.B.; methodology, J.L.; software, C.W.; validation, X.Z.; formal analysis, H.M.; investigation, Z.B.; resources, J.Z. and X.Y.; data curation, W.X.; writing—original draft preparation, X.Z.; writing—review and editing, Z.B.; visualization, Z.B.; supervision, Y.R. All authors have read and agreed to the published version of the manuscript.

Funding

This study was supported by Natural Science Foundation in Ningxia Province (2023AAC03294), the National Natural Science Foundation (32360413), Scientific Research Foundation of North Minzu University (2023QNPY25) and the Key Research and Development Plan of Ningxia Province (2021BEG03109).

Data Availability Statement

The raw sequence data reported in this paper have been deposited in the Genome Sequence Archive (Genomics, Proteomics & Bioinformatics 2021) in National Genomics Data Center (Nucleic Acids Res 2022), China National Center for Bioinformation/Beijing Institute of Genomics, Chinese Academy of Sciences (GSA: CRA016215), and are publicly accessible at https://ngdc.cncb.ac.cn/gsa (accessed on 27 February 2024).

Conflicts of Interest

The authors declare no conflicts of interest.

Appendix A

Figure A1. Pollen viability test for L. barbarum. (A) Pollen grain dyeing with Ningqi No. 5, which lacks mature pollen grains. (B) Pollen grain dyeing with Ningqi No. 1, where the staining results indicate that the pollen activity is good.
Horticulturae 10 00512 g0a1

References

  1. Longin, C.F.H.; Mühleisen, J.; Maurer, H.P.; Zhang, H.; Gowda, M.; Reif, J.C. Hybrid breeding in autogamous cereals. Theor. Appl. Genet. 2012, 125, 1087–1096. [Google Scholar] [CrossRef]
  2. Wilson, Z.A.; Zhang, D.-B. From Arabidopsis to rice: Pathways in pollen development. J. Exp. Bot. 2009, 60, 1479–1492. [Google Scholar] [CrossRef]
  3. Alves-Ferreira, M.; Wellmer, F.; Banhara, A.; Kumar, V.; Riechmann, J.L.; Meyerowitz, E.M. Global expression profiling applied to the analysis of Arabidopsis stamen development. Plant Physiol. 2007, 145, 747–762. [Google Scholar] [CrossRef]
  4. Wijeratne, A.J.; Zhang, W.; Sun, Y.; Liu, W.; Albert, R.; Zheng, Z.; Oppenheimer, D.G.; Zhao, D.; Ma, H. Differential gene expression in Arabidopsis wild-type and mutant anthers: Insights into anther cell differentiation and regulatory networks. Plant J. 2007, 52, 14–29. [Google Scholar] [CrossRef]
  5. Chang, H.-S.; Zhang, C.; Chang, Y.-H.; Zhu, J.; Xu, X.-F.; Shi, Z.-H.; Zhang, X.-L.; Xu, L.; Huang, H.; Zhang, S. No primexine and plasma membrane undulation is essential for primexine deposition and plasma membrane undulation during microsporogenesis in Arabidopsis. Plant Physiol. 2012, 158, 264–272. [Google Scholar] [CrossRef]
  6. Lee, S.-K.; Eom, J.-S.; Hwang, S.-K.; Shin, D.; An, G.; Okita, T.W.; Jeon, J.-S. Plastidic phosphoglucomutase and ADP-glucose pyrophosphorylase mutants impair starch synthesis in rice pollen grains and cause male sterility. J. Exp. Bot. 2016, 67, 5557–5569. [Google Scholar] [CrossRef]
  7. Park, J.-I.; Ishimizu, T.; Suwabe, K.; Sudo, K.; Masuko, H.; Hakozaki, H.; Nou, I.-S.; Suzuki, G.; Watanabe, M. UDP-glucose pyrophosphorylase is rate limiting in vegetative and reproductive phases in Arabidopsis thaliana. Plant Cell Physiol. 2010, 51, 981–996. [Google Scholar] [CrossRef]
  8. Hirose, T.; Hashida, Y.; Aoki, N.; Okamura, M.; Yonekura, M.; Ohto, C.; Terao, T.; Ohsugi, R. Analysis of gene-disruption mutants of a sucrose phosphate synthase gene in rice, OsSPS1, shows the importance of sucrose synthesis in pollen germination. Plant Sci. 2014, 225, 102–106. [Google Scholar] [CrossRef]
  9. Sivitz, A.B.; Reinders, A.; Ward, J.M. Arabidopsis sucrose transporter AtSUC1 is important for pollen germination and sucrose-induced anthocyanin accumulation. Plant Physiol. 2008, 147, 92–100. [Google Scholar] [CrossRef]
  10. Somashekar, H.; Mimura, M.; Tsuda, K.; Nonomura, K.-I. Rice GLUCAN SYNTHASE-LIKE5 promotes anther callose deposition to maintain meiosis initiation and progression. Plant Physiol. 2023, 191, 400–413. [Google Scholar] [CrossRef]
  11. Scott, R.J.; Spielman, M.; Dickinson, H. Stamen structure and function. Plant Cell 2004, 16, S46–S60. [Google Scholar] [CrossRef]
  12. Hird, D.L.; Worrall, D.; Hodge, R.; Smartt, S.; Paul, W.; Scott, R. The anther-specific protein encoded by the Brassica napus and Arabidopsis thaliana A6 gene displays similarity to β-1, 3-glucanases. Plant J. 1993, 4, 1023–1033. [Google Scholar] [CrossRef]
  13. Wan, L.; Zha, W.; Cheng, X.; Liu, C.; Lv, L.; Liu, C.; Wang, Z.; Du, B.; Chen, R.; Zhu, L. A rice β-1, 3-glucanase gene Osg1 is required for callose degradation in pollen development. Planta 2011, 233, 309–323. [Google Scholar] [CrossRef]
  14. Shi, X.; Sun, X.; Zhang, Z.; Feng, D.; Zhang, Q.; Han, L.; Wu, J.; Lu, T. GLUCAN SYNTHASE-LIKE 5 (GSL5) plays an essential role in male fertility by regulating callose metabolism during microsporogenesis in rice. Plant Cell Physiol. 2015, 56, 497–509. [Google Scholar] [CrossRef]
  15. Wang, D.; Li, L.; Yang, H.; Ferguson, S.S.; Baer, M.R.; Gartenhaus, R.B.; Wang, H. The constitutive androstane receptor is a novel therapeutic target facilitating cyclophosphamide-based treatment of hematopoietic malignancies. Blood J. Am. Soc. Hematol. 2013, 121, 329–338. [Google Scholar] [CrossRef]
  16. Dong, X.; Hong, Z.; Sivaramakrishnan, M.; Mahfouz, M.; Verma, D.P.S. Callose synthase (CalS5) is required for exine formation during microgametogenesis and for pollen viability in Arabidopsis. Plant J. 2005, 42, 315–328. [Google Scholar] [CrossRef]
  17. Enns, L.C.; Kanaoka, M.M.; Torii, K.U.; Comai, L.; Okada, K.; Cleland, R.E. Two callose synthases, GSL1 and GSL5, play an essential and redundant role in plant and pollen development and in fertility. Plant Mol. Biol. 2005, 58, 333–349. [Google Scholar] [CrossRef]
  18. Amagase, H.; Farnsworth, N.R. A review of botanical characteristics, phytochemistry, clinical relevance in efficacy and safety of Lycium barbarum fruit (Goji). Food Res. Int. 2011, 44, 1702–1717. [Google Scholar] [CrossRef]
  19. Chang, R.C.-C.; So, K.-F. Use of anti-aging herbal medicine, Lycium barbarum, against aging-associated diseases. What do we know so far? Cell. Mol. Neurobiol. 2008, 28, 643–652. [Google Scholar] [CrossRef]
  20. Zhang, X.; Bei, Z.; Ma, H.; Wei, Z.; Zhou, J.; Ren, Y.; Xu, W.; Nan, P.; Wang, Y.; Li, L. Abnormal Programmed Cell Death of Tapetum Leads to the Pollen Abortion of Lycium barbarum Linnaeus. Horticulturae 2022, 8, 1056. [Google Scholar] [CrossRef]
  21. Portillo, M.; Fenoll, C.; Escobar, C. Evaluation of different RNA extraction methods for small quantities of plant tissue: Combined effects of reagent type and homogenization procedure on RNA quality-integrity and yield. Physiol. Plant. 2006, 128, 1–7. [Google Scholar] [CrossRef]
  22. Kim, D.; Langmead, B.; Salzberg, S.L. HISAT: A fast spliced aligner with low memory requirements. Nat. Methods 2015, 12, 357–360. [Google Scholar] [CrossRef]
  23. Langmead, B.; Salzberg, S.L. Fast gapped-read alignment with Bowtie 2. Nat. Methods 2012, 9, 357–359. [Google Scholar] [CrossRef]
  24. Li, B.; Dewey, C.N. RSEM: Accurate transcript quantification from RNA-Seq data with or without a reference genome. BMC Bioinform. 2011, 12, 323. [Google Scholar] [CrossRef]
  25. Conesa, A.; Gotz, S.; Garcia-Gomez, J.M.; Terol, J.; Talon, M.; Robles, M. Blast2GO: A universal tool for annotation, visualization and analysis in functional genomics research. Bioinformatics 2005, 21, 3674–3676. [Google Scholar] [CrossRef]
  26. Livak, K.J.; Schmittgen, T.D. Analysis of relative gene expression data using real-time quantitative PCR and the 2−ΔΔCT method. Methods 2001, 25, 402–408. [Google Scholar] [CrossRef]
  27. Love, M.I.; Huber, W.; Anders, S. Moderated estimation of fold change and dispersion for RNA-seq data with DESeq2. Genome Biol. 2014, 15, 550. [Google Scholar] [CrossRef]
  28. Langfelder, P.; Horvath, S. WGCNA: An R package for weighted correlation network analysis. BMC Bioinform. 2008, 9, 559. [Google Scholar] [CrossRef]
  29. Wickham, H.; Chang, W.; Henry, L.; Pedersen, T.L.; Takahashi, K.; Wilke, C.; Woo, K.; Yutani, H.; Dunnington, D. ggplot2: Create Elegant Data Visualisations Using the Grammar of Graphics. R Package Version 2016, 2. Available online: https://ggplot2.tidyverse.org/reference/ggplot2-package.html (accessed on 12 March 2024).
  30. Horvath, S.; Dong, J. Geometric interpretation of gene coexpression network analysis. PLoS Comput. Biol. 2008, 4, e1000117. [Google Scholar] [CrossRef]
  31. Kumar, S.; Stecher, G.; Tamura, K. MEGA7: Molecular evolutionary genetics analysis version 7.0 for bigger datasets. Mol. Biol. Evol. 2016, 33, 1870–1874. [Google Scholar] [CrossRef] [PubMed]
  32. Doxey, A.C.; Yaish, M.W.; Moffatt, B.A.; Griffith, M.; McConkey, B.J. Functional divergence in the Arabidopsis β-1, 3-glucanase gene family inferred by phylogenetic reconstruction of expression states. Mol. Biol. Evol. 2007, 24, 1045–1055. [Google Scholar] [CrossRef] [PubMed]
  33. Simpson, C.; Thomas, C.; Findlay, K.; Bayer, E.; Maule, A.J. An Arabidopsis GPI-anchor plasmodesmal neck protein with callose binding activity and potential to regulate cell-to-cell trafficking. Plant Cell 2009, 21, 581–594. [Google Scholar] [CrossRef] [PubMed]
  34. Yu, S.-M.; Lo, S.-F.; Ho, T.-H.D. Source–sink communication: Regulated by hormone, nutrient, and stress cross-signaling. Trends Plant Sci. 2015, 20, 844–857. [Google Scholar] [CrossRef] [PubMed]
  35. Lemoine, R.; La Camera, S.; Atanassova, R.; Dédaldéchamp, F.; Allario, T.; Pourtau, N.; Bonnemain, J.-L.; Laloi, M.; Coutos-Thévenot, P.; Maurousset, L. Source-to-sink transport of sugar and regulation by environmental factors. Front. Plant Sci. 2013, 4, 53278. [Google Scholar] [CrossRef] [PubMed]
  36. Goetz, M.; Godt, D.E.; Guivarc’h, A.; Kahmann, U.; Chriqui, D.; Roitsch, T. Induction of male sterility in plants by metabolic engineering of the carbohydrate supply. Proc. Natl. Acad. Sci. USA 2001, 98, 6522–6527. [Google Scholar] [CrossRef]
  37. Suzuki, T.; Narciso, J.O.; Zeng, W.; van de Meene, A.; Yasutomi, M.; Takemura, S.; Lampugnani, E.R.; Doblin, M.S.; Bacic, A.; Ishiguro, S. KNS4/UPEX1: A type II arabinogalactan β-(1, 3)-galactosyltransferase required for pollen exine development. Plant Physiol. 2017, 173, 183–205. [Google Scholar] [CrossRef]
  38. Rhee, S.Y.; Osborne, E.; Poindexter, P.D.; Somerville, C.R. Microspore separation in the quartet 3 mutants of Arabidopsis is impaired by a defect in a developmentally regulated polygalacturonase required for pollen mother cell wall degradation. Plant Physiol. 2003, 133, 1170–1180. [Google Scholar] [CrossRef] [PubMed]
  39. Honys, D.; Twell, D. Comparative analysis of the Arabidopsis pollen transcriptome. Plant Physiol. 2003, 132, 640–652. [Google Scholar] [CrossRef]
  40. Santiago, J.P.; Sharkey, T.D. Pollen development at high temperature and role of carbon and nitrogen metabolites. Plant Cell Environ. 2019, 42, 2759–2775. [Google Scholar] [CrossRef]
  41. Fujii, S.; Komatsu, S.; Toriyama, K. Retrograde regulation of nuclear gene expression in CW-CMS of rice. Plant Mol. Biol. 2007, 63, 405–417. [Google Scholar] [CrossRef] [PubMed]
  42. Minic, Z. Physiological roles of plant glycoside hydrolases. Planta 2008, 227, 723–740. [Google Scholar] [CrossRef]
  43. Tohge, T.; de Souza, L.P.; Fernie, A.R. Current understanding of the pathways of flavonoid biosynthesis in model and crop plants. J. Exp. Bot. 2017, 68, 4013–4028. [Google Scholar] [CrossRef] [PubMed]
  44. Cao, Y.-Y.; Yang, J.-F.; Fan, T.; Ye, N.-H.; Liu, Y.-G. A phylogenetically informed comparison of GH1 hydrolases between Arabidopsis and rice response to stressors. Front. Plant Sci. 2017, 8, 233759. [Google Scholar] [CrossRef] [PubMed]
  45. Miyahara, T. The Acyl-Glucose-Dependent Anthocyanin Glucosyltransferases of Angiosperm. Ph.D. Thesis, Tokyo University of Agriculture and Technology, Fuchū, Japan, 2013. [Google Scholar]
  46. Zhang, D.; Yang, L. Specification of tapetum and microsporocyte cells within the anther. Curr. Opin. Plant Biol. 2014, 17, 49–55. [Google Scholar] [CrossRef]
  47. Tsuchiya, T.; Toriyama, K.; Yoshikawa, M.; Ejiri, S.-i.; Hinata, K. Tapetum-specific expression of the gene for an endo-β-1, 3-glucanase causes male sterility in transgenic tobacco. Plant Cell Physiol. 1995, 36, 487–494. [Google Scholar] [CrossRef] [PubMed]
  48. Francis, K.E.; Lam, S.Y.; Copenhaver, G.P. Separation of Arabidopsis pollen tetrads is regulated by QUARTET1, a pectin methylesterase gene. Plant Physiol. 2006, 142, 1004–1013. [Google Scholar] [CrossRef] [PubMed]
  49. Jopcik, M.; Matusikova, I.; Moravcikova, J.; Durechova, D.; Libantova, J. The expression profile of Arabidopsis thaliana β-1, 3-glucanase promoter in tobacco. Mol. Biol. 2015, 49, 543–549. [Google Scholar] [CrossRef]
  50. Bucciaglia, P.A.; Smith, A.G. Cloning and characterization of Tag 1, a tobacco anther β-1, 3-glucanase expressed during tetrad dissolution. Plant Mol. Biol. 1994, 24, 903–914. [Google Scholar] [CrossRef]
  51. Wang, B.; Xue, J.-S.; Yu, Y.-H.; Liu, S.-Q.; Zhang, J.-X.; Yao, X.-Z.; Liu, Z.-X.; Xu, X.-F.; Yang, Z.-N. Fine regulation of ARF17 for anther development and pollen formation. BMC Plant Biol. 2017, 17, 243. [Google Scholar] [CrossRef]
  52. Lu, P.; Chai, M.; Yang, J.; Ning, G.; Wang, G.; Ma, H. The Arabidopsis CALLOSE DEFECTIVE MICROSPORE1 gene is required for male fertility through regulating callose metabolism during microsporogenesis. Plant Physiol. 2014, 164, 1893–1904. [Google Scholar] [CrossRef]
  53. Zhang, Z.B.; Zhu, J.; Gao, J.F.; Wang, C.; Li, H.; Li, H.; Zhang, H.Q.; Zhang, S.; Wang, D.M.; Wang, Q.X. Transcription factor AtMYB103 is required for anther development by regulating tapetum development, callose dissolution and exine formation in Arabidopsis. Plant J. 2007, 52, 528–538. [Google Scholar] [CrossRef] [PubMed]
  54. Ren, L.; Zhao, T.; Zhang, L.; Du, G.; Shen, Y.; Tang, D.; Li, Y.; Luo, Q.; Cheng, Z. Defective microspore development 1 is required for microspore cell integrity and pollen wall formation in rice. Plant J. 2020, 103, 1446–1459. [Google Scholar] [CrossRef] [PubMed]
  55. Boyle, A.P.; Hong, E.L.; Hariharan, M.; Cheng, Y.; Schaub, M.A.; Kasowski, M.; Karczewski, K.J.; Park, J.; Hitz, B.C.; Weng, S.; et al. Annotation of functional variation in personal genomes using RegulomeDB. Genome Res. 2020, 30, 1083–1096. [Google Scholar] [CrossRef] [PubMed]
  56. Sarwal, V.; Niehus, S.; Ayyala, R.; Chang, S.; Lu, A.; Darci-Maher, N.; Littman, R.; Chhugani, K.; Soylev, A.; Comarova, Z.; et al. A comprehensive benchmarking of WGS-based structural variant callers. BMC Genom. 2021, 22, 314. [Google Scholar]
Figure 1. DEGs of Ningqi No. 5 and Ningqi No. 1. (A) DEGs in control groups. (B) Venn map of DEGs in development stages. (C) GO classification map of anther DEGs at all control groups. N1-1 represents Ar, the first stage of pollen development of Ningqi No. 1; N1-2 represents Sp, the second stage of pollen development of Ningqi No. 1; N1-3 represents Pm, the third stage of pollen development of Ningqi No. 1; N1-4 represents Te, the fourth stage of pollen development of Ningqi No. 1; N1-5 represents Te, the fifth stage of pollen development of Ningqi No. 1; N5-1 represents Ar, the first stage of pollen development of Ningqi No. 5; N5-2 represents Ar, the second stage of pollen development of Ningqi No. 5; N5-3 represents Pm, the third stage of pollen development of Ningqi No. 5; N5-4 represents Te, the fourth stage of pollen development of Ningqi No. 5; and N5-5 represents Te, the fifth stage of pollen development of Ningqi No. 5.
Horticulturae 10 00512 g001
Figure 2. GO classification difference between Ningqi No. 5 and Ningqi No. 1 anthers at different development stages. Ar, archeocyte stage; Sp, sporogenous cell stage; Pm, pollen mother cell stage; Te, tetrad period; Po, pollen grain stage.
Horticulturae 10 00512 g002
Figure 3. KEGG enrichment of DEGs in Ningqi No. 5 and Ningqi No. 1. (A) KEGG enrichment of DEGs during archeocyte stage. (B) KEGG enrichment of DEGs during sporogenous cell stage. (C) KEGG enrichment of DEGs during pollen mother cell stage. (D) KEGG enrichment of DEGs during tetrad stage. (E) KEGG enrichment of DEGs during pollen grain stage.
Horticulturae 10 00512 g003
Figure 4. KEGG enrichment of DEGs in Ningqi No. 5 and Ningqi No. 1. (A) DEGs related to energy metabolism. (B) DEGs related to pollen development. (C) DEGs related to hydrolase activity. (D) DEGs related to active oxygen metabolism.
Horticulturae 10 00512 g004
Figure 5. WGCNA analysis of DEGs and co-expression of DEGs and TFs with LbGlu1. (A) WGCNA analysis of DEGs, which shows the correlation between modules and traits. Each cell contains a correlation coefficient and a p value; the red is positively correlated with fertile traits, and the blue is positively correlated with non-fertile traits. (B) Co-expressed DEGs with LbGlu1 gene. (C) Co-expressed TFs with LbGlu1.
Horticulturae 10 00512 g005
Figure 6. Phylogenetic tree of Glu protein. All Glu proteins divided into three branches, namely, α, β, and γ. The red arrow points to LbGlu1. The green arrow points to At4g14080.
Horticulturae 10 00512 g006
Disclaimer/Publisher’s Note: The statements, opinions and data contained in all publications are solely those of the individual author(s) and contributor(s) and not of MDPI and/or the editor(s). MDPI and/or the editor(s) disclaim responsibility for any injury to people or property resulting from any ideas, methods, instructions or products referred to in the content.

