Article

The Synergetic Effect of Light Spectra and Selenium Supplementation on Eruca sativa Mill. Growth and Physiological and Metabolic Responses

1
CITAB–Centre for the Research and Technology of Agro-Environmental and Biological Sciences, University of Trás-os-Montes and Alto Douro (UTAD), Quinta de Prados, 5000-801 Vila Real, Portugal
2
Inov4Agro–Institute for Innovation, Capacity Building and Sustainability of Agri-Food Production, University of Trás-os-Montes and Alto Douro (UTAD), Quinta de Prados, 5000-801 Vila Real, Portugal
3
Department of Agriculture and Forestry Sciences, University of Trás-os-Montes and Alto Douro (UTAD), Quinta de Prados, 5000-801 Vila Real, Portugal
4
Chemistry Department, University of Trás-os-Montes and Alto Douro, 5000-801 Vila Real, Portugal
*
Author to whom correspondence should be addressed.
Horticulturae 2024, 10(5), 511; https://doi.org/10.3390/horticulturae10050511
Submission received: 11 April 2024 / Revised: 9 May 2024 / Accepted: 14 May 2024 / Published: 15 May 2024
(This article belongs to the Section Vegetable Production Systems)

Abstract

:
Eco-friendly lighting systems, like LED lights, can reduce energy consumption in greenhouse operations, have a long lifespan, and enable precise control over plant growth through spectrum selection. On the other hand, Selenium (Se) is a micronutrient with a beneficial role in plant metabolism and an essential element for human health. In this study, we aim to unravel the effects of LED lighting combined with Se supplementation on the physiological behavior, yield, and quality of arugula (Eruca sativa). Arugula plants were cultivated under controlled conditions using two distinct LED lights: full white spectrum (W) and a mix of 80%/20% of red/blue light (R:B). These plants were then supplemented with three levels of Se: 0 mg Se kg−1 soil [0], 0.3 mg Se kg−1 soil [0.3], and 0.6 mg Se kg−1 soil [0.6]. The results showed that stomatal conductance remained unaffected by the light script. However, the plants exposed to R:B displayed more pronounced signs of photodamage and reduced net photosynthetic rate. Supplementation with Se plays a significant role in mitigating light-induced stress and in improving the antioxidant defense system; this was especially notable in R:B plants. Finally, R:B light decreased the accumulation of aboveground biomass, while no significant impact of Se was noticed on this outcome. Se accumulation exhibited a direct and proportional relationship with the concentration of Se applied. The integration of LED technology and Se supplementation not only enhances crop nutritional value but also aligns with the adoption of more sustainable agricultural practices.

1. Introduction

Light is a crucial factor for the successful growth and development of crops. Specifically, light intensity and quality are the primary determinants of the photosynthetic transformation of atmospheric CO2 into carbohydrates [1]. The main source of light is the sun, but its characteristics depend on various factors related to the latitude, longitude, and altitude of the location and the season of the year. In cases where natural light is insufficient to meet crop demands, which normally happens in closed greenhouses, artificial lighting is mandatory. For decades, artificial lighting involved the use of inefficient and environmentally unfriendly fluorescent or incandescent lamps. Nowadays, LED (light emitting diode) lights have been preferred in the most diverse indoor environments, including even strengthening the pitches of modern football stadiums [2]. They are a more cost-effective and environmentally friendly alternative, have a longer lifespan, and allow the modulation of their radiation spectrum to optimize plant growth and development [3,4,5]. Photosynthetically active radiation (PAR, 400–700 nm) is needed for photosynthesis and plant growth [6]. However, plants do not similarly absorb all wavelengths of visible light. Photosynthetic pigments are more efficient in capturing red (R) and blue (B) radiation compared to other spectral regions, while the absorption of green (G) light remains quite minimal [3,4]. Light quality also elicits distinct responses in plant photomorphogenesis [4]. Within the light spectrum, the R region (600–700 nm) induced the highest quantum yield of CO2 assimilation by plants, followed by the G (500–600 nm) and B (400–500 nm) regions [7]. Moreover, the photoreceptor systems are mostly activated by R and B lights, controlling plant development and cellular metabolism [6]. Although R light alone can sustain plant growth and photosynthesis, it is insufficient for optimal plant development [3]. Combining both R and B lights, in the appropriate proportions, can be advantageous for enhancing the plant morphogenesis and physiological responses [8,9,10]. Red light affects the balance between inactive and active forms of phytochromes, influencing several light-induced reactions, including seed germination, leaf expansion, and chloroplast development [11]. On the other hand, B light, perceived through cryptochromes, regulates various plant processes, including gene activation, stomatal opening, phototropism, the inhibition of stem elongation, pigment biosynthesis, and chloroplast movement within cells [12].
Selenium (Se) is a micronutrient generally found in soils in low concentrations, ranging from 0.01 and 2 mg kg−1, within a global average of 0.4 mg kg−1 [13,14]. The main source of Se intake is through the consumption of vegetable products, whose concentration depends on soil Se levels [15]. Se is an essential micronutrient for humans. It is a structural component of some important enzymes and proteins and plays important functions in human health; it has antioxidant and anticancer effects and contributes to immune responses and the prevention of cardiovascular diseases [16]. The recommended dietary allowance (RDA) for Se is set at 55 μg day−1 for healthy adults [17]. However, it is estimated that about one billion people have Se deficiency problems [16]. On the other hand, in excessive amounts, Se can be toxic, with the tolerable upper intake level (UL) for adults being set at 400 μg day−1 (IM, 2000). For plants, although considered non-essential, low dosages can be beneficial for growth and development, crop yield, and quality and can confer tolerance to abiotic stresses [16,18]. It has been reported that the beneficial effect of low doses of Se on plants is related to the induced enhancement of the antioxidant defense system (antioxidant enzymes and secondary metabolites), protecting plants from the action of reactive oxygen species (ROS) [18,19,20,21]. Improvements in protein and photosynthetic pigment synthesis, the efficiency of photosynthesis, plant nutrition, plant biomass production, and yield have been reported with low doses of Se in different species [22,23,24,25,26]. The most effective way to compensate for the low Se intake in humans is through the production of Se-enriched functional foods, i.e., biofortification [14]. Selenium biofortification primarily focuses on enhancing crops by adding Se and antioxidants for human and animal nutrition and health improvement. Secondly, it can also boost crop yields in challenging conditions, mitigating the negative effects of such environments on plant physiology [14]. All plants are able to take up, metabolize, and accumulate Se in their tissues. Based on their ability to absorb Se, plant species can be classified as hyperaccumulators (>1000 mg kg−1DW), secondary accumulators (100–1000 mg kg−1DW), and non-accumulators (<100 mg kg−1DW) [18].
Arugula (Eruca sativa Mill.) is a leaf vegetable that is widely consumed, rich in various nutrients and phytonutrients, including potassium, calcium, vitamins A, C, and E, folate, as well as flavonoids and other antioxidants, and has great potential for functional food production [27,28,29]. This species belongs to the Brassicaceae family and can be considered a secondary accumulator of Se [30].
The central goal of this study is to provide valuable insights for enhancing arugula cultivation techniques in vertical farming to achieve superior crop performance and improved nutritional quality. To achieve this goal, this study has the following specific objectives: (1) to assess the impact of two distinct LED light systems on the physiological behavior, yield, and quality of arugula grown in controlled greenhouse conditions; (2) to investigate the potential benefits of Se enrichment in enhancing the physiological responses, yield, and quality of arugula plants; and (3) to explore and gain a deeper understanding of the interactions between different illumination systems and Se enrichment and their combined effects.

2. Materials and Methods

2.1. Plant Material and Growing Conditions

The experiments were conducted from March to April of 2023 at the University of Trás-os-Montes and Alto Douro, Vila Real, Portugal. Arugula (Eruca sativa Mill), (Lote 34649CINOCP-DGADR, Alípio Dias & Irmão, Lda., Porto, Portugal) plants were grown under fully controlled environmental conditions in a growth chamber (215 cm × 215 cm × 240 cm). A temperature of 21 ± 3/16 ± 3 °C day/night, relative air humidity of 71 ± 7/83 ± 7% day/night, and a photoperiod of 14 h light/10 h dark were maintained. The chamber was equipped with LED lamps (OSRAM, Premstaetten, Austria), with each one placed on the top of separate cells (60 × 90 × 72 cm) in a fixed position, ensuring the most homogenous light distribution on a horizontal surface.
The seeds were sown in alveolar trays filled with germination substrate (Nutrofertil—136 Nutrição e Fertilizantes, Lda., Santiago de Besteiros, Portugal) with the following characteristics: total N 100–150 mg L−1, total P (P2O5) 100–150 mg L−1, total K (K2O) 120–170 mg L−1, organic matter > 80%, pH 5.5–6.5. They were watered to field capacity and placed to germinate in the growth chamber.
After germination, arugula seedlings, with two true leaves, were transplanted into pots (12 cm height × 12.5 cm diameter), with two seedlings per pot, filled with a mixture (80/20, 270 g) of universal substrate (Nutrofertil—Nutrição e Fertilizantes, Lda., Santiago de Besteiros, Portugal) with the following characteristics: total N 150–200 mg L−1, total P (P2O5) 150–190 mg L−1, total K (K2O) 200–300 mg L−1, organic matter > 80%, pH 5.5–6.5/perlite (Perligran Premium, Knauf Aquapanel GmbH, Dortmund, Germany) with a density of 0.0173 g m−2. All pots were watered to field capacity. Subsequently, throughout the experiment, all pots were maintained at 80 to 90% of field capacity. Five irrigations were carried out (a total of 400 mL in treatment W and 375 mL in treatment R:B) using a nutrient solution. The nutrient solution was prepared by diluting 3 mL of a stock solution with the following characteristics: N 12%, P2O5 4%, K2O 6%, B 0.02%, Cu 0.01%, Fe 0.02%, Mn 0.01%, Mo 0.005%, Zn 0.005%, in 1 L of water.

2.2. Experimental Design
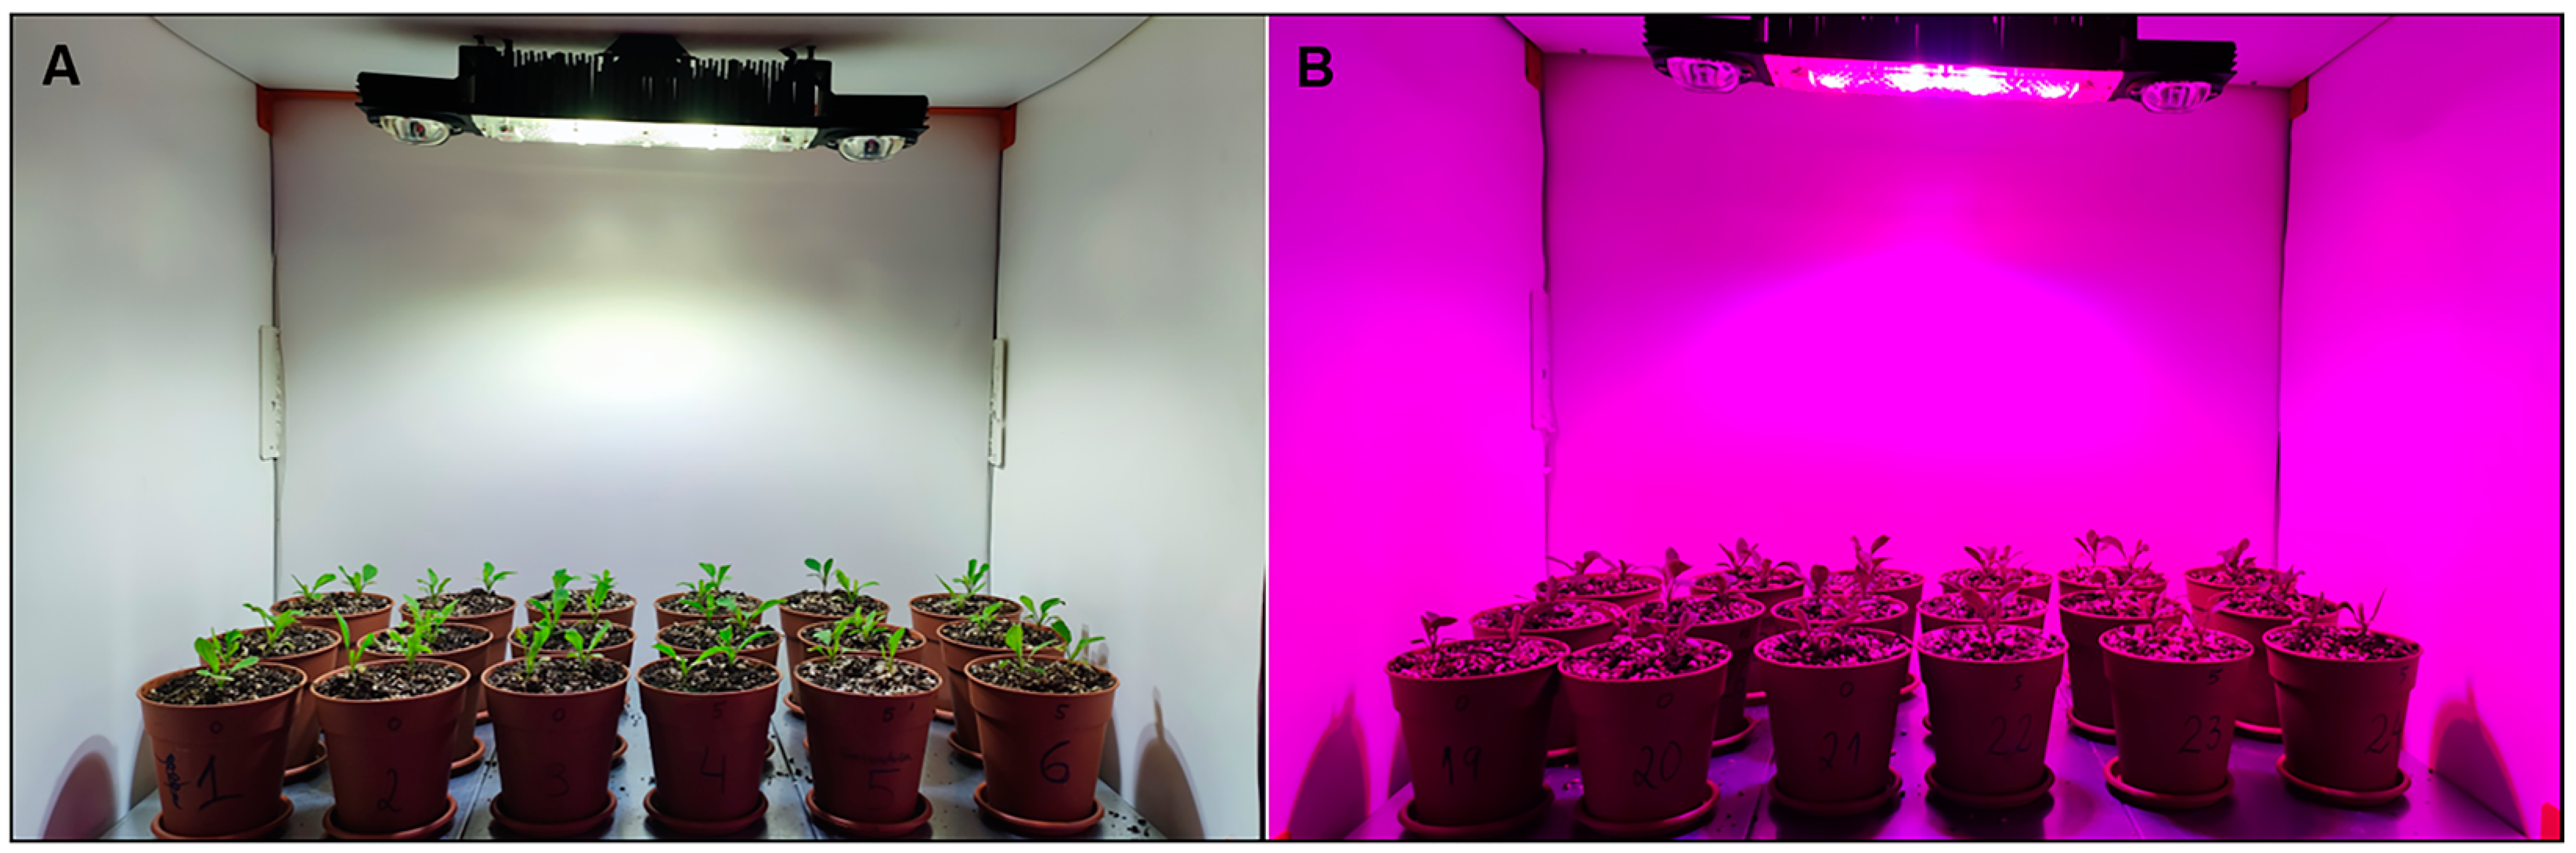
In this experiment, two different lighting systems were studied, and within each of them, the influence of three levels of selenium was evaluated.

2.2.1. Illumination

Two light treatments were applied from sowing to harvest: the W treatment, which consisted of full spectra of cool white light (29% B, 47% G, and 24% R), and the R:B treatment, with spectra composed of 80% R and 20% B (Figure 1). Both lighting treatments had a fixed photosynthetic photon flux density (PPFD) of ~300 µmol m−2 s−1, as described for arugula plants in Ying et al. [31]. The spectra of the resulting lamp systems were measured with a spectrometer (StellarNet BLACK-Comet Model CXR-SR, StellarNet Inc., Tampa, FL, USA). The software SpectraWiz Spectrometer OS v5.33 (StellarNet Inc., Tampa, FL, USA) was used to acquire and process the data from the sensor. In each treatment, 18 pots were cultivated, each with two plants, and their positions were periodically exchanged within their respective treatment cells to ensure uniform incident radiation for all.

2.2.2. Selenium

Fifteen days after transplantation, when they were already established, an aqueous solution of sodium selenate (Na2SeO4) was applied to soil in different concentrations. A control group without selenium, 0 mg Se kg−1 soil [0], was implemented, and a solution of Na2SeO4 was applied to achieve concentrations of 0.3 mg Se kg−1 soil [0.3] and 0.6 mg Se kg−1 soil [0.6]. The Na2SeO4 solutions were applied twice in a four-day interval. For each of the selenium treatments, six pots were cultivated, each with two plants.

2.2.3. Final Treatments

Then, the arugula plants were grown under the influence of six distinct treatments, as follows: white light without selenium (W [0]); white light with 0.3 mg Se kg−1 soil (W [0.3]); white light with 0.6 mg Se kg−1 soil (W [0.6]); red and blue light without selenium (R:B [0]); red and blue light with 0.3 mg Se kg−1 soil (R:B [0.3]); and red and blue light with 0.6 mg Se kg−1 soil (R:B [0.6]). Each individual treatment had six pots, each with 2 plants, for a total of 12 plants (Figure 2). All parameters were monitored 24 days after transplantation. Six plants were used for the analysis of aboveground biomass accumulation and selenium quantification, and additional six plants were used for physiological and biochemical assays.

2.3. Plant Measurements

2.3.1. Leaf Gas Exchange and Chlorophyll a Fluorescence

Leaf gas exchange measurements were performed using a portable IRGA (LCpro T, ADC, Hoddesdon, UK), operating in the open mode. The measurements were taken within the respective growth chambers, under the conditions to which the plants were exposed during the experiment. Net photosynthetic rate (A, µmol CO2 g−1 s−1), stomatal conductance (gs, mmol H2O g−1 s−1), and the ratio of intercellular to atmospheric CO2 concentration (Ci/Ca) were estimated using the equations developed by von Caemmerer and Farquhar [32]. Intrinsic water use efficiency was calculated as the ratio of A/gs (µmol mol−1).
Chlorophyll a fluorescence parameters were measured in the same leaves and environmental conditions used for gas exchange measurements, with a pulse amplitude modulation fluorometer (mini-PAM, photosynthesis yield analyzer; Walz, Effeltrich, Germany) using two scripts. In the first script, measurements were performed on leaves that were fully exposed to the light. For this procedure, after a 35-s exposure to actinic light (1450 μmol m−2 s−1), light-adapted steady-state fluorescence yield (Fs) was averaged, followed by exposure to a saturating light pulse (6000 μmol m−2 s−1) for 0.6 s to establish F’m. The sample was then shaded for 5 s with a far-red light source to determine F’0. In the second script, the same leaf portion used previously was dark-acclimated for 30–45 min by a dark leaf clip (DLC-8). After this period, the minimal fluorescence (F0) was measured when all photosystem II (PSII) reaction centers were open using a low-intensity pulsed measuring light source. The maximal fluorescence (Fm) was measured when all PSII reaction centers were closed during a pulse of saturating light (6000 μmol m−2 s−1). From this protocol, several fluorescence attributes were calculated [33,34]: maximum photochemical efficiency of PSII given by Fv/Fm = (Fm − F0)/Fm, the efficiency of electron transport as a measure of the effective quantum efficiency of PSII (ΦPSII = ΔF/F’m = (F’m − Fs)/F’m), photochemical efficiency of open reaction centers under natural irradiance (F’v/F’m), as a measure of a decline in the efficiency of the excitation capture by open PSII reaction centers due to an increase in NPQ, photochemical quenching (qP = (F’m − Fs)/(F’m − F’0)), non-photochemical quenching (NPQ = (Fm − F’m)/F’m), and photosynthetic electron transport rate (ETR) (µmol electrons m−2 s−1) = (ΔF/F’m) × PPFD × 0.5 × 0.84, where PPFD is the photosynthetic photon flux density incident on the leaf, 0.5 is the factor that assumes equal distribution of energy between the two photosystems, and the leaf absorbance used was 0.84 since it is the most common value for C3 plants.

2.3.2. Biochemical Assays

After measuring gas exchange and chlorophyll a fluorescence, the aboveground parts of the plants were cut and immediately frozen in liquid nitrogen. The leaves of each plant were macerated with liquid nitrogen, and the obtained powder was used for the biochemical analyses. The final results were expressed on a dry weight (DW) basis.
Chlorophylls and carotenoids were extracted with 80% (v/v) acetone. Chlorophyll a (Chla), chlorophyll b (Chlb), and total chlorophyll (Chl(a+b)) were determined according to Arnon [35] and Sesták et al. [36], and total carotenoids (Car) were determined according to Lichtenthaler [37].
In order to determine the content of phenolic compounds, methanolic extracts were prepared. A total of 1.5 mL of MeOH:H2O (70:30) was added to 40 mg of leaf powder. After shaking 30 min at room temperature, the samples were centrifuged at 1000× g for 10 min. This step was repeated three times. The volume was adjusted to 5 mL with MeOH:H2O (70:30). Total phenolic compounds (TPC) were quantified according to an adaptation of the procedure described by Shahidi and Naczk [38], using gallic acid as a standard. Flavonoids were determined according to an adaptation of procedure described by Jia et al. [39], using catechin as a standard. The concentration of ortho-diphenols (O-D) was determined according to the method described by Mateos et al. [40], using gallic acid as a standard.
The antioxidant activity was determined using the ABTS (2,2′-azino-bis(3-ethylbenzothiazoline-6-sulfonic acid)) method, following the adapted procedure from Ozgen et al. [41]. To quantify the percentage of inhibition, the Trolox standard curve was used with the following formula: % inhibition = (Abs 734ABTS − Abs 734sample/Abs 734ABTS) × 100.
The determination of anthocyanins (Anth) was carried out according to the pH differential method described by Lee [42].
Total soluble proteins (TSP) were quantified using the method of Bradford [43], using bovine serum albumin as a standard.
Total soluble sugars (TSS) were extracted according to Irigoyen et al. [44] by heating 25 mg of leaf powder in 80% ethanol for 1 h at 80 °C. TSS were quantified by spectrophotometry reading absorbance at 625 nm after the reaction of the alcoholic extract with fresh anthrone in a boiling water bath for 10 min. Glucose was used as a standard.

2.3.3. Growth and Selenium Quantification

The aboveground biomass (A-biomass) of each plant was weighed after the harvest and then dried at 70 °C until constant weight.
The selenium content was determined in the dried A-biomass after being ground. For digestion, 2 mL of HNO3 and 1 mL of 30% H2O2 were added to each digestion tube and allowed to digest at room temperature. After 24 h, the digestion tubes were placed in a reactor (Techne), protected with a glass sphere on top to prevent the evaporation of volatile forms of Se. The samples were heated to 60 °C, gradually increasing the temperature up to 150 °C, at which point the samples were left to digest until all organic matter was released. Once the sediment and the mixture turned colorless, the glass spheres were removed to allow the solvent (nitric acid) to evaporate. After the bottles cooled down, 0.5 mL of 5 M HCl solution was added, and then they were placed in the reactor and heated to 100 °C for 30 min to reduce selenate to selenite. After cooling the tubes again, 10 mL of 0.01 M EDTA and 2 mL of DAN were added. The tubes were closed with caps and kept at 60 °C for 30 min. Finally, each tube was vortexed, and about 2 mL of the derivatized solution was extracted into a cuvette for the fluorimeter (Cary Eclipse fluorescence spectrophotometer, Varian, Palo Alto, CA, USA) to determine selenium content by measuring excitation at 375 nm and emission at 525 nm. For quantification, a calibration curve was used (adapted from Reaner et al. [45] and Costa_Silva et al. [46]).

2.3.4. Statistical Analysis

Statistical analyses were conducted using the JMP statistical software v. Pro 14 (SAS Institute Inc., Cary, NC, USA). Before performing the analysis of variance (ANOVA), the ANOVA assumptions were tested (homogeneity of variances with Levene’s mean test and normality with the Kolmogorov–Smirnov test). Data was analyzed using a two-way ANOVA considering the separate effects of Light, [Se], and Light × [Se] interaction. An n = 18 per treatment was used for the Light regime, and an n = 6 was used for each [Se] and each Light × [Se] interaction. Significance levels were denoted as follows: “ns” for no significant difference, and *, **, *** denote significant differences at p < 0.05, p < 0.01, p < 0.001, respectively. In the case of significant differences, means were then compared by Tukey’s post-hoc test at 5% significance level.

3. Results

Light quality influenced significantly the leaf gas exchange of arugula plants (Table 1). The net photosynthetic rate (A) decreased when exposed to R:B light compared to W light. In turn, stomatal conductance (gs) remained unaffected by the light conditions. Overall, the intercellular to atmospheric CO2 concentration (Ci/Ca) ratio was enhanced under R:B light, while intrinsic water use efficiency (A/gs) showed a significant reduction (38.6%). No significant effect of [Se] or Light × [Se] interaction was observed for leaf gas exchange parameters.
Chlorophyll a fluorescence parameters are shown in Table 2. The light quality also strongly impacted these parameters. When compared to the W light, the R:B light decreased the maximum and the effective quantum efficiency of photosystem II (Fv/Fm and ΦPSII, respectively), the photochemical efficiency of open reaction centers under natural irradiance (Fv’/Fm’), and the apparent electron transport rate (ETR) while increasing the non-photochemical quenching (NPQ). On the other side, no significant effect of [Se] was observed for chlorophyll a fluorescence parameters. A significant Light × [Se] interaction was observed in some parameters. When subjected to W illumination, Se concentration had no discernible effect on ΦPSII, Fv’/Fm’, and ETR parameters; however, under R:B lighting, Se concentration increased them.
The variations in leaf pigment concentrations across the different treatments are presented in Table 3. Light conditions also modulated these metabolites’ responses, the exposure to R:B light led to a reduction in total chlorophylls (Chl(a+b)) and carotenoids (Car) concentration and total chlorophylls/carotenoids (Chl(a+b)/Car) ratio. At the same time, Se application promoted both Chl(a+b) and Car concentration.
A significant Light × [Se] interaction was found for Chl(a+b). A statistically significant increase in these pigments under W light was observed by the application of 0.3 mg Se Kg soil−1, while under R:B light, the improvement was only accomplished with [0.6]. Regarding the ratios Chla/b and Chl(a+b)/Car, no consistent effects were observed.
The impact of lighting conditions and Se application on leaf phenolic compounds and antioxidant capacity can be seen in Table 4. Light affected the concentration of some of these compounds: total phenolic compounds (TPC), flavonoids, and anthocyanins (Anth) concentration were significantly reduced when exposed to R:B light. The applied selenium concentration also modulated the accumulation of TPC, ortho-diphenols (O-D), and the total antioxidant capacity (TAC), increasing them with the application of 0.6 mg Se Kg soil−1. The Anth concentration increased proportionally with the Se concentration applied. A significant Light × [Se] interaction was found for Anth; the Se effect was only observed when plants were subjected to R:B illumination, increasing proportionally with the Se concentration.
Table 5 provides insights into the effect of lighting conditions and Se application on the accumulation of total soluble proteins (TSP) and total soluble sugars (TSS) in arugula leaves. No influence of the light regime was observed in the accumulation of these metabolites. On the other hand, Se increased their accumulation, TSP with both [0.3] and [0.6], and TSS only with [0.6]. No significant effect of Light × [Se] interaction was observed on these metabolites.
The lighting conditions also modulated the accumulation of aboveground biomass (A-Biomass) (Table 6), with a decrease (~15%) noted under R:B light. However, neither the [Se] nor Light × [Se] interaction had a significant impact on this variable. Table 6 also illustrates the effects of the treatments on Se accumulation in aboveground biomass. While light conditions had no discernible effect on its accumulation, Se accumulation displayed a direct and proportional correlation with the applied Se concentration, whether measured on a dry or fresh weight basis. A significant Light × [Se] interaction was observed in Se accumulation, with plants receiving the highest Se dose (0.6 mg Se Kg soil−1) showing significantly higher concentrations under R:B light.

4. Discussion

4.1. Light Spectrum Variations Elicit Differential Responses in Arugula Plants

Photosynthetic carbon assimilation provides carbon skeletons and energy required for plant growth and development. Photosynthesis is regulated by several external and internal factors but is primarily affected by light intensity, temperature, water, and CO2 supply [6]. In this study, all the plants were fully irrigated, and exposed to the same temperature and atmospheric CO2 concentration. The uptake of CO2 is regulated by the opening of stomata, which remained unaffected by the various treatments applied, as evidenced by the lack of significant differences in gs. Still, the light quality influenced the A responses of arugula plants, suggesting non-stomatal effects. When exposed to R:B light, as opposed to W light, the A was reduced and the Ci/Ca ratio was improved, suggesting that CO2 fixation in the Calvin cycle was impaired [47].
Light energy absorbed by chlorophylls associated with PSII can be used to drive photochemistry or can be lost from PSII, as chlorophyll fluorescence or heat, processes in direct competition with each other [48]. The analysis of chlorophyll a fluorescence showed that plants under R:B light had lower photochemical efficiency, which can justify the lower A recorded for them. The lower ΦPSII of plants under R:B light indicates that the light absorbed by PSII is used for QA reduction less efficiently, a consequence of reduced photochemical efficiency of the open reaction centers (Fv’/Fm’), since the proportion of open PSII reaction centers (qP) remained unaffected [48]. In line, the ETR through the PSII was also lower in R:B light regime. Moreover, the lower Fv/Fm ratio can indicate higher photoinhibitory damages in the photosynthetic apparatus and the higher NPQ values suggest a higher need for PSII to dissipate energy as heat instead of channeling it into photochemical reactions [48].
The photosynthetic efficiency can also be reduced due to reduced chlorophyll biosynthesis and/or higher degradation, usually occurring under stress conditions [49]. The exposure to R:B light led to a reduction (~26%) in Chl(a+b). This response may have resulted from the degradation of these pigments due to some phenomenon of photoinhibition in the R:B treatment, in which oxygen radicals can be generated [49]. The reduction of these pigments can also be seen as a photoprotective mechanism, reducing the excess absorption of light and consequent ROS generation [50]. Despite the decrease in Car concentration from W to R:B regime, this reduction (~18%) was coupled with a decrease in the Chl(a+b)/Car ratio (W—5.74; R:B—5.06; (~12%), a sensitive indicator of photooxidative damage. This suggests a faster breakdown of Chl(a+b) than Car, likely due to Car’s role in energy dissipation [51]. Moreover, according to Trifunović-Momčilov et al. [51], the Chl(a+b)/Car ratio typically falls between 4.2 and 5 in the leaves of sun-exposed plants and between 5.5 and 7.0 in the leaves of shade-exposed plants in their natural habitats. These results also support the aforementioned thesis. The chlorophyll pigments reflect a significant portion of green light and exhibit a stronger absorption of red radiation [52]. Although the total radiation intensity was equal in both W and R:B light conditions, the R:B emits a higher percentage of photons in the red spectrum, while the W is in the green spectrum. As a result, compared to the W plants, those under R:B light may be experiencing some photoinhibitory damage due to more energy absorption. Additionally, the spectrum of W light may offer enhanced energy absorption efficiency. Despite the R light being known to result in higher CO2 assimilation rates [7], and the R:B treatment having a substantial percentage of it (80%), W light includes a significant percentage of green light (47%) that penetrates deeper into the leaf tissues and is better distributed [52,53].The exposure to R:B light also led to a reduction in Anth concentration (~33%). Blue light is assumed to stimulate the synthesis of Anth, mediated via cryptochrome blue-light photoreceptors [54]. The integrated transcriptome and metabolome analysis, performed by Zhang et al. [55] in blueberry leaves, suggested that blue light promoted Anth biosynthesis by inducing the expression of key structural genes and accumulation of metabolites involved in the Anth synthesis pathway. Moreover, Ying et al. [31] reported in their study that the total Anth concentration of arugula plants increased proportionally with the percentage of supplied blue light, up to 30%. Notably, in the present study, the W light supplied 29% of blue light, while R:B only supplied 20%. Anthocyanins play a proactive role in preventing photoinhibition and photodamage by absorbing excess radiation when the plant’s existing photoprotective mechanisms for dissipating excess energy are exhausted [56]. This may explain why the R:B plants were also more vulnerable to excessive radiation.
Phenolic compounds serve as potent antioxidants and are essential in the defense mechanisms of plants, with their accumulation representing an adaptive response to stressful conditions [57]. Despite the plants under R:B light seemingly having a greater need to invest in antioxidant defense, the opposite was observed. There was a lower accumulation of total phenols (~37%) and flavonoids (~13%) and no discernible effect of light on ortho-diphenols and antioxidant capacity. These results suggest that these plants are unable to invest in the secondary metabolism, possibly due to lower photosynthetic rates and, consequently, an overall reduced production of photoassimilates. This reduced investment may have contributed to a low elimination of ROS and greater damage to the photosynthetic apparatus, as discussed previously.
Even though the R:B plants showed impairment in their physiological processes, as discussed, the concentration of soluble proteins remained unaffected, and the capacity to sustain soluble protein levels demonstrates the resilience of their protein synthesis mechanisms independently of light quality. On the other side, despite the reduced photosynthetic rates of R:B plants, they maintain total soluble sugars comparable to those of W plants, indicating a proportionally higher accumulation in R:B plants. This response may indicate problems in sugar translocation to sink organs. In line with the diminished physiological and metabolic performance of R:B plants, a reduction in the aboveground biomass accumulation was observed from W to R:B light regimes.

4.2. Selenium Adjusts Arugula Plant Responses to the Light Conditions in Which They Are Grown

When applied in optimal doses, Se can have an important role in plant growth, yield, and quality, and can confer tolerance to abiotic stresses [16]. According to the literature, the application of low concentrations of Se enhances the photosynthetic performance in various species [16,18,58]. Although the application of Se did not have any significant impact on leaf gas exchange responses of arugula plants, chlorophyll a fluorescence analysis indicated that Se generally improved the photochemical reactions of photosynthesis under R:B light, with the concentration of 0.6 mg kg−1 standing out. Apparently, Se was effective in alleviating photoinhibitory damage caused by the R:B light, showing an important role in light stress mitigation. Similar results were obtained in potato plants exposed to high-light conditions, attenuating the Fv/Fm decline [59]. To some extent, that response can be due to the Se-induced increase of protectors of light capture, such as anthocyanins, in R:B plants, contributing to the preservation of the chlorophylls, as the central photoreceptors of photosynthesis [58]. As already discussed, Anth has an important role in preventing photoinhibition and photodamage [56]. In line, the Se-induced increase and/or mitigation of stress-induced decrease of chlorophylls and carotenoids have been described in the literature [22,26,60,61]. Seppänen et al. [59] also observed that selenium alleviates oxidative stress and chloroplast damage in potato plants exposed to strong light. Additionally, it was noted that selenium plays a role in enhancing chlorophyll recovery after exposure to light stress. The benefits of Se in photochemistry may also be related to its relationship with the Fe–S cluster in chloroplasts, which have a vital role in the electron transport chain and in the emergence and quenching of ROS, mainly in plants subjected to stress [62].
The beneficial effect of Se, at relatively low concentrations, is suggested to be due to its ability to enhance plant defense mechanisms, boosting both enzymatic and non-enzymatic antioxidants and osmolytes metabolism, thus aiding in the removal of ROS and preventing oxidative stress [16,18,19,20,25]. Indeed, Se contributed to an increase in TPC, O-D, TAC, TSS, and TSP in both light regimes evaluated, especially at the concentration of 0.6 mg Se Kg soil−1. In a study conducted on arugula plants by Santiago et al. [25], it was demonstrated that supplementation with beneficial doses of Se resulted in a reduction in oxidative stress. The degree of this protective effect varied depending on the arugula cultivars and the doses of selenium used. Despite the observed key role of Se in the arugula plants’ metabolism, no influence on aboveground biomass accumulation was noticed. The increase in leaf biomass production of arugula plants by Se application was observed by Santiago et al. [25] but depended on arugula cultivars and the dose of Se applied.

4.3. Selenium Accumulation in Arugula Plants Increased with Increasing Se Doses Applied

Typically, plants contain low Se levels (0.01–0.02 mg kg−1DW), except those from seleniferous areas, and Portugal is considered a Se-deficient area [16]. Therefore, the process of bioaccumulation in plants plays a critical role in supplementing selenium and safeguarding human health [16].
In the present study, the results confirm that arugula plants are able to accumulate Se when sodium selenate is supplied to the substrate after transplanting. The total Se contents in arugula leaves increased with increasing Se doses, over 25 times more in R:B regime and 7 times more under the W regime with the highest concentration applied (0.6 mg Se kg soil−1). In general, the light regimes did not have a significant impact on the uptake of Se from the soil. However, it is worth noting that R:B regime exhibited a tendency to enhance Se uptake, particularly when applied at the highest dosage, possibly due to the discussed role of Se in photoprotection. The highest values achieved (5.39 mg kg−1DW) did not meet the range of secondary accumulators (100–1000 mg kg−1DW) where arugula plants are included [18,25], but the evaluation was only performed on the aboveground part of the plants. These results can also suggest that higher doses of Se can be added by fertigation to arugula plants under these grown conditions. Indeed, Santiago et al. [25] achieved values ranging from 100–500 mg kg−1DW in the leaves of two different arugula cultivars.
In our study, a serving size of 100 g of Se-biofortified leaves contained, on average, 25 µg and 47 µg of Se with the application of 0.3 and 0.6 mg Se Kg soil−1, respectively. The consumption of 100 g of arugula plants would provide 45% and 85% of the recommended dietary allowance (RDA) for healthy adults (55 μg day−1) [17].

5. Conclusions

Food security faces a number of challenges across both production and consumption. The adoption of customized and optimized production technologies can overcome those challenges and increase horticultural crop production, productivity, and nutritious quality in a more sustainable manner.
This study’s findings indicate that at a light intensity of 300 µmol m−2 s−1, the full W spectrum is more favorable for the growth of arugula plants compared to an 80% red to 20% blue spectrum, as the latter has the potential to exacerbate photodamage effects. Furthermore, supplementation with Se plays a significant role in mitigating light-induced stress and in improving the antioxidant defense system. This impact is particularly pronounced in plants subjected to the R:B spectrum, which exhibited more noticeable signs of photodamage. Additionally, our biofortification approach successfully yielded selenium-enriched arugula plants.
The plants supplemented with Se, especially with the higher dose, 0.6 mg Se kg−1 soil, demonstrated superior yield quality. These plants exhibited elevated concentrations of chlorophylls, antioxidant compounds, soluble proteins, and 85% of the Se RDA for adults.
The integration of LED technology in vertical farming and selenium supplementation not only enhances crop nutritional value but also contributes to more sustainable agricultural practices, as LED technology is more economically and environmentally

Author Contributions

C.B. and J.M.-P. contributed to the conception and design of the study. C.B., S.A., H.F., C.M., S.M. and J.M.-P. carried out the experiments. C.B. performed the data analysis and wrote the original draft of the manuscript. C.B., S.M. and J.M.-P. revised the manuscript. All authors have read and agreed to the published version of the manuscript.

Funding

This research was funded by the Foundation for Science and Technology (FCT, Portugal) and FEDER under Programme PT2020 for financial support to CITAB (UIDB/04033/2020). https://doi.org/10.54499/UIDB/04033/2020.

Data Availability Statement

Data are contained within the article.

Conflicts of Interest

The authors declare no conflicts of interest.

References

  1. Shafiq, I.; Hussain, S.; Ali Raza, M.; Iqbal, N.; Asghar, M.A.; Ali, R.A.Z.A.; Fan, Y.F.; Mumtaz, M.; Shoaib, M.; Ansar, M.; et al. Crop photosynthetic response to light quality and light intensity. J. Integr. Agric. 2021, 20, 4–23. [Google Scholar] [CrossRef]
  2. Brito, C.; Ferreira, H.; Dinis, L.-T.; Trindade, H.; Marques, D.; Correia, C.M.; Moutinho-Pereira, J. Different LED light intensity and quality change perennial ryegrass (Lolium perenne L.) physiological and growth responses and water and energy consumption. Front. Plant Sci. 2023, 14, 1160100. [Google Scholar] [CrossRef] [PubMed]
  3. Olle, M.; Viršile, A. The effects of light-emitting diode lighting on greenhouse plant growth and quality. Food Sci. 2013, 22, 223–234. [Google Scholar] [CrossRef]
  4. Singh, D.; Basu, C.; Meinhardt-Wollweber, M.; Bernhard Roth, B. LEDs for energy efficient greenhouse lighting. renewable and sustainable energy reviews. Renew. Sustain. Energy Rev. 2015, 49, 139–147. [Google Scholar] [CrossRef]
  5. Lazzarin, M.; Meissenburg, D.; Meijer, D.; van Leperen, W.; Marcelis, L.F.M.; Kappers, I.F.; van der Krol, A.r.; van Loon, J.J.A.; Dicke, M. LEDs make it resilient: Effects on plant growth and defense. Trends Plant Sci. 2021, 26, 496–508. [Google Scholar] [CrossRef] [PubMed]
  6. Taiz, L.; Zeiger, E. Plant Physiology, 4th ed.; Sinauer Associates, Inc.: Sunderland, MA, USA, 2006. [Google Scholar]
  7. McCree, K.J. The action spectrum, absorptance and quantum yield of photosynthesis in crop plants. Agric. Meteorol. 1971, 9, 191–216. [Google Scholar] [CrossRef]
  8. Ajdanian, L.; Babaei, M.; Aroiee, H. The growth and development of cress (Lepidium sativum) affected by blue and red light. Heliyon 2019, 5, e02109. [Google Scholar] [CrossRef] [PubMed]
  9. Camejo, D.; Frutos, A.; Mestre, T.C.; Piñero, M.C.; Rivero, R.M.; Martínez, V. Artificial light impacts the physical and nutritional quality of lettuce plants. Hortic. Environ. Biotechnol. 2020, 61, 69–82. [Google Scholar] [CrossRef]
  10. Li, Y.; Xin, G.; Liu, C.; Shi, Q.; Yang, F.; Wei, M. Effects of red and blue light on leaf anatomy, CO2 assimilation and the photosynthetic electron transport capacity of sweet pepper (Capsicum annuum L.) seedlings. BMC Plant Biol. 2020, 20, 318. [Google Scholar] [CrossRef]
  11. Li, J.; Li, G.; Wang, H.; Wang Deng, X. Phytochrome signaling mechanisms. Arab. Book 2011, 9, e0148. [Google Scholar] [CrossRef]
  12. Wang, Q.; Lin, C. Mechanisms of Cryptochrome-Mediated Photoresponses in Plants. Annu. Rev. Plant Biol. 2020, 71, 103–129. [Google Scholar] [CrossRef] [PubMed]
  13. Natasha Shahid, M.; Niazi, N.K.; Khalid, S.; Murtaza, B.; Bibi, I.; Rashid, M.I. A critical review of selenium biogeochemical behavior in soil-plant system with an inference to human health. Environ. Pollut. 2018, 234, 915–934. [Google Scholar] [CrossRef] [PubMed]
  14. Schiavon, M.; Nardi, S.; dalla Vecchia, F.; Ertani, A. Selenium biofortification in the 21st century: Status and challenges for healthy human nutrition. Plant Soil 2020, 453, 245–270. [Google Scholar] [CrossRef] [PubMed]
  15. Zafeiriou, I.; Gasparatos, D.; Ioannou, D.; Massas, I. Selenium uptake by lettuce plants and se distribution in soil chemical phases affected by the application rate and the presence of a seaweed extract-based biostimulant. Soil Syst. 2022, 6, 56. [Google Scholar] [CrossRef]
  16. Yang, H.; Yang, X.; Ning, Z.; Kwon, S.Y.; Li, M.-L.; Tack, F.M.G.; Kwon, E.E.; Rinklebe, J.; Yin, R. The beneficial and hazardous effects of selenium on the health of the soil-plant-human system: An overview. J. Hazard. Mater. 2022, 422, 126876. [Google Scholar] [CrossRef] [PubMed]
  17. IM-Institute of Medicine. Dietary Reference Intakes: Vitamin C, Vitamin E, Selenium, and Carotenoids; National Academy Press: Washington, DC, USA, 2000. [Google Scholar] [CrossRef]
  18. Gupta, M.; Gupta, S. An overview of selenium uptake, metabolism, and toxicity in plants. Front. Plant Sci. 2017, 7, 2074. [Google Scholar] [CrossRef] [PubMed]
  19. Elkelish, A.A.; Soliman, M.H.; Alhaithloul, H.A.; El-Esawi, M.A. Selenium protects wheat seedlings against salt stress-mediated oxidative damage by up-regulating antioxidants and osmolytes metabolism. Plant Physiol. Biochem. 2019, 137, 144–153. [Google Scholar] [CrossRef] [PubMed]
  20. Józwiak, W.; Politycka, B. Effect of selenium on alleviating oxidative stress caused by a water deficit in cucumber roots. Plants 2019, 8, 217. [Google Scholar] [CrossRef] [PubMed]
  21. Ghanbari, F.; Bag-Nazari, M.; Azizi, A. Exogenous application of selenium and nano-selenium alleviates salt stress and improves secondary metabolites in lemon verbena under salinity stress. Sci. Rep. 2023, 13, 5352. [Google Scholar] [CrossRef]
  22. Alyemeni, M.N.; Ahanger, M.A.; Wijaya, L.; Alam, P.; Bhardwaj, R.; Ahmad, P. Selenium mitigates cadmium-induced oxidative stress in tomato (Solanum lycopersicum L.) plants by modulating chlorophyll fluorescence, osmolyte accumulation, and antioxidant system. Protoplasma 2018, 255, 459–469. [Google Scholar] [CrossRef]
  23. Alves, L.R.; Rossatto, D.R.; Rossi, M.L.; Martinelli, A.P.; Gratão, P.L. Selenium improves photosynthesis and induces ultrastructural changes but does not alleviate cadmium-stress damages in tomato plants. Protoplasma 2020, 257, 597–605. [Google Scholar] [CrossRef] [PubMed]
  24. Hasanuzzaman, M.; Bhuyan, M.H.M.B.; Raza, A.; Hawrylak-Nowak, B.; Matraszek-Gawron, R.; Mahmud, J.A.; Nahar, K.; Fujita, M. Selenium in plants: Boon or bane? Environ. Exp. Bot. 2020, 178, 104170. [Google Scholar] [CrossRef]
  25. Santiago, F.E.M.; Silva, M.L.S.; Cardoso, A.A.S.; Duan, Y.; Guilherme, L.R.G.; Liu, J.; Li, L. Biochemical basis of differential selenium tolerance in arugula (Eruca sativa Mill.) and lettuce (Lactuca sativa L.). Plant Physiol. Biochem. 2020, 157, 328–338. [Google Scholar] [CrossRef] [PubMed]
  26. Ragályi, P.; Takács, T.; Füzy, A.; Uzinger, N.; Dobosy, P.; Záray, G.; Szűcs-Vásárhelyi, N.; Rékási, M. Effect of Se-enriched irrigation water on the biomass production and elemental composition of green bean, cabbage, potato and tomato. Plants 2021, 10, 2086. [Google Scholar] [CrossRef] [PubMed]
  27. Martinez-Sanchez, A.; Gil-Izquierdo, A.; Gil, M.I.; Ferreres, F.A. Comparative study of flavonoid compounds, vitamin C, and antioxidant properties of baby leaf Brassicaceae species. J. Agric. Food Chem. 2008, 56, 2330–2340. [Google Scholar] [CrossRef]
  28. Manchali, S.; Murthy, K.N.C.; Patil, B.S. Crucial facts about health benefits of popular cruciferous vegetables. J. Funct. Foods 2012, 4, 94–106. [Google Scholar] [CrossRef]
  29. USDA—United States Department of Agriculture. Agriculture Research Service. 2023. Available online: https://fdc.nal.usda.gov/fdc-app.html#/food-details/169387/nutrients (accessed on 12 September 2023).
  30. Dall’Acqua, S.; Ertani, A.; Pilon-Smits, E.; Fabrega-Prats, M.; Schiavon, M. Selenium biofortification differentially affects sulfur metabolism and accumulation of phytochemicals in two Rocket species (Eruca sativa Mill. and Diplotaxis tenuifolia) grown in hydroponics. Plants 2019, 8, 68. [Google Scholar] [CrossRef] [PubMed]
  31. Ying, Q.; Jones-Baumgardt, C.; Zheng, Y.; Bozzo, G. The Proportion of Blue Light from Light-emitting Diodes Alters Microgreen Phytochemical Profiles in a Species-specific Manner. HortScience 2021, 56, 13–20. [Google Scholar] [CrossRef]
  32. von Caemmerer, S.; Farquhar, G.D. Some relationships between the biochemistry of photosynthesis and the gas exchange of leaves. Planta 1981, 153, 376–387. [Google Scholar] [CrossRef]
  33. Bilger, W.; Schreiber, U. Energy-dependent quenching of dark-level chlorophyll fluorescence in intact leaves. Photosyn. Res. 1986, 10, 303–308. [Google Scholar] [CrossRef]
  34. Genty, B.; Briantais, J.M.; Baker, N.R. The relationship between the quantum yield of photosynthetic electron transport and quenching of chlorophyll fluorescence. Biochim. Biophys. Acta 1989, 990, 87–92. [Google Scholar] [CrossRef]
  35. Arnon, D.I. Copper enzymes in isolated chloroplasts: Polyphenol oxydase in Beta vulgaris. Plant Physiol. 1949, 24, 1–15. [Google Scholar] [CrossRef]
  36. Sesták, Z.; Castky, J.; Jarvis, P.G. Plant Photosynthetic Production. Manual of Methods; Dr. W. Junk Publishers: The Hagge, The Netherlands, 1971; 818p. [Google Scholar]
  37. Lichtenthaler, H.K. Chlorophylls and carotenoids: Pigments of photosynthetic biomembranes. Methods Enzymol. 1987, 148, 350–382. [Google Scholar] [CrossRef]
  38. Shahidi, F.; Naczk, M. Food Phenolics: Sources, Chemistry, Effects, Applications; Technomic Publishing Co. Inc.: Lancaster, PA, USA, 1995; 331p. [Google Scholar]
  39. Jia, Z.; Tang, M.; Wu, J. The determination of flavonoid contents in mulberry and their scavenging effects on superoxide radicals. Food Chem. 1999, 64, 555–559. [Google Scholar] [CrossRef]
  40. Mateos, R.; Espartero, J.L.; Trujilho, M.; Ríos, J.J.; León-Camacho, M.; Alcudia, F. Determination of phenols, flavones, and lignans in virgin olive oils by solid-phase extraction and high-performance liquid chromatography with diode array ultraviolet detection. J. Agric. Food Chem. 2001, 49, 2185–2192. [Google Scholar] [CrossRef]
  41. Ozgen, M.; Reese, R.N.; Tulio, A.Z.; Scheerens, J.C.; Miller, A.R. Modified 2, 2-azino-bis-3-ethylbenzothiazoline-6-sulfonic acid (ABTS) method to measure antioxidant capacity of selected small fruits and comparison to ferric reducing antioxidant power (FRAP) and 2,2′-diphenyl-1-picrylhydrazyl (DPPH) methods. J. Agric. Food Chem. 2006, 54, 1151–1157. [Google Scholar] [CrossRef]
  42. Lee, J. Determination of total monomeric anthocyanin pigment content of fruit juices, Beverages, Natural colorants, and wines by the pH differential method: Collaborative study. J. AOAC Int. 2005, 88, 1269–1278. [Google Scholar] [CrossRef]
  43. Bradford, M.M. A rapid and sensitive method for the quantification of microgram quantities of protein using the principle of protein-dye binding. Anal. Biochem. 1976, 72, 248–254. [Google Scholar] [CrossRef]
  44. Irigoyen, J.J.; Emerich, D.W.; Sánchez-Díaz, M. Water stress induced changes in concentrations of proline and total soluble sugars in nodulated alfalfa (Medicago sativa) plants. Physiol. Plantaru 1992, 84, 55–60. [Google Scholar] [CrossRef]
  45. Reaner, D.C.; Veillon, C. Elimination of perchloric acid in digestion of biological fluids for fluorometric determination of selenium. Anal. Chem. 1983, 55, 1605–1606. [Google Scholar] [CrossRef]
  46. Costa-Silva, F.; Maia, M.; Matos, C.C.; Calçada, E.; Barros, A.I.R.N.A.; Nunes, F.M. Selenium content of Portuguese unifloral honeys. J. Food Compos. Anal. 2011, 24, 351–355. [Google Scholar] [CrossRef]
  47. Flexas, J.; Medrano, H. Drought-inhibition of photosynthesis in C3 plants: Stomatal and non-stomatal limitations revisited. Ann. Bot. 2002, 89, 183–189. [Google Scholar] [CrossRef]
  48. Baker, N.R. Chlorophyll fluorescence: A probe of photosynthesis in vivo. Annu. Rev. Plant Biol. 2008, 59, 89–113. [Google Scholar] [CrossRef]
  49. Sharma, A.; Kumar, V.; Shahzad, B.; Ramakrishnan, M.; Singh Sidhu, G.P.; Bali, A.S.; Handa, N.; Kapoor, D.; Yadav, P.; Khanna, K.; et al. Photosynthetic Response of Plants Under Different Abiotic Stresses: A Review. J. Plant Growth Regul. 2020, 39, 509–531. [Google Scholar] [CrossRef]
  50. Galmés, J.; Abadía, A.; Cifre, J.; Medrano, H.; Flexas, J. Photoprotection processes under water stress and recovery in Mediterranean plants with different growth forms and leaf habits. Physiol. Plant. 2007, 130, 495–510. [Google Scholar] [CrossRef]
  51. Trifunović-Momčilov, M.; Milošević, S.; Marković, M.; Đurić, M.; Jevremović, S.; Dragićević, I.Č.; Subotić, A.R. Changes in Photosynthetic Pigments Content in Non-Transformed and AtCKX Transgenic Centaury (Centaurium erythraea Rafn) Shoots Grown under Salt Stress In Vitro. Agronomy 2021, 11, 2056. [Google Scholar] [CrossRef]
  52. Liu, J.; van Iersel, M.W. Photosynthetic physiology of blue, green, and red light: Light intensity effects and underlying mechanisms. Front. Plant Sci. 2021, 12, 619987. [Google Scholar] [CrossRef]
  53. Brodersen, C.R.; Vogelmann, T.C. Do changes in light direction affect absorption profiles in leaves? Funct. Plant Biol. 2010, 37, 403–412. [Google Scholar] [CrossRef]
  54. Kadomura-Ishikawa, Y.; Miyawaka, K.; Noji, S.; Takahashi, A. Phototropin 2 is involved in blue light-induced anthocyanin accumulation in Fragaria x ananassa fruits. J. Plant Res. 2013, 126, 847–857. [Google Scholar] [CrossRef]
  55. Zhang, J.; Li, S.; An, H.; Zhang, X.; Zhou, B. Integrated transcriptome and metabolome analysis reveals the anthocyanin biosynthesis mechanisms in blueberry (Vaccinium corymbosum L.) leaves under different light qualities. Front. Plant Sci. 2022, 13, 1073332. [Google Scholar] [CrossRef]
  56. Simkin, A.J.; Kapoor, L.; Doss, C.G.P.; Hofmann, T.A.; Lawson, T.; Ramamoorthy, S. The role of photosynthesis related pigments in light harvesting, photoprotection and enhancement of photosynthetic yield in planta. Photosynth. Res. 2022, 152, 23–42. [Google Scholar] [CrossRef]
  57. Kumar, K.; Debnath, P.; Singh, S.; Kumar, N. An overview of plant phenolics and their involvement in Abiotic Stress Tolerance. Stresses 2023, 3, 570–585. [Google Scholar] [CrossRef]
  58. Lanza, M.G.D.B.; dos Reis, A.R. Roles of selenium in mineral plant nutrition: ROS scavenging responses against abiotic stresses. Plant Physiol Biochem. 2021, 164, 27–43. [Google Scholar] [CrossRef]
  59. Seppänen, M.; Turakainen, M.; Hartikainen, H. Selenium effects on oxidative stress in potato. Plant Sci. 2003, 165, 311–319. [Google Scholar] [CrossRef]
  60. Dong, J.Z.; Wang, Y.; Wang, S.H.; Yin, L.P.; Xu, G.J.; Zheng, C.; Lei, C.; Zhang, M.Z. Selenium increases chlorogenic acid, chlorophyll and carotenoids of Lycium chinense leaves. J. Sci. Food Agric. 2013, 93, 310–315. [Google Scholar] [CrossRef]
  61. Aghaie, P.; Forghani, A.H. The effect of selenium concentration on growth and stress markers in two Iranian strains of Dunaliella salina Teodoresco. S. Afr. J. Bot. 2023, 159, 272–279. [Google Scholar] [CrossRef]
  62. Feng, R.; Wei, C.; Tu, S. The roles of selenium in protecting plants against abiotic stresses. Environ. Exp. Bot. 2013, 87, 58–68. [Google Scholar] [CrossRef]
Figure 1. The photosynthetic photon flux density (PPFD) as a function of the wavelength of the LED treatments applied (W, 100% cool white; R:B, 80% red and 20% blue).
Horticulturae 10 00511 g001
Figure 2. Arugula plants cultivated under W (A) and R:B (B) lights.
Horticulturae 10 00511 g002
Table 1. Net photosynthetic rate (A, µmol m−2 s−1), stomatal conductance (gs, mmol m−2 s−1), ratio of intercellular to atmospheric CO2 concentration (Ci/Ca) and intrinsic water use efficiency (A/gs, µmol mol−1) of arugula plants grown under white (W) and red and blue (R:B) light and supplemented with 0 [0], 0.3 [0.3], and 0.6 [0.6] mg Se Kg soil−1.
AgsCi/CaA/gs
Light
 W6.58 ± 1.06 a155.3 ± 44.20.775 ± 0.051 b45.2 ± 12.1 a
 RB4.41 ± 1.23 b164.6 ± 41.20.852 ± 0.036 a27.6 ± 7.8 b
[Se]
 [0]5.72 ± 1.87174.4 ± 33.70.828 ± 0.04833.2 ± 2.8
 [0.3]5.42 ± 1.14138.1 ± 37.10.794 ± 0.04841.1 ± 3.0
 [0.6]5.43 ± 1.71163.7 ± 50.10.818 ± 0.07535.3 ± 2.9
Light × [Se]
 W [0]6.95 ± 1.38189.6 ± 34.80.807 ± 0.04637.9 ± 10.4
 W [0.3]6.18 ± 0.54128.2 ± 32.40.757 ± 0.03750.0 ± 9.6
 W [0.6]6.55 ± 1.07143.7 ± 43.60.760 ± 0.05748.5 ± 13.8
 RB [0]4.48 ± 1.44159.1 ± 27.10.849 ± 0.04328.4 ± 9.0
 RB [0.3]4.65 ± 1.08148.0 ± 42.50.832 ± 0.01732.2 ± 4.3
 RB [0.6]4.09 ± 1.31187.7 ± 50.90.875 ± 0.03222.2 ± 6.6
Significance
 Light***ns******
 [Se]nsnsnsns
 Light × [Se]nsnsnsns
Values are means ± S.D. Levels not connected by same letter are significantly different. ns, p ≥ 0.05; *** p < 0.001.
Table 2. Maximum (Fv/Fm) and effective (ΦPSII) quantum efficiency of photosystem II, photochemical quenching (qP), photochemical efficiency of open reaction centers under natural irradiance (Fv’/Fm’), apparent electron transport rate (ETR, µmol e m−2 s−1) and non-photochemical (NPQ) of arugula plants grown under white (W) and red and blue (R:B) light and supplemented with 0 [0], 0.3 [0.3], and 0.6 [0.6] mg Se Kg soil−1.
Fv/FmΦPSIIqPFv’/FmETRNPQ
Light
 W0.803 ± 0.031 a0.290 ± 0.042 a0.505 ± 0.0860.581 ± 0.077 a36.6 ± 5.3 a1.74 ± 0.69 b
 RB0.738 ± 0.048 b0.219 ± 0.069 b0.561 ± 0.0910.389 ± 0.105 b27.6 ± 8.7 b3.13 ± 0.99 a
[Se]
 [0]0.751 ± 0.0530.225 ± 0.0790.510 ± 0.0790.456 ± 0.19028.4 ± 10.12.60 ± 1.62
 [0.3]0.776 ± 0.0590.263 ± 0.0710.539 ± 0.1130.492 ± 0.12133.1 ± 9.12.51 ± 0.97
 [0.6]0.784 ± 0.0400.276 ± 0.0400.551 ± 0.0830.506 ± 0.0734.8 ± 5.12.20 ± 0.45
Light × [Se]
 W [0]0.789 ± 0.0440.294 ± 0.030 a0.483 ± 0.0870.620 ± 0.102 a37.0 ± 3.8 a1.33 ± 0.93 c
 W [0.3]0.813 ± 0.0300.302 ± 0.049 a0.538 ± 0.1010.567 ± 0.078 ab38.0 ± 6.1 a1.91 ± 0.60 bc
 W [0.6]0.807 ± 0.0160.276 ± 0.051 a0.495 ± 0.0760.555 ± 0.039 ab34.7 ± 6.4 a1.99 ± 0.34 bc
 R:B [0]0.713 ± 0.0290.157 ± 0.039 b0.537 ± 0.0690.291 ± 0.061 c19.8 ± 4.9 b3.87 ± 1.00 a
 R:B [0.3]0.739 ± 0.0600.224 ± 0.072 ab0.541 ± 0.1360.417 ± 0.113 bc28.2 ± 9.1 ab3.10 ± 0.94 ab
 R:B [0.6]0.762 ± 0.0460.276 ± 0.032 a0.606 ± 0.0440.457 ± 0.059 b34.8 ± 4.1 a2.41 ± 0.49 abc
Significance
 Light******ns*********
 [Se]nsnsnsnsnsns
 Light × [Se]ns*ns*****
Values are means ± S.D. Levels not connected by same letter are significantly different. ns, p ≥ 0.05; * p < 0.05; *** p < 0.001.
Table 3. Leaf concentration of total chlorophylls (Chl(a+b), mg g−1DW) and total carotenoids (Car, mg g−1DW) and ratios of chlorophyll a/chlorophyll b (Chla/b) and total chlorophylls/carotenoids (Chl(a+b)/Car) of arugula plants grown under white (W) and red and blue (R:B) light and supplemented with 0 [0], 0.3 [0.3] and 0.6 [0.6] mg Se Kg soil−1.
Chl(a+b)Chla/bCarChl(a+b)/Car
Light
 W0.854 ± 0.126 a3.60 ± 0.240.151 ± 0.023 a5.74 ± 0.86 a
 RB0.629 ± 0.120 b3.36 ± 0.610.124 ± 0.024 b5.06 ± 0.42 b
[Se]
 [0]0.617 ± 0.138 b3.50 ± 0.380.113 ± 0.019 b5.40 ± 0.56
 [0.3]0.797 ± 0.196 a3.31 ± 0.600.144 ± 0.024 a5.55 ± 1.14
 [0.6]0.812 ± 0.089 a3.64 ± 0.390.155 ± 0.018 a5.24 ± 0.40
Light × [Se]
 W [0]0.733 ± 0.060 bc3.19 ± 0.10 ab0.128 ± 0.0125.75 ± 0.23 ab
 W [0.3]0.975 ± 0.088 a3.07 ± 0.85 b0.160 ± 0.0226.23 ± 1.34 a
 W [0.6]0.857 ± 0.095 ab3.83 ± 0.49 a0.164 ± 0.0165.22 ± 0.57 ab
 R:B [0]0.502 ± 0.083 d3.81 ± 0.29 ab0.100 ± 0.0145.05 ± 0.61 ab
 R:B [0.3]0.618 ± 0.031 cd3.54 ± 0.17 ab0.128 ± 0.0154.87 ± 0.42 b
 R:B [0.6]0.767 ± 0.060 b3.44 ± 0.08 ab0.146 ± 0.0145.26 ± 0.15 ab
Significance
 Light***ns*****
 [Se]***ns***ns
 Light × [Se]***ns*
Values are means ± S.D. Levels not connected by same letter are significantly different. ns, p ≥ 0.05; * p < 0.05; ** p < 0.01; *** p < 0.001.
Table 4. Leaf concentration of total phenolic compounds (TPC, µg g−1DW), anthocyanins (Anth, mg g−1DW) flavonoids (µg g−1DW), and ortho-diphenols (O-D, µg g−1DW), and total antioxidant capacity (TAC, µmol g−1DW) of arugula plants grown under white (W) and red and blue (R:B) light and supplemented with 0 [0], 0.3 [0.3] and 0.6 [0.6] mg Se Kg soil−1.
TPCAnthFlavonoidsO-DTAC
Light
 W0.701 ± 0.277 a78.6 ± 10.6 a0.784 ± 0.148 a4.35 ± 1.005.83 ± 1.10
 RB0.441 ± 0.243 b52.5 ± 25.3 b0.681 ± 0.085 b4.16 ± 0.555.18 ± 1.00
[Se]
 [0]0.369 ± 0.226 b46.6 ± 23.5 c0.671 ± 0.0833.54 ± 0.27 b4.84 ± 0.62 b
 [0.3]0.503 ± 0.216 b67.0 ± 19.7 b0.712 ± 0.0794.14 ± 0.47 b5.33 ± 1.18 ab
 [0.6]0.841 ± 0.197 a83.0 ± 88.7 a0.817 ± 0.1715.08 ± 0.62 a6.34 ± 0.86 a
Light × [Se]
 W [0]0.480 ± 0.29967.4 ± 5.1 ab0.728 ± 0.0383.36 ± 0.174.66 ± 0.81
 W [0.3]0.660 ± 0.19081.0 ± 8.2 a0.700 ± 0.1204.26 ± 0.686.09 ± 0.63
 W [0.6]0.965 ± 0.05187.2 ± 7.1 a0.926 ± 0.1645.42 ± 0.586.74 ± 0.59
 R:B [0]0.258 ± 0.04025.8 ± 7.7 c0.613 ± 0.0773.73 ± 0.235.02 ± 0.47
 R:B [0.3]0.347 ± 0.09053.1 ± 18.0 bc0.724 ± 0.0414.01 ± 0.214.58 ± 1.17
 R:B [0.6]0.717 ± 0.22078.7 ± 9.5 ab0.708 ± 0.1034.74 ± 0.545.93 ± 1.00
Significance
 Light******nsns
 Se*****ns****
 Light × [Se]ns*nsnsns
Values are means ± S.D. Levels not connected by same letter are significantly different. ns, p ≥ 0.05; * p < 0.05; ** p < 0.01; *** p < 0.001.
Table 5. Leaf concentration of total soluble proteins (TSP, mg g−1DW) and total soluble sugars (TSS, mg g−1DW) of arugula plants grown under white (W) and red and blue (R:B) light and supplemented with 0 [0], 0.3 [0.3], and 0.6 [0.6] mg Se Kg soil−1.
TSPTSS
Light
 W10.2 ± 0.767.10 ± 1.60
 RB9.91 ± 1.087.62 ± 1.14
[Se]
 [0]9.24 ± 0.82 b6.23 ± 0.96 b
 [0.3]10.2 ± 0.65 a7.23 ± 1.10 b
 [0.6]10.7 ± 0.69 a8.62 ± 1.02 a
Light × [Se]
 W [0]9.75 ± 0.705.48 ± 0.47
 W [0.3]10.2 ± 0.487.12 ± 1.18
 W [0.6]10.8 ± 0.798.71 ± 1.06
 R:B [0]8.72 ± 0.606.98 ± 0.67
 R:B [0.3]10.2 ± 0.477.33 ± 1.12
 R:B [0.6]10.8 ± 0.798.54 ± 1.10
Significance
 Lightnsns
 [Se]****
 Light × [Se]nsns
Values are means ± S.D. Levels not connected by same letter are significantly different. ns, p ≥ 0.05; ** p < 0.01.
Table 6. Total aboveground biomass (A-biomass, g plant−1 FW), and selenium concentration in aboveground biomass on a dry (Se, mg kg−1DW) and fresh (Se, µg 100 g−1FW) weight basis of arugula plants grown under white (W) and red:blue (R:B) light and supplemented with 0 [0], 0.3 [0.3] and 0.6 [0.6] mg Se Kg soil−1.
A-Biomass
(g Plant−1FW)
Se
(mg kg−1DW)
Se
(µg 100 g−1FW)
Light
 W5.77 ± 0.28 a2.45 ± 1.4827.5 ± 23.6
 RB4.90 ± 0.27 b2.80 ± 2.3824.1 ± 15.3
[Se]
 [0]5.31 ± 0.330.367 ± 0.33 c3.31 ± 3.06 c
 [0.3]5.70 ± 0.322.61 ± 0.82 b25.0 ± 8.1 b
 [0.6]4.98 ± 0.344.64 ± 1.42 a46.6 ± 13.6 a
Light × [Se]
 W [0]5.26 ± 0.760.572 ± 0.429 d5.29 ± 3.97 d
 W [0.3]6.66 ± 1.302.419 ± 0.745 c22.2 ± 6.84 c
 W [0.6]5.39 ± 1.593.897 ± 0.694 b40.1 ± 7.15 ab
 RB [0]5.37 ± 0.500.213 ± 0.061 d1.83 ± 0.52 d
 RB [0.3]4.74 ± 0.972.813 ± 0.314 bc27.7 ± 8.8 bc
 RB [0.6]4.58 ± 1.005.390 ± 0.567 a53.0 ± 15.8 a
Significance
 Light*nsns
 [Se]ns******
 Light × [Se]ns**
Values are means ± S.D. Levels not connected by same letter are significantly different. ns, p ≥ 0.05; * p < 0.05; *** p < 0.001.
Disclaimer/Publisher’s Note: The statements, opinions and data contained in all publications are solely those of the individual author(s) and contributor(s) and not of MDPI and/or the editor(s). MDPI and/or the editor(s) disclaim responsibility for any injury to people or property resulting from any ideas, methods, instructions or products referred to in the content.

