Article

Short-Term Traffic-Related Exposures and Biomarkers of Nitro-PAH Exposure and Oxidative DNA Damage

1
Department of Environmental Health, Harvard School of Public Health, Boston, MA 02115, USA
2
Division of Environmental Health Sciences, UC Berkeley School of Public Health, Berkeley, CA 94720, USA
3
Pulmonary and Critical Care Medicine Section, VA Boston Healthcare System, West Roxbury, MA 02132, USA
4
Department of Preventive Medicine, University of Southern California, Keck School of Medicine, Los Angeles, CA 90033, USA
5
Nicholas School of the Environment, and Duke Global Health Institute, Duke University, Durham, NC 27708, USA
6
Channing Division of Network Medicine, Brigham and Women's and Hospital Harvard Medical School, Boston, MA 02115, USA
*
Author to whom correspondence should be addressed.
Toxics 2014, 2(3), 377-390; https://doi.org/10.3390/toxics2030377
Submission received: 12 May 2014 / Revised: 27 June 2014 / Accepted: 11 July 2014 / Published: 22 July 2014

Abstract

:
Exposure to vehicle exhaust has been associated with cardiac and respiratory disease, lung cancer and greater overall mortality. We investigated whether amino-polycyclic aromatic hydrocarbon (amino-PAH) metabolites of nitro-PAHs could be used as biomarkers of these exposures. Pre- and post-shift urine samples were collected at the beginning and end of a work week from 82 male U.S. trucking industry workers. We used repeated-measures analysis to examine associations of total 1- and 2-aminonaphthalene (1 & 2-AN) and 1-aminopyrene (1-AP) urinary concentrations with microenvironment exposures to particulate matter (PM2.5), elemental and organic carbon and between 1 & 2-AN and 1-AP with urinary 8-hydroxy-2'-deoxyguanosine (8-OHdG). There was an association between work week mean PM2.5 levels and post-shift 1 & 2-AN (141.8 pg/mL increase (95% CI: 53.3, 230.2) for each IQR increase (5.54 µg/m3) in PM2.5), but no associations with other exposure measures. There was a statistically significant increase in 8-OHdG concentrations with 1 & 2-AN (2.38 µg/mg creatinine (95% CI: 0.19, 4.58) per 242.85 pg/mg creatinine increase in 1 & 2-AN) and suggestive associations with all other exposure measures. Our findings suggest associations between urinary amino-PAHs with vehicle exhaust-related PM2.5, as well as with a biomarker of oxidative DNA damage.

1. Introduction

Exposure to air pollution from traffic-related sources, including diesel exhaust, has been associated with cardiac and respiratory-related diseases, lung cancer and greater overall mortality [1,2,3,4,5,6,7,8,9,10]. To date, most studies in humans have relied on measured or model-based predicted levels of external exposure. In contrast to external measures, biomarkers of exposure may improve exposure assessment by allowing the evaluation of the internal or biologically-effective dose [11]. Furthermore, exposure biomarkers may improve the understanding of the potential mechanisms of action and pathophysiologic pathways and potentially help in the identification of susceptibility and variations in response [12,13,14]. However, few biomarkers have been identified as indicators of traffic-related exposures. Certain nitro-polycyclic aromatic hydrocarbons (nitro-PAHs) are present in vehicle exhaust fumes, and their metabolites, amino-PAHs, have been proposed as biomarkers of vehicle exhaust exposures [12,13,14,15,16,17].
Occupational exposures to vehicle exhaust have been previously found to be associated with adverse health effects, including lung cancer [7,18,19]. Workers in the U.S. trucking industry with regular exposures to exhaust from diesel, gasoline and propane sources have been shown to experience increased risks of ischemic heart disease and lung cancer [20,21,22]. The current study characterizes microenvironment exposures to different components of vehicle exhaust in a sample of trucking industry workers and examines the relation between exposure measurements of particulate matter ≤2.5 µm in diameter (PM2.5), elemental and organic carbon (EC and OC) in PM1.0 (particulate matter with a diameter of ≤1.0 μm) and urinary amino-PAHs sampled over a workweek.
Urinary levels of 1-aminonaphthalene and 2-aminonaphthalene (1 & 2-AN) and 1-aminopyrene (1-AP), metabolites of the nitro-PAHs, 1-nitronaphthalene and 2-nitronaphthalene (1 & 2-NN), and 1-nitropyrene (1-NP), were assessed as potential biomarkers of exposure. 1 & 2-NN are present in both gasoline and diesel vehicular emissions and may also result from atmospheric photochemistry reactions, while 1-NP is considered to be a more specific diesel exhaust compound [23,24,25].
Since oxidative stress is a one of the potential pathophysiologic pathways for the effect of these exposures, we also examined possible associations between these exposure biomarkers and urinary 8-hydroxy-2-deoxyguanosine (8-OHdG), a biomarker of oxidative DNA damage [26,27,28].

2. Methodology

2.1. Study Population

Participant recruitment and sample collection have been reported in detail previously [29]. Briefly, 95 workers from 10 truck terminals in the northeastern U.S. were recruited for this study. Prior to the study team’s visit, all terminal employees were sent an invitation letter and a study description and were provided a response postcard to indicate interest. Upon arrival at the terminal, people who sent in the card were enrolled first in order of response if they met the inclusion criteria. If the recruitment goal was not met, participants were recruited from each work shift to meet the target enrollment by terminal and job title. Participants were enrolled in the study after at least 2 days off of work and were followed for a full work week. Subjects were compensated for their participation and provided informed consent. The study protocol was approved by the Institutional Review Board of the Brigham and Women’s Hospital and the Human Subjects Committee of the Harvard School of Public Health.
Measurements took place between February, 2009, and October, 2010, with terminals sampled one at time for up to 8 days of continuous sampling. Study subjects represented three different exposure scenarios within the industry—pick-up and delivery (P & D) drivers, freight dockworkers and office clerks. Primary analyses were conducted on a final sample of 82 male workers who did not report sick days during the sampling period and had biological and environmental samples available.

2.2. Microenvironment Exposure Measurements

Microenvironment area samples of PM2.5, as well as EC and OC in PM1.0 were collected daily from all 10 terminals in the study. Area samples were collected indoors in office spaces and terminal docks, as well as within truck cabs. Detailed exposure assessment methods are described elsewhere [11]. Briefly, EC and OC were measured by collecting PM1.0 on a 22-mm quartz tissue filter, preceded by a precision machined cyclone separator (SCC1.062 Triplex, BGI, Inc., Waltham, MA, USA), which was then analyzed by thermal-optical carbon analyzer using the NIOSH 5040 method [30]. PM2.5 was collected on a 37-mm Teflon filter (Gelman/Pall, Port Washington, NY, USA) (with a pore diameter of 2 μm) after passing through a precision-machined cyclone pre-selector (GK2-5-SH, BGI, Inc., Waltham, MA, USA ) to remove particles greater than 2.5 μm in aerodynamic diameter. The method was consistent with the EPA PQ200 Federal Reference Method [31,32]. Personal exposures were assigned to individual participants as a weighted average of the time the participant reported spending in each work location.

2.3. Biomarker Sampling and Analysis

During each terminal visit, urine samples were collected from participants prior to the day’s work shift on their first day back to work after at least 2 days off. At the end of the first work shift, another urine sample was collected, and then pre- and post-shift samples were collected again on the last workday of the same week. Up to 50 mL of urine were collected in a sterile urine cup at each sampling period and stored at 4 °C until returned to the study laboratory, where they were kept at −20 °C until analysis.
Urinary levels of the nitro-PAH metabolites, 1-aminonaphthalene and 2-aminonaphthalene (i.e., the sum of the two isomers that were not chromatographically separated: 1 & 2-AN), and 1-aminopyrene (1-AP) were analyzed using a modification of our previously published method [33]. A urine sample aliquot (2 mL) was incubated with 20 µL of β-glucuronidase from Helix pomatia Type H-2 (Sigma-Aldrich, St. Louis, MO, USA) in 2 mL of 0.1 M sodium acetate buffer (pH 5.0) at 37 °C overnight. The resulting solution was adjusted to pH > 10 with the addition of 25 µL of 10 M NaOH and extracted with 4 mL of ethyl acetate. After mixing on a shaker for 10 min, the solution was centrifuged at 3500 rpm for 10 min, and its supernatant was evaporated to dryness under nitrogen in a TurboVap LV evaporator (Zymark Corp., Hopkinton, MA, USA) operated at 35 °C. The residue was reconstituted in 200 µL of methanol, and a 20 µL aliquot was injected to HPLC-fluorescence detector (Waters Corp., Milford, MA, USA) for analysis. The chromatographic separation was achieved on a Supelco-Ascentis RP-Amide column (25 cm × 4.6 mm, 5 µm. Sigma-Aldrich, St. Louis, MO, USA). The mobile phase was 50% acetonitrile (A) and acetonitrile (B), with a linear gradient from 0% B at 0 min to 70% B at 30 min. The fluorescence detector (Waters Corp., Milford, MA, USA) was set at 254/425 nm (Ex/Em). The limits of detection (LOD) were 0.02 and 0.04 ng/mL for 1 & 2-AN and 1-AP respectively, and the recoveries were 84.3% for the sum of 1 & 2-AN and 88.3% for 1-AP. Creatinine-adjusted levels for these markers were used in the analyses, and all levels and changes are reported in units of pg/mg creatinine.
Urinary 8-OHdG concentrations were determined using an HPLC/ECD method described previously [34]. In brief, a solution containing a 2-mL aliquot of urine and 2 mL potassium KH2PO4 buffer (0.1 M, pH 6) was applied to a solid phase extraction cartridge (Bond Elut-Certify, Varian, Palo Alto, CA, USA) already conditioned with methanol, deionized (DI) water and KH2PO4 (0.1 M, pH 6). The cartridge was then washed with DI water and KH2PO4 (0.1 M, pH 6) and vacuum dried for 10 min. 8-OHdG was eluted by a 2-mL solution of 30% methanol in DI water, and 20 µL of eluted solution was injected into the HPLC (Alliance Waters 2695 with 2465 Electron-Chemical Detector, Waters Corp., Milford, MA, USA). 8-OHdG was detected at a potential of +0.6 V at a range of 50 nA and a time constant of 1.0 s. A linear calibration curve was obtained using aqueous solutions of an 8-OHdG standard. The recovery of the method was 99.6%; the variability across repeated analyses was 4.41% (RSD), and the analytical detection limit was 0.46 ng/mL.

2.4. Health and Personal Habit Assessment

Each participant completed a baseline medical and health questionnaire based on the American Thoracic Society adult respiratory questionnaire [35]. Standardized questions regarding respiratory symptoms and conditions were supplemented with questions about other medical conditions, such as heart disease, cancer, diabetes and other exposures to fumes or exhaust exposures not from the workplace. Questions regarding job title and job history, date and time of last work shift, past week work schedule, terminal assignment, specific duties, recent acute illnesses and lifestyle characteristics, including physical activity, were also included. Weight and height were measured by the study team to calculate body mass index (BMI, kg/m2). After each work shift during the week, workers provided information on their job duties during the day and the timing and location of all breaks. Information on potential confounders, such as smoking status, number of cigarettes smoked on each sampling day, second-hand smoke (SHS) exposure and dietary habits (specifically consumption of grilled/smoked foods as a possible source of PAHs) was also obtained.

2.5. Statistical Analyses

Linear mixed effects models for repeated measures were used to assess the associations between measured pollutants and biomarker levels. We included a random intercept for each participant to account for baseline inter-individual differences and assumed unstructured autocorrelation. We controlled for personal characteristics, including age, BMI, smoking status and number of cigarettes smoked per shift by including them as confounders a priori in the models. Covariates, such as past smoking history, self-reported consumption of grilled/smoked foods, self-reported SHS exposures during the work shift and switching shifts, were also considered as potential confounders and were kept in the models if they changed the primary effect estimate by ≥10%. The models fitted were as follows:
Yijk = β0 + β1(Exp)i + β2(day)j + β3(shift)k + β4(dayshift)jk + γ(covariates)ijk + bi + εijk
where:
  • Yijk: biomarker levels for subject i, on day j, at the k (pre-or post-shift) measurement point;
  • Expi: entered as the average of the daily pollutant levels on the two measured (first and last-day) work-shifts;
  • dayj: measurement day j: first or last day worked during the week;
  • shiftk: measurement time k relevant to shift, pre- or post-shift;
  • covariatesijk: covariates entered in the model as listed above;
  • bi: random intercept for each individual i;
  • eijk: within subject error.
The average exposure model was fitted to examine possible persistent rather than acute effects. The day and shift variables and their interaction allow outcome measurements to vary with time irrespective of exposure or covariate values. To examine for any transient effects, the following model was fitted:
Yij = β0 + β1(Exp)ij + β2(day)j + γ(covariates)ij + bi + εij
Only post-shift biomarkers measurements were used where Expij is the estimated exposure for each participant on a given day, and the other variables are as described above.
We also fitted models to assess associations between biomarkers of exposure (1 & 2-AN, 1-AP) and the biomarker of effect (8-OHdG). The models fitted were similar to Equation 1 with 8-OHdG levels as the outcome Yijk and concurrent 1 & 2-AN or 1-AP levels as a time varying exposure Expijk in separate models. Models for 8-OHdG were also adjusted for self-reported doctor diagnoses of chronic respiratory conditions (chronic bronchitis, emphysema), which are thought to be associated with oxidative damage [36].
Exposure and time (day and shift) interactions were considered for all models to assess possible time varying effects of exposure, and the choice of the final model was decided by likelihood ratio tests. Data was restricted to non-smokers (n = 69) in a sensitivity analysis. All statistical analyses were performed using SAS (SAS version 9.3; SAS Institute Inc., Cary, NC, USA, 2011).

3. Results

3.1. Study Population

Demographic characteristics for the 82 study participants are presented in Table 1. Briefly, the age range in the study sample was 23 to 66 years, with a mean ± standard deviation (SD) of 50.2 ± 8.6, and participants were predominantly white (93%). The length of the workweek among study participants ranged from two to five days with a mean of 4.0 ± 0.5 days. Shift length ranged from 2.2 to 13.4 h with a mean of 9.5 ± 1.9 h.
As expected in a healthy working population, there were few reports of chronic disease, but mean BMI was elevated (30.1 ± 4.5).
Table 1. Study population characteristics of participating male trucking industry workers.
CharacteristicTotal
Total no.82
Race, White (no. (%))76 (93%)
Race, Non-white (no. (%))6 (7%)
Age (years, mean ± SD)50.2 ± 8.6
BMI (kg/m2, mean ± SD)30.1 ± 4.5
Current smoker (no. (%))13 (16%)
Past smoker (no. (%))37 (45%)
Cigs smoked per shift (mean ± SD)6.9 ± 5.8
Grilled/smoked food consumption (no. (%))38 (46)
Chronic respiratory disease (no. (%))14 (17)
Total workdays (mean ± SD)4.0 ± 0.5
Average shift duration (h, mean ± SD)9.5 ± 1.9
Figure 1. Boxplots for PM2.5, EC and OC levels assigned to study participants for the first and last days of the workweek.
Toxics 02 00377 g001

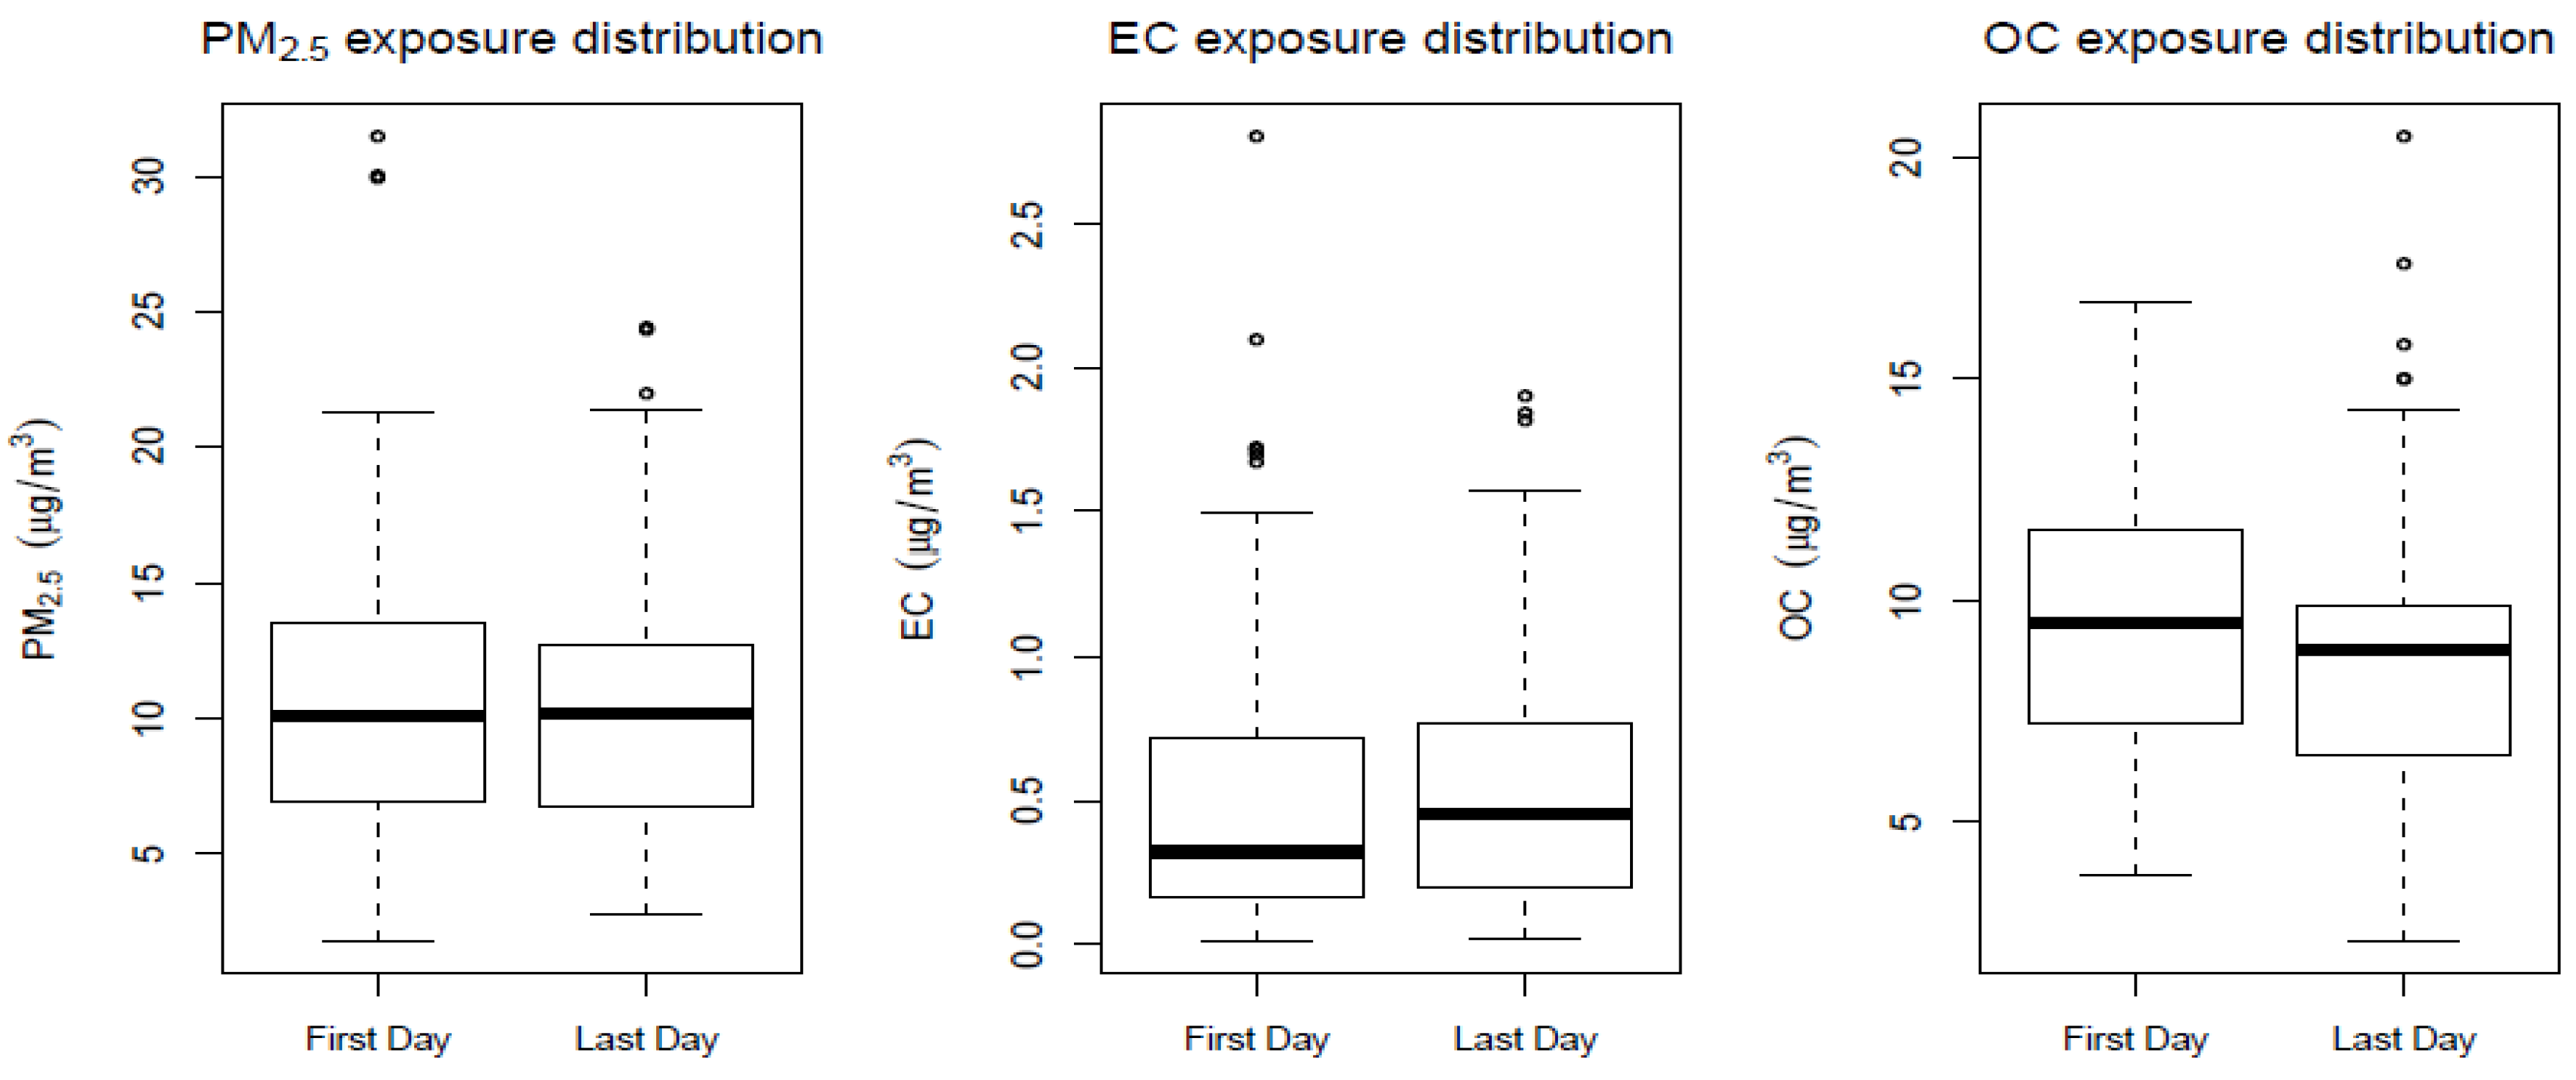
3.2. Pollutant Exposure Measurements

Levels of PM2.5, EC and OC are presented in Figure 1 by the day of the workweek. First and last day mean (± SD) levels for the three pollutants were 10.81 (± 4.73) μg/m3 for PM2.5, 0.54 (± 0.41) μg/m3 for EC and 8.95 (± 3.02) μg/m3 for OC. Dockworkers and P & D drivers had higher PM2.5 and EC exposures compared to office clerks, while OC was lowest among dockworkers.

3.3. Associations between Pollutant Measurements and Biomarkers

Distributions for creatinine adjusted levels of 1 & 2-AN and 1-AP levels were right skewed, and the distributions were similar across the different measurement time points (Figure 2). First day, pre-shift measurements of 8-OHdG levels appeared higher than the other measurement points.
Figure 2. Boxplots for mean 1 & 2 aminonaphthalene (1 & 2-AN), 1-aminopyrene (1-AP) and 8-hydroxy-2'-deoxyguanosine (8-OHdG) levels for different measurement points (pre- and post-shift measurements on the first and last days of the workweek).
Toxics 02 00377 g002
In general, 1 & 2-AN levels increased with greater exposures to PM2.5 and EC, but not OC. There was a positive association between first and last day mean EC levels and 1-AP, but associations reached statistical significance only in the case of 1 & 2-AN and first and last day mean PM2.5 (Table 2). This association persisted in a sensitivity analysis using the subset of non-smokers (131.38 pg/mg creatinine increase per IQR increase in PM2.5 exposure, 95% CI: 30.10–232.62). For comparison, current active smoking (compared to former or never smoking) also had a positive association with 1 & 2-AN levels (519.63 pg/mg creatinine increase, 95% CI: 140.95–898.32) in models, including the two post-shift measurements), but not with 1-AP levels.
Associations between 8-OHdG levels and biomarkers of exposure are shown in Table 3 and elevations were observed with all markers of exposure. However, this association was only statistically significant for 1 & 2-AN levels with a 2.38-µg/mg creatinine increase (95% CI: 0.19, 4.58) in 8-OHdG per IQR increase in exposure. The effects of 1-AP were attenuated in comparison. In the subset of non-smokers, the change in 8-OHdG levels associated with 1 & 2-AN levels was attenuated, but remained elevated in association with air pollution measures.
Table 2. Change in marker levels (pg/mg creatinine) and 95% confidence intervals associated with each IQR increase in pollutant exposure measurements a.
ExposureIQR1 & 2-AN change (95% CI)1-AP change (95% CI)
First-Last day mean b
PM2.5 (μg/m3)5.54141.8 (53.3, 230.2)2.4 (−32.2, 37.1)
EC (μg/m3)0.5164.7 (−32.2, 161.7)18.3 (−17.5, 54.2)
OC (μg/m3)3.97−49.8 (−154.3, 54.7)14.3 (−24.2, 52.9)
Daily c
PM2.5 (μg/m3)6.2065.2 (−40.6, 171.0)−23.7 (−58.9, 11.4)
EC (μg/m3)0.55105.9 (−3.8, 215.7)−9.7 (−41.8, 22.4)
OC (μg/m3)3.89−36.1 (−145.1, 72.8)2.9 (−30.0, 35.8)
Notes: a Linear mixed effect models for repeated measures with random intercepts for each individual and adjusting for age, BMI, smoking status and number of cigarettes smoked per shift, SHS exposure and dietary exposure to PAHs; b Pollutant models with first and last-day average exposure values (average of available values over the work-week) as the exposure of interest, with each pollutant modelled separately, using all four measurement points for the outcome; c Pollutant models with daily exposure values as the exposure of interest, with each pollutant modeled separately, using post-shift measurement points for the outcome.
Table 3. Change in 8-OHdG levels (in µg/mg creatinine) and 95% confidence intervals associated with each IQR increase associated with air pollutants and biomarkers of exposure a.
Exposure bIQRAll Participants Change in 8-OHdG (95% CI)Non-Smokers Change in 8-OHdG, (95% CI)
PM2.5 (μg/m3)5.545.50 (−2.50, 13.50)8.54 (−0.98, 18.05)
EC (μg/m3)0.512.36 (−6.45, 11.18)3.10 (−6.77, 12.97)
OC (μg/m3)3.971.08 (−8.08, 10.24)2.40 (−8.91, 13.70)
1 & 2-AN (pg/mg creatinine)242.852.38 (0.19, 4.58)1.54 (−1.22, 4.30)
1-AP (pg/mg creatinine)50.191.18 (−0.33, 2.68)1.35 (−0.26, 2.95)
Notes: a Linear mixed effect models for repeated measures with random intercepts for each individual and adjusting for age, BMI, smoking status and number of cigarettes smoked per shift, SHS exposure, dietary exposure to PAHs and chronic respiratory conditions; b Pollutant models with first and last-day average exposure values (average of available daily exposures over the work-week) as the exposure of interest, with each pollutant modeled separately, using all four measurement points for the outcome. Biomarkers of exposure levels, concurrent with the outcome, were used also considered as exposures in separate models.

4. Discussion

We assessed associations between urinary levels of two different measures of amino-PAHs, 1 & 2-AN and 1-AP, and job-specific exposures to various measures of air pollution in a population with regular occupational exposures to vehicle exhaust, at ranges overlapping with exposures experienced by the general population. We observed an association between urinary 1 & 2-AN and PM2.5 levels, but no statistically significant associations with 1-AP levels. We also observed a positive association between 1 & 2-AN levels and concurrent 8-OHdG, a marker of oxidative DNA damage. 1 & 2-AN levels, but not 1-AP, seemed to be associated with active smoking in the present study, as well. Overall, these findings suggest associations of 1 & 2-AN with more general measures of traffic-related and background air pollution.
1-AP and aminonaphthalenes have previously been considered as biomarkers for inhaled PAHs from sources, such as air pollution and cigarette smoke [37]. While 2-AN has been found to be associated with smoking [38,39,40], no distinction in 1-AP levels between smokers and non-smokers was seen in a study of miners exposed to diesel exhaust [16], and it has been suggested that 1-AP may be a more diesel-specific biomarker.
Urinary 1-AP levels have been shown to increase in subjects exposed to diesel exhaust compared to clean air controls in a controlled experiment [33]. No dose-response was established, however, and determining a clear window of internalized exposure and the appearance of the metabolites could be challenging, given the large between-person variability in marker levels and kinetics observed [17,33]. The same limitations were observed in a study of other nitropyrene metabolites in taxi drivers occupationally exposed to diesel exhaust [41]. An earlier study reported no significant difference of 1-AP levels in blood, between small samples of workers occupationally exposed to diesel exhaust and urban and rural populations [15]. No associations with 1-AP and quantitative measures of exposure have been reported in these studies, however.
The lack of associations with urinary 1-AP and any of our microenvironment exposure measures in the present study may suggest a contribution from sources of vehicle exhaust in general, rather than specifically diesel sources. EC has been used as a surrogate for diesel exhaust exposures in the past [22], since traditional diesel engines typically produced more EC than spark-ignition engines. However, traffic related black carbon (BC) levels have been shown to decrease over time and more recently with the introduction of new pollution controls for heavy-duty diesel vehicles in the U.S. [42]. Consistent with that finding, the micro-environment levels measured in this study are similar to ambient levels and lower than levels seen in industry historically [43,44]. Despite this limitation, however, we were still able to observe an effect between amino-PAHs and DNA oxidative damage-related biomarkers of effect, potentially indicating some information about exposure not captured by the traditional measures of pollution.
Our results suggest that nitro-PAH metabolites reflect longer term traffic exposures, since the strongest association was with PM2.5 averaged over the work week and not shift-specific levels. Limitations of the current study design include the limited window of exposure-biomarker comparisons available, since microenvironment exposure assessments were only conducted for the week of the study. There was also some potential for exposure misclassification, as assigned exposures relied on microenvironment measurements rather than personal sampling, but we have previously shown that the microenvironments where sampling took place, as defined by job description and location within a trucking terminal, result in highly representative samples of measured personal exposures in this industry [43]. Information on additional covariates on the individual level that could have affected susceptibility to oxidative damage, such as long-term dietary habits and genetic factors, was lacking; all analyses, however, included random baseline effects on the individual level.
The concurrent measurements of biomarkers of exposure and effect, as well as the assessment of microenvironment exposures in a real-world setting are the strengths of the current study. Additionally, all sampled terminals were in the same company, with identical job duties, control technologies and with trucks that were less than five years old, thus reducing potential sources of differential exposure misclassification across terminals. In addition, since the study population is a generally healthy working male population, results may not be applicable to more sensitive or susceptible populations or to females.

5. Conclusions

This is one of a limited number of reports relating biomarker indicators of vehicle exhaust to measured exposures and with measures of oxidative damage. Using a concurrent assessment of microenvironment exposures in a population with regular exposure to freshly-generated vehicle exhaust, we observed associations between exposure to PM2.5 in workers occupationally exposed to vehicle exhaust with a nitro-PAH biomarker and a biomarker of oxidative DNA damage. Since the occupational exposures measured in this population overlap with exposures in the general population, our results suggest that 1 & 2-AN might serve as a marker of vehicle exhaust in the general population after adjustment for cigarette smoke exposure.

Abbreviations

1 & 2-AN
1-aminonaphthalene and 2-aminonaphthalene
1-AP
1-aminopyrene
1 & 2-NN
1-nitronaphthalene and 2-nitronaphthalene
1-NP
1-nitropyrenre
8-OHdG
8-hydroxy-2'-deoxyguanosine
BMI
body mass index
EC
elemental carbon
IQR
interquartile range
LOD
level of detection
OC
organic carbon
PAH
polycyclic aromatic hydrocarbon
PM
particulate matter
PM1.0
particulate matter less than 1.0 µm in diameter
PM2.5
particulate matter less than 2.5 µm in diameter
SD
standard deviation
SHS
second-hand smoke

Acknowledgments

The study was supported by the National Institute of Health/National Institute of Environmental Health Sciences Grants R01 ES016284 and ES00002.

Author Contributions

Andreas M. Neophytou was responsible for the analysis and interpretation of data and drafting of the manuscript. Jaime E. Hart assisted with the design, data acquisition, data analysis and manuscript preparation. Yan Chang was responsible for data acquisition and analysis. Junfeng (Jim) Zhang was involved in data analysis, interpretation of results and manuscript preparation. Thomas J. Smith was involved in the study design and interpretation of results. Eric Garshick was involved in the study design, interpretation of results and manuscript preparation. Francine Laden made contributions to the conception, design, analysis and drafting the manuscript. All authors read and approved the manuscript.

Conflicts of Interest

The authors declare no conflict of interest.

References

  1. Brook, R.D.; Rajagopalan, S.; Pope, C.A., III; Brook, J.R.; Bhatnagar, A.; Diez-Roux, A.V.; Holguin, F.; Hong, Y.; Luepker, R.V.; Mittleman, M.A.; et al. Particulate matter air pollution and cardiovascular disease: An update to the scientific statement from the American Heart Association. Circulation 2010, 121, 2331–2378. [Google Scholar] [CrossRef]
  2. Dockery, D.W.; Luttmann-Gibson, H.; Rich, D.Q.; Link, M.S.; Mittleman, M.A.; Gold, D.R.; Koutrakis, P.; Schwartz, J.D.; Verrier, R.L. Association of air pollution with increased incidence of ventricular tachyarrhythmias recorded by implanted cardioverter defibrillators. Environ. Health Perspect. 2005, 113, 670–674. [Google Scholar] [CrossRef]
  3. Peters, A.; Dockery, D.W.; Muller, J.E.; Mittleman, M.A. Increased particulate air pollution and the triggering of myocardial infarction. Circulation 2001, 103, 2810–2815. [Google Scholar] [CrossRef]
  4. Brunekreef, B.; Holgate, S.T. Air pollution and health. Lancet 2002, 360, 1233–1242. [Google Scholar] [CrossRef]
  5. Dominici, F.; Peng, R.D.; Bell, M.L.; Pham, L.; McDermont, A.; Zeger, S.L.; Samet, J.M. Fine particulate air pollution and hospital admission for cardiovascular and respiratory diseases. JAMA 2006, 295, 1127–1134. [Google Scholar] [CrossRef]
  6. Brauer, M.; Hoeck, G.; Smit, H.A.; de Jongste, J.C.; Gerritsen, J.; Postma, D.S.; Kerkhof, M.; Brunekreef, B. Air pollution and development of asthma, allergy and infections in a birth cohort. Eur. Respir. J. 2007, 29, 879–888. [Google Scholar] [CrossRef]
  7. IARC: Diesel engine exhaust carcinogenic. Available online: http://w2.iarc.fr/en/media-centre/pr/2012/ (accessed on 16 December 2013).
  8. IARC: Outdoor air pollution a leading environmental cause of cancer deaths. Available online: http://www.iarc.fr/en/media-centre/iarcnews/pdf/pr221_E.pdf (accessed on 16 December 2013).
  9. Dockery, D.W.; Pope, A.C., III; Xu, X.; Spengler, J.D.; Ware, J.H.; Fay, M.E.; Ferris, B.G., Jr.; Speizer, F.E. An association between air pollution and mortality in six U.S. cities. N. Engl. J. Med. 1993, 329, 1753–1759. [Google Scholar] [CrossRef]
  10. Laden, F.; Schwartz, J.; Speizer, F.E.; Dockery, D.W. Reduction in fine particulate air pollution and mortality: Extended follow-up of the Harvard Six Cities study. Am. J. Respir. Crit. Care Med. 2006, 173, 667–672. [Google Scholar] [CrossRef]
  11. Paustenbach, D.; Galbraith, D. Biomonitoring and biomarkers: Exposure assessment will never be the same. Environ. Health Perspect. 2006, 114, 1143–1149. [Google Scholar] [CrossRef]
  12. Lewtas, J. Air pollution combustion emissions: Characterization of causative agents and mechanisms associated with cancer, reproductive and cardiovascular effects. Mut. Res. 2007, 636, 95–133. [Google Scholar] [CrossRef]
  13. Vineis, P.; Husgafvel-Pursiainen, K. Air pollution and cancer: Biomarker studies in human populations. Carcinogenesis 2005, 26, 1846–1855. [Google Scholar] [CrossRef]
  14. Demetriou, C.A.; Raaschou-Nielsen, O.; Loft, S.; Moller, P.; Vermeulen, R.; Palli, D.; Chadeau-Hyam, M.; Xun, W.W.; Vineis, P. Biomarkers of ambient air pollution and lung cancer: A systematic review. Occup. Environ. Med. 2012, 69, 619–627. [Google Scholar] [CrossRef]
  15. Zwirner-Baier, I.; Neumann, H.G. Polycyclic nitroarenes (nitro-PAHs) as biomarkers of exposure to diesel exhaust. Mutat. Res. 1999, 441, 135–144. [Google Scholar] [CrossRef]
  16. Seidel, A.; Dahmann, D.; Krekeler, H.; Jacob, J. Biomonitoring of polycyclic aromatic compounds in the urine of mining workers occupationally exposed to diesel exhaust. Int. J. Hyg. Environ. Health 2002, 204, 333–338. [Google Scholar] [CrossRef]
  17. Huyck, S.; Ohman-Strickland, P.; Zhang, L.; Tong, J.; Xu, X.; Zhang, J. Determining times to maximum urine excretion of 1-aminopyrene after diesel exhaust exposure. J. Expo. Sci. Environ. Epidemiol. 2010, 20, 650–655. [Google Scholar] [CrossRef]
  18. Bigert, C.; Gustavsson, P.; Hallqvist, J.; Hogstedt, C.; Lewne, M.; Plato, N.; Reuterwall, C.; Schéele, P. Myocardial infarction among professional drivers. Epidemiology 2003, 14, 333–339. [Google Scholar]
  19. Gustavsson, P.; Plato, N.; Hallqvist, J.; Hogstedt, C.; Lewne, M.; Reuterwall, C.; Schéele, P. A population-based case-referent study of myocardial infarction and occupational exposure to motor exhaust, other combustion products, organic solvents, lead, and dynamite. Stockholm Heart Epidemiology Program (SHEEP) Study Group. Epidemiology 2001, 12, 222–228. [Google Scholar] [CrossRef]
  20. Vermeulen, R.; Silverman, D.T.; Garshick, E.; Vlaanderen, J.; Portengen, L.; Steenland, K. Exposure-response estimates dor diesel exhaust and lung cancer mortality based on data from three occupational cohorts. Environ. Health Perspect. 2014, 122, 172–177. [Google Scholar]
  21. Hart, J.E.; Garshick, E.; Smith, T.J.; Davis, M.E.; Laden, F. Ischaemic heart disease mortality and years of work in trucking industry workers. Occup. Environ. Med. 2013, 70, 523–528. [Google Scholar] [CrossRef]
  22. Garshick, E.; Laden, F.; Hart, J.E.; Davis, M.; Eisen, E.A.; Smith, T.J. Lung cancer and elemental carbon exposure in trucking industry workers. Environ. Health Perspect. 2012, 120, 1301–1306. [Google Scholar] [CrossRef]
  23. Albinet, A.; Leoz-Garziandia, E.; Budzinski, H.; Villenave, E. Polycyclic aromatic hydrocarbons (PAHs), nitrated PAHs and oxygenated PAHs in ambient air of the Marseilles area (South of France): Concentrations and sources. Sci. Total Environ. 2007, 384, 280–292. [Google Scholar] [CrossRef]
  24. Reisen, F.; Arey, J. Atmospheric reactions influence seasonal PAH and nitro-PAH concentrations in the Los Angeles Basin. Environ. Sci. Technol. 2005, 39, 64–73. [Google Scholar] [CrossRef]
  25. Bamford, H.A.; Bezabeh, D.Z.; Schantz, S.; Wise, S.A.; Baker, J.E. Determination and comparison of nitrated-polycyclic aromatic hydrocarbons measured in air and diesel particulate reference materials. Chemosphere 2003, 50, 575–87. [Google Scholar] [CrossRef]
  26. Lagorio, S.; Tagesson, C.; Forastiere, F.; Iavarone, I.; Axelson, O.; Carer, A. Exposure to benzene and urinary concentrations of 8-hydroxydeoxyguanosine, a biological marker of oxidative damage to DNA. Occup. Environ. Med. 1994, 51, 739–743. [Google Scholar] [CrossRef]
  27. Ren, C.; Fang, S.; Wright, R.O.; Suh, H.; Schwartz, J. Urinary 8-hydroxy-2'-deoxyguanosine as a biomarker of DNA damage induced by ambient pollution in the normative aging study. Occup. Environ. Med. 2010, 68, 562–569. [Google Scholar]
  28. Wei, Y.; Han, I.K.; Shao, M.; Hu, M.; Zhang, O.J.; Tang, X. PM2.5 constituents and oxidative DNA damage in humans. Environ. Sci. Technol. 2009, 43, 4757–4762. [Google Scholar]
  29. Neophytou, A.M.; Hart, J.E.; Cavallari, J.M.; Smith, T.J.; Dockery, D.W.; Coull, B.A.; Garshick, E.; Laden, F. Traffic-related exposures and biomarkers of systemic inflammation, endothelial activation and oxidative stress: A panel study in the US trucking industry. Environ. Health 2013, 12, 105. [Google Scholar] [CrossRef]
  30. NIOSH. Elemental Carbon (Diesel Particulate) 5040. In NIOSH Manual of Analytical Methods, 4th Ed. edU.S Department of Helath and Human Services, Centers for Disease Control and Prevention, National Institute for Occupational Safety and Health, DHHS (NIOSH): Cincinati, OH, USA, 2003. [Google Scholar]
  31. Tainio, M.; Tuomisto, J.T.; Hanninen, O.; Aarnio, P.; Koistinen, K.J.; Jantunen, M.J.; Pekkanen, J. Health effects caused by primary fine particulate matter (PM2.5) emitted from buses in the Helsinki metropolitan area, Finland. Risk. Anal. 2005, 25, 151–160. [Google Scholar]
  32. Yanosky, J.D.; MacIntosh, D.L. A comparison of four gravimetric fine particle sampling methods. J. Air Waste Manag. Assoc. 2001, 51, 878–884. [Google Scholar] [CrossRef]
  33. Laumbach, R.; Tong, J.; Zhang, L.; Ohman-Strickland, P.; Stern, A.; Fiedler, N.; Kipen, H.; Kelly-McNeil, K.; Lioy, P.; Zhang, J. Quantification of 1-aminopyrene in human urine after a controlled exposure to diesel exhaust. J. Environ. Monit. 2009, 11, 153–159. [Google Scholar] [CrossRef]
  34. Huang, W.; Wang, G.; Lu, S.E.; Kipen, H.M.; Wang, Y.; Hu, M.; Lin, W.; Rich, D.Q.; Ohman-Strickland, P.; Diehl, S.R.; et al. Inflammatory and Oxidative Stress Responses of Healthy Young Adults to Changes in Air Quality during the Beijing Olympics. Am. J. Respir. Crit. Care Med. 2012, 186, 1150–1159. [Google Scholar] [CrossRef]
  35. Ferris, B.G. Epidemiology Stamdardization Project (American Thoracic Society). Am. Rev. Respir. Dis. 1978, 118, 1–120. [Google Scholar]
  36. Igishi, T.; Hitsuda, Y.; Kato, K.; Sako, T.; Burioka, N.; Yasuda, K.; Sano, H.; Shigeoka, Y.; Nakanishi, H.; Shimizu, E. Elevated urinary 8-hydroxydeoxyguanosine, a biomarker of oxidative stress, and lack of association with antioxidant vitamins in chronic obstructive pulmonary disease. Respirology 2003, 8, 455–460. [Google Scholar] [CrossRef]
  37. Scherer, G. Biomonitoring of inhaled complex mixtures—Ambient air, diesel exhaust and cigarette smoke. Exp. Toxicol. Pathol. 2005, 57, 75–110. [Google Scholar] [CrossRef]
  38. Riffelmann, M.; Muller, G.; Schmieding, W.; Popp, W; Norpoth, K. Biomonitoring of urinary aromatic amines and arylamine hemoglobin adducts in exposed workers and nonexposed control persons. Int. Arch. Occup. Environ. Health 1995, 68, 36–43. [Google Scholar]
  39. Riedel, K.; Scherer, G.; Engl, J.; Heinz-Werner, H.; Tricker, A.R. Determination of three carcinogenic aromatic amines in urine of smokers and nonsmokers. J. Anal. Toxicol. 2006, 30, 187–195. [Google Scholar] [CrossRef]
  40. Lindner, D.; Smith, S.; Leroy, C.M.; Tricker, A.M. Comparison of exposure to selected cigarette smoke constituents in adult smokers and nonsmokers in a European, multicenter, observational study. Cancer Epidemiol. Biomarkers Prev. 2011, 20, 1524–1536. [Google Scholar] [CrossRef]
  41. Miller-Schulze, J.P.; Paulsen, M.; Kameda, T.; Toriba, A.; Tang, N.; Tamura, K.; Dong, L.; Zhang, X.; Hayakawa, K.; Yost, M.G.; et al. Evaluations of urinary metabolites of 1-nitropyrene as biomarkers for exposure to diesel exhaust in taxi drivers of Shenyang, China. J. Expo. Sci. Environ. Epidemiol. 2013, 23, 170–175. [Google Scholar] [CrossRef]
  42. Wang, Y.; Hopke, P.K.; Rattigan, O.V.; Chalupa, D.C.; Utell, M.J. Multiple-year black carbon measurements and source apportionment using δ-C in Rochester, New York. J. Air Waste Manag. Assoc. 2012, 62, 880–887. [Google Scholar] [CrossRef]
  43. Davis, M.E.; Hart, J.E.; Laden, F.; Garshick, E.; Smith, T.J. A retrospective assessment of occupational exposure to elemental carbon in the U.S. trucking industry. Environ. Health Perspect. 2011, 119, 997–1002. [Google Scholar]
  44. Smith, T.J.; Davis, M.E.; Reaser, P.; Natkin, J.; Hart, J.E.; Laden, F.; Heft, A.; Garshick, E. Overview of particulate exposures in the US trucking industry. J. Environ. Monit. 2006, 8, 711–720. [Google Scholar]

