Article

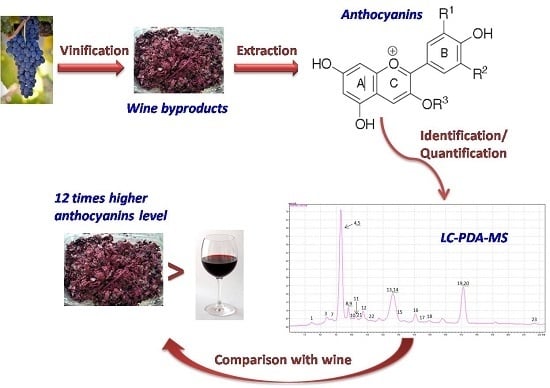
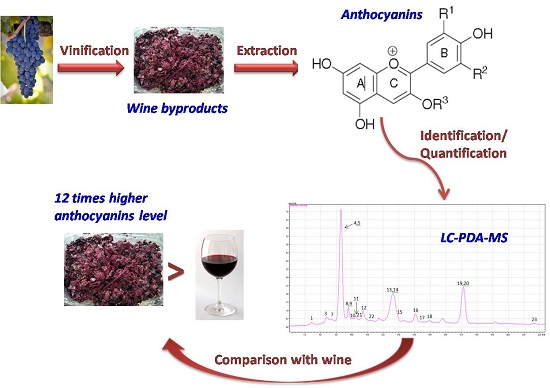
A Sensitive LC-MS Method for Anthocyanins and Comparison of Byproducts and Equivalent Wine Content

by
Evangelos D. Trikas
1,2,
Rigini M. Papi
2,
Dimitrios A. Kyriakidis
2 and
George A. Zachariadis
1,*
1
Laboratory of Analytical Chemistry, Department of Chemistry, Aristotle University, Thessaloniki 54124, Greece
2
Laboratory of Biochemistry, Department of Chemistry, Aristotle University, Thessaloniki 54124, Greece
*
Author to whom correspondence should be addressed.
Separations 2016, 3(2), 18; https://doi.org/10.3390/separations3020018
Submission received: 27 January 2016 / Revised: 29 April 2016 / Accepted: 18 May 2016 / Published: 3 June 2016
(This article belongs to the Special Issue Trends in Microextraction Techniques for Sample Preparation)

Abstract

:
Anthocyanins are a group of phenolic compounds with great importance, not only because they play a crucial role in a wine’s quality, but also due to the fact that they can have beneficial effects on human health. In this work, a method was developed for the detection and identification of these compounds in solid wastes of the wine-making industry (red grape skins and pomace), using liquid-liquid extraction (LLE) prior to the liquid chromatography-mass spectrometry technique (LC-MS). The complete process was investigated and optimized, starting from the extraction conditions (extraction solution selection, dried matter-to-solvent volume ratio, water bath extraction duration, and necessary consecutive extraction rounds) and continuing to the mobile phase selection. The extraction solution chosen was a methanol/phosphoric acid solution (95/5, v/v), while three rounds of consecutive extraction were necessary in order to extract the maximum amount of anthocyanins from the byproducts. During the LC-MS analysis, acetonitrile was selected as the organic solvent since, compared with methanol, not only did it exhibit increased elution strength, but it also produced significantly narrower peaks. To enable accurate identification of the analytes and optimization of the developed method, kuromanin chloride and myrtillin chloride were used as standards. Furthermore, the wine variety (Syrah) from which the specific byproducts were produced was analyzed for its anthocyanin content, leading to interesting conclusions about which anthocyanins are transferred from grapes to wine during the vinification procedure, and to what extent. The results of this study showed that the total concentration of anthocyanins estimated in wine byproducts exceeded almost 12 times the equivalent concentration in Syrah wine, while the four categories of detected anthocyanins, simple glucosides, acetyl glucosides, cinnamoyl glucosides, and pyroanthocyanins, were present in different ratios among the two samples, ranging from 18.20 to 1, to 5.83 to 1. These results not only confirmed the potential value of these byproducts, but also indicated the complexity of the anthocyanins’ transfer mechanism between a wine and its byproducts.

Graphical Abstract

1. Introduction

Nowadays, the number of people who are interested in their physical health and hence opt for a healthier way of living is increasing, and one of the main ways to achieve this is through their nutrition. Phytochemicals, which can be found in vegetables, nuts, fruits, juices, wines and related matrices, have beneficial effects on human health. Various compound groups belong to this category, including flavonols, flavanols, and anthocyanins.
The chemical structure of anthocyanins consists of two or three moieties, an aglycon moiety called anthocyanidin, the sugar/sugars moiety, and possibly acylating groups. Structural differences among anthocyanins arise from the number of hydroxyl and methoxyl groups, the sugar moieties, and the esterification type of the molecule. These differences lead to the large amount of diverse anthocyanins (more than 600). In spite of this variety, the vast majority of anthocyanins are derived from just six anthocyanidins which are more common than the others. These are, namely, cyanidin, delphinidin, malvidin, peonidin, petunidin and pelargonidin (Figure 1) (Table 1) [1,2,3,4].
One of the most interesting and distinguishing characteristics of the anthocyanins group is that in different pH conditions, their structure changes, resulting in a change of their color as well. This characteristic property is used to measure the amount of the total monomeric anthocyanin content (TAC) in samples, in an easy, quick, and cost-effective way. This is known as the “pH Differential Method” and was introduced by Sondheimer and Kertesz in 1948. Nowadays, the two pH values used for the above purpose are 1.0 and 4.5, respectively, and in order to avoid any potential interference with the calculation of the TAC, the absorbance is measured both at 520 nm and at 700 nm.
However, in order to evaluate the concentration of individual anthocyanins, other selective analytical techniques must be employed. In the past, capillary electrophoresis and various classic chromatographic methods such as paper and thin-layer chromatography were used [5,6,7,8,9,10,11]. Nowadays, the separation technique which is commonly applied is liquid chromatography using mainly C18 reversed-phase columns. This technique combined with UV-Vis (PDA (Photodiode array)) and/or mass spectrometry detectors has been used for the determination of anthocyanin content in various matrices [12,13,14,15,16,17,18,19,20,21,22,23,24,25,26,27,28].
One of the most common sources of anthocyanins in the human diet is red wine. Therefore, the determination of these compounds is of great importance, since, in conjunction with other phenolic compounds [29], inorganic content (such as calcium) [30], added sulfites [31], and some off-flavor substances [32,33], they are known to play a crucial role in defining the sensorial characteristics of wines.
Two papers that study the effect of the presence of lees on the phenolic compounds of wine and apply the HPLC-UV-Vis technique are those published by Fernandez et al. [12] and by Mazauric and Salmon [13]. The same technique was also used in other studies [14,15,16] for the determination of anthocyanins in wines, grape extracts, and red and black currant extracts. HPLC-DAD-MS has been widely used for the analysis of anthocyanins in various samples, such as purple corn cob [17,18,19,20,21,22], while the LC-nano-DESI-MS has been used in red wine analysis [23]. Last but not least, the use of LC-MS/MS has been applied in order to analyze wine grape skins [24], berry skins [22,25], human saliva [26], elderberry extracts [27] and red wine vinegar [28].
In this paper, a sensitive method for the quantitative extraction and determination of anthocyanins from winery byproducts is presented. The specific method investigates and optimizes not only the extraction procedure, but also the liquid chromatography-mass spectrometry (LC-PDA-MS) determination parameters. The purpose of this research was to investigate to what extent the anthocyanins are distributed between the wine (Syrah) and the byproducts that are produced during its vinification procedure, and if the estimated ratio of total anthocyanins between byproducts and wine is the same for every anthocyanin group or not. It is the first time that a comparative study about the concentration of anthocyanins’ between a specific wine variety (Syrah) and its byproducts is made and the obtained results could point to a direction towards the possible benefits from the utilization of these “wastes”.

2. Materials and Methods

2.1. Instrumentation

The operating conditions of LC-PDA-MS system and the applied elution program are given in detail in Table 2. A Shimadzu LCMS-2010 EV (Shimadzu, Kyoto, Japan), using electrospray ionization (ESI) process and a quadrupole mass analyzer, equipped with an SPD-M20A PDA (Shimadzu Corporation, Kyoto, Japan) detector was used for the chromatographic separation and identification of anthocyanins. The ion transmission to the quadrupole analyzer was enhanced using a Q-array and octapole configuration while ions were detected with a secondary electron multiplier detector (Shimadzu, Kyoto, Japan). A gradient elution program was employed, using water/formic acid (99/1, v/v) and acetonitrile/formic acid (99/1, v/v) as elution solvents. The flow rate was 0.5 mL·min−1 with a 45 min gradient elution program as follows: 0 min, 10% B; 0–5 min, 10%–22% B; 5–14 min, 22%–28% B; 14–35 min, 28%–42% B; 35–40 min, 42%–100% B; 40–45 min, 100%–10% B.

2.2. Reagents and Solutions

All reagents used were of analytical-reagent grade and deionized water was used for preparation of all aqueous solutions. Methanol (MeOH, Chem-Lab, Zedelgem, Belgium), ethanol (EtOH, Chem-Lab), acetic acid (CH3COOH, Panreac, Barcelona, Spain), formic acid (HCOOH, Panreac), and ortho-phosphoric acid (H3PO4 85%, Panreac) were used for the preparation of the extraction solutions tested during the optimization of the extraction procedure. Two buffer solutions were prepared for the application of the pH Differential Method, using potassium chloride (KCl, J.T. Baker, Deventer, The Netherlands), hydrochloric acid (HCl 37%, Carlo Erba Reagents, Milan, Italy), acetic acid (CH3COOH, Panreac), and sodium acetate (CH3COONa, J.T. Baker). Acetonitrile (ACN, LC-MS grade, Sigma-Aldrich, St. Louis, MO, USA), methanol (MeOH, LC-MS grade, Sigma-Aldrich), and water (H2O, Thermo Fischer Scientific, Waltham, MA, USA), were used as elution solvents during liquid chromatography.
Methanol solutions of kuromanin chloride (cyanidin-3-O-glucoside, C21H21O11Cl, ≥96%, Extrasynthese, Lyon, France), Myrtillin chloride (delphinidin-3-O-glucoside, C21H21O12Cl, Extrasynthese), and Oenin chloride (malvidin-3-O-glucoside chloride, C23H25O12Cl, Extrasynthese) were prepared by dissolving 1 mg of the standard in 5 mL of methanol. In this way three standard solutions containing 200 mg·L−1 of cyanidin-3-O-glucoside chloride, 200 mg·L−1 of delphinidin-3-O-glucoside chloride, and 200 mg·L−1 of malvidin-3-O-glucoside chloride, respectively, were prepared. Solutions at eight different concentration levels were prepared by diluting the above stock solutions appropriately to yield concentrations of 0.01 mg·L−1, 0.10 mg·L−1, 1.00 mg·L−1, 2.50 mg·L−1, 10.0 mg·L−1, 25.0 mg·L−1, 50.0 mg·L−1, and 100 mg·L−1. The wine variety Syrah and the byproducts produced during its vinification procedure were obtained from the ‘Ktima Gerovassiliou’ winery, Thessaloniki, Greece.

2.3. Extraction Procedure

The solid wastes were stored in a freezer (−20 °C). Amount of these wastes were freeze-dried and the resulted powder was collected and stored in the fridge (5 °C). The analogy between the amount before the freeze-drying and the resulting powder was 3 to 1.
After that, a certain quantity of the powder was mixed with the extraction solution. The mixture was vortexed, transferred to an ultrasound bath, and after that to a water bath at 45 °C for 2 h. The next step was the centrifugation of the mixture at 4000 rpm for 10 min and the collection of the supernatant.
The final step, in order to evaluate the effectiveness of the extraction procedure was the application of the pH Differential Method in the collected supernatant fluid. In order to do so, two buffers had previously been prepared, one for pH = 1, HCl-KCl, and one for pH = 4.5, CH3COOH-CH3COONa.

3. Results and Discussion

3.1. Optimization of the Extraction Procedure

Four parameters were investigated in order to optimize the extraction procedure of anthocyanins from these byproducts. Those were the selection of the extraction solution, the determination of the optimum analogy between dried matter and the extraction solution, the water bath extraction duration, and the determination of consecutive extraction rounds needed in order to retrieve the maximum amount of anthocyanins from the examined wastes. During the optimization studies of the extraction procedure, the pH differential method was applied for the evaluation of results.

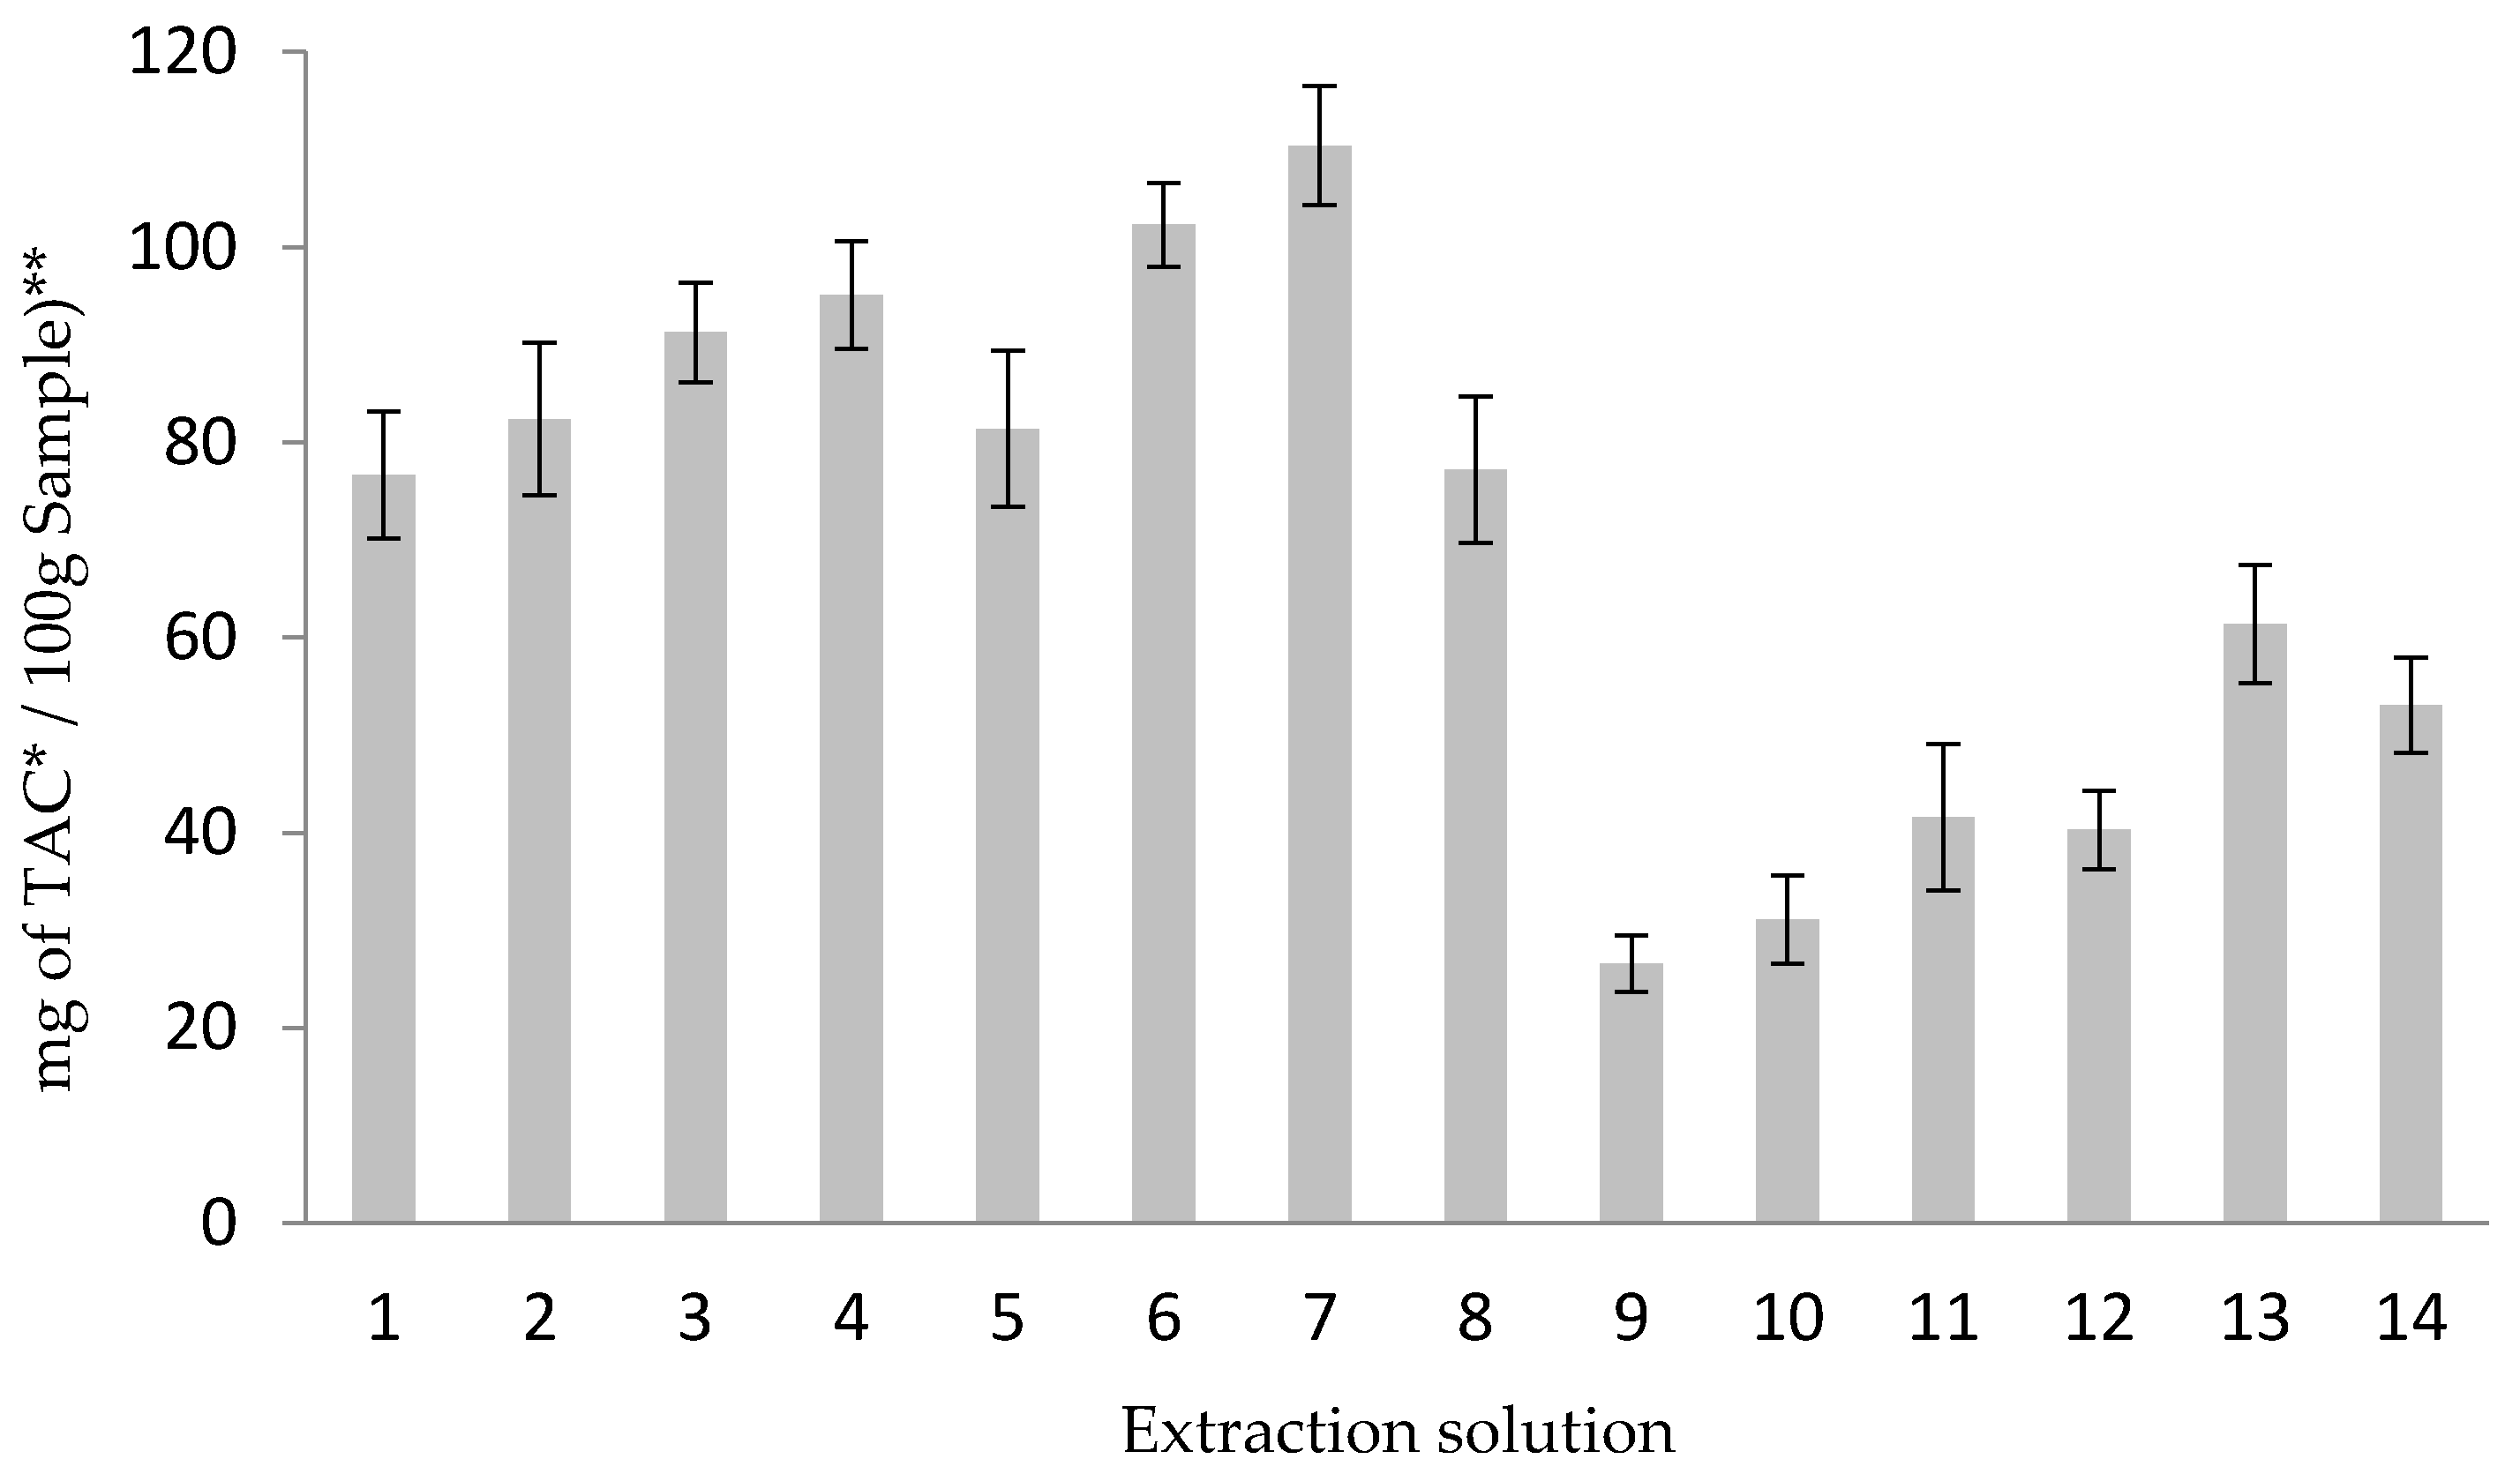
3.1.1. Extraction Solution Selection

Anthocyanins are extracted using organic solvents, and the most commonly used are methanol, ethanol, and acetone. In many cases acidified solutions are used because in this way it becomes easier for the anthocyanins to pass through the cellular membranes and be obtained by the extraction solution. Weak organic acids, or low concentrations of strong acids such as HCl, should be used.
In this work, two organic solvents were investigated, methanol and ethanol, in various combinations with acids and water. In total, 14 extraction solutions were tested (Figure 2), using formic, acetic, and phosphoric acid, each one at two different concentration levels, and water. The results showed that methanol performs better than ethanol as a solvent for the extraction of anthocyanins from the specific substrate, as has also been reported in the paper of Metivier et al. [34]. More specifically, the methanol/phosphoric acid solution (95/5, v/v) was chosen to be used as the extraction solution in this work since it exhibits the best results compared to all other solutions tested.

3.1.2. Dried Matter–to–Solvent Volume Ratio Optimization

During this stage, four dried matter-to-solvent volume ratios were tested: 1/10, 1/20, 1/30, 1/40 (g/mL) (Table 3). Statistical analysis of the results was employed for the selection of the optimum dried matter-to-solvent volume ratio, specifically the “Student’s t-test” at a 95% confidence level. It was found that the difference between the 1/20 and 1/10 ratios is statistically significant, while among the 1/20, 1/30, and 1/40 ratios there is no statistically significant difference. Consequently, the 1/20 ratio was selected, since the maximum amount of anthocyanins is retrieved from the examined wine byproducts with the least use of the extraction solvent.

3.1.3. Optimization of Water Bath Extraction Duration

Four different dried matter–extraction solution mixtures were prepared and they remained in the water bath at 45 °C for one, two, three and four hours, respectively (Table 4). Statistical analysis of the results was employed for the selection of the optimum water bath extraction duration. The “Student’s t-test” at a 95% confidence level was used again. It was found that the difference between one and two hours is statistically significant, while among two, three, and four hours there is no statistically significant difference. Therefore, two hours was selected as the optimum water bath extraction duration, since the maximum amount of anthocyanins is retrieved in the minimum amount of time.

3.1.4. Consecutive Extraction Rounds Optimization

As illustrated in Table 5, 81% of anthocyanins that can be retrieved from these wastes have been obtained after one extraction round only. However, in order to retrieve the maximum possible amount of anthocyanins from the byproducts, two additional extraction rounds are necessary.

3.2. Mobile Phase Selection

Using the same elution program, two organic elution solvents were tested as Solvent B (Table 2). The first was acetonitrile and the second was methanol (Figure 3). The two compounds are delphinidin-3-O-glucoside and cyanidin-3-O-glucoside (peaks 1 and 2). After the completion of the experiments, acetonitrile was selected as the optimum solvent because the chromatograms obtained with the use of that specific solvent outclassed the ones with methanol in two parameters.
First of all, the peaks’ widths were much narrower compared with the methanol-eluted peaks, improving the resolution between these peaks eluting in close elution times. Secondly, using the same elution program, the peaks were eluted much earlier, thus reducing the duration of the analysis. The elution time could also be reduced through the use of methanol as the organic solvent but this would require an increase in the ratio between the organic solvent and the water used, producing an increased volume of organic wastes.

3.3. Figures of Merit of the Proposed Method

The performance characteristics of the proposed method were derived from calibration using a series of standard samples at different concentration levels of oenin chloride (malvidin-3-O-glucoside chloride) solutions. The results, using linear regression analysis on peak area signals, are listed in Table 6, together with the repeatability, the limit of detection (LOD) and the limit of quantification (LOQ) of the method. The repeatability was calculated from n = 5 measurements at a 10.0 mg·L−1 concentration level. The detection and quantification limits were determined based on the standard deviation of the standard solution at the lowest concentration level. In particular, the limit of detection (LOD) was calculated as three times and the limit of quantitation (LOQ) as 10 times the above standard deviation divided by the slope of the calibration curve. The LOD and LOQ thus were computed as 9.0 ng·mL−1 and 27 ng·mL−1, respectively. The dynamic range extends between 0.03 and 10.0 mg·L−1.

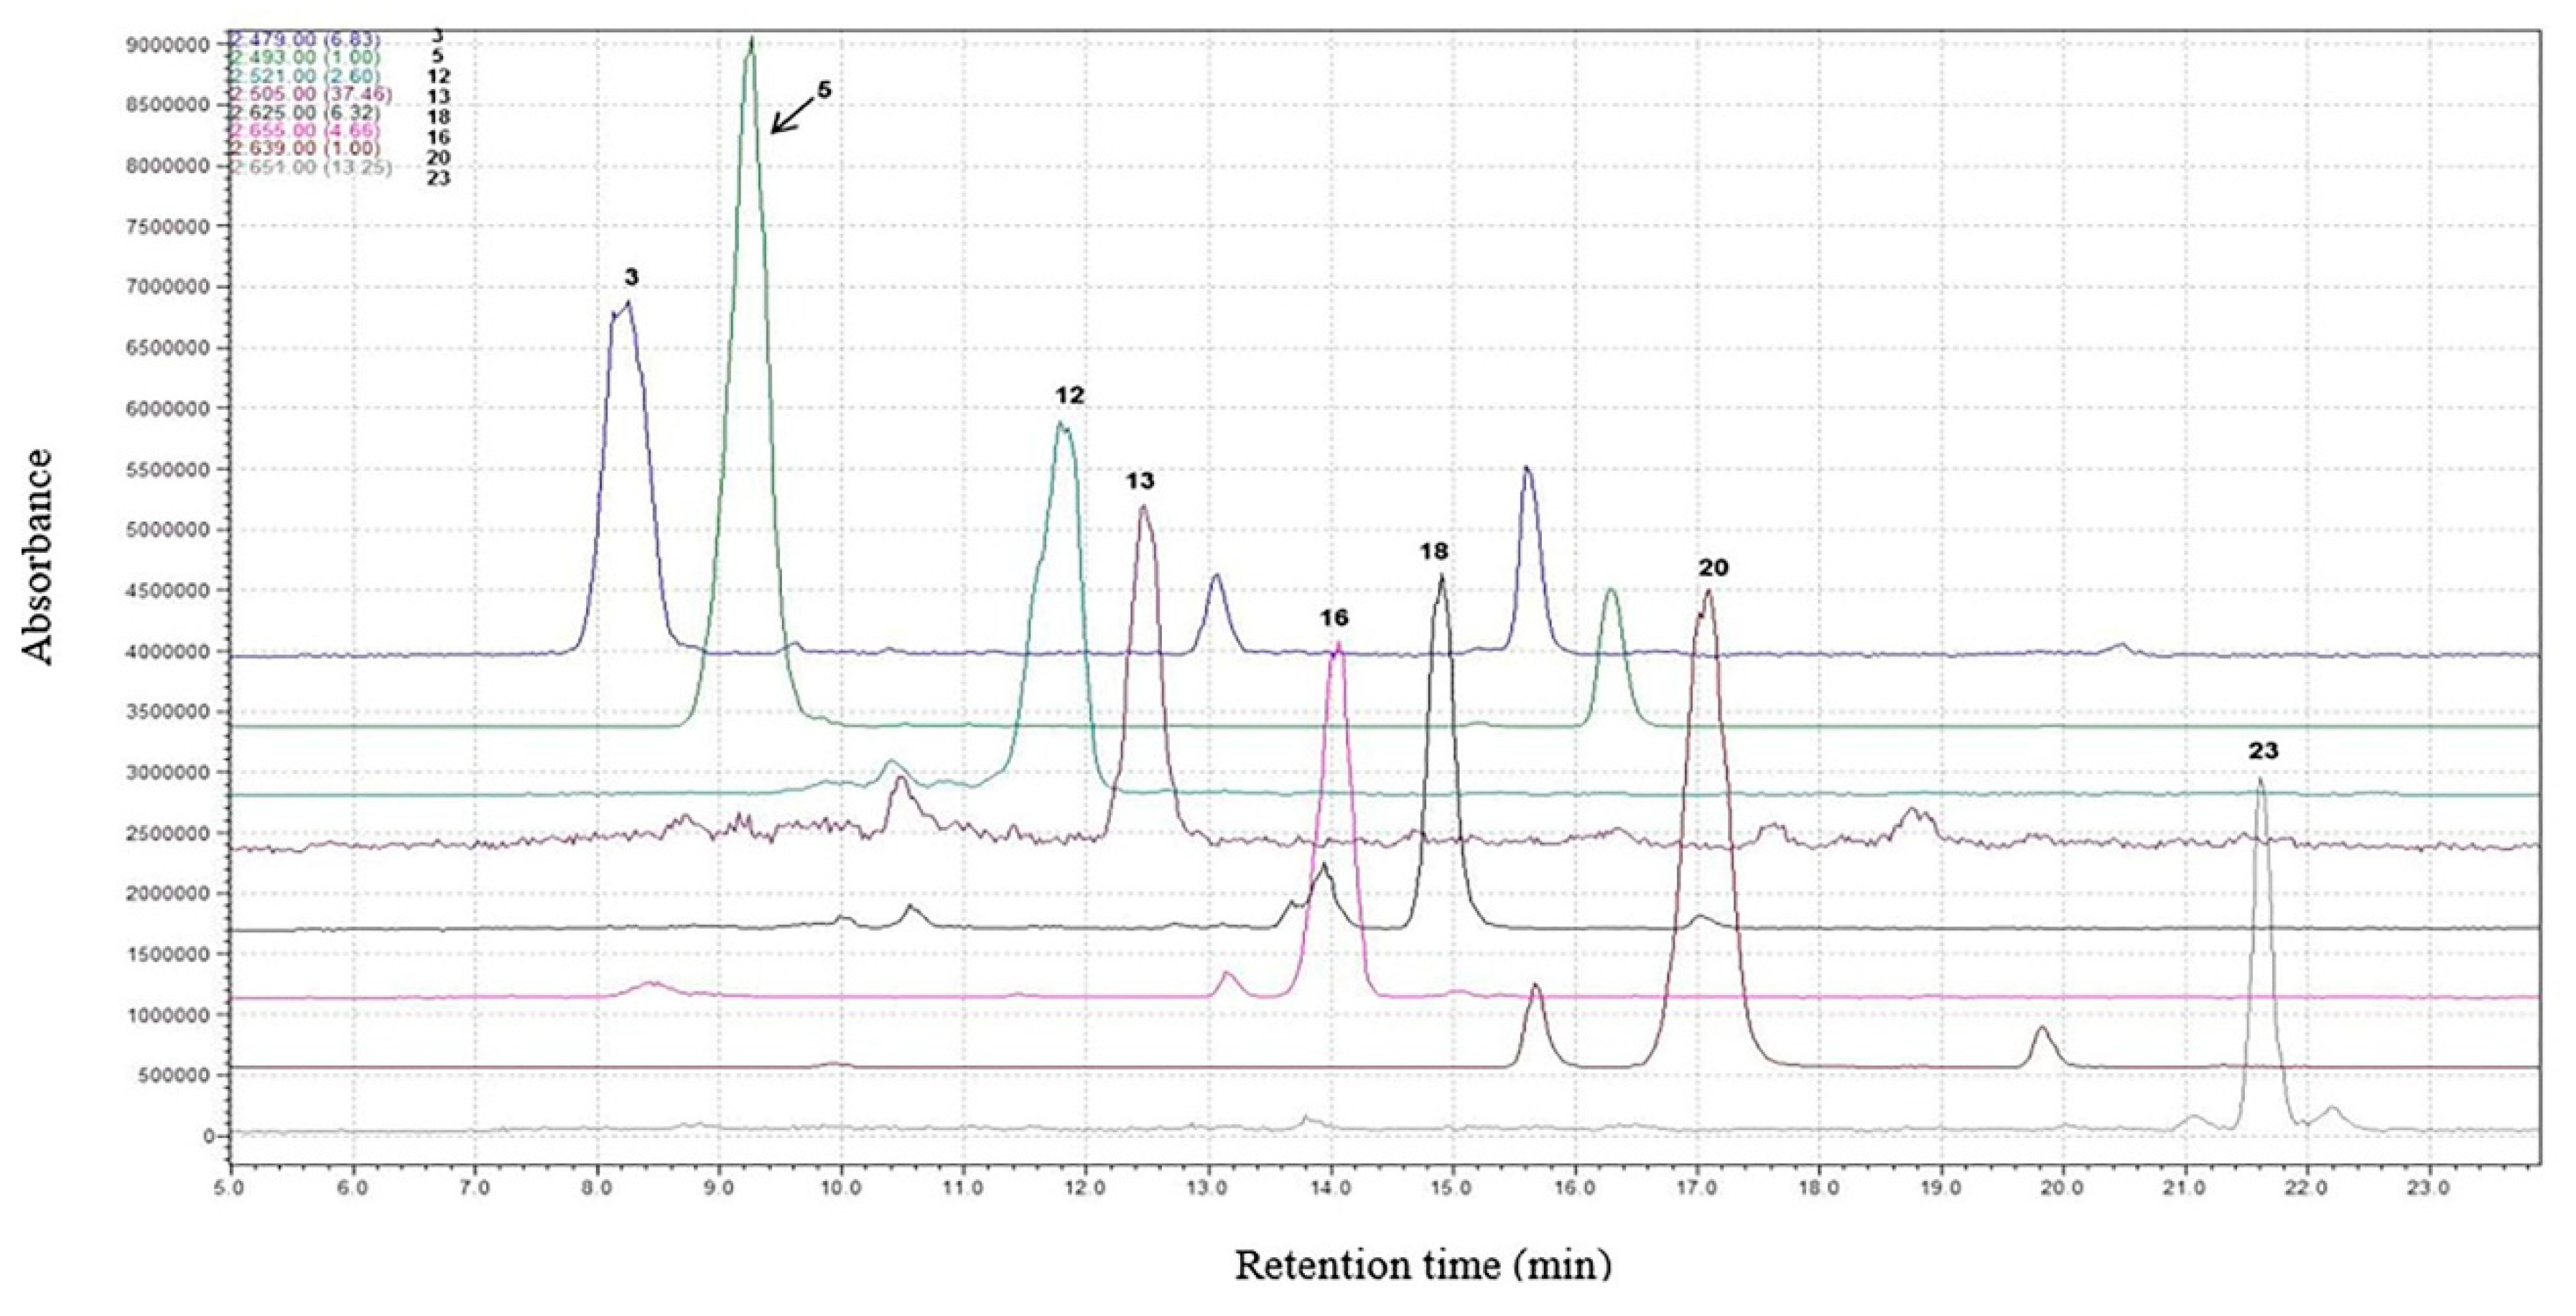
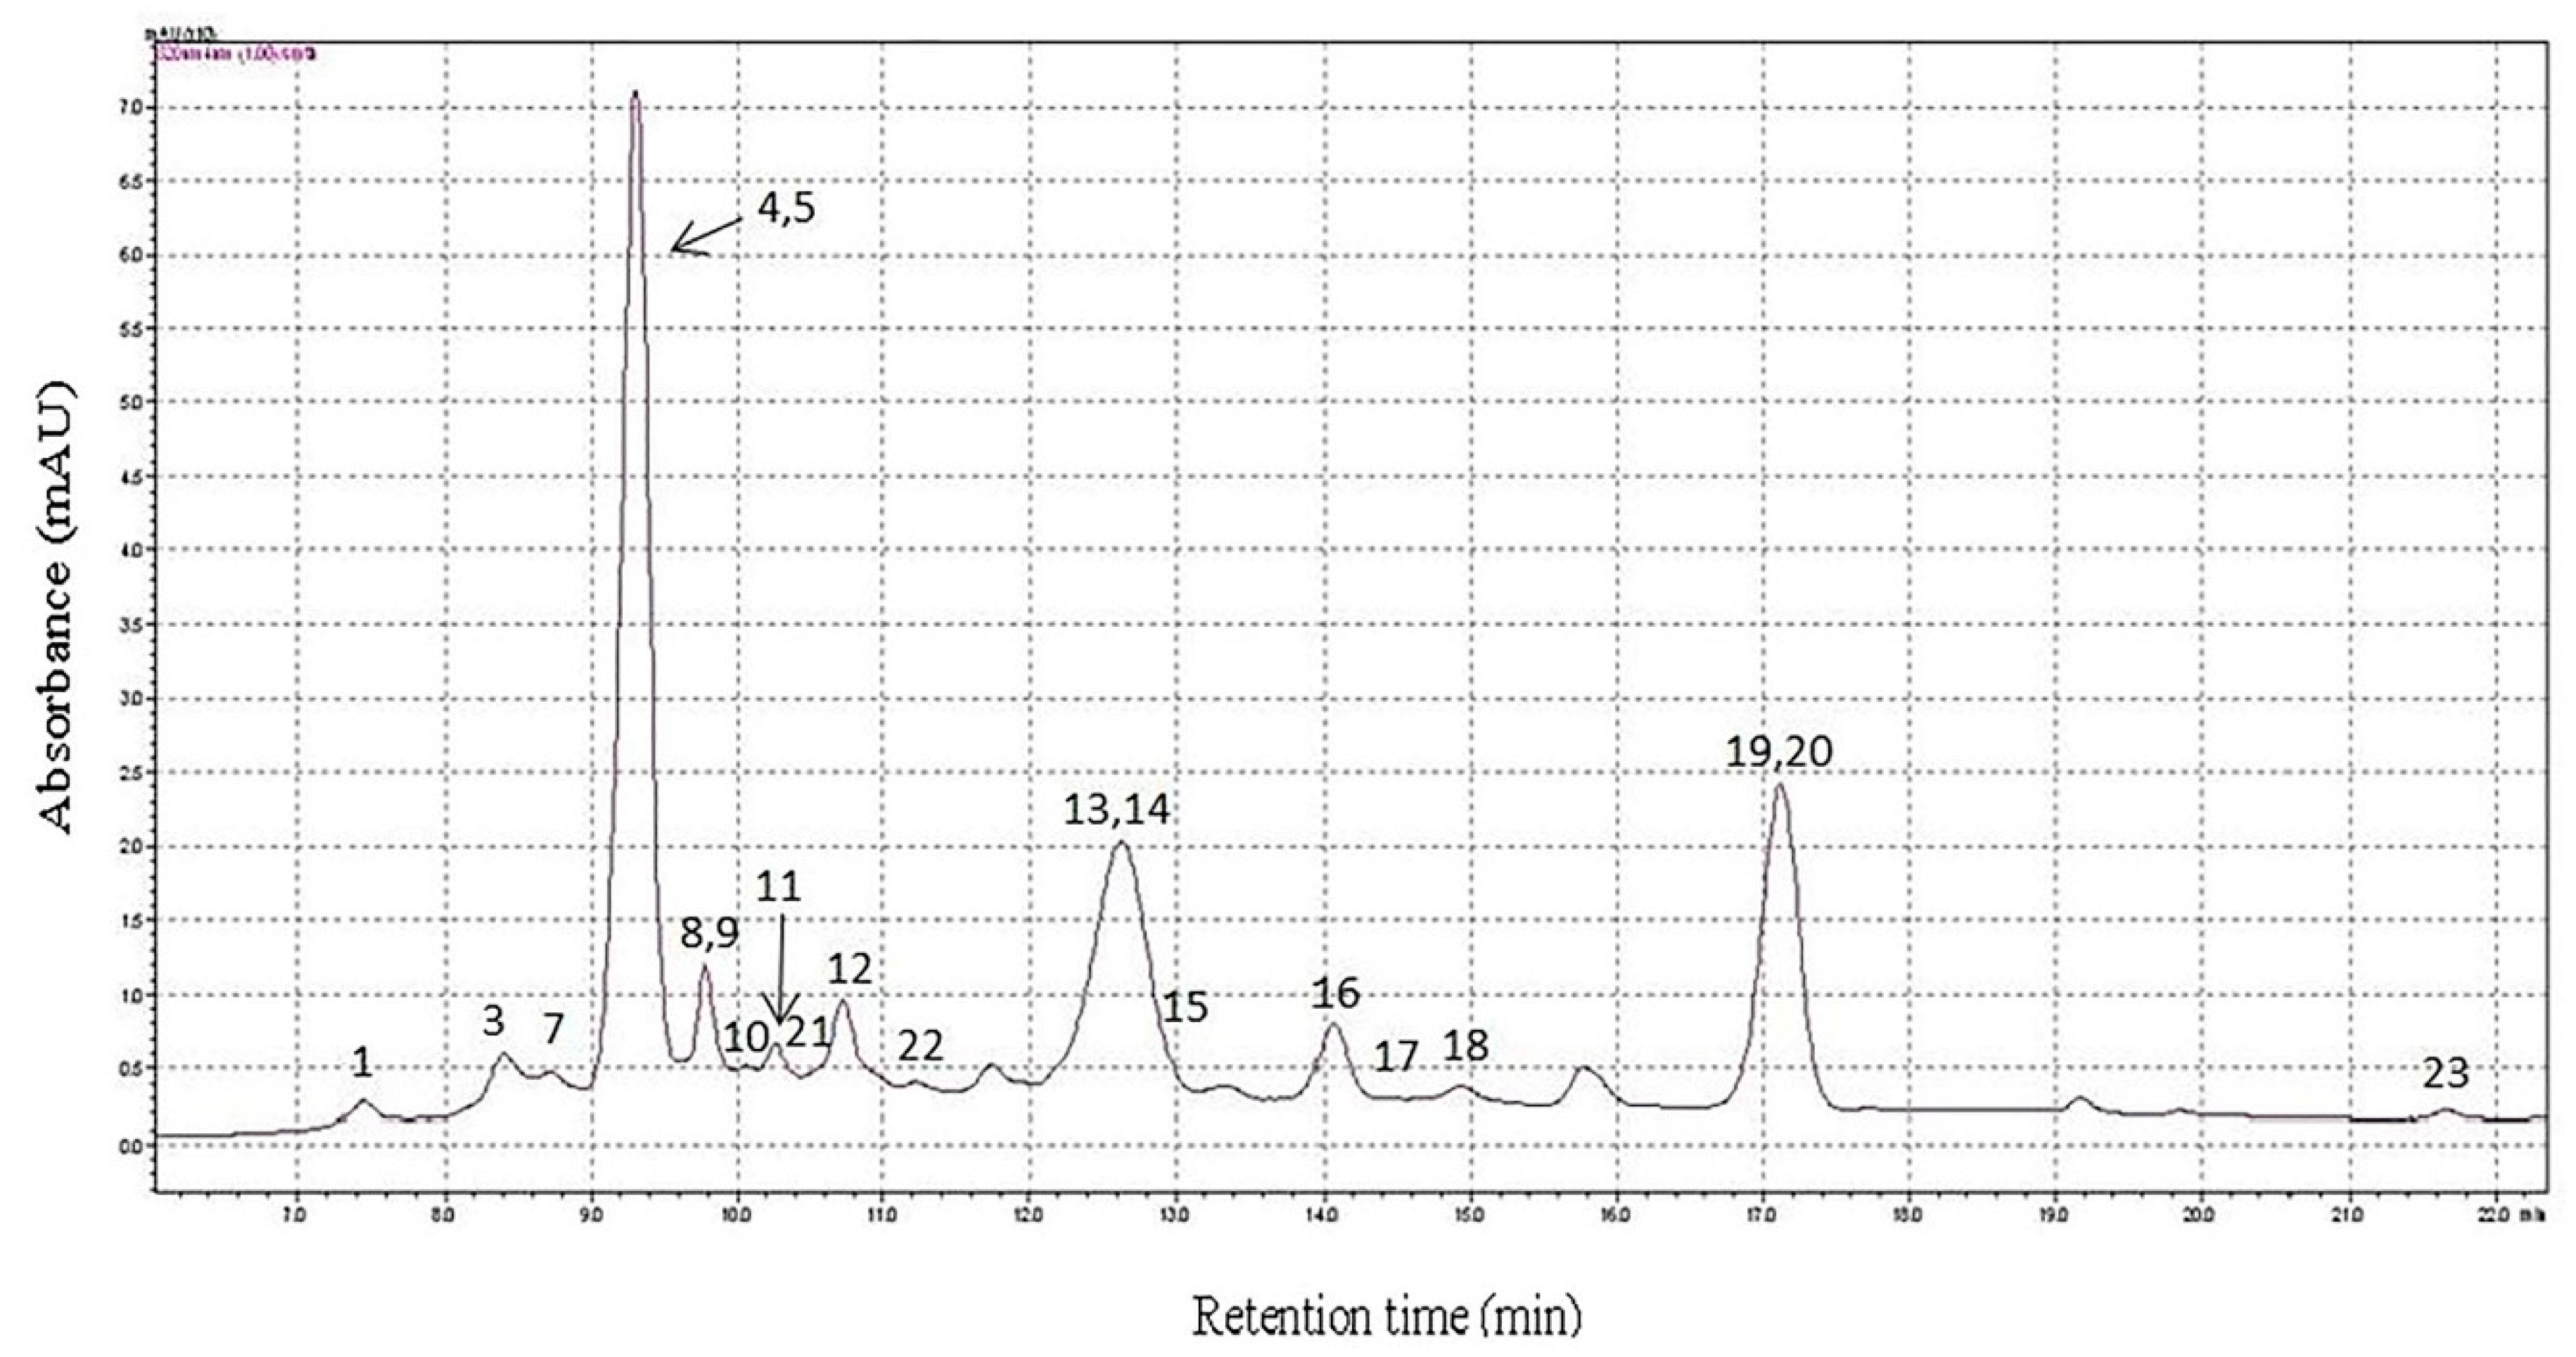
3.4. Identification and Quantification of Anthocyanins in Wine Variety (Syrah) and Its Byproducts

The proposed method was applied to two real samples, to the wine variety Syrah, and to the byproducts that were produced during the vinification procedure of the specific wine, and there were four main remarks after the analysis.
In total, 23 anthocyanins were identified. All of them were present in the wine, while 21 of them were detected in the wine byproducts (Figure 4 and Figure 5). The two anthocyanins that were detected in the wine, even in small amounts, but not in the wine byproducts were the cyanidin-3-O-glucoside and the delphinidin-glucoside-pyruvate derivative.
During the preliminary studies the samples’ mass spectra were acquired using both the scan and SIM (Selected-ion monitoring) mode for specific anthocyanins. However, during the last steps of the determination procedure, all of the detected anthocyanins were quantified using the SIM mode.
The analyzed samples, both the byproducts’ extract and the wine, apart from anthocyanins, were also very rich in many other phenolic compounds that could co-elute with some of the compounds of interest. By combining the use of the SIM mode at specific m/z (mass-to-charge ratio) values with the use of standard compounds and elution order data, there were no interferences problems that occurred during the quantification procedure due to matrix’s complexity.
In both samples the dominant anthocyanins were the malvidin-based ones, malvidin-3-O-glucoside, Mv-3-(6″-acetylglucoside), and Mv-3-(6″-p-coumaroylglucoside). However, the analogy in which those three compounds were present in each sample was quite different. In wine byproducts the most abundant compound was the Mv-3-(6″-acetylglucoside), and the concentration ratio of Mv-3-O-glucoside/Mv-3-(6″-acetylglucoside)/Mv-3-(6″-p-coumaroylglucoside) equals 1.67/1.73/1.00, while in wine the most abundant compound was the Mv-3-O-glucoside, and the respective ratio equals 3.48/2.79/1.00.
Furthermore, after the analysis of the samples, it was found that the four categories of the detected anthocyanins, simple glucosides, acetyl glucosides, cinnamoyl glucosides, and pyroanthocyanins, were not present in a standard ratio among the two samples, wine byproducts and wine (Table 7). The simple and the acetyl glucosides exhibited a ratio of almost 10 to 1, while cinnamoyl glucosides had a ratio of 18.20 to 1, and pyroanthocyanins had a ratio of 5.83 to 1.
All the above clearly show that the transfer mechanism of anthocyanins between a wine (Syrah) and its byproducts is not a simple procedure that functions and performs in the same way for every anthocyanin, indicating that it is probably affected by the chemical structure of every compound.
The total concentration of anthocyanins in wine byproducts was estimated to be almost 12 times higher than the equivalent concentration in Syrah wine (Table 8). This is extremely important since it indicates the potential that these “wastes” could have as a raw material for the recovery of that kind of compound, thus revealing their true value.

4. Conclusions

A sensitive method for the determination of anthocyanin compounds in winery byproducts was developed. The complete extraction procedure, along with some of the LC-PDA-MS analysis parameters, was investigated and optimized. The influence of five parameters was studied during the whole procedure, four during the extraction and one affecting the analysis of the supernatant. In the first category, the selection of the extraction solution, the dried matter–to–solvent volume ratio, the water bath extraction duration, and the necessary consecutive extraction rounds are included, while the second category covers the mobile phase selection. None of these parameters proved to be irrelevant with the final outcome of the analysis, and all of them could play a more or less crucial role in the obtained results. The last step of this work was the application of the method to real samples. A wine variety (Syrah) and the byproducts produced after the vinification procedure of the specific wine were analyzed for their anthocyanin content. This was the first time that an approach such as this was followed in order to evaluate which anthocyanins transferred from grapes to wine during the fermentation process, and to what degree. The results revealed that the transfer mechanism of anthocyanins is quite complex and affects every compound differently. Moreover, the anthocyanin content in the specific byproducts was found to be 12 times higher compared to the content in the wine (Syrah). Considering the fact that these compounds can have beneficial effects on human health, these results confirm the potential value of these byproducts and indicate a direction that should be followed towards their utilization.

Acknowledgments

This work was supported by “11SYN_2_1992” action “COOPERATION 2011” of EYDE-ETAK funded by the Operational Program “Competitiveness and Entrepreneurship” (EPAN-II).

Author Contributions

Evangelos Trikas, Rigini Papi, Dimitrios Kyriakidis and George Zachariadis conceived and designed the experiments; Evangelos Trikas performed the experiments as part of his Ph.D. thesis, analyzed the data, and wrote the paper.

Conflicts of Interest

The authors declare no conflict of interest.

Abbreviations

The following abbreviations are used in this manuscript:
MvMalvidin
LCliquid chromatography
PDAphotodiode array
MSmass spectrometry

References

  1. Bueno, J.; Ramos-Escudero, F.; Saez-Plaza, P.; Munoz, A.; Navas, M.J.; Asuero, A. Analysis and antioxidant capacity of anthocyanin pigments. Part I: General considerations concerning polyphenols and flavonoids. Crit. Rev. Anal. Chem. 2012, 42, 102–105. [Google Scholar] [CrossRef]
  2. Bueno, J.; Saez-Plaza, P.; Ramos-Escudero, F.; Jimenez, A.; Fett, R.; Asuero, A. Analysis and antioxidant capacity of anthocyanin pigments. Part II: Chemical structure, color, and intake of anthocyanins. Crit. Rev. Anal. Chem. 2012, 42, 126–151. [Google Scholar] [CrossRef]
  3. Navas, M.; Jimenez, A.; Bueno, J.; Saez-Plaza, P.; Asuero, A. Analysis and Antioxidant Capacity of Anthocyanin Pigments. Part III: An Introduction to Sample Preparation and Extraction. Crit. Rev. Anal. Chem. 2012, 42, 284–312. [Google Scholar] [CrossRef]
  4. Navas, M.; Jimenez, A.; Bueno, J.; Saez-Plaza, P.; Asuero, A. Analysis and antioxidant capacity of anthocyanin pigments. Part IV: Extraction of anthocyanins. Crit. Rev. Anal. Chem. 2012, 42, 313–342. [Google Scholar] [CrossRef]
  5. Corradini, E.; Foglia, P.; Giansanti, P.; Gubbiotti, R.; Samperi, R.; Lagana, A. Flavonoids: Chemical properties and analytical methodologies of identification and quantitation in foods and plants. Nat. Prod. Res. 2011, 25, 469–495. [Google Scholar] [CrossRef] [PubMed]
  6. Ignat, I.; Volf, I.; Popa, V. A critical review of methods of characterization of polyphenol compounds in fruit and vegetables. Food Chem. 2011, 126, 1821–1835. [Google Scholar] [CrossRef] [PubMed]
  7. Cote, J.; Caillet, S.; Doyon, G.; Sylvain, J.; Lacroix, M. Analyzing cranberry bioactive compounds. Crit. Rev. Food Sci. Nutr. 2010, 50, 872–888. [Google Scholar] [CrossRef] [PubMed]
  8. Unger, M. Capillary electrophoresis of natural products: current applications and recent advances. Planta Med. 2009, 75, 735–745. [Google Scholar] [CrossRef] [PubMed]
  9. Welch, C.; Wu, Q.; Simon, J. Recent advances in anthocyanin analysis and characterization. Curr. Anal. Chem. 2008, 4, 75–101. [Google Scholar] [CrossRef] [PubMed]
  10. Mazza, G.; Cacae, J.; Kay, C. Methods of analysis for anthocyanins in plant and biological fluids. J. AOAC Int. 2004, 87, 129–145. [Google Scholar] [PubMed]
  11. Kong, J.; Chia, L.; Goh, N.; Chia, T.; Brouillard, R. Analysis and biological activities of anthocyanins. Phytochemistry 2003, 64, 923–933. [Google Scholar] [CrossRef]
  12. Fernandez, O.; Martinez, O.; Hernandez, Z.; Guadalupe, Z.; Ayestaran, B. Effect of the presence of lysated lees on polysaccharides, color and main phenolic compounds of red wine during barrel ageing. Food Res. Int. 2011, 44, 84–91. [Google Scholar] [CrossRef]
  13. Mazauric, J.; Salmon, J. Interactions between yeast lees and wine polyphenols during simulation of wine aging. II. Analysis of desorbed polyphenol compounds from yeast lees. J. Agric. Food Chem. 2006, 54, 3876–3881. [Google Scholar] [CrossRef] [PubMed]
  14. Sanchez-Moreno, C.; Cao, G.; Ou, B.; Prior, R. Anthocyanin and proanthocyanidin content in selected white and red wines. Oxygen radical absorbance capacity comparison with nontraditional wines obtained from highbush blueberry. J. Agric. Food Chem. 2003, 51, 4889–4896. [Google Scholar] [CrossRef] [PubMed]
  15. Lapornik, B.; Prosek, M.; Wondra, A. Comparison of extracts prepared from plant by-products using different solvents and extraction time. J. Food Eng. 2005, 7, 214–222. [Google Scholar] [CrossRef]
  16. Revilla, E.; Ryan, J.; Ortega, G. Comparison of several procedures used for the extraction of anthocyanins from red grapes. J. Agric. Food Chem. 1998, 46, 4592–4597. [Google Scholar] [CrossRef]
  17. Pascual-Teresa, S.; Santos, B.C.; Rivas-Gonzalo, C. LC-MS analysis of anthocyanins from purple corn cob. J. Sci. Food Agric. 2002, 82, 1003–1006. [Google Scholar] [CrossRef]
  18. Arribas, M.; Gomez, C.; Alvarez, P. Evolution of red wine anthocyanins during malolactic fermentation, postfermentative treatments and ageing with lees. Food Chem. 2008, 109, 149–158. [Google Scholar] [CrossRef] [PubMed]
  19. Corrales, M.; Garcia, A.; Butz, P.; Tauscher, B. Extraction of anthocyanins from grape skins assisted by high hydrostatic pressure. J. Food Eng. 2009, 90, 415–421. [Google Scholar] [CrossRef]
  20. Ju, Z.; Howard, L. Effects of solvent and temperature on pressurized liquid extraction of anthocyanins and total phenolics from dried red grape skin. J. Agric. Food Chem. 2003, 51, 5207–5213. [Google Scholar] [CrossRef] [PubMed]
  21. Corrales, M.; Toepfl, S.; Butz, P.; Knorr, D.; Tauscher, B. Extraction of anthocyanins from grape by-products assisted by ultrasonics, high hydrostatic pressure or pulsed electric fields: A comparison. Innov. Food Sci. Emerg. Technol. 2008, 9, 85–91. [Google Scholar] [CrossRef]
  22. Revilla, I.; Perez, M.S.; Gonzalez, S.M.; Beltran, S. Identification of anthocyanin derivatives in grape skin extracts and red wines by liquid chromatography with diode array and mass spectrometric detection. J. Chromatogr. A 1999, 847, 83–90. [Google Scholar] [CrossRef]
  23. Hartmanova, L.; Ranc, V.; Papouskova, B.; Bednar, P.; Havlicek, V.; Lemr, K. Fast profiling of anthocyanins in wine by desorption nano-electrospray ionization mass spectrometry. J. Chromatogr. A 2010, 1217, 4223–4228. [Google Scholar] [CrossRef] [PubMed]
  24. Li, Z.; Pan, Q.; Cui, X.; Duan, C. Optimization on anthocyanins extraction from wine grape skins using orthogonal test design. Food Sci. Biotechnol. 2010, 19, 1047–1053. [Google Scholar] [CrossRef]
  25. Liang, Z.; Wu, B.; Fan, P.; Yang, C.; Duan, W.; Zheng, X.; Liu, C.; Li, S. Anthocyanin composition and content in grape berry skin in Vitis germplasm. Food Chem. 2008, 111, 837–844. [Google Scholar] [CrossRef]
  26. Ling, Y.; Ren, C.; Mallery, S.; Ugalde, C.; Pei, P.; Saradhi, U.; Stoner, G.; Chan, K.; Liu, Z. A rapid and sensitive LC-MS/MS method for quantification of four anthocyanins and its application in a clinical pharmacology study of a bioadhesive black raspberry gel. J. Chromatogr. B 2009, 877, 4027–4034. [Google Scholar] [CrossRef] [PubMed]
  27. Duymus, G.; Goger, F.; Baser, C. In vitro antioxidant properties and anthocyanin compositions of elderberry extracts. Food Chem. 2014, 155, 112–119. [Google Scholar] [CrossRef] [PubMed]
  28. Cerezo, A.; Cuevas, E.; Winterhalter, P.; Garcia, M.; Troncoso, A. Anthocyanin composition in Cabernet Sauvignon red wine vinegar obtained by submerged acetification. Food Res. Int. 2010, 43, 1577–1584. [Google Scholar] [CrossRef]
  29. Papadoyannis, I.; Samanidou, V.; Antoniou, C. Gradient RP-HPLC Determination of Free Phenolic Acids in Wines and Wine Vinegar Samples after SPE, with Photodiode Array Identification. J. Liq. Chromatogr. Relat. Tech. 2001, 24, 2161–2176. [Google Scholar]
  30. Themelis, D.; Tzanavaras, P.; Anthemidis, A.; Stratis, J. Direct, selective flow injection spectrophotometric determination of calcium in wines using methylthymol blue and an on-line cascade dilution system. Anal. Chim. Acta 1999, 402, 259–266. [Google Scholar] [CrossRef]
  31. Tzanavaras, P.D.; Thiakouli, E.; Themelis, D. Hybrid sequential injection–flow injection manifold for the spectrophotometric determination of total sulfite in wines using o-phthalaldehyde and gas-diffusion. Talanta 2009, 77, 1614–1619. [Google Scholar] [CrossRef] [PubMed]
  32. Gomez-Ariza, L.; Garcia-Barrera, T.; Lorenzo, F. Dynamic headspace coupled to perevaporation for the analysis of anisoles in wine by gas chromatography-ion-trap tandem mass spectrometry. J. Chromatogr. A 2004, 1056, 243–247. [Google Scholar] [CrossRef] [PubMed]
  33. Gomez-Ariza, L.; Garcia-Barrera, T.; Lorenzo, F.; Beltran, R. Use of multiple headspace solid-phase microextraction and pervaporation for the determination of off-flavours in wine. J. Chromatogr. A 2006, 1112, 133–140. [Google Scholar] [CrossRef] [PubMed]
  34. Metivier, R.; Francis, F.; Clydesdale, F. Solvent extraction of anthocyanins from wine pomace. J. Food Sci. 1980, 45, 1099–1100. [Google Scholar] [CrossRef]
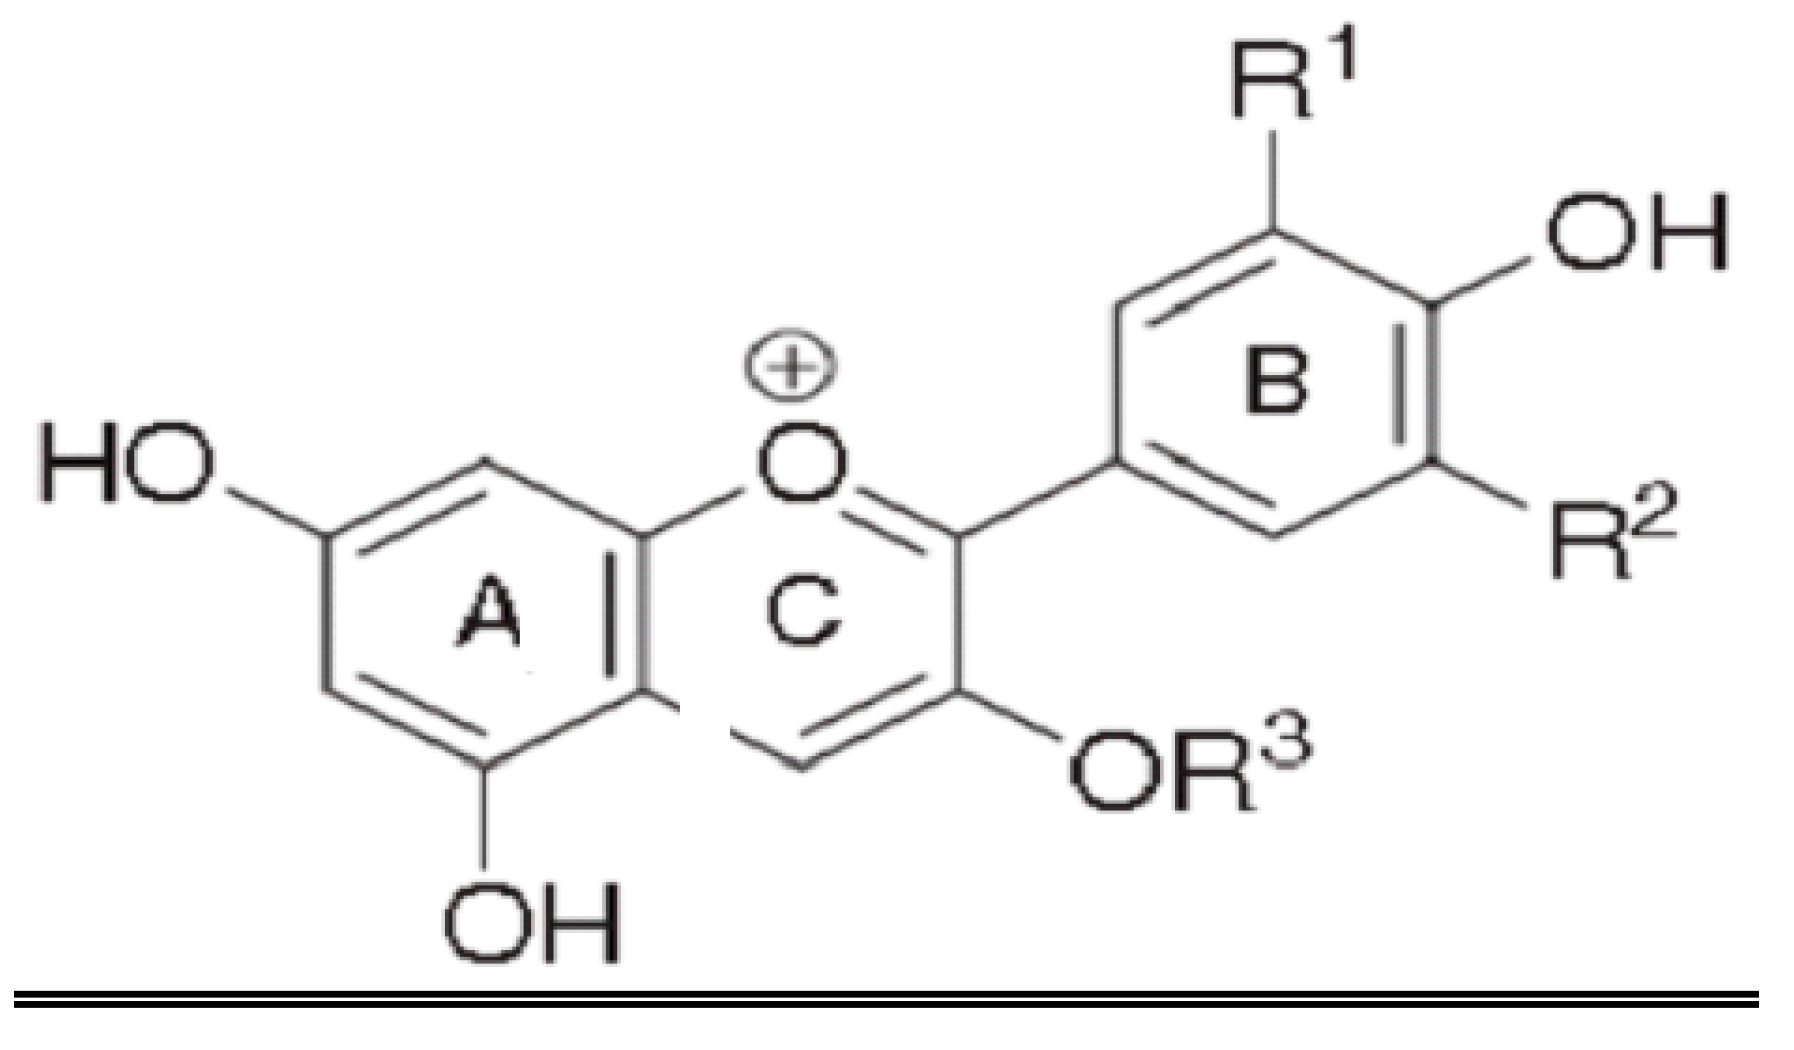
Figure 1. Structure of anthocyanins R3 = sugar, and anthocyanidins R3 = H; R1 = OH / OCH3 / H; R2 = OH / OCH3 / H; R3 = H/Glc (Glycine).
Separations 03 00018 g001
Figure 2. Extraction solutions tested for the extraction of anthocyanins, methanol/water 50/50 (1); methanol (2); methanol/acetic acid 99.5/0.5 (3); methanol/acetic acid 95/5 (4); methanol/formic acid 95/5 (5); methanol/phosphoric acid 98/2 (6); methanol/phosphoric acid 95/5 (7); ethanol/water 50/50 (8); ethanol (9); ethanol/acetic acid 99.5/0.5 (10); ethanol/acetic acid 95/5 (11); ethanol/formic acid 95/5 (12); ethanol/phosphoric acid 98/2 (13); ethanol/phosphoric acid 95/5 (14). The results are expressed as total monomeric anthocyanin content (TAC) per 100 g of dried wastes. * Total Anthocyanin Content; ** Average of n = 5 measurements and ± one standard deviation (SD).
Separations 03 00018 g002
Figure 3. HPLC-PDA * chromatograms obtained using (a) acetonitrile as Solvent B and (b) methanol as Solvent B (See Table 2). Peaks 1 and 2 are delphinidin-3-O-glucoside and cyanidin-3-O-glucoside, respectively. * High-performance liquid chromatography-Photodiode array detector.
Separations 03 00018 g003
Figure 4. HPLC-PDA chromatographic profile of the anthocyanins determined in Syrah grape pomace sample. Peak numbers correspond to those compounds mentioned in Table 8.
Separations 03 00018 g004
Figure 5. LC-MS chromatogram of selected anthocyanins, determined in Syrah grape pomace sample, at SIM mode for characteristics m/z (M+). The numbers above the peaks corresponds to anthocyanins as listed in Table 8. The five-digit numbers at the upper left corner of the figure correspond to the characteristic m/z (M+) of detected compounds, and the number in the parenthesis indicates a multiplying factor of each peak in the chromatogram.
Separations 03 00018 g005
Table 1. More common anthocyanins and anthocyanidins.
NameAbrev.R1R2R3
DelphinidinDpOHOHH
Delphinidin-3-O-glucosideDp-3-O-gluOHOHGlc
PetunidinPtOHOCH3H
Petunidin-3-O-glucosidePt-3-O-gluOHOCH3Glc
MalvidinMvOCH3OCH3H
Malvidin-3-O-glucosideMv-3-O-gluOCH3OCH3Glc
CyanidinCnOHHH
Cyanidin-3-O-glucosideCn-3-O-gluOHHGlc
PeonidinPnOCH3HH
Peonidin-3-O-glucosidePn-3-O-gluOCH3HGlc
PelargonidinPgHHH
Pelargonidin-3-O-glucosidePg-3-O-gluHHGlc
Table 2. Operating conditions of liquid chromatography-mass spectrometry (LC-PDA-MS) instrument. ESI: electrospray ionization.
ParameterValue
Ionization processESI
Ionization modePositive
Secondary electron multiplier detector voltage1.8 kV
Capillary voltage4.0 kV
Mass scanning range200 m/z–1200 m/z
Solvent A (volume/volume)Water/Formic Acid (99/1)
Solvent B (volume/volume)Acetonitrile/Formic Acid (99/1)
Mobile phase flow-rate0.5 mL/min
Injection volume20 μL
Chromatographic ColumnDionex, RP-C18, 150 mm × 4.6 mm × 5 μm
Elution program typeGradient
Table 3. Dry sample mass–to–solvent volume ratio in correlation with total anthocyanins concentration per 100 g of sample.
Dry Matter Mass (g)Solvent Volume (mL)Dry Matter Mass (g)/Solvent Volume (mL)mg TAC */100 g sample **
0.55.01/1099.9 ± 10.1
0.510.01/20117 ± 10.9
0.515.01/30116 ± 10.8
0.520.01/40119 ± 11.3
* Total Anthocyanin Content; ** All results are mean values of n = 5 measurements and uncertainty is expressed as the standard deviation.
Table 4. Water bath extraction duration, in correlation with anthocyanins concentration to supernatant.
Duration Time (h) in Water Bathmg TAC */100 g Sample **
193.4 ± 9.41
2129 ± 11.2
3128 ± 11.1
4130 ± 11.6
* Total Anthocyanin Content; ** All results are mean values of n = 5 measurements and uncertainty is expressed as the standard deviation.
Table 5. Consecutive extraction rounds in correlation with anthocyanins concentration to supernatant.
Successive Extraction Numbermg TAC */100 g Sample **
1130 ± 14
227.6 ± 3.3
32.92 ± 0.33
40.08 ± 0.02
* Total Anthocyanin Content; ** All results are mean values of n = 5 measurements and uncertainty is expressed as the standard deviation.
Table 6. Analytical characteristics of the proposed LC-MS method with ESI. RSD: Relative Standard Deviation.
Slope, S (Peak Area/(mg·L−1))Correlation Coefficient, rInstrumental RSD *LOD (ng·mL−1)Dynamic Range (mg·L−1)
1.34 × 1050.99965.8%9.00.03–10.0
* Values were calculated from n = 5 repetitive measurements of the standard.
Table 7. Anthocyanin groups concentrations and ratio between the two analyzed samples. DW: Dried Wastes.
SamplesConcentration in Wine Byproducts (mg 1000 g−1 of DW) *Concentration in Wine (Syrah) (mg·L−1 of Wine) *Ratio Between Samples
Anthocyanins Group
Simple glucosides4367457.79.54
Acetyl glucosides5224421.312.40
Cinnamoyl glucosides2779152.718.20
Pyroanthocyanins73.312.65.82
Total anthocyanins12,443.31044.311.92
* Values were calculated from n = 5 repetitive measurements of the standard.
Table 8. Anthocyanin compounds identified by LC-PDA-MS in the analyzed samples. tr: retention time.
Peak No.Identitytr (min)m/z (M+)Concentration (mg 1000 g−1 of DW) *Concentration (mg·L−1 of Wine) *
Simple glucosides
1Delphinidin-3-O-glucoside7.144654.0 ± 0.29.6 ± 0.7
2Cyanidin-3-O-glucoside7.95449-2.9 ± 0.1
3Petunidin-3-O-glucoside8.2547989.0 ± 5.776.8 ± 5.0
4Peonidin-3-O-glucoside9.0646351.7 ± 3.726.4 ± 1.7
5Malvidin-3-O-glucoside9.274934222 ± 178342.0 ± 14.0
Acetyl glucosides
6Dp-gls-pyruvate derivative7.53533-6.0 ± 0.5
7Pt-gls-pyruvate derivative8.675471.1 ± 0.12.4 ± 0.1
8Dp-3-(6″-acetylglucoside)9.7250724.9 ± 1.57.6 ± 0.5
9Mv-3-gls-pyruvate (Vitisin A)9.8456154.0 ± 3.210.7 ± 0.9
10Vitisin B (Mv derivative)10.205171.0 ± 0.18.5 ± 0.7
11Cn-3-(6″-acetylglucoside)10.47491332.1 ± 12.53.3 ± 0.2
12Pt-3-(6″-acetylglucoside)10.92521423.3 ± 27.279.2 ± 5.0
13Pn-3-(6″-acetylglucoside)12.485056.4 ± 0.529.9 ± 1.9
14Mv-3-(6″-acetylglucoside)12.575354381 ± 306273.7 ± 16.1
Cinnamoyl glucosides
15Dp-3-(6″-p-coumaroylglucoside)12.936117.8 ± 0.85.7 ± 0.4
16Mv-3-(6″-caffeoylglucoside)14.0765595.3 ± 6.22.2 ± 0.2
17Cn-3-(6″-p-coumaroylglucoside)14.675951.3 ± 0.13.4 ± 0.3
18Pt-3-(6″-p-coumaroylglucoside)14.9162555.7 ± 3.115.7 ± 0.9
19Pn-3-(6″-p-coumaroylglucoside)17.0160984.7 ± 6.127.5 ± 1.7
20Mv-3-(6″-p-coumaroylglucoside)17.166392534 ± 14298.3 ± 6.9
Pyroanthocyanins
21Mv-3-(6″-acetylglucoside) pyruvate10.6860310.0 ± 0.87.6 ± 0.5
22Mv-3-glucoside-ethyl-catechin11.198098.5 ± 0.62.1 ± 0.2
23Mv-3-(6″-acetylglucoside)-4-vinylphenol21.6665154.9 ± 4.02.9 ± 0.2
Total (g/kg) 12.441.04
* All results are mean values of n = 5 measurements and uncertainty is expressed as standard deviation.

