Review

Exploring Gradients in Electrophoretic Separation and Preconcentration on Miniaturized Devices

School of Molecular Sciences, Arizona State University, Tempe, AZ 85274, USA
*
Author to whom correspondence should be addressed.
Separations 2016, 3(2), 12; https://doi.org/10.3390/separations3020012
Submission received: 14 December 2015 / Revised: 22 February 2016 / Accepted: 2 March 2016 / Published: 1 April 2016
(This article belongs to the Special Issue Electrophoretic Analyses in Capillaries and Microfluidic Devices)

Abstract

:
Over the last two decades, miniaturization, integration, and automation have made microfluidic systems popular. Core to advances in microfluidics are numerous electrophoretic separation and preconcentration strategies, some finding their origins on bench-top systems. Among them, gradient-based strategies are especially effective in addressing sensitivity challenges. This review introduces several gradient-based techniques according to a broad definition, including conductivity, field, and concentration, organized by the method of gradient generation. Each technique is introduced and described, and recent seminal advances explored.

Graphical Abstract

1. Introduction

Superior properties compared to bench-top devices have earned microfluidic devices significant popularity. Advantages include miniaturized operation systems, reduced reagent consumption, minimal waste, and short time per operation. Examples of these features involve separation and preconcentration methods, such as gravitational force [1], electrophoretic force [2,3,4,5,6], magnetic force [7,8], acoustic waves [9,10,11], and optofluidics [12,13,14].
Electrophoretic-based separation and preconcentration schemes were initially drawn from capillary electrophoretic methods. Since then, electrophoresis has exerted a powerful influence and has led to a variety of derivations and branches, including field-amplified sample stacking [15,16,17,18,19,20,21], isotachophoresis [22,23,24,25,26,27,28,29,30], free flow electrophoresis [31,32,33,34,35] and gradient focusing [36,37,38,39,40,41,42]. Among them, gradient techniques are of special interest. In addition to creating separations, they can function in sample preparation and/or preconcentration roles to increase sensitivity of microdevices.
This review focuses on strategies that include gradients which improve performance. The term gradient, as used here, has a broad definition and includes conductivity, concentration or velocity profile. Articles are sourced from recent years and the review does not attempt to be comprehensive or exhaustive, but instead, provide a new perspective on recent developments. Several subjects are excluded for clarity and space, including dielectrophoresis, field-flow electrophoresis, and droplet-based microfluidics, even though these are all recognized as using gradients.

2. Conductivity Gradient

One strategy to create a gradient is to induce a variation in conductivity. This can be trivially understood by examining equation E = IA (or simply, Ohm’s law, where E is the electric field, I the current, σ conductivity, and A the cross-sectional area); the conductivity difference directly influences the local electric field, thus creating the gradient.

2.1. Field-Amplified Sample Stacking/Field-Amplified Sample Injection (FASS/FASI)

Field-amplified sample stacking/sample injection has long been considered. It is one of the most commonly used, straightforward modes of electrophoretic separation. The stacking effect can be achieved through a conductivity difference between samples and background electrolyte (usually the conductivity of background electrolyte is 10 times higher than that of the sample). When the voltage is applied, the electric field strength on the sample is higher compared to the background electrolyte, due to the lower conductivity. As a result, sample starts to stack in the boundary—the nominal location of the gradient (Figure 1).
The dynamics of this technique have been fully investigated by Bharadwaj et al. [16]. In that work, situations with and without electroosmotic flow (EOF) were studied. By building up the governing equations regarding convention, migration and diffusion, as well as considering the boundary conditions, the study provided a platform for a better understanding of FASS. In later work, they calculated that the highest concentration enhancement achieved was 1100-fold [43].
The technique is not typically used alone, as it serves as an efficient sample introduction technique. It couples with a variety of other analytical methods for detection and identification on miniaturized scales, including ICP-MS [44], ELISA [45], MEKC [46], and amperometry [47].

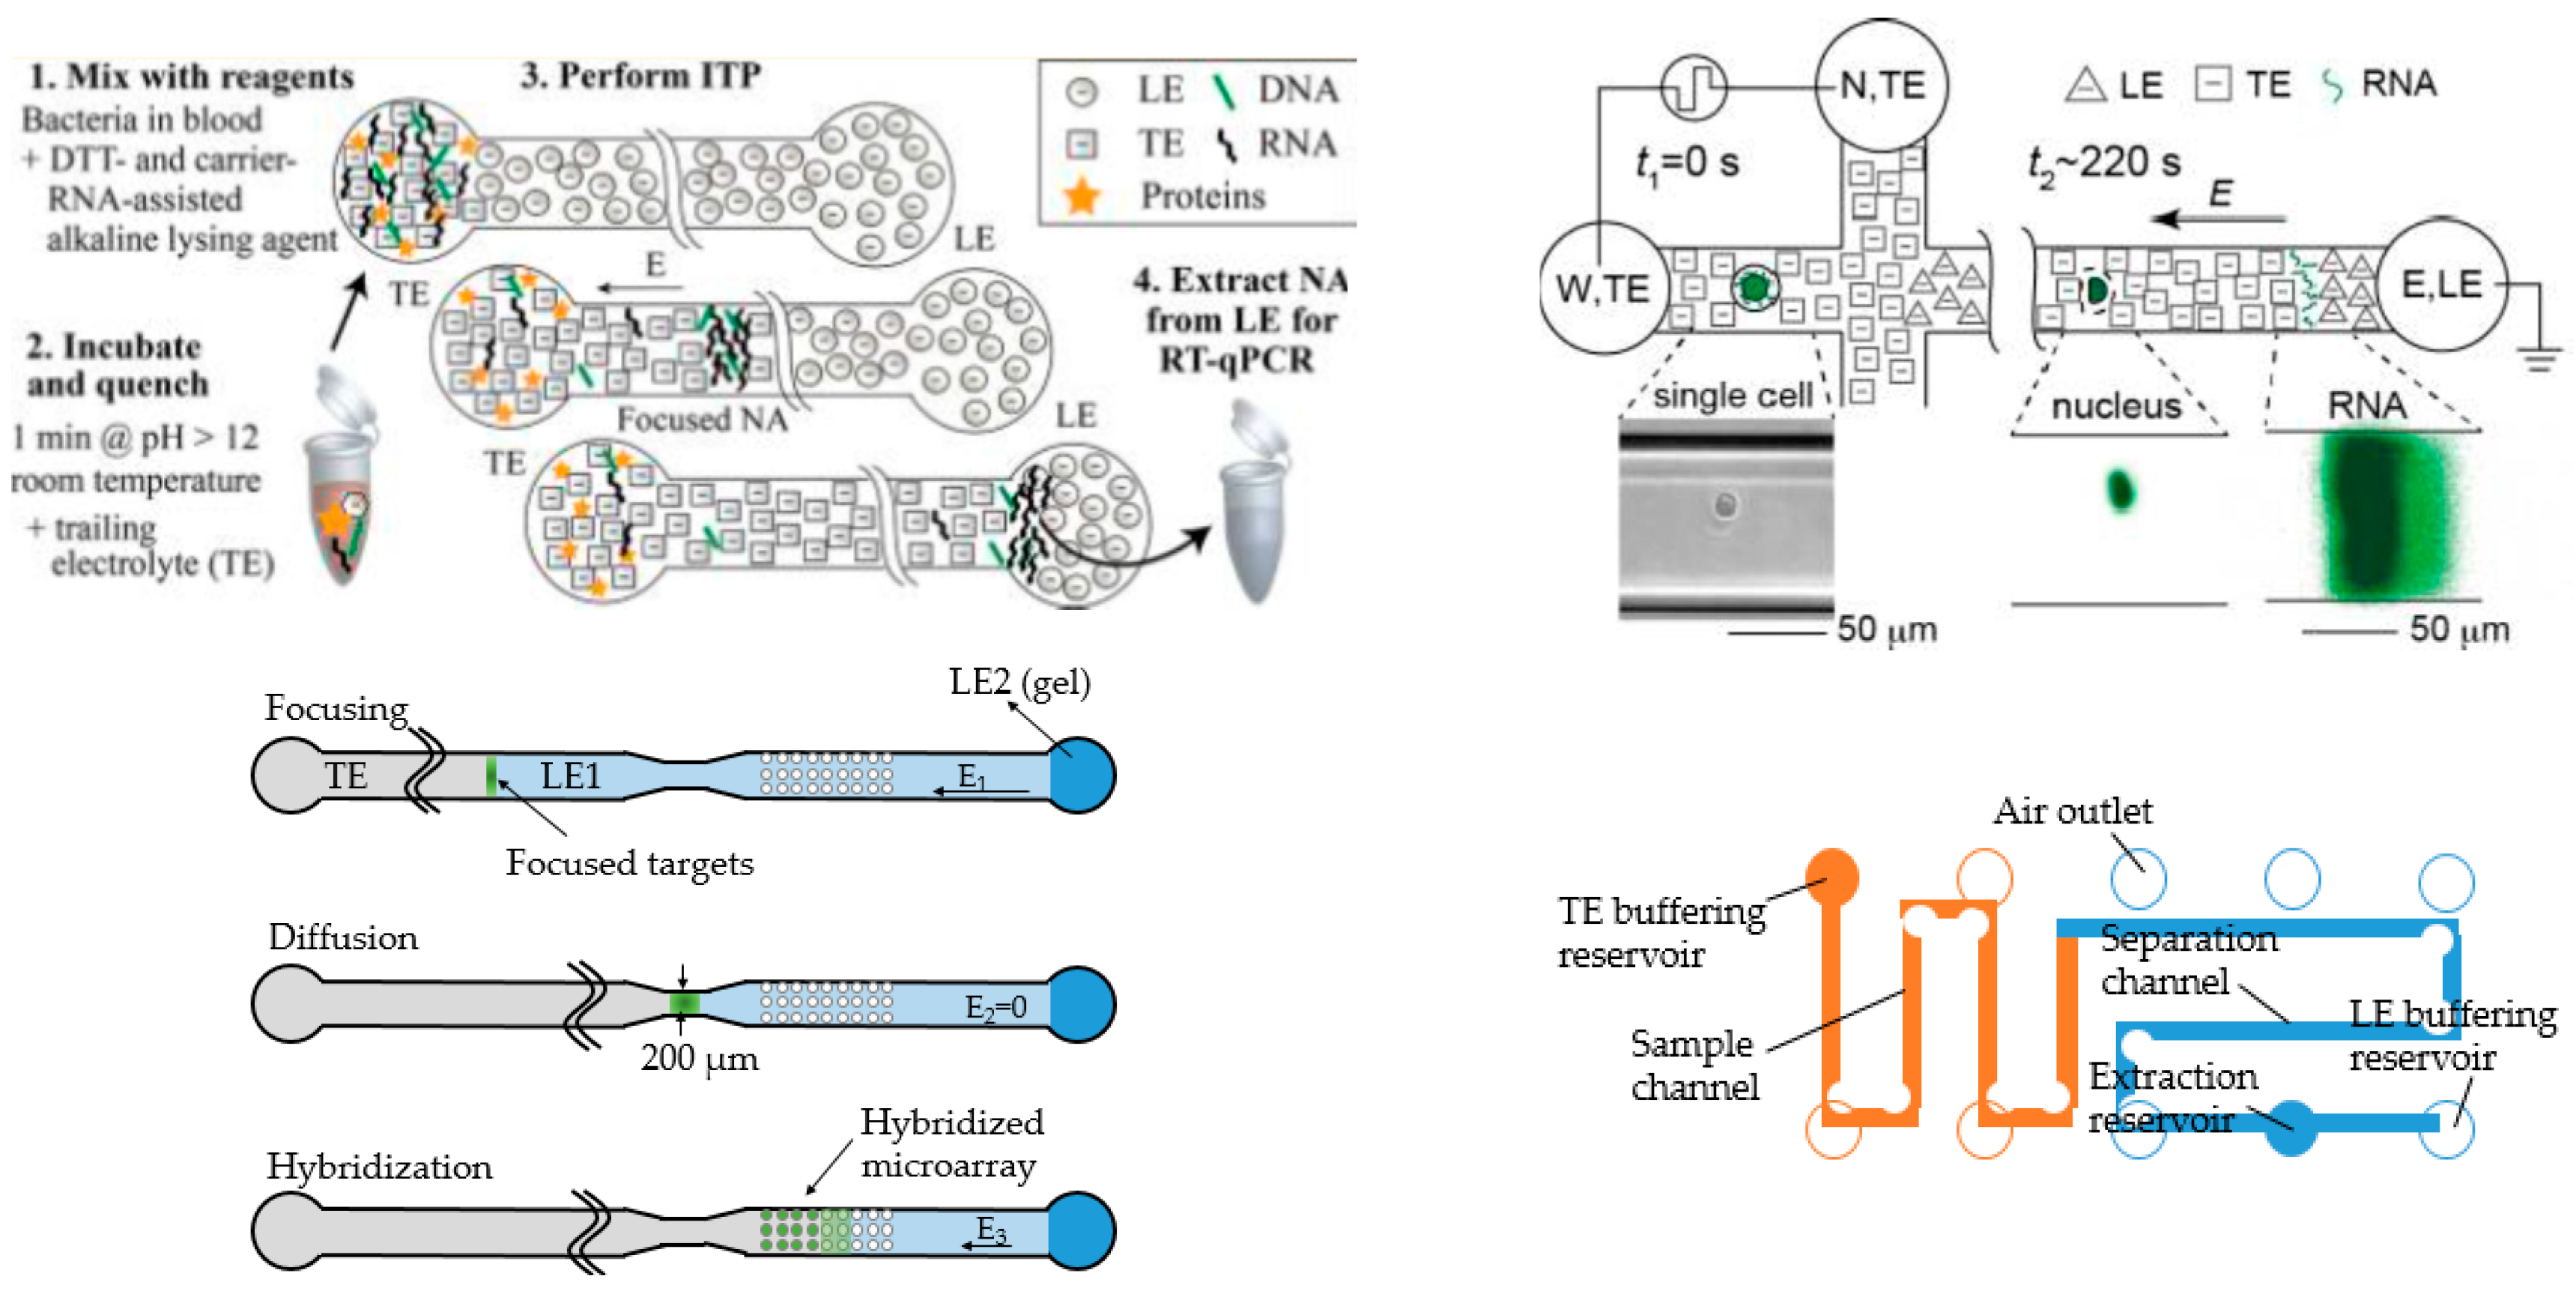
2.2. Isotachophoresis (ITP)

Isotachophoresis techniques have been used since the 1970s and, similar to field-amplified sample stacking method, ITP also uses conductivity difference to form gradient. The major difference is that amplified sample stacking relies on only one background electrolyte, while ITP uses two background electrolytes with different mobilities. The higher mobility is the leading electrolyte and the lower mobility the terminating electrolyte. The mobility of all the components of the sample must be between that of leading electrolyte and terminating electrolyte. Given the similarities between FASS and ITP, a comparison can be tabulated (Table 1).
Bocek et al. have contributed a great deal to this area. They have published reviews every two years describing new progress in the field of capillary isotachophoresis [23,26,30]. They also collaborated with Ivory’s group and reported a review on microfluidic isotachophoresis [27]. Santiago’s group has contributed a review on the development of ITP (in addition to his considerable original contributions, see below) [29].
This technique can be roughly divided into two categories, regular (monodirectional) and bidirectional. Here, monodirectional ITP refers to those isotachophoretic methods that only apply to enrich cations or anions. Bidirectional ITP aims to concentrate both cations and anions at the same time. Monodirectional ITP has been highly developed and most recent works have focused on practical applications of biological samples. Below are some seminal examples among all the elegant applications.
Ivory’s group selected biomarker cardiac troponin I (cTnl) as a model study. cTnl is produced in myocardium and is related to heart disease. The phosphorylated level of cTnl can help to determine the risk and best treatment option. They started this work with a poly(methylmethacrylate) (PMMA) microdevice with a 50× reduction in the cross-sectional area (Figure 2, top) [52]. The reduction in width or depth can give rise to a concentration increase. With this device, over 10,000-fold concentration of cTnI and R-phycoerythrin was achieved, and, with modifications, optimized their device to a 100× reduction (Figure 2, bottom) [53]. With that device, the sample with labeled cTnI in depleted human serum was examined. Cationic ITP in a straight channel was investigated for a sample with more components in solution to mimic the situation even closer to human serum, such as NaCl, urea, and triton X-100 [54]. However, the results did not give as high an efficiency as they previously demonstrated. They proposed it was mainly due to the surface adsorption and some leftover bubbles from sample-loading procedures. To further explore and confirm their hypothesis, they conducted the numerical simulation. Future directions include adapting this strategy to immunoassay for distinguishing of phosphorylated and unphosphorylated cTnI.
Another excellent example is from Santiago and coworkers showing preconcentration of biomolecules, especially DNA and RNA [29]. In 2012, they reported a miniaturized system for extracting RNA from bacteria suspended in blood and avoided some contamination and degradation issues, achieving high sensitivity, up to 100,000 times higher than some popular schemes [24]. The design was fairly simple, with a single straight channel and two ports (Figure 3, top left). Terminating electrolytes (TE) were injected into the left port, and the leading electrolytes (LE) into the right. The samples were introduced directly into the left port after incubation. After separation they could be easily coupled to PCR and other secondary detection methods. In that work, they also validated their results with qPCR. Later, they published a modified design to simultaneously separate and concentrate RNA and DNA from single cells [55]. The design was implemented with branched channels, connecting to vacuum for sample loading (Figure 3, top right). Coupling online pretreatment steps has also been accomplished. The whole process, including lysis, extraction and fractionation could be done in less than five minutes [56]. A similar design has also been applied to co-focus DNA and beads, which could potentially increase the DNA hybridization rate [57]. The entire process took less than 20 min, a large reduction in the time required compared to conventional methods (20 h) without significant concentration loss. In another study, a novel ITP device was designed with two identically shaped simple compartments connected with a thin channel (Figure 3, bottom left) [58]. The latter compartment contained some DNA probes. The sample underwent preconcentration via ITP, diffusion through the thin channel and entered the second compartment for hybridization. In a third design, both PMMA and cyclin olefin copolymer (COC) chips were fabricated to conduct ITP separation of DNA samples (Figure 4, bottom right) [59]. The design had a long turn channel and high aspect-ratio, which could potentially reduce dispersion and heat dissipation. A special structure for loading was incorporated in this device, which enabled injection of 25 μL samples into the device without waste. This method proved to have high recovery efficiency, well suited for precious and limited volume samples.
Santiago’s group led the development of bidirectional ITP as well. In their work, they achieved bidirectional ITP in a straight channel through the application of shock wave [60,61]. Different from monodirectional ITP, in their applications, four electrolytes were used, namely cationic leading electrolyte, cationic terminating electrolyte, anionic leading electrolyte and anionic terminating electrolyte. Using anionic analytes as an example, when voltage was applied, they formed distinct bands between leading electrolyte and terminating electrolyte, migrating in one direction. At the same time, the cationic electrolytes also underwent isotachophoresis, migrating in the opposite direction. When these two shock waves met, there would be a replacement of ions, so the conditions would dramatically change. In one of these applications, the ion-exchanging process eliminated the isotachophoresis condition. Then, it was switched to electrophoretic separation automatically without any treatment, and the non-focusing tracer method was used to visualize experimental results [60]. In another case, they successfully generated the LE concentration cascade to further increase the sensitivity of the ITP technique [61]. Their schemes could also achieve bidirectional ITP for protein and DNA purifications [62]. This bidirectional device was with one single input in the middle and two output reservoirs connected by two “C”-shaped channels for ITP separation of proteins and nucleic acids simultaneously. One channel conducted cationic ITP for enriching positively charged proteins; the other channel performed anionic ITP for negatively charged nucleic acids from human blood serum. This bidirectional ITP method was demonstrated to have high recovery efficiency and compatibility with PCR and other extraction methods.
Ross and coworkers have contributed to gradient elution ITP (GEITP) [28]. Compared to conventional ITP, it includes applied pressure-driven flow as a counterforce to the electrophoretic movement, generating precise position control and avoiding introduction of contaminates. In their research, the capillary-based GEITP device was used to extract DNA from crude samples without significant pretreatment.
Free flow electrophoresis is another direction of research aimed at the improvement of current capillary electrophoresis [49]. Unlike most of the techniques addressed here, the field is applied perpendicularly to the velocity direction, making the deflection of the species unique to their electrophoretic mobility. This technique is quite flexible and is hybridized with other electrophoretic separation techniques, such as free flow isotachophoresis (FFITP). Prest and coworkers first miniaturized the FFITP device and applied this to separation of bacteria. The design consisted of a rectangular chamber with nine inlets and nine outlets on short sides of the chamber as well as electrodes on long sides. The leading electrolytes were injected into the chamber from the left three inlets at a higher rate, while the terminating electrolytes from the right three inlets had a slower flow rate as did samples from the middle three inlets. Once the chambers were filled with mixture of leading and terminating electrolytes, the separation started with the application of a constant current. While dealing with bacteria samples, they visualized the cells by mixing the samples with a dye solution. Prior to bacteria separation, they first tried this device on dyes. The results were quite promising.
Electrokinetic supercharging (EKS) consists of field-amplified sample injection and isotachophoresis. Hirokawa and his coworkers designed a microdevice with three ports and a long curved channel for floating electrokinetic supercharging to separate, concentrate and analyze DNA samples [50]. The three ports were electronically floated to differ from conventional EKS and the long, turned channel was used for separation. Parameters and geometry were optimized for reducing band-broadening effect.
Fung and coworkers realized a two-dimensional transient scheme (t-ITP/CZE) for the detection of clinical urinary proteins [51]. Four urinary samples were successfully separated through a 2D t-ITP/CZE microdevice. The transient step was mainly used for desalting and preconcentration, whereas CZE was used for separation. The microdevice generated results in a short time (less than 8 min), and showed high enrichment and low limit of detection compared to standard clinical techniques.
Isotachophoresis can be performed in other media, a paper-based microdevice serving as a prime example. In Bercovici’s work, 1000-fold concentration enhancement was demonstrated with porous media [63]. The device was easy to fabricate without complicated enclosure operations. The key point of designing this device is to minimize Joule heating and evaporation. This was achieved by printing shallow channels for a high heat dissipation efficiency. One major drawback is the dispersion effect. Another example was from Posner and coworkers [64]: a simple paper-based device was used to perform ITP concentration of a fluorescent tracer. The results showed good agreement with numerical simulations. Moreover, the device can be powered by a battery, showing the ability to be a portable device.
Separations based on ITP have been performed on commercialized all-in-one platform microdevices. Breadmore and coworkers explored some customized features of this instrument [65,66,67]. To evaluate the analytical potential of the system, the method was used for the quantitative analysis of benzoate in soft drinks. The results were validated with a CZE method with generally good agreement [66]. The same strategy on lactate in serum did not produce the same results, especially compared to commercial chips. In response, they designed a chip for ITP separation [67]. With this customized chip, they performed lactate concentration determination in three different serum samples quantified by CZE and by ITP using a commercial system. Both methods generated comparable results, demonstrating the platform for a diverse range of applications.

2.3. Conductivity Gradient Focusing

The early application of conductivity gradient for protein concentration came from Ivory’s group [68]. They used a chamber that was divided into compartments by a dialysis membrane (Figure 4). Buffers of different conductivity were placed in each section. The species with low molecular weight could pass through the membrane, creating the conductivity gradient when the voltage was applied. A convective force was employed to balance the electrophoretic velocity of proteins. The basic principles of this technique combining electric field, fluid field and mass transportation, were described as well.
Inglis and coworkers have contributed to the development of this technique with a device that has a tapered channel, filled with low-conductivity buffer on one side and high on the other side, creating gradient along the channel [69]. Once the electric field is applied, both electrophoresis and electroosmosis are induced. In the low-conductivity zone, the electrophoretic velocity dominates, while at the high conductivity zone, the electroosmotic flow dominates, thus focusing different species at distinct locations based on their individual mobilities. Separation and concentration of two proteins were performed in this device, achieving 1000-fold concentration enhancement within 20 min. They also investigated the effects of altering the electric field [70]. Four different geometries, including rectangular channel and three tapered channels with different length ratios were studied. Based on the numerical simulations and experimental results, the tapered channel with the highest length ratio had the best performance. They proposed that in the rectangular channel, focusing took place only when the flow direction was opposite to the conductivity gradient, since the electric field increased at the low-conductivity end. When flow direction and conductivity gradient were the same, the trapping was unstable. While in the tapered channel, the electric field was higher at both ends and, with the channel width reduced, the field magnitude increased. A weakness is that, in the numerical simulation, it was assumed the electroosmotic flow was constant along the channel. In reality, the electroosmotic flow is non-uniform due to gradients in electric field and local electroosmotic mobility [71]. The non-uniformity of the electroosmotic flow changed the proposed mechanism and the varying electric field and electric double layer thickness formed a counter electroosmotic flow at the low-conductivity zone end of the device, increasing the trapping efficiency of proteins. With a new simulation, they re-examined the four geometries and the numerical results matched well with experimental results.

3. Counterflow Electric Field Gradient

When the electric field gradient is combined with another force to perform focusing in a single buffer, the strategy is commonly referred to simply as counterflow electric field gradient (Figure 5). In most of the cases, one of the velocities holds constant while the other varies, and the species focuses at the place where two velocities sum to zero. A brief comparison of some common counterflow gradient techniques is summarized in the Table 2 (at the end of this sub-section).

3.1. Electric Field Gradient Focusing/Dynamic Field Gradient Focusing (EFGF/DFGF)

This technique employs an electric field and a pressure-induced flow. Ivory’s group has made significant contributions to the development of EFGF. As early as 1996, they published an article introducing the strategy, where the electrophoretic force was countered by a convective force [36,72]. The apparatus consisted of a chamber with a varying cross-sectional area along the axis, inducing the electric field gradient. The flow is constant in the chamber. The chamber was split into two parts via a dialysis membrane, which allowed electric current to pass but not the convective flow. With this setup, they examined the focusing and separation of hemoglobin.
They also investigated a computer controlled array of electrodes to create a precise electric field gradient [73]. They termed this new branch dynamic field gradient focusing. From 2008 to 2010, they reported a variety of applications using this technique in preparative-scale apparatus [73,74,75]. The applications were all on preparative scale and some were considered to be cumbersome and complicated.
Lee and colleagues contributed to analytical EFGF devices. They first proposed a device made of ionically conductive acrylic copolymer, which allowed ions to permeate but not proteins. The horn shape of the device enabled the creation of an electric field gradient [76,77]. They successfully concentrated fluorescent protein 10,000-fold and demonstrated the separation of a mixture of proteins. The peak capacity and resolution of this device was relatively low and the protein adsorption was a challenge. To ameliorate these problems, they used poly(ethylene glycol) (PEG)-functionalized acrylic plastic, which decreased protein adsorption. The PEG-functionalized monolith was also used to reduce dispersion (Figure 6, left) [78]. The packed or monolithic column could disrupt the laminar flow profile (compared to an open channel), which flattened the parabolic shape of laminar flow, thus increasing resolution. They optimized the device via switching to another buffer solution, which could produce a more linear electric field [79]. The results from this modified device showed narrower peak width and smaller standard deviation. With the optimized device, they investigated the ability to create bilinear electric field gradient focusing, which would enhance the resolving power and the peak capacity simultaneously [80].
In 2012, Breadmore and his coworkers developed a new strategy to generate electric field gradient by using a variable-width polyaniline (PANI) electrode (Figure 6, right) [81]. The idea was similar to Lee’s work, replacing the horn-shaped hydrogel with a PANI electrode. The width along the axial dimension varied to create variable resistances, thus generating electric field gradient. The advantage of the PANI electrode is that it relies on the low conductivity of PANI polymer, enabling the application of higher voltage with less current. With this technique, they were able to successfully concentrate two fluorescent dyes.
More recent work on EFGF focused on theoretical foundations. A group in Canada, inspired by Lee’s work, combined the bilinear gradient with swept counterflow [82]. Numerical simulations were performed to assess the resolution using various parameters, including length, scan rate and potential. The results agreed well with the predicted valued from the existing literature.
Another direction of EFGF started with the observation of isotachophoretic phenomena within an EFGF device. The observations were supported by theoretical simulations. While DFGF is a somewhat unique, it does not necessarily scale linearly and therefore miniaturization must be executed with care. Moreover, the technique has typically relied upon membranes. Ivory’s group explored some major issues associated with semi-permeable membranes [83]. The membranes were removed and a novel DFGF design was developed [84]. To overcome the electrolysis in this design, an “on-line degas” compartment was included. Compared to their previous design, the degas compartment was located at the bottom of the device and hooked to an in-house vacuum. To prevent the collapse, the degas compartment and the main compartment—separation compartment with multiple electrodes—were connected only through a Teflon sheet as well as the porous ceramics. With this design, three dyes with lower molar weight were separated over 10 h without noticeable degradation.

3.2. Gradient Elution Moving Boundary Electrophoresis (GEMBE)

Ross’s group proposed gradient elution moving boundary electrophoresis (GEMBE). Unlike EFGF with a constant convective flow, this technique used variable hydrodynamic flow from high to low with a constant electrophoretic velocity. All the species were initially placed outside the entrance of the separation channel. Thus only when the bulk counterflow velocity was smaller than the species’ electrophoretic velocity could they enter the channel. Sample could be injected without using any critical sample injection mechanisms.
This strategy was first made available on a CE platform in 2006 with a pressure-controlled waste reservoir coupled to CE. As a model study, fluorescein and carboxyfluorescein were used to perform the separation. This apparatus could be miniaturized with only an all-in-one inlet port and one outlet port per analyte. With their microfluidic apparatus, they studied linear pressure gradient, which successfully separated two fluorescent dyes [85]. With a multistage (nonlinear) gradient, five dansyl-labeled amino acids were isolated. The method gives rise to stair-like data, and electropherogram-like data can be achieved by plotting the first derivative of the raw data.
To avoid some instrument-related issues, Ross’s group used capacitively coupled contactless conductive detection (C4D) [86]. Post-processing of the data was used to generate the electropherogram-like signals. With this detection method, complex samples were investigated, such as milk, dirt, estuarine sediment, coal fly ash and leaves. Samples were injected into the capillary-based apparatus filled with background electrolytes without any pretreatment. This idea has been adapted to a microfluidic device [87]. The design was relatively simple, with one port for sample injection, the other port for background electrolyte injection. The detection was performed around 1 mm from the sample reservoir. The pressure adjustment compartment was connected with buffer reservoir. With this device, dirt and whole blood samples were tested.
When implemented with a sample stacking technique, they could load preconcentrated samples continuously [88]. They have successfully achieved substantial signal enhancement, which was no longer limited to just the conductivity ratio. The continuous sample loading process was accomplished by preparing samples in a lower conductivity buffer and using a higher concentration buffer in the experiments.

3.3. Electrophoretic Exclusion (EE)

Inspired from the techniques mentioned above as well as electrophoretic separation of biological samples is electrophoretic exclusion. It also exploits an electric field to establish a gradient and the pressure-driven hydrodynamic flow is used to counter. However, with the geometry of the apparatus, the electric field gradient is formed only at the entrance to the channel, making the exclusion take place in the immediate vicinity of the entrance and nowhere else.
The technique was started as a bench-top device by Polson et al., demonstrating exclusion on polystyrene spheres [89]. Small molecule exclusion was shown by Meighan et al. with an in-house built instrument [90]. The setup was not complex. Separate sample and buffer vials were connected by a capillary. Two vials were placed at different heights to create pressure-driven flow. The electric field was applied across the capillary with an integrated electrode exactly at the entrance and a standard electrode in the buffer vial. The spectrometer was placed near the entrance of the capillary. The principle of exclusion was confirmed by using a mixture of fluorescent dyes, namely methyl green and neutral red. Similar results were shown with proteins [91] by modifying the capillary with an inner surface polyimide coating to eliminate EOF. Myoglobin, as a model study, was concentrated ~1000-fold in a short period of time. Moreover, separation of multiple proteins was also shown, including mixtures of two positively charged species and one of mixed charge.
Kenyon et al., adapted this technique to a microfluidic device [92]. They investigated this miniaturized device using rhodamine 123 and 100 µm polystyrene beads. Images demonstrated the separation of these two species. They also investigated the theoretical limit of this technique, indicating that is very high resolution, can be run parallel, and separations can occur quickly [93].
Currently, a device with one entrance reservoir and three parallel functional units is used. To better understand how the microdevice works and how it can be optimized, investigation on asymmetric electrode placement (electrode only on one wall) was conducted. Numerical simulations were compared with the experimental results, showing a good agreement. The model constructed was believed to be beneficial for designing next-generation devices [94].

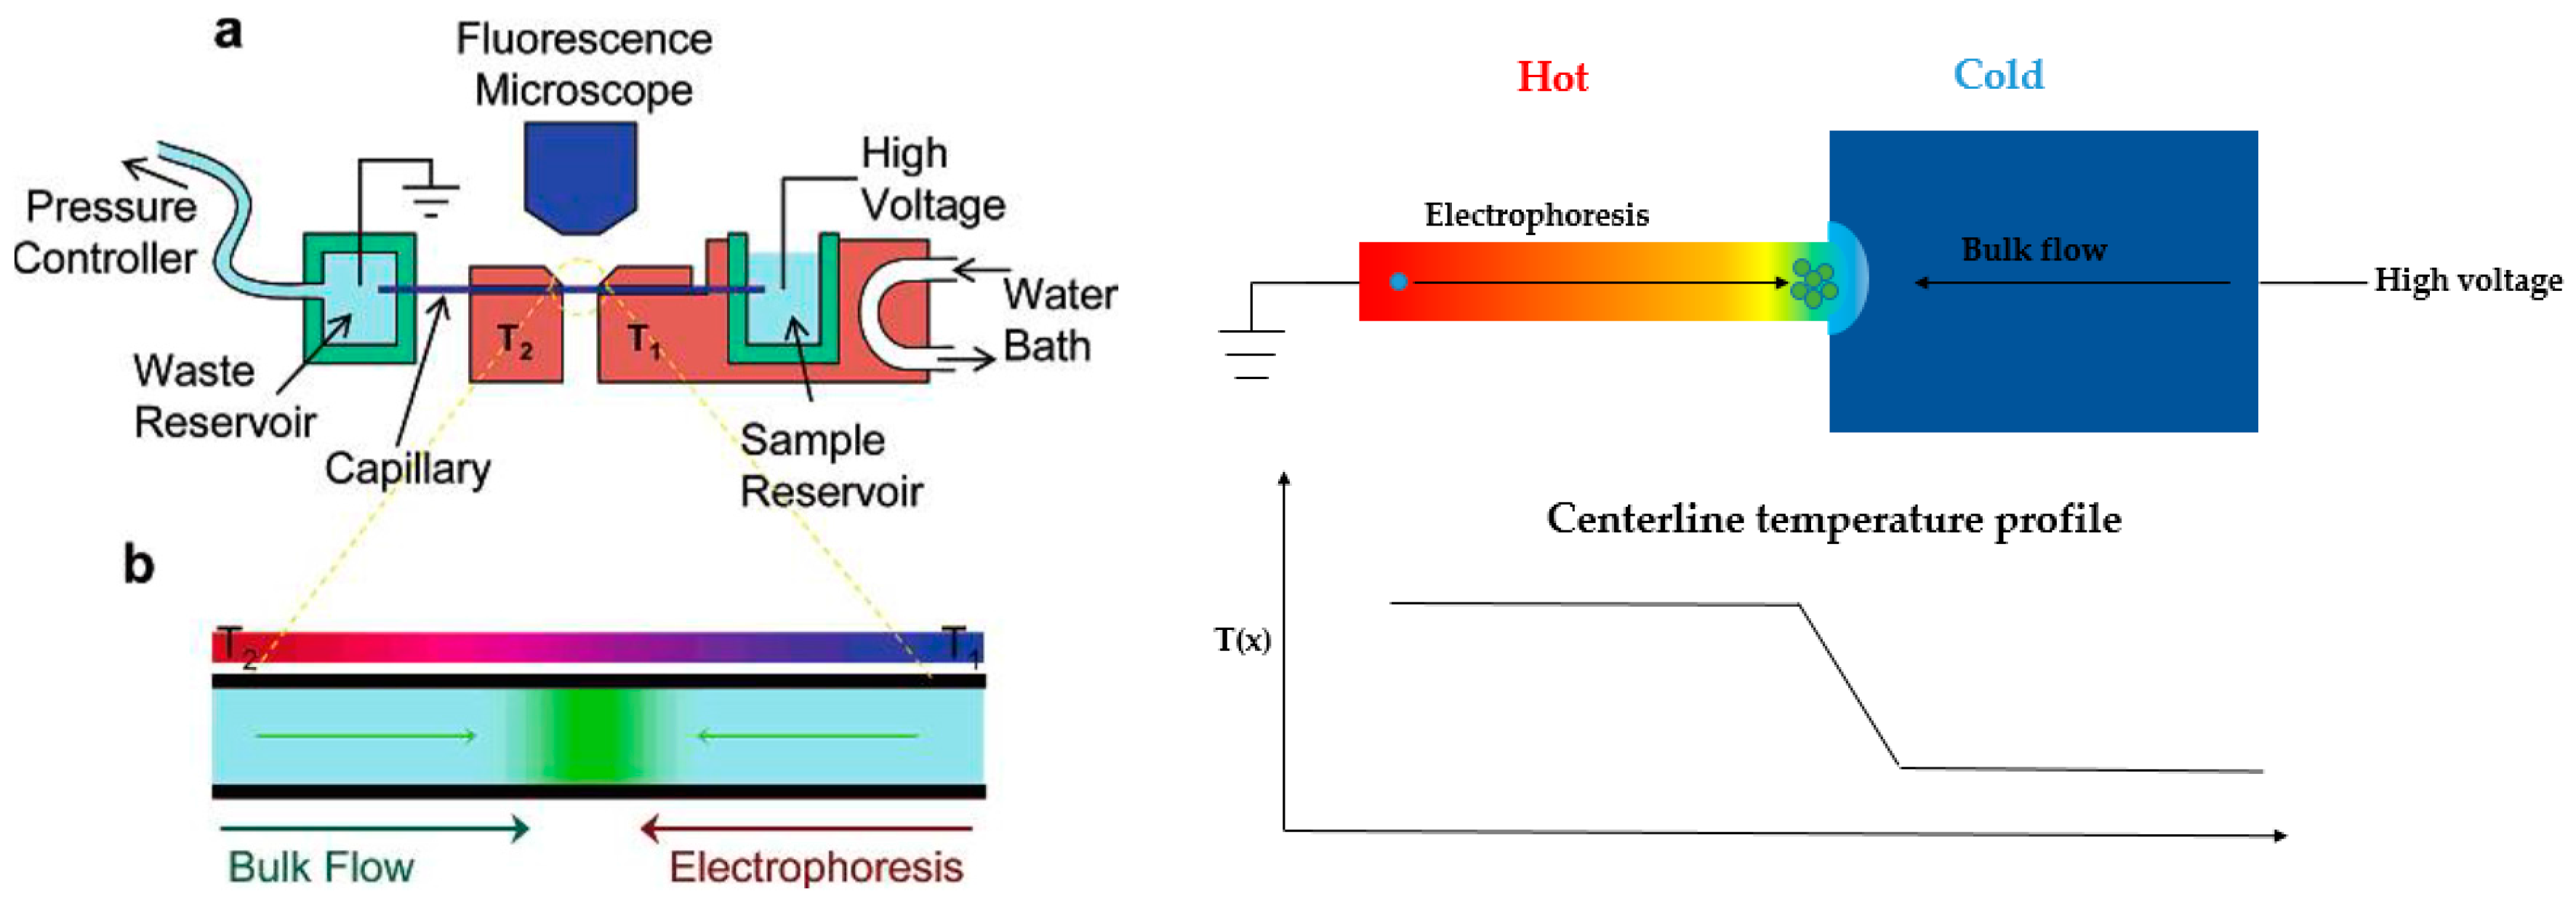
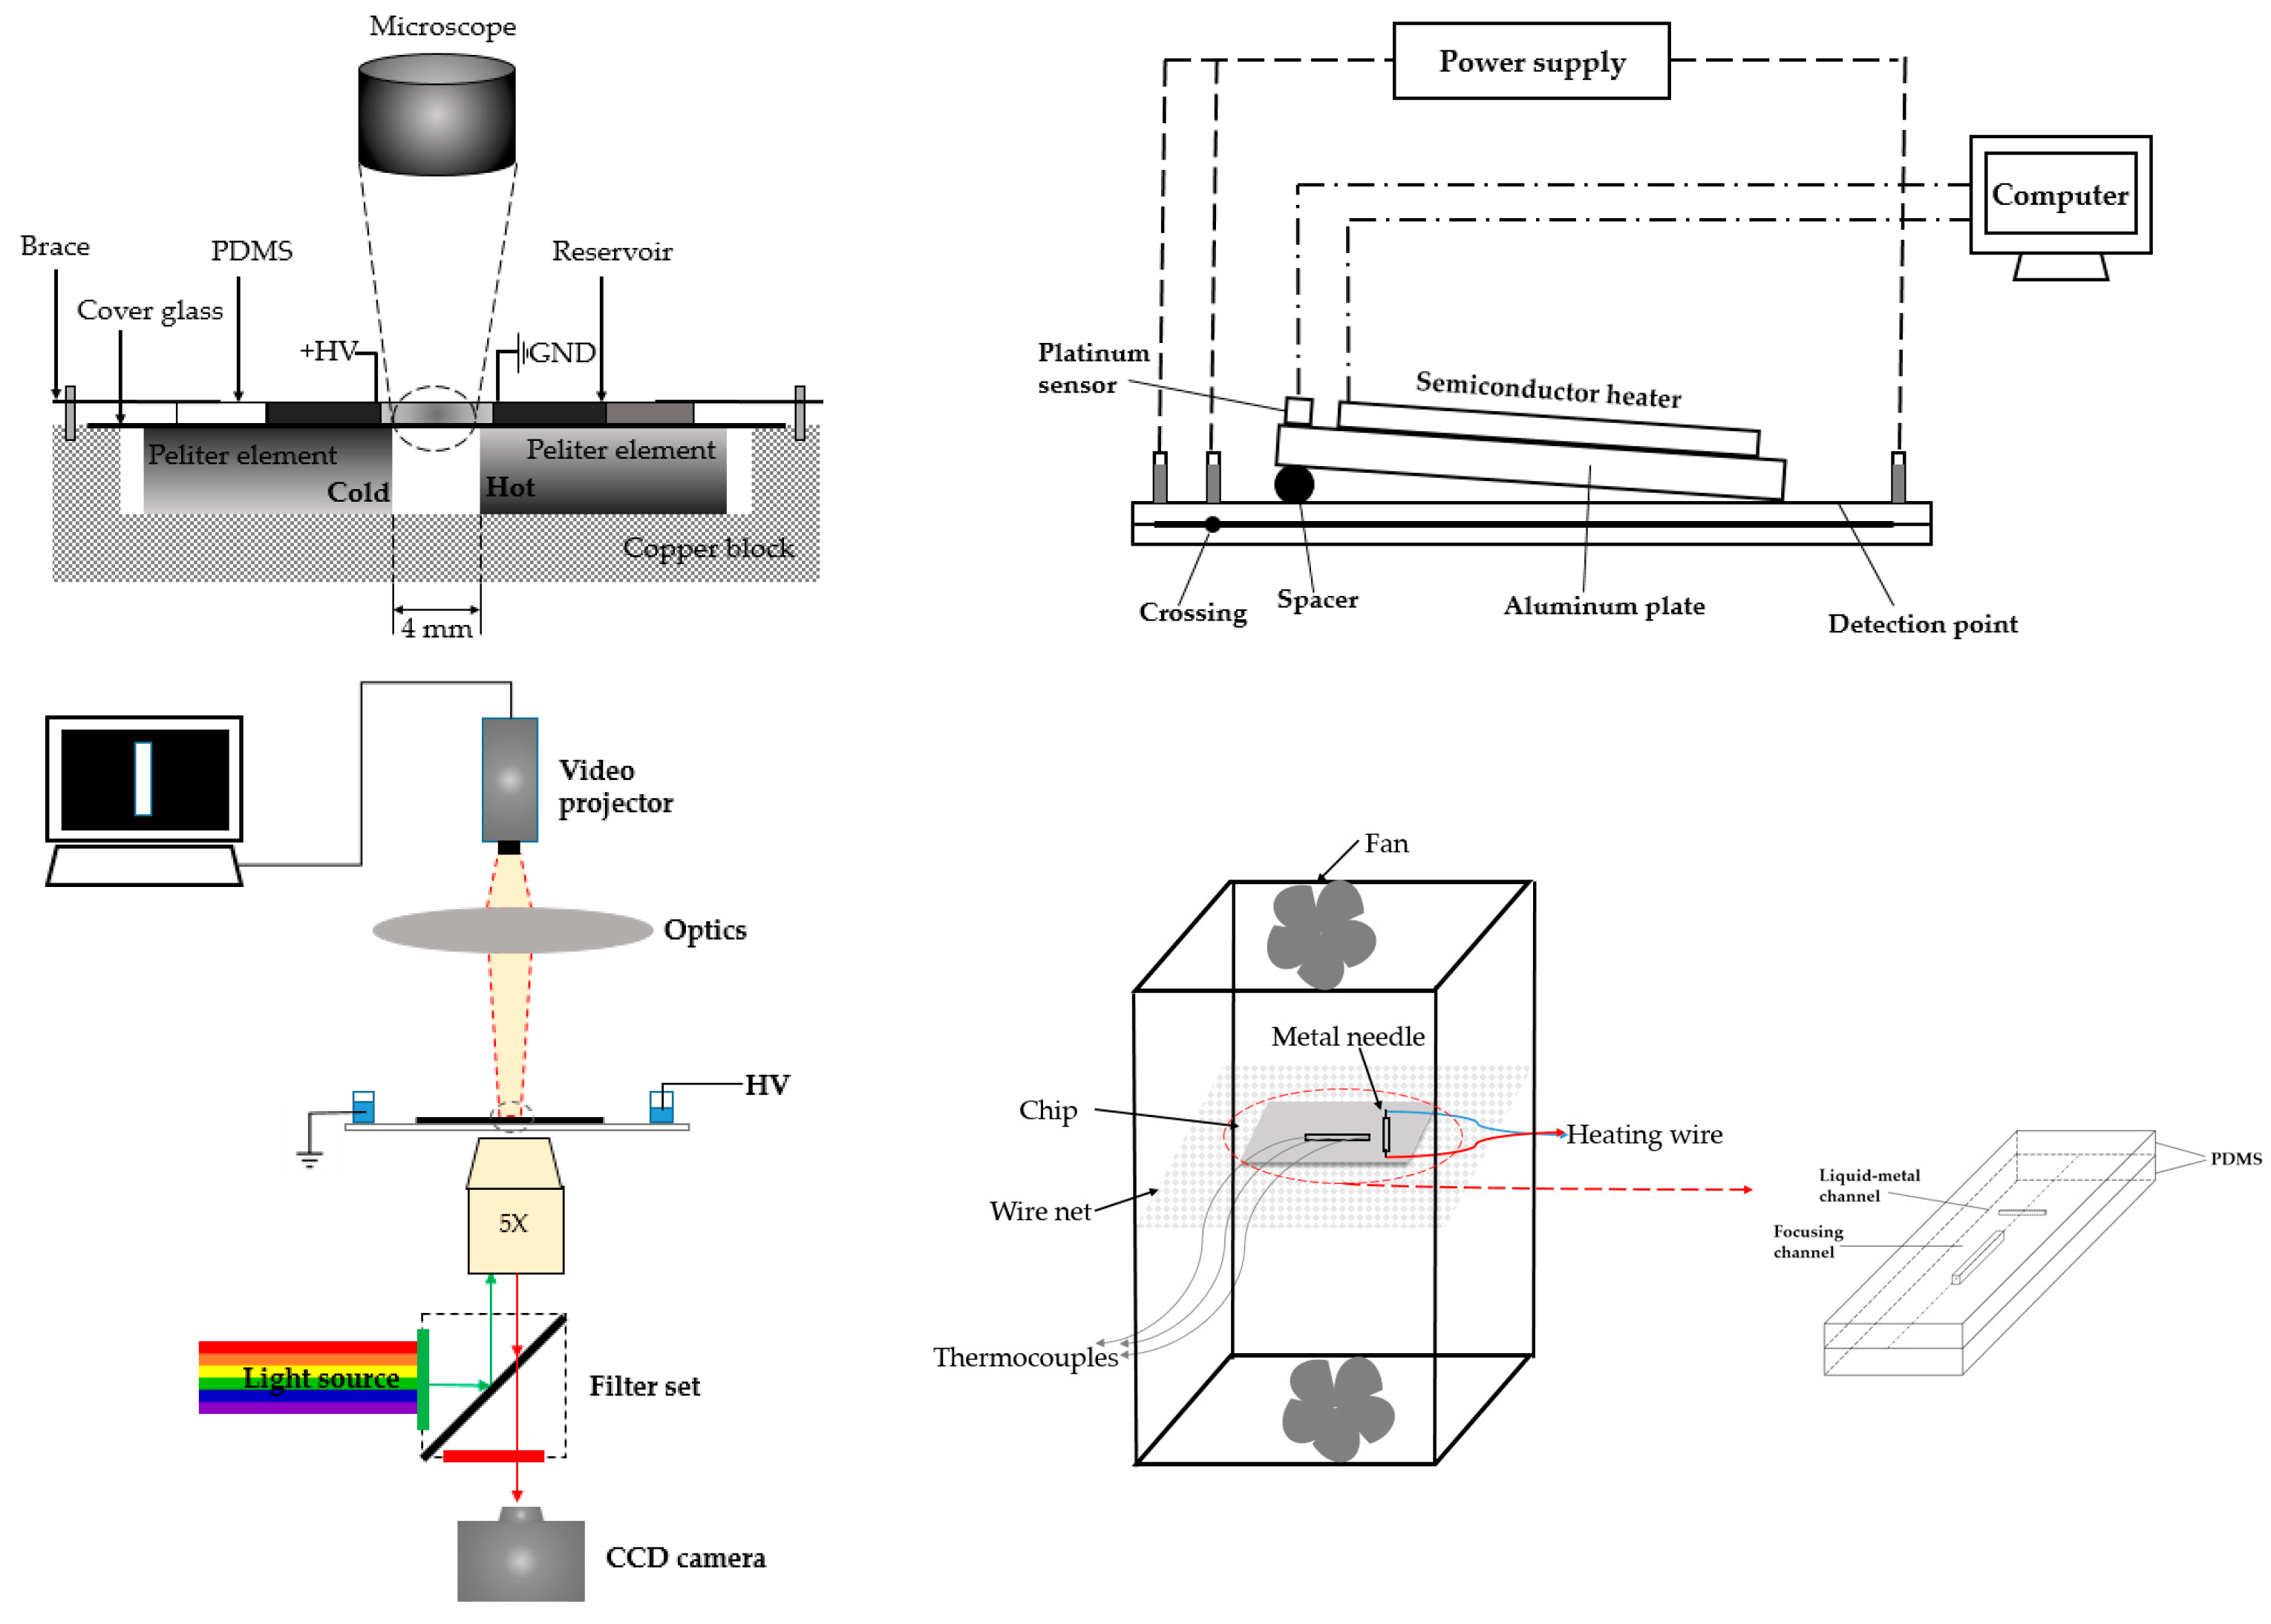
4. Temperature Gradient Focusing (TGF)

An alternative technique, temperature gradient focusing (TGF), was described by Ross’s group (Figure 7, left) [95,96,97]. In this technique, the electric field gradient was created with a buffer with a temperature-dependent ionic strength and local heating. Pressure-driven flow was balanced by the varying electrophoretic velocity, and the targeted analytes can be focused at a specific position.
They demonstrated external heating/cooling equipment to generate temperature gradient. However, the technique has limited peak capacity as well as the dependence of analytes and buffers to temperature. Some other groups also worked on temperature gradient focusing topic with different strategies. Normally, Joule heating would be eliminated for separations, since it causes internal convection within the channel or reservoir. However, in the TGF regime, separation and concentration can take advantage of Joule heating and achieve excellent performance. The first attempt was by Hasselbrink’s group [98]. Their work aimed at reducing the energy needed for the TGF device, as well as eliminating the usage of temperature-dependent buffer. The microchannel was wide at the end and narrow in the middle to establish the temperature gradient. Due to the smaller cross-sectional area in the middle, the current density was higher in this region, thus creating the highest temperature. Electroosmotic flow was used to counterbalance the electrophoretic velocity generated through the temperature gradient. A mixture of two dyes were separated and concentrated in this device. However, the steady-state temperature profile was difficult to maintain, making the focused plug gradually move towards the anode side. This group further studied the Joule heating effect for temperature gradient generation with numerical simulations [99].
Instead of using the geometries mentioned above, Yang’s research group designed a new system with a sudden expansion. They started their investigation with numerical simulations and tested some parameters that might potentially affect the performance of the device, including voltage, buffer concentration, and channel-width ratio, among others [100]. It turned out that all these factors influenced the concentration enhancement. The simulation results were comparable with experiments, and showed higher concentration enhancement than the method developed by Ross. With this information, they further optimized the device by using combined AC and DC fields to induce the Joule heating effect, thus suppressing electroosmotic flow and decreasing the required DC field (Figure 7, right) [101]. With this modification, the concentration could be enhanced to 2500-fold. They performed concentration of DNA with the same setup, accomplishing 480-fold concentration enhancement in 40 s [102].
The usage of internal heater is also a trend for temperature gradient focusing, including Peltier element (Figure 8, top left) [103], radiative heater (Figure 8, top right) [104], and optothermal accessories (Figure 8, bottom left) [105], among others. A miniaturized application focused on the use of liquid metal (Figure 8, bottom right) [106]. In the work proposed by Liu and coworkers, they first filled the channel with liquid metal as heater, then with the application of voltage, Joule heating was generated from this liquid-metal gallium-based alloy heater to form temperature gradient with low conductivity.
In temperature gradient focusing, the bilinear gradient can also be used to enhance the peak capacity and resolving power at the same time. Ren’s group investigated the bilinear gradient formation in the TGF device [82,107,108]. The basic idea was very similar to that proposed by Lee’s team, namely combining a steep gradient followed by a shallow gradient. In order to achieve such a bilinear gradient, a heater was integrated into the microdevice. The heater was designed to have one large end and one small end to allow for the heat generation, thus creating a desired temperature profile. In order to obtain a broad temperature gradient, the large region was operated in cooled water at initial stage to enhance the temperature difference. The temperature profile was confirmed by finite element simulation software. A comparison between linear and bilinear experimental results were also made, and the bilinear method showed a fairly good resolving power when performing separation of three fluorescent-labeled amino acids, whereas the linear method only showed two peaks.

5. Concentration Polarization/Ion Concentration Polarization (ICP) and Bipolar Electrodes (BPE)

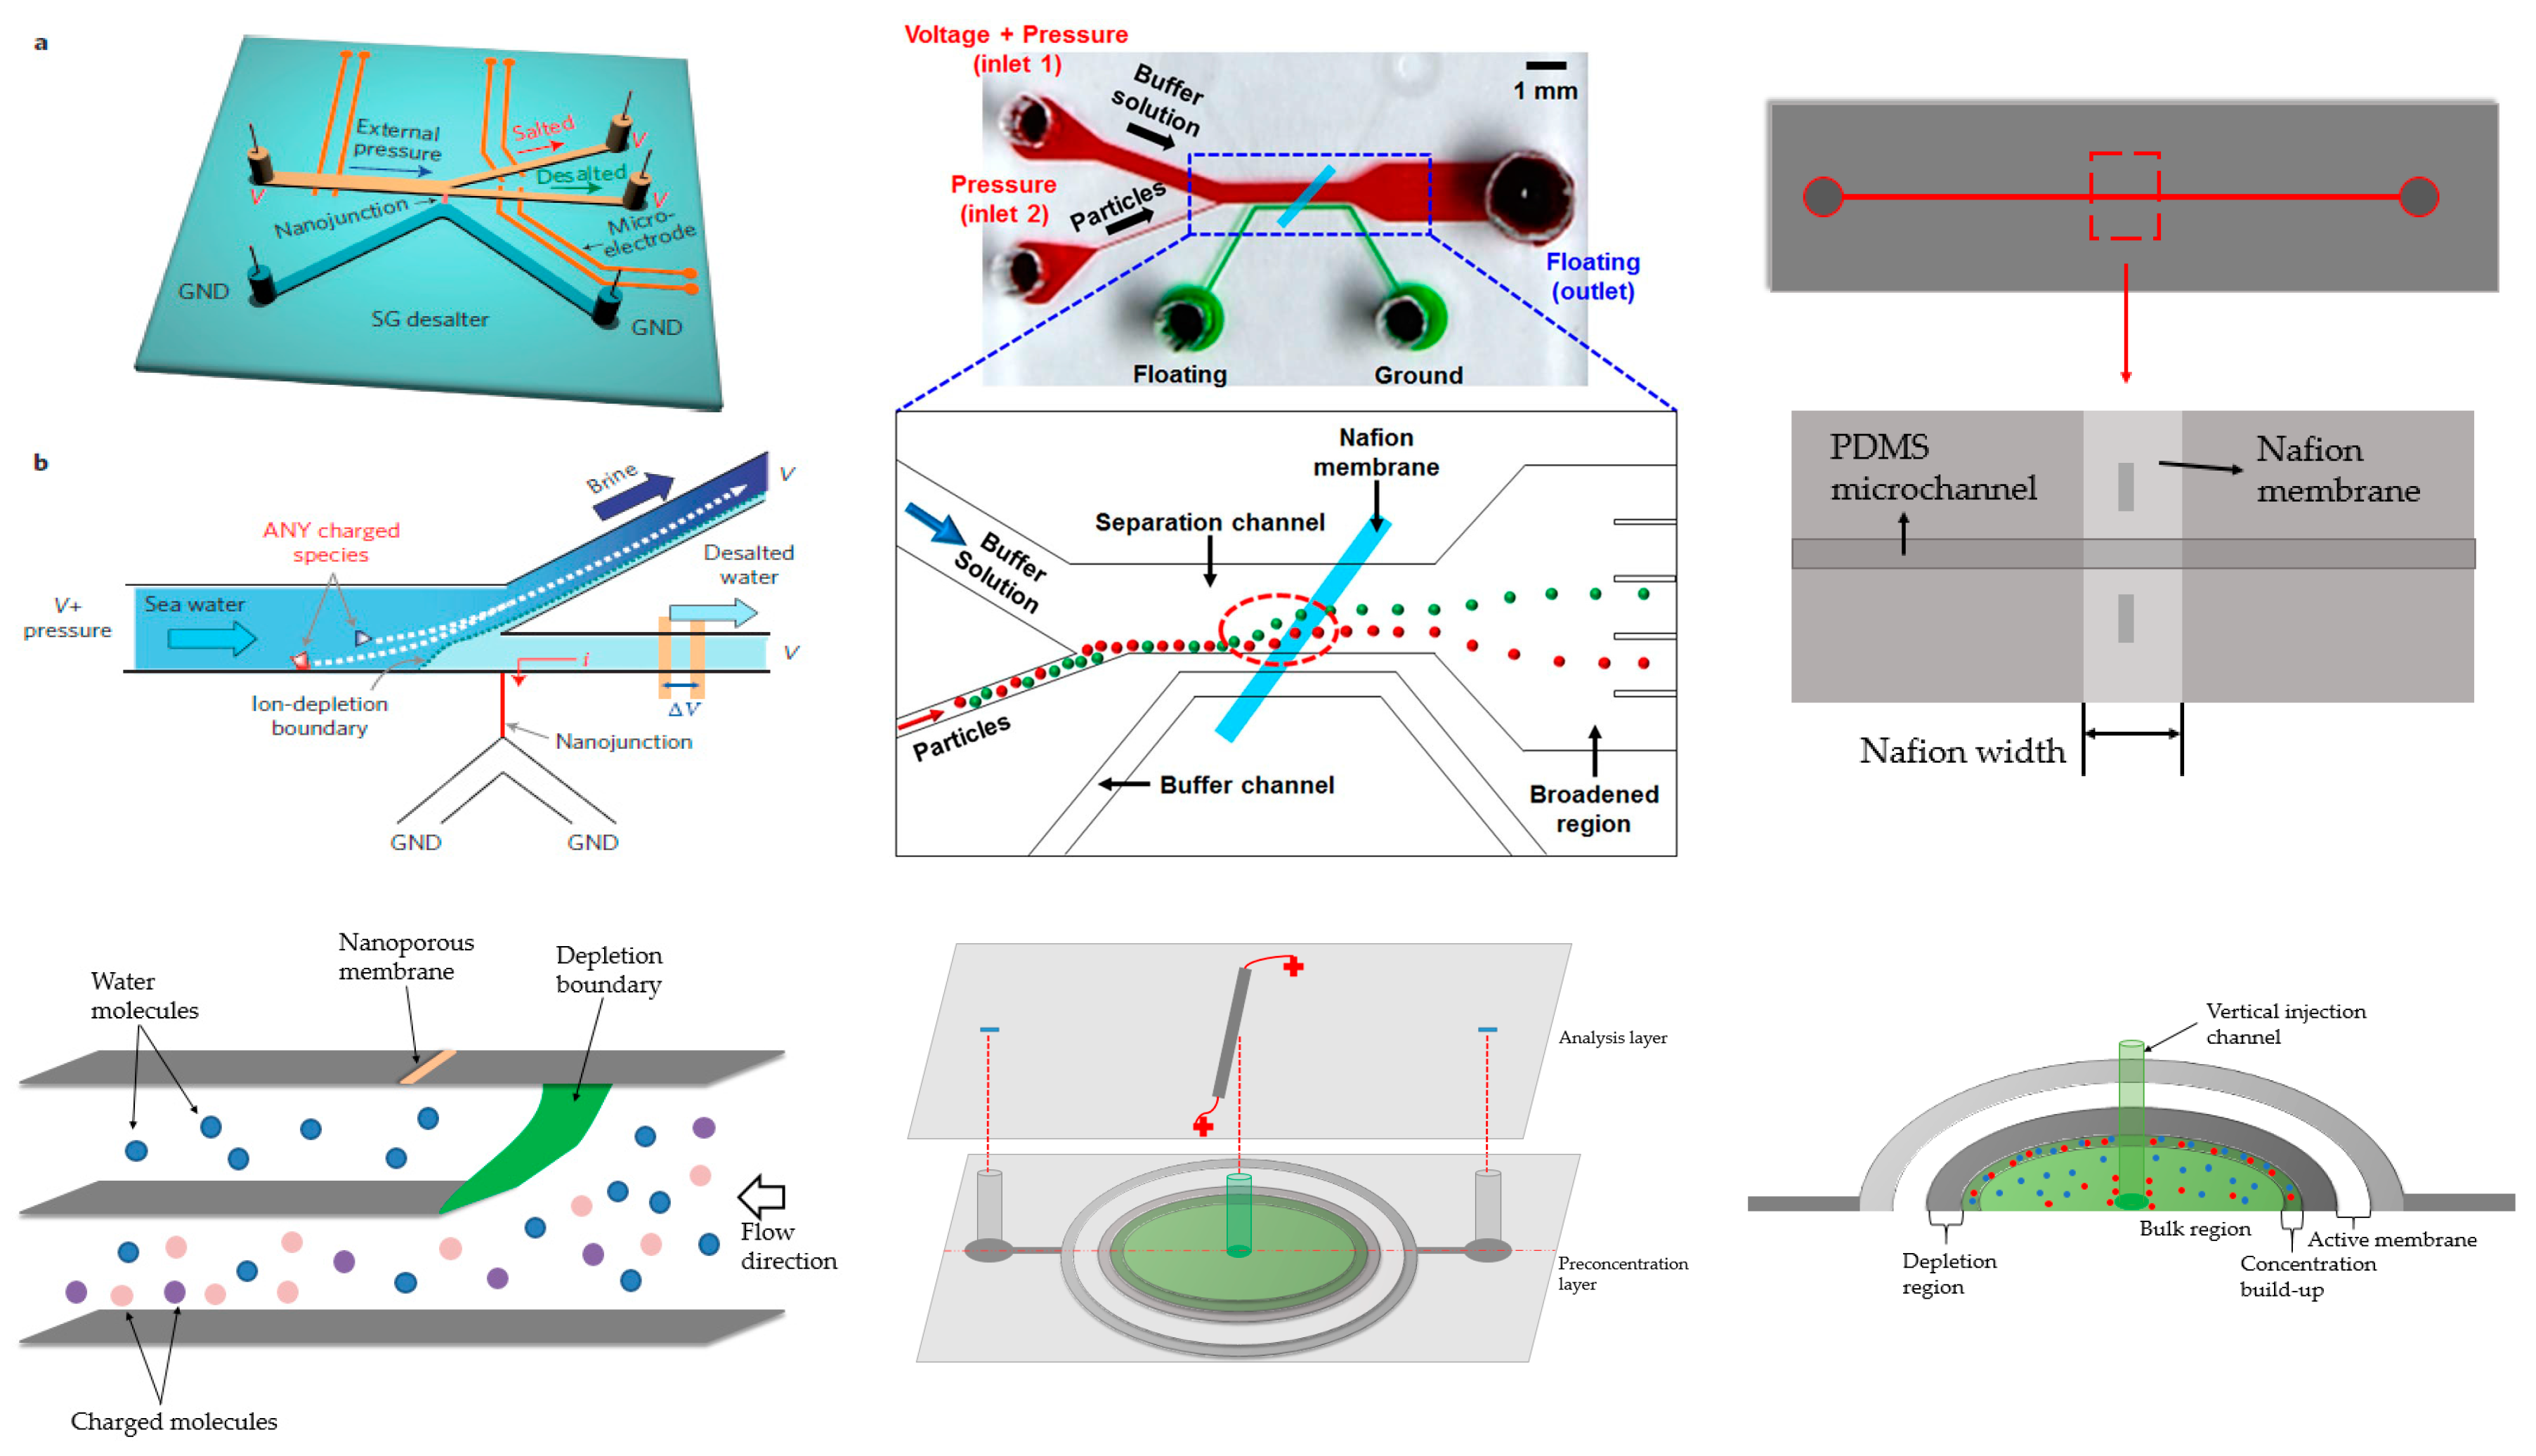
5.1. Concentration Polarization/Ion Concentration Polarization (ICP)

Concentration polarization (CP) or ion concentration polarization (ICP) is well known to electrochemists, in many instances as a nuisance. ICP is commonly achieved purposefully through nanochannel structure and ion-permselective membrane.
The ICP phenomenon is generated by a gradient of ions and co-ions of differing mobilities across a nanopore small enough to allow for an electric double layer (EDL) overlap or permselective membrane. A nanostructure has pores small enough to allow the overlap of the EDL from opposite sides of the opening. The overlapping of the EDL causes the solution in the nanostructure to be charged, preventing transport of co-ions. The nanostructure then exhibits the permselectivity property-enriching ions or co-ions [109]. For the membrane, the mismatch of mobile and stationary charge carriers across the membrane causes an accumulation of ions.
Early work using nanochannel structure and charge-selective membrane for separation and preconcentration was undertaken by Sweedler and Bohn’s research groups [110,111]. In their work, two microfluidic channels were placed cross-wise in a layered device with a nanofluidic membrane in between. This design enabled the sorting of species between layers and opened up the possibility of using nanostructure and membrane as well as 3D-multilayer construction for preconcentration.
A novel nanostructure with the Nafion membrane for separation of salted species from seawater was shown by Han and his coworkers (Figure 9, top left) [112]. In their device, the nanostructure was located at the intersection of two branches. Due to ion depletion, the charged species were repelled to one branch, while the desalted species (mainly water) could flow through the other. Since the charged species were repelled, the nanoporous membrane did not foul. They showed that 99% of the salt could be removed and that the energy consumption was low. However, recent work demonstrated that it was not as efficient as initially presented. Nevertheless, this was a very successful trial and provided a convenient way to address the global water-shortage problem. Later, the same device was used for separation of biomolecules and cells [113].
This design inspired other configurations. Kang’s group used a Nafion membrane tilted to 45° and positioned between channels (Figure 9, top middle) [114] where the ion-depletion zone formed near the one bottom edge of the membrane. The outlet region was expanded compared to the separation channel, amplifying the separation efficiency and acting as a dimension sorter. The separation was demonstrated with two particles of differing diameters.
Sinton’s group contributed a 3D design for its potential use for high-throughput detection and analysis related to desalination (Figure 9, bottom left) [115]. The device had three stacked vertical units: the top layer had a vertical membrane, the middle layer had a channel for purified water, and the bottom layer was used to transport charged species. Similar to Han and Kang’s designs, when voltage was applied, the region near the membrane formed an ion-depletion zone, deflecting the charged species. As a result, the neutral water molecules flowed through the second layer, while the charged impurities passed through the bottom. It was noteworthy that the purified layer and bottom layer were not overlapped in space, making the visualization more convenient. The device has three-fold functional density and is less energy consumption than planar devices.
Preconcentration can also be achieved through a straight channel. Han and Kang’s group collaborated in 2012 and developed a straight channel design with a membrane located in the middle of the channel (Figure 9, top right) [116]. With the application of sufficient flow, depletion and ion-enrichment zones formed. The spread of these zones was limited compared to conventional devices. They also coupled this to an immunoassay for preconcentration and obtained a limit of detection of 1 ng/mL, which is 1000 times lower than classical strategies. Tang’s group developed a similar single-channel device, achieving over 10,000-fold concentration enhancement of protein samples in one case and simultaneous accumulation of cells in another application [117]. Tang’s group further investigated the theoretical basis of their scheme using numerical simulations [118].
Channel structures were expanded to a radial concentrator by Sinton and coworkers (Figure 9, bottom middle and right) [119]. A vertical channel was placed in the center of a radial chamber covered by the Nafion membrane. Application of a voltage created an ion-depletion zone around the membrane. The depletion zone spread until entering the middle vertical channel. No additional flow was required and concentration over 150-fold was achieved in a short period of time.
Most recent research has been focused on paper-based devices, easing fabrication requirements. A good example came from Wang’s group in National Cheng Kung University. They tested several different geometries. An optimized converging device can result in ~20-fold increase, while a straight channel only gave ~10-fold enhancement [120].
Another fabrication technique, xurography, can also be cleanroom-free [121]. Microchannels were created on a double-face adhesive film, then adhered to a glass slide. A strip of Nafion was placed above the film. A cutting plotter, which was formerly used industrially, was used for adjusting the shape of the channels and Nafion membrane. With this simple device, a concentration factor of over 5000-fold was shown.

5.2. Bipolar Electrodes (BPE)

Bipolar electrodes, mostly with respect to bipolar electrochemistry, have long been investigated. They did not receive much attention in electrophoretic separation and preconcentration until Crooks and coworkers reported competition between ionic conductance and electronic conductance in a microfluidic device [122]. A number of projects followed. First, they developed a theoretical model and studied the dynamics of species transportation and electric field formation [123]. They then determined the rates of hydrolysis that led to the differences in conductivity, thus creating an electric field gradient. They extended the application to simultaneously enrich and concentrate three different species, and the result was quite promising: within 200 s, they successfully enriched three negatively charged species over 200-fold [124]. The focusing mechanism was mainly due to the electric field generated by faradaic reactions. When a pH-sensitive buffer, such as Tris/TrisH+ was used, the OH generated at the cathodic pole of the BPE could react with the TrisH+ near that region, forming neutral Tris and reducing the conductivity regionally. The conductivity difference established the electric field gradient. In addition, the electroosmotic flow was used to counter the electrophoretic velocity, making the species accumulate at a specific position. They termed this phenomenon as “bipolar electrode focusing” and investigated current and electric field effects [125,126]. Moreover, with the modification of channel walls, the reversal EOF enabled the enrichment of cations in the BPE-based microdevices [127].
They also explored the depletion zone using bipolar electrodes [128]. The principle behind it was quite similar to that of bipolar electrode focusing, but the electrolyte was not pH-sensitive. As a result, the OH at the cathodic pole and H+ at the anodic pole increased the conductivity near these two regions. Consequently, the electric field was relatively low between BPE and high on both poles, making the anion migrate towards the cathode. They further studied the ability of this device acting as a membraneless filter when one negatively charged dye and one neutral dye were combined.
Single-channel and dual-channel designs were investigated, leading to a discussion of faradaic ion concentration polarization [129]. Compared to conventional ICP, which transported charged species through a nanostructure/membrane, the faradaic ICP from BPE “transported” species through electrochemical reactions on both cathodic and anodic poles of electrodes. As a result, conventional ICP was noted as mass-transport limited, while faradaic ICP was electron-transfer limited.
With a clear understanding of faradaic ICP, the dual-channel design has been used for enrichment and concentration of both cations and anions [130]. In this design, two channels were connected by a bipolar electrode with TrisH+ buffer in the top channel, and acetate buffer in the bottom channel.
Building on this body of work, Song and coworkers developed a bipolar electrode-based microdevice combining the end-label free-solution electrophoresis for preconcentration and separation of DNA [131]. In their approach, a simple dual-channel design was used. DNA was labeled by a protein tag to achieve different mass-to-charge ratio, which enabled the free-solution electrophoresis for separation and enrichment in a BPE-coupled dual-channel microdevice.

6. Concluding Remarks

This review provides a distinctive view of electrophoretic separation and preconcentration strategies. Gradient-based approaches in electrophoretic methods are promising and continue to attract attention of the scientific community since they serve as selective preconcentration platforms for complex matrices. Growing interest is visible in new fabrication procedures aiming to reduce the complicated and labor-intensive work with standard lithography procedures in the cleanroom. A remarkable trend can be seen in paper-based microdevices.
Among all the techniques mentioned in this review, isotachophoretic strategies might be the most practical ones as they can be applied to a variety of analytes including biological samples and inorganic components. Field-amplified sample stacking still serves as an important role in sample injection or introduction, and may facilitate a better performance when combined with other techniques. Counterflow electric field gradient focusing remains an effective separation and preconcentration method. Gradient elution moving boundary electrophoresis might be the most powerful tool in this category as it can be applied to raw samples even without prior treatment. Electric field gradient focusing maintains its advantage and can be used for some bio-samples. Electrophoretic exclusion is still at an early phase and aims to provide new insight for next-generation design. Temperature gradient focusing continues to grow, with new fabrication or new materials facilitating further development of the technique.
The reviewed papers demonstrate that gradient-based electrophoretic approaches remain an effective tool for keeping CE techniques competitive, and in many cases superior, compared with other separation methods.

Acknowledgments

This work was supported by National Institutes of Health grants 5R21EB010191-02, 1R03AI094193-01, 1R03AI099740-01, and R03AI111361-01.

Author Contributions

Fanyi Zhu prepared the initial draft, which was edited and refined by Mark A. Hayes and then both authors contributed equally to revision and completion of the manuscript.

Conflicts of Interest

The authors declare no conflict of interest.

References

  1. Strohmeier, O.; Keller, M.; Schwemmer, F.; Zehnle, S.; Mark, D.; von Stetten, F.; Zengerle, R.; Paust, N. Centrifugal microfluidic platforms: Advanced unit operations and applications. Chem. Soc. Rev. 2015, 44, 6187–6229. [Google Scholar] [CrossRef] [PubMed]
  2. Breadmore, M.C. Recent advances in enhancing the sensitivity of electrophoresis and electrochromatography in capillaries and microchips. Electrophoresis 2007, 28, 254–281. [Google Scholar] [CrossRef] [PubMed]
  3. Breadmore, M.C.; Thabano, J.R.; Dawod, M.; Kazarian, A.A.; Quirino, J.P.; Guijt, R.M. Recent advances in enhancing the sensitivity of electrophoresis and electrochromatography in capillaries and microchips (2006–2008). Electrophoresis 2009, 30, 230–248. [Google Scholar] [CrossRef] [PubMed]
  4. Breadmore, M.C.; Dawod, M.; Quirino, J.P. Recent advances in enhancing the sensitivity of electrophoresis and electrochromatography in capillaries and microchips (2008–2010). Electrophoresis 2011, 32, 127–148. [Google Scholar] [CrossRef] [PubMed]
  5. Breadmore, M.C.; Shallan, A.I.; Rabanes, H.R.; Gstoettenmayr, D.; Keyon, A.S.A.; Gaspar, A.; Dawod, M.; Quirino, J.P. Recent advances in enhancing the sensitivity of electrophoresis and electrochromatography in capillaries and microchips (2010–2012). Electrophoresis 2013, 34, 29–54. [Google Scholar] [CrossRef] [PubMed]
  6. Breadmore, M.C.; Tubaon, R.M.; Shallan, A.I.; Phung, S.C.; Keyon, A.S.A.; Gstoettenmayr, D.; Prapatpong, P.; Alhusban, A.A.; Ranjbar, L.; See, H.H.; et al. Recent advances in enhancing the sensitivity of electrophoresis and electrochromatography in capillaries and microchips (2012–2014). Electrophoresis 2015, 36, 36–61. [Google Scholar] [CrossRef] [PubMed]
  7. Zeng, J.; Deng, Y.; Vedantam, P.; Tzeng, T.-R.; Xuan, X. Magnetic separation of particles and cells in ferrofluid flow through a straight microchannel using two offset magnets. J. Magn. Magn. Mater. 2013, 346, 118–123. [Google Scholar] [CrossRef]
  8. Han, X.; Feng, Y.; Cao, Q.; Li, L. Three-dimensional analysis and enhancement of continuous magnetic separation of particles in microfluidics. Microfluid. Nanofluid. 2014, 18, 1209–1220. [Google Scholar] [CrossRef]
  9. Laurell, T.; Petersson, F.; Nilsson, A. Chip integrated strategies for acoustic separation and manipulation of cells and particles. Chem. Soc. Rev. 2007, 36, 492–506. [Google Scholar] [CrossRef] [PubMed]
  10. Destgeer, G.; Lee, K.H.; Jung, J.H.; Alazzam, A.; Sung, H.J. Continuous separation of particles in a PDMS microfluidic channel via travelling surface acoustic waves (TSAW). Lab Chip 2013, 13, 4210–4216. [Google Scholar] [CrossRef] [PubMed]
  11. Li, P.; Mao, Z.; Peng, Z.; Zhou, L.; Chen, Y.; Huang, P.H.; Huang, T.J. Acoustic separation of circulating tumor cells. Proc. Natl. Acad. Sci. 2015, 112, 4970–4975. [Google Scholar] [CrossRef] [PubMed]
  12. Kim, S.B.; Yoon, S.Y.; Sung, H.J.; Kim, S.S. Cross-type optical particle separation in a microchannel. Anal. Chem. 2008, 80, 2628–2630. [Google Scholar] [CrossRef] [PubMed]
  13. Jung, J.H.; Lee, K.H.; Lee, K.S.; Ha, B.H.; Oh, Y.S.; Sung, H.J. Optical separation of droplets on a microfluidic platform. Microfluid. Nanofluid. 2013, 16, 635–644. [Google Scholar] [CrossRef]
  14. Gongora, J.S.T.; Fratalocchi, A. Optical force on diseased blood cells: Towards the optical sorting of biological matter. Opt. Lasers Eng. 2016, 76, 40–44. [Google Scholar] [CrossRef]
  15. Yang, H.; Chien, R.L. Sample stacking in laboratory-on-a-chip devices. J. Chromatogr. A 2001, 924, 155–163. [Google Scholar] [CrossRef]
  16. Bharadwaj, R.; Santiago, J.G. Dynamics of field-amplified sample stacking. J. Fluid Mech. 2005, 543, 57. [Google Scholar] [CrossRef]
  17. Mala, Z.; Gebauer, P.; Bocek, P. Contemporary sample stacking in analytical electrophoresis. Electrophoresis 2011, 32, 116–126. [Google Scholar] [CrossRef] [PubMed]
  18. Chen, Y.; Lü, W.; Chen, X.; Teng, M. Review of recent developments of on-line sample stacking techniques and their application in capillary electrophoresis. Cent. Eur. J. Chem. 2012, 10, 611–638. [Google Scholar] [CrossRef]
  19. Slampova, A.; Mala, Z.; Pantuckova, P.; Gebauer, P.; Bocek, P. Contemporary sample stacking in analytical electrophoresis. Electrophoresis 2013, 34, 3–18. [Google Scholar] [CrossRef] [PubMed]
  20. Lian, D.S.; Zhao, S.J.; Li, J.; Li, B.L. Progress in stacking techniques based on field amplification of capillary electrophoresis. Anal. Bioanal. Chem. 2014, 406, 6129–6150. [Google Scholar] [CrossRef] [PubMed]
  21. Mala, Z.; Slampova, A.; Krivankova, L.; Gebauer, P.; Bocek, P. Contemporary sample stacking in analytical electrophoresis. Electrophoresis 2015, 36, 15–35. [Google Scholar] [CrossRef] [PubMed]
  22. Thormann, W. Principles of isotachophoresis and dynamics of the isotachophoretic separation of two components. Sep. Sci. Technol. 2006, 19, 455–467. [Google Scholar] [CrossRef]
  23. Gebauer, P.; Mala, Z.; Bocek, P. Recent progress in analytical capillary isotachophoresis. Electrophoresis 2011, 32, 83–89. [Google Scholar] [CrossRef] [PubMed]
  24. Rogacs, A.; Qu, Y.; Santiago, J.G. Bacterial RNA extraction and purification from whole human blood using isotachophoresis. Anal. Chem. 2012, 84, 5858–5863. [Google Scholar] [CrossRef] [PubMed]
  25. Wen, Y.; Li, J.; Ma, J.; Chen, L. Recent advances in enrichment techniques for trace analysis in capillary electrophoresis. Electrophoresis 2012, 33, 2933–2952. [Google Scholar] [CrossRef] [PubMed]
  26. Mala, Z.; Gebauer, P.; Bocek, P. Recent progress in analytical capillary isotachophoresis. Electrophoresis 2013, 34, 19–28. [Google Scholar] [CrossRef] [PubMed]
  27. Smejkal, P.; Bottenus, D.; Breadmore, M.C.; Guijt, R.M.; Ivory, C.F.; Foret, F.; Macka, M. Microfluidic isotachophoresis: A review. Electrophoresis 2013, 34, 1493–1509. [Google Scholar] [CrossRef] [PubMed]
  28. Strychalski, E.A.; Konek, C.; Butts, E.L.; Vallone, P.M.; Henry, A.C.; Ross, D. DNA purification from crude samples for human identification using gradient elution isotachophoresis. Electrophoresis 2013, 34, 2522–2530. [Google Scholar] [CrossRef] [PubMed]
  29. Rogacs, A.; Marshall, L.A.; Santiago, J.G. Purification of nucleic acids using isotachophoresis. J. chromatogr. A 2014, 1335, 105–120. [Google Scholar] [CrossRef] [PubMed]
  30. Mala, Z.; Gebauer, P.; Bocek, P. Recent progress in analytical capillary isotachophoresis. Electrophoresis 2015, 36, 2–14. [Google Scholar] [CrossRef] [PubMed]
  31. Petersson, F.; Aberg, L.; Sward-Nilsson, A.M.; Laurell, T. Free flow acoustophoresis microfluidic-based mode of particle and cell separation. Anal. Chem. 2007, 79, 5117–5123. [Google Scholar] [CrossRef] [PubMed]
  32. Turgeon, R.T.; Bowser, M.T. Micro free-flow electrophoresis: Theory and applications. Anal. Bioanal. Chem. 2009, 394, 187–198. [Google Scholar] [CrossRef] [PubMed]
  33. Becker, M.; Mansouri, A.; Beilein, C.; Janasek, D. Temperature gradient focusing in miniaturized free-flow electrophoresis devices. Electrophoresis 2009, 30, 4206–4212. [Google Scholar] [CrossRef] [PubMed]
  34. Wildgruber, R.; Weber, G.; Wise, P.; Grimm, D.; Bauer, J. Free-flow electrophoresis in proteome sample preparation. Proteomics 2014, 14, 629–636. [Google Scholar] [CrossRef] [PubMed]
  35. Benz, C.; Boomhoff, M.; Appun, J.; Schneider, C.; Belder, D. Chip-based free-flow electrophoresis with integrated nanospray mass-spectrometry. Angew. Chem. 2015, 54, 2766–2770. [Google Scholar] [CrossRef] [PubMed]
  36. Koegler, W.S.; Ivory, C.F. Field gradient focusing a novel method for protein separation. Biotechnol. Prog. 1996, 12, 822–836. [Google Scholar] [CrossRef]
  37. Wang, Q.; Tolley, H.D.; LeFebre, D.A.; Lee, M.L. Analytical equilibrium gradient methods. Anal. Bioanal. Chem. 2002, 373, 125–135. [Google Scholar] [CrossRef] [PubMed]
  38. Kelly, R.T.; Woolley, A.T. Electric field gradient focusing. J. Sep. Sci. 2005, 28, 1985–1993. [Google Scholar] [CrossRef] [PubMed]
  39. Ivory, C.F. Several new electrofocusing techniques. Electrophoresis 2007, 28, 15–25. [Google Scholar] [CrossRef] [PubMed]
  40. Shackman, J.G.; Ross, D. Counter-flow gradient electrofocusing. Electrophoresis 2007, 28, 556–571. [Google Scholar] [CrossRef] [PubMed]
  41. Meighan, M.M.; Staton, S.J.; Hayes, M.A. Bioanalytical separations using electric field gradient techniques. Electrophoresis 2009, 30, 852–865. [Google Scholar] [CrossRef] [PubMed]
  42. Vyas, C.A.; Flanigan, P.M.; Shackman, J.G. Gradient counterflow electrophoresis methods for bioanalysis. Bioanalysis 2010, 2, 815–827. [Google Scholar] [CrossRef] [PubMed]
  43. Jung, B.; Bharadwaj, R.; Santiago, J.G. Thousandfold signal increase using field-amplified sample stacking for on-chip electrophoresis. Electrophoresis 2003, 24, 3476–3483. [Google Scholar] [CrossRef] [PubMed]
  44. Cheng, H.; Han, C.; Xu, Z.; Liu, J.; Wang, Y. Sensitivity enhancement by field-amplified sample injection in interfacing microchip electrophoresis with inductively coupled plasma mass spectrometry for bromine speciation in bread. Food Anal. Methods 2014, 7, 2153–2162. [Google Scholar] [CrossRef]
  45. Giri, B.; Dutta, D. Improvement in the sensitivity of microfluidic ELISA through field amplified stacking of the enzyme reaction product. Anal. Chim. Acta 2014, 810, 32–38. [Google Scholar] [CrossRef] [PubMed]
  46. Sueyoshi, K.; Kitagawa, F.; Otsuka, K. Effect of a low-conductivity zone on field-amplified sample stacking in microchip micellar electrokinetic chromatography. Anal. Sci. 2013, 29, 133–138. [Google Scholar] [CrossRef] [PubMed]
  47. Won, S.Y.; Chandra, P.; Hee, T.S.; Shim, Y.B. Simultaneous detection of antibacterial sulfonamides in a microfluidic device with amperometry. Biosen. Bioelectron. 2013, 39, 204–209. [Google Scholar] [CrossRef] [PubMed]
  48. Jung, B.; Bharadwaj, R.; Santiago, J.G. On-chip millionfold sample stacking using transient isotachophoresis. Anal. Chem. 2006, 2319–2327. [Google Scholar] [CrossRef] [PubMed]
  49. Prest, J.E.; Baldock, S.J.; Fielden, P.R.; Goddard, N.J.; Goodacre, R.; O’Connor, R.; Brown, B.J.T. Miniaturised free flow isotachophoresis of bacteria using an injection moulded separation device. J. Chromatogr. B 2012, 903, 53–59. [Google Scholar] [CrossRef] [PubMed]
  50. Xu, Z.; Murata, K.; Arai, A.; Hirokawa, T. Band-broadening suppressed effect in long turned geometry channel and high-sensitive analysis of DNA sample by using floating electrokinetic supercharging on a microchip. Biomicrofluidics 2010, 4, 14108. [Google Scholar] [CrossRef] [PubMed]
  51. Wu, R.; Yeung, W.S.; Fung, Y.S. 2-D t-ITP/CZE determination of clinical urinary proteins using a microfluidic-chip capillary electrophoresis device. Electrophoresis 2011, 32, 3406–3414. [Google Scholar] [CrossRef] [PubMed]
  52. Bottenus, D.; Jubery, T.Z.; Dutta, P.; Ivory, C.F. 10,000-fold concentration increase in proteins in a cascade microchip using anionic ITP by a 3-D numerical simulation with experimental results. Electrophoresis 2011, 32, 550–562. [Google Scholar] [CrossRef] [PubMed]
  53. Bottenus, D.; Jubery, T.Z.; Ouyang, Y.; Dong, W.-J.; Dutta, P.; Ivory, C.F. 10,000-fold concentration increase of the biomarker cardiac troponin I in a reducing union microfluidic chip using cationic isotachophoresis. Lab Chip 2011, 11, 890. [Google Scholar] [CrossRef] [PubMed]
  54. Jacroux, T.; Bottenus, D.; Rieck, B.; Ivory, C.F.; Dong, W.J. Cationic isotachophoresis separation of the biomarker cardiac troponin I from a high-abundance contaminant, serum albumin. Electrophoresis 2014, 35, 2029–2038. [Google Scholar] [CrossRef] [PubMed]
  55. Shintaku, H.; Nishikii, H.; Marshall, L.A.; Kotera, H.; Santiago, J.G. On-chip separation and analysis of RNA and DNA from single cells. Anal. Chem. 2014, 86, 1953–1957. [Google Scholar] [CrossRef] [PubMed]
  56. Kuriyama, K.; Shintaku, H.; Santiago, J.G. Isotachophoresis for fractionation and recovery of cytoplasmic RNA and nucleus from single cells. Electrophoresis 2015, 36, 1658–1662. [Google Scholar] [CrossRef] [PubMed]
  57. Shintaku, H.; Palko, J.W.; Sanders, G.M.; Santiago, J.G. Increasing hybridization rate and sensitivity of bead-based assays using isotachophoresis. Angew. Chem. 2014, 53, 13813–13816. [Google Scholar] [CrossRef] [PubMed]
  58. Han, C.M.; Katilius, E.; Santiago, J.G. Increasing hybridization rate and sensitivity of DNA microarrays using isotachophoresis. Lab Chip 2014, 14, 2958–2967. [Google Scholar] [CrossRef] [PubMed]
  59. Marshall, L.A.; Rogacs, A.; Meinhart, C.D.; Santiago, J.G. An injection molded microchip for nucleic acid purification from 25 microliter samples using isotachophoresis. J. Chromatogr. A 2014, 1331, 139–142. [Google Scholar] [CrossRef] [PubMed]
  60. Bahga, S.S.; Chambers, R.D.; Santiago, J.G. Coupled isotachophoretic preconcentration and electrophoretic separation using bidirectional isotachophoresis. Anal. Chem. 2011, 83, 6154–6162. [Google Scholar] [CrossRef] [PubMed]
  61. Bahga, S.S.; Santiago, J.G. Concentration cascade of leading electrolyte using bidirectional isotachophoresis. Electrophoresis 2012, 33, 1048–1059. [Google Scholar] [CrossRef] [PubMed]
  62. Qu, Y.; Marshall, L.A.; Santiago, J.G. Simultaneous purification and fractionation of nucleic acids and proteins from complex samples using bidirectional isotachophoresis. Anal. Chem. 2014, 86, 7264–7268. [Google Scholar] [CrossRef] [PubMed]
  63. Rosenfeld, T.; Bercovici, M. 1000-fold sample focusing on paper-based microfluidic devices. Lab Chip 2014, 14, 4465–4474. [Google Scholar] [CrossRef] [PubMed]
  64. Moghadam, B.Y.; Connelly, K.T.; Posner, J.D. Isotachophoretic preconcenetration on paper-based microfluidic devices. Anal. Chem. 2014, 86, 5829–5837. [Google Scholar] [CrossRef] [PubMed]
  65. Smejkal, P.; Breadmore, M.C.; Guijt, R.M.; Foret, F.; Bek, F.; Macka, M. Isotachophoresis on a chip with indirect fluorescence detection as a field deployable system for analysis of carboxylic acids. Electrophoresis 2012, 33, 3166–3172. [Google Scholar] [CrossRef] [PubMed]
  66. Smejkal, P.; Breadmore, M.C.; Guijt, R.M.; Grym, J.; Foret, F.; Bek, F.; Macka, M. Separation of carboxylic acids in human serum by isotachophoresis using a commercial field-deployable analytical platform combined with in-house glass microfluidic chips. Anal. Chim. Acta 2012, 755, 115–120. [Google Scholar] [CrossRef] [PubMed]
  67. Smejkal, P.; Breadmore, M.C.; Guijt, R.M.; Foret, F.; Bek, F.; Macka, M. Analytical isotachophoresis of lactate in human serum using dry film photoresist microfluidic chips compatible with a commercially available field-deployable instrument platform. Anal. Chim. Acta 2013, 803, 135–142. [Google Scholar] [CrossRef] [PubMed]
  68. Greenlee, R.D.; Ivory, C.F. Protein focusing in a conductivity gradient. Biotechnol. Prog. 1998, 14, 300–309. [Google Scholar] [CrossRef] [PubMed]
  69. Inglis, D.W.; Goldys, E.M.; Calander, N.P. Simultaneous concentration and separation of proteins in a nanochannel. Angew. Chem. 2011, 50, 7546–7550. [Google Scholar] [CrossRef] [PubMed]
  70. Hsu, W.L.; Inglis, D.W.; Jeong, H.; Dunstan, D.E.; Davidson, M.R.; Goldys, E.M.; Harvie, D.J. Stationary chemical gradients for concentration gradient-based separation and focusing in nanofluidic channels. Langmuir ACS J. Surfaces Coll. 2014, 30, 5337–5348. [Google Scholar] [CrossRef] [PubMed]
  71. Hsu, W.L.; Harvie, D.J.; Davidson, M.R.; Jeong, H.; Goldys, E.M.; Inglis, D.W. Concentration gradient focusing and separation in a silica nanofluidic channel with a non-uniform electroosmotic flow. Lab Chip 2014, 14, 3539–3549. [Google Scholar] [CrossRef] [PubMed]
  72. Koegler, W.S.; Ivory, C.F. Focusing proteins in an electric field gradient. J. Chromatogr. A 1996, 726, 229–236. [Google Scholar] [CrossRef]
  73. Burke, J.M.; Ivory, C.F. Characterization of voltage degradation in dynamic field gradient focusing. Electrophoresis 2008, 29, 1013–1025. [Google Scholar] [CrossRef] [PubMed]
  74. Tracy, N.I.; Huang, Z.; Ivory, C.F. Design and construction of a preparative-scale dynamic field gradient focusing apparatus. Biotechnol. Prog. 2008, 24, 444–451. [Google Scholar] [CrossRef] [PubMed]
  75. Tracy, N.I.; Ivory, C.F. Protein separation using preparative-scale dynamic field gradient focusing. Electrophoresis 2008, 29, 2820–2827. [Google Scholar] [CrossRef] [PubMed]
  76. Humble, P.H.; Kelly, R.T.; Woolley, A.T.; Tolley, H.D.; Lee, M.L. Electric field gradient focusing of proteins based on shaped ionically conductive acrylic polymer. Anal. Chem. 2004, 76, 5641–5648. [Google Scholar] [CrossRef] [PubMed]
  77. Liu, J.; Sun, X.; Farnsworth, P.B.; Lee, M.L. Fabrication of conductive membrane in a polymeric electric field gradient focusing microdevice. Anal. Chem. 2006, 78, 4654–4662. [Google Scholar] [CrossRef] [PubMed]
  78. Sun, X.; Farnsworth, P.B.; Woolley, A.T.; Tolley, H.D.; Warnick, K.F.; Lee, M.L. Poly(ethylene glycol)-functionalized devices for electric field gradient focusing. Anal. Chem. 2008, 80, 451–460. [Google Scholar] [CrossRef] [PubMed]
  79. Sun, X.; Farnsworth, P.B.; Tolley, H.D.; Warnick, K.F.; Woolley, A.T.; Lee, M.L. Performance optimization in electric field gradient focusing. J. Chromatogr. A 2009, 1216, 159–164. [Google Scholar] [CrossRef] [PubMed]
  80. Sun, X.; Li, D.; Woolley, A.T.; Farnsworth, P.B.; Tolley, H.D.; Warnick, K.F.; Lee, M.L. Bilinear electric field gradient focusing. J. Chromatogr. A 2009, 1216, 6532–6538. [Google Scholar] [CrossRef] [PubMed]
  81. Trickett, C.A.; Henderson, R.D.; Guijt, R.M.; Breadmore, M.C. Electric field gradient focusing using a variable width polyaniline electrode. Electrophoresis 2012, 33, 3254–3258. [Google Scholar] [CrossRef] [PubMed]
  82. Shameli, S.M.; Glawdel, T.; Ren, C.L. Model of separation performance of bilinear gradients in scanning format counter-flow gradient electrofocusing techniques. Electrophoresis 2015, 36, 668–674. [Google Scholar] [CrossRef] [PubMed]
  83. Burke, J.M.; Ivory, C.F. Influence of the semi-permeable membrane on the performance of dynamic field gradient focusing. Electrophoresis 2010, 31, 893–901. [Google Scholar] [CrossRef] [PubMed]
  84. Burke, J.M.; Smith, C.D.; Ivory, C.F. Development of a membrane-less dynamic field gradient focusing device for the separation of low-molecular-weight molecules. Electrophoresis 2010, 31, 902–909. [Google Scholar] [CrossRef] [PubMed]
  85. Shackman, J.G.; Munson, M.S.; Ross, D. Gradient elution moving boundary electrophoresis for high-throughput multiplexed microfluidic devices. Anal. Chem. 2007, 79, 565–571. [Google Scholar] [CrossRef] [PubMed]
  86. Strychalski, E.A.; Henry, A.C.; Ross, D. Microfluidic analysis of complex samples with minimal sample preparation using gradient elution moving boundary electrophoresis. Anal. Chem. 2009, 81, 10201–10207. [Google Scholar] [CrossRef] [PubMed]
  87. Strychalski, E.A.; Henry, A.C.; Ross, D. Expanding the capabilities of microfluidic gradient elution moving boundary electrophoresis for complex samples. Anal. Chem. 2011, 83, 6316–6322. [Google Scholar] [CrossRef] [PubMed]
  88. Sikorsky, A.A.; Fourkas, J.T.; Ross, D. Gradient elution moving boundary electrophoresis with field-amplified continuous sample injection. Anal. Chem. 2014, 86, 3625–3632. [Google Scholar] [CrossRef] [PubMed]
  89. Polson, N.A.; Savin, D.P.; Hayes, M.A. Electrophoretic focusing preconcentration technique using a continuous buffer system for capillary electrophoresis. J. Microcolumn Sep. 2000, 12, 98–106. [Google Scholar] [CrossRef]
  90. Meighan, M.M.; Keebaugh, M.W.; Quihuis, A.M.; Kenyon, S.M.; Hayes, M.A. Electrophoretic exclusion for the selective transport of small molecules. Electrophoresis 2009, 30, 3786–3792. [Google Scholar] [CrossRef] [PubMed]
  91. Meighan, M.M.; Vasquez, J.; Dziubcynski, L.; Hews, S.; Hayes, M.A. Investigation of electrophoretic exclusion method for the concentration and differentiation of proteins. Anal. Chem. 2011, 83, 368–373. [Google Scholar] [CrossRef] [PubMed]
  92. Kenyon, S.M.; Weiss, N.G.; Hayes, M.A. Using electrophoretic exclusion to manipulate small molecules and particles on a microdevice. Electrophoresis 2012, 33, 1227–1235. [Google Scholar] [CrossRef] [PubMed]
  93. Kenyon, S.M.; Keebaugh, M.W.; Hayes, M.A. Development of the resolution theory for electrophoretic exclusion. Electrophoresis 2014, 35, 2551–2559. [Google Scholar] [CrossRef] [PubMed]
  94. Zhu, F.; Hayes, M.A. Simulation and experiment of asymmetric electrode placement for electrophoretic exclusion in a microdevice. Electrophoresis 2016. in revision. [Google Scholar]
  95. Balss, K.M.; Vreeland, W.N.; Phinney, K.W.; Ross, D. Simultaneous concentration and separation of enantiomers with chiral temperature gradient focusing. Anal. Chem. 2004, 76, 7243–7249. [Google Scholar] [CrossRef] [PubMed]
  96. Hoebel, S.J.; Balss, K.M.; Jones, B.J.; Malliaris, C.D.; Munson, M.S.; Vreeland, W.N.; Ross, D. Scanning temperature gradient focusing. Anal. Chem. 2006, 78, 7186–7190. [Google Scholar] [CrossRef] [PubMed]
  97. Shackman, J.G.; Munson, M.S.; Ross, D. Temperature gradient focusing for microchannel separations. Anal. Bioanal. Chem. 2007, 387, 155–158. [Google Scholar] [CrossRef] [PubMed]
  98. Kim, S.M.; Sommer, G.J.; Burns, M.A.; Hasselbrink, E.F. Low-power concentration and separation using temperature gradient focusing via Joule heating. Anal. Chem. 2006, 78, 8028–8035. [Google Scholar] [CrossRef] [PubMed]
  99. Sommer, G.J.; Kim, S.M.; Littrell, R.J.; Hasselbrink, E.F. Theoretical and numerical analysis of temperature gradient focusing via Joule heating. Lab Chip 2007, 7, 898–907. [Google Scholar] [CrossRef] [PubMed]
  100. Ge, Z.; Yang, C.; Tang, G. Concentration enhancement of sample solutes in a sudden expansion microchannel with Joule heating. Int. J. Heat Mass Transf. 2010, 53, 2722–2731. [Google Scholar] [CrossRef]
  101. Ge, Z.; Wang, W.; Yang, C. Towards high concentration enhancement of microfluidic temperature gradient focusing of sample solutes using combined AC and DC field induced Joule heating. Lab Chip 2011, 11, 1396–1402. [Google Scholar] [CrossRef] [PubMed]
  102. Ge, Z.; Wang, W.; Yang, C. Rapid concentration of deoxyribonucleic acid via Joule heating induced temperature gradient focusing in poly-dimethylsiloxane microfluidic channel. Anal. Chim. Acta 2015, 858, 91–97. [Google Scholar] [CrossRef] [PubMed]
  103. Matsui, T.; Franzke, J.; Manz, A.; Janasek, D. Temperature gradient focusing in a PDMS/glass hybrid microfluidic chip. Electrophoresis 2007, 28, 4606–4611. [Google Scholar] [CrossRef] [PubMed]
  104. Zhang, H.D.; Zhou, J.; Xu, Z.R.; Song, J.; Dai, J.; Fang, J.; Fang, Z.L. DNA mutation detection with chip-based temperature gradient capillary electrophoresis using a slantwise radiative heating system. Lab Chip 2007, 7, 1162–1170. [Google Scholar] [CrossRef] [PubMed]
  105. Akbari, M.; Bahrami, M.; Sinton, D. Optothermal sample preconcentration and manipulation with temperature gradient focusing. Microfluid. Nanofluid. 2011, 12, 221–228. [Google Scholar] [CrossRef]
  106. Gao, M.; Gui, L.; Liu, J. Study of liquid-metal based heating method for temperature gradient focusing purpose. J. Heat Transf. 2013, 135, 091402. [Google Scholar] [CrossRef]
  107. Shameli, S.M.; Glawdel, T.; Fernand, V.E.; Ren, C.L. Micellar affinity gradient focusing in a microfluidic chip with integrated bilinear temperature gradients. Electrophoresis 2012, 33, 2703–2710. [Google Scholar] [CrossRef] [PubMed]
  108. Shameli, S.M.; Glawdel, T.; Liu, Z.; Ren, C.L. Bilinear temperature gradient focusing in a hybrid PDMS/glass microfluidic chip integrated with planar heaters for generating temperature gradients. Anal. Chem. 2012, 84, 2968–2973. [Google Scholar] [CrossRef] [PubMed]
  109. Holtzel, A.; Tallarek, U. Ionic conductance of nanopores in microscale analysis systems: Where microfluidics meets nanofluidics. J. Sep. Sci. 2007, 30, 1398–1419. [Google Scholar] [CrossRef] [PubMed]
  110. Kuo, T.C.; Cannon, D.M.; Shannon, M.A.; Bohn, P.W.; Sweedler, J.V. Hybrid three-dimensional nanofluidic, microfluidic devices using molecular gates. Sens. Actuators A 2003, 102, 223–233. [Google Scholar] [CrossRef]
  111. Kuo, T.C.; Cannon, D.M.; Chen, Y.; Tulock, J.J.; Shannon, M.A.; Sweedler, J.V.; Bohn, P.W. Gateable nanofluidic interconnects for multilayered microfluidic separation systems. Anal. Chem. 2003, 75, 1861–1867. [Google Scholar] [CrossRef] [PubMed]
  112. Kim, S.J.; Ko, S.H.; Kang, K.H.; Han, J. Direct seawater desalination by ion concentration polarization. Nat. Nanotechnol. 2010, 5, 297–301. [Google Scholar] [CrossRef] [PubMed]
  113. Kwak, R.; Kim, S.J.; Han, J. Continuous-flow biomolecule and cell concentrator by ion concentration polarization. Anal. Chem. 2011, 83, 7348–7355. [Google Scholar] [CrossRef] [PubMed]
  114. Jeon, H.; Lee, H.; Kang, K.H.; Lim, G. Ion concentration polarization-based continuous separation device using electrical repulsion in the depletion region. Sci. Rep. 2013, 3, 3483. [Google Scholar] [CrossRef] [PubMed]
  115. MacDonald, B.D.; Gong, M.M.; Zhang, P.; Sinton, D. Out-of-plane ion concentration polarization for scalable water desalination. Lab Chip 2014, 14, 681–685. [Google Scholar] [CrossRef] [PubMed]
  116. Ko, S.H.; Song, Y.A.; Kim, S.J.; Kim, M.; Han, J.; Kang, K.H. Nanofluidic preconcentration device in a straight microchannel using ion concentration polarization. Lab Chip 2012, 12, 4472–4482. [Google Scholar] [CrossRef] [PubMed]
  117. Kim, M.; Jia, M.; Kim, T. Ion concentration polarization in a single and open microchannel induced by a surface-patterned perm-selective film. Analyst 2013, 138, 1370–1378. [Google Scholar] [CrossRef] [PubMed] [Green Version]
  118. Jia, M.; Kim, T. Multiphysics simulation of ion concentration polarization induced by nanoporous membranes in dual channel devices. Anal. Chem. 2014, 86, 7360–7367. [Google Scholar] [CrossRef] [PubMed]
  119. Scarff, B.; Escobedo, C.; Sinton, D. Radial sample preconcentration. Lab Chip 2011, 11, 1102–1109. [Google Scholar] [CrossRef] [PubMed]
  120. Yang, R.J.; Pu, H.H.; Wang, H.L. Ion concentration polarization on paper-based microfluidic devices and its application to preconcentrate dilute sample solutions. Biomicrofluidics 2015, 9, 014122. [Google Scholar] [CrossRef] [PubMed]
  121. Yuan, X.; Renaud, L.; Audry, M.C.; Kleimann, P. Electrokinetic biomolecule preconcentration using xurography-based micro-nano-micro fluidic devices. Anal. Chem. 2015, 87, 8695–8701. [Google Scholar] [CrossRef] [PubMed]
  122. Dhopeshwarkar, R.; Hlushkou, D.; Nguyen, M.; Tallarek, U.; Crooks, R.M. Electrokinetics in microfluidic channels containing a floating electrode. J. Am. Chem. Soc. 2008, 130, 10480–10481. [Google Scholar] [CrossRef] [PubMed]
  123. Hlushkou, D.; Perdue, R.K.; Dhopeshwarkar, R.; Crooks, R.M.; Tallarek, U. Electric field gradient focusing in microchannels with embedded bipolar electrode. Lab Chip 2009, 9, 1903–1913. [Google Scholar] [CrossRef] [PubMed]
  124. Laws, D.R.; Hlushkou, D.; Perdue, R.K.; Tallarek, U.; Crooks, R.M. Bipolar electrode focusing simultaneous: Concentration enrichment and separation in a microfluidic channel containing a bipolar electrode. Anal. Chem. 2009, 81, 8923–8929. [Google Scholar] [CrossRef] [PubMed]
  125. Perdue, R.K.; Laws, D.R.; Hlushkou, D.; Tallarek, U.; Crooks, R.M. Bipolar electrode focusing the effect of current and electric field on concentration enrichment. Anal. Chem. 2009, 81, 10149–10155. [Google Scholar] [CrossRef] [PubMed]
  126. Anand, R.K.; Sheridan, E.; Hlushkou, D.; Tallarek, U.; Crooks, R.M. Bipolar electrode focusing: Tuning the electric field gradient. Lab Chip 2011, 11, 518–527. [Google Scholar] [CrossRef] [PubMed]
  127. Sheridan, E.; Hlushkou, D.; Knust, K.N.; Tallarek, U.; Crooks, R.M. Enrichment of cations via bipolar electrode focusing. Anal. Chem. 2012, 84, 7393–7399. [Google Scholar] [CrossRef] [PubMed]
  128. Sheridan, E.; Knust, K.N.; Crooks, R.M. Bipolar electrode depletion: Membraneless filtration of charged species using an electrogenerated electric field gradient. Analyst 2011, 136, 4134–4137. [Google Scholar] [CrossRef] [PubMed]
  129. Anand, R.K.; Sheridan, E.; Knust, K.N.; Crooks, R.M. Bipolar electrode focusing: Faradaic ion concentration polarization. Anal. Chem. 2011, 83, 2351–2358. [Google Scholar] [CrossRef] [PubMed]
  130. Knust, K.N.; Sheridan, E.; Anand, R.K.; Crooks, R.M. Dual-channel bipolar electrode focusing: Simultaneous separation and enrichment of both anions and cations. Lab Chip 2012, 12, 4107–4114. [Google Scholar] [CrossRef] [PubMed]
  131. Song, H.; Wang, Y.; Garson, C.; Pant, K. Concurrent DNA preconcentration and separation in bipolar electrode-based microfluidic device. Anal. Methods Adv. Methods Appl. 2015, 7, 1273–1279. [Google Scholar] [CrossRef] [PubMed]
Figure 1. A schematic showing the basic principle of field-amplified sample stacking. Reprinted with permission from Bharadwaj et al. [16]. Copyright 2005 Cambridge University Press, 2005.
Separations 03 00012 g001
Figure 2. The schematics of reduction (up: 50× adapted from Bottenus et al. [52]. Copyright 2011 Wiley Online Library, 2011; down: 100× adapted from Bottenus et al. [53]. Copyright 2011 Royal Society of Chemistry, 2011.) cross-sectional area PMMA ITP microdevices for cTnI concentration from Ivory’s group. When samples passed through the reduction area, the sample concentration increased based on the reduction ratio.
Separations 03 00012 g002
Figure 3. Four promising ITP devices from Santiago’s group. Top left: Most typical design that has been used for DNA and/or RNA extraction by their group. Reprinted with permission from Rogacs et al. [24]. Copyright 2012 American Chemical Society, 2012. Top right: The modified version with branches facilitating sample loading. Reprinted with permission from Shintaku et al. [55]. Copyright 2014 American Chemical Society, 2014. Bottom left: Two identical-shaped compartments for ITP and capture. Adapted from Han et al. [58]. Copyright 2014 Royal Society of Chemistry, 2014. Bottom right: Long wind channel for high performance ITP separation of DNA samples. Adapted from Marshall et al. [59]. Copyright 2014 Elsevier, 2014.
Separations 03 00012 g003
Figure 4. A schematic of conductivity gradient focusing from Ivory’s group. Adapted from Greenlee et al. [68]. Copyright 2007 Wiley Online Library, 2007.
Separations 03 00012 g004
Figure 5. A universal schematic of counterflow electric field gradient focusing strategies. Adapted from Shackman et al. [40]. Copyright 2007 Wiley Online Library, 2007.
Separations 03 00012 g005
Figure 6. Schematics of two electric field gradient focusing techniques. Right: A horn-shaped design from Lee’s group. The device was fabricated with poly(ethylene glycol) (PEG)-functionalized acrylic plastic to reduce protein adsorption. Moreover, the PEG-functionalized monolith was incorporated in the device to reduce dispersion. Reprinted with permission from Sun et al. [78]. Copyright 2008 American Chemical Society, 2008. Left: A variable-width PANI electrode design from Breadmore’s group. The dark-green area in the picture was made of PANI electrode with variable width. Adapted from Trickett et al. [81]. Copyright 2012 Wiley Online Library, 2012.
Separations 03 00012 g006
Figure 7. Two common schematics for temperature gradient focusing. Left: Ross and coworkers’ design using external heating/cooling equipment for temperature gradient generation [96]. Copyright 2006 American Chemical Society, 2006. Right: Yang’s work by using electroosmotic flow with a sudden expansion design for creating temperature gradient. Adapted from Ge et al. [101]. Copyright 2015 Royal Society of Chemistry, 2015.
Separations 03 00012 g007
Figure 8. Different strategies for creating temperature gradient through an internal heater. Top left: Peltier elements were incorporated into the device, and applied by different temperatures. The area between two elements formed the temperature gradient. Adapted from Matsui et al. [103]. Copyright 2007 Wiley Online Library, 2007. Top right: A slantwise radiative heater was tilted and generated an angle with the plate, and the temperature gradient was generated along the channel. Adapted from Zhang et al. [104]. Copyright 2007 Royal Society of Chemistry, 2007. Bottom left: The heated area was generated through the precise projection of a pattern onto the surface of the microdevice. Adapted from Akbari et al. [105]. Copyright 2011 SpringerLink, 2011. Bottom right: Liquid metal was filled in the channel of microdevice for generating temperature gradient. Adapted from Gao et al. [106]. Copyright 2013 The American Society of Mechanical Engineers, 2013.
Separations 03 00012 g008
Figure 9. Various ICP devices. Top left: Seawater purification device from Han’s group. Reprinted by permission from Macmillan Publishers Ltd: [Nature Nanotechnology] (Kim et al.) [112], copyright (2010). Top middle: Tilted Nafion membrane for particle sorting from Kang’s group. Reprinted by permission from Macmillan Publishers Ltd: [Scientific reports] (Jeon et al.) [114], copyright (2013). Top right: Single channel ICP. Adapted from Ko et al. [116]. Copyright 2012 Royal Society of Chemistry, 2012. Bottom left: Out-of-plane ICP for purification of seawater from Sinton’s group. Adapted from MacDonald et al. [115]. Copyright 2014 Royal Society of Chemistry, 2014. Bottom middle and right: Radial concentration from Sinton’s group. Adapted from Scarff et al. [119]. Copyright 2011 Royal Society of Chemistry, 2011.
Separations 03 00012 g009
Table 1. A comparison between field-amplified sample stacking (FASS) and isotachophoresis (ITP).
TechniquesFASSITP
Mobility requirementBackground electrolyte (BGE), sample (S), usually μBGE ≥ 10 μSLeading electrolyte (LE), terminating electrolyte (TE), sample (S), μTE < μS < μLE
Governing equations C i t + u C i = z i v i F ( C i E ) + D i 2 C i , Ci is the concentration of ionic species i, Di is the molar diffusivity of species i, νi is the electromigration mobility, zi is the valence number, F is Faraday’s constant, u is the fluid velocity, and E is electric field; solution is approximately electrically neutral (except EDL); modified Stokes equation; a slip surface [16]. C i t + α u C i = v i ( C i E ) + 1 P e D i 2 C i , Ci is the molar concentration of ion i, νi is the electrophoretic mobility, E is the electric field, and Di is the diffusion coefficient, Pe = E 0 v 0 δ / D 0 , α = ϵ ζ 0 / ( μ v 0 ) (µ is viscosity, ζ0 is zeta potential, and δ is the length of stacked sample zone); EOF suppressed; diffusion dominates [48].
Concentration enhancementBased on the ratio of electric field in the sample and the BGE regions C s t a c k e d C I n i t i a l = E S E B G E , up to 1100-fold [43].Derived from Kohlrausch regulating function (KRF) C S a m p l e p l a t e a u = Z L E ( | ω L E | + | ω C o u n t e r i o n | ) ω S a m p l e Z S a m p l e ( | ω S a m p l e | + | ω C o u n t e r i o n | ) ω L E C L E Z, ω, C are charge, mobility, concentration respectively, up to 100,000 -fold [48].
Coupled techniquesMass spectroscopy [44], amperometry [47], ELISA [45], MEKC [46]…GEITP [28], FFITP [49], EKS [50], CZE [51]…
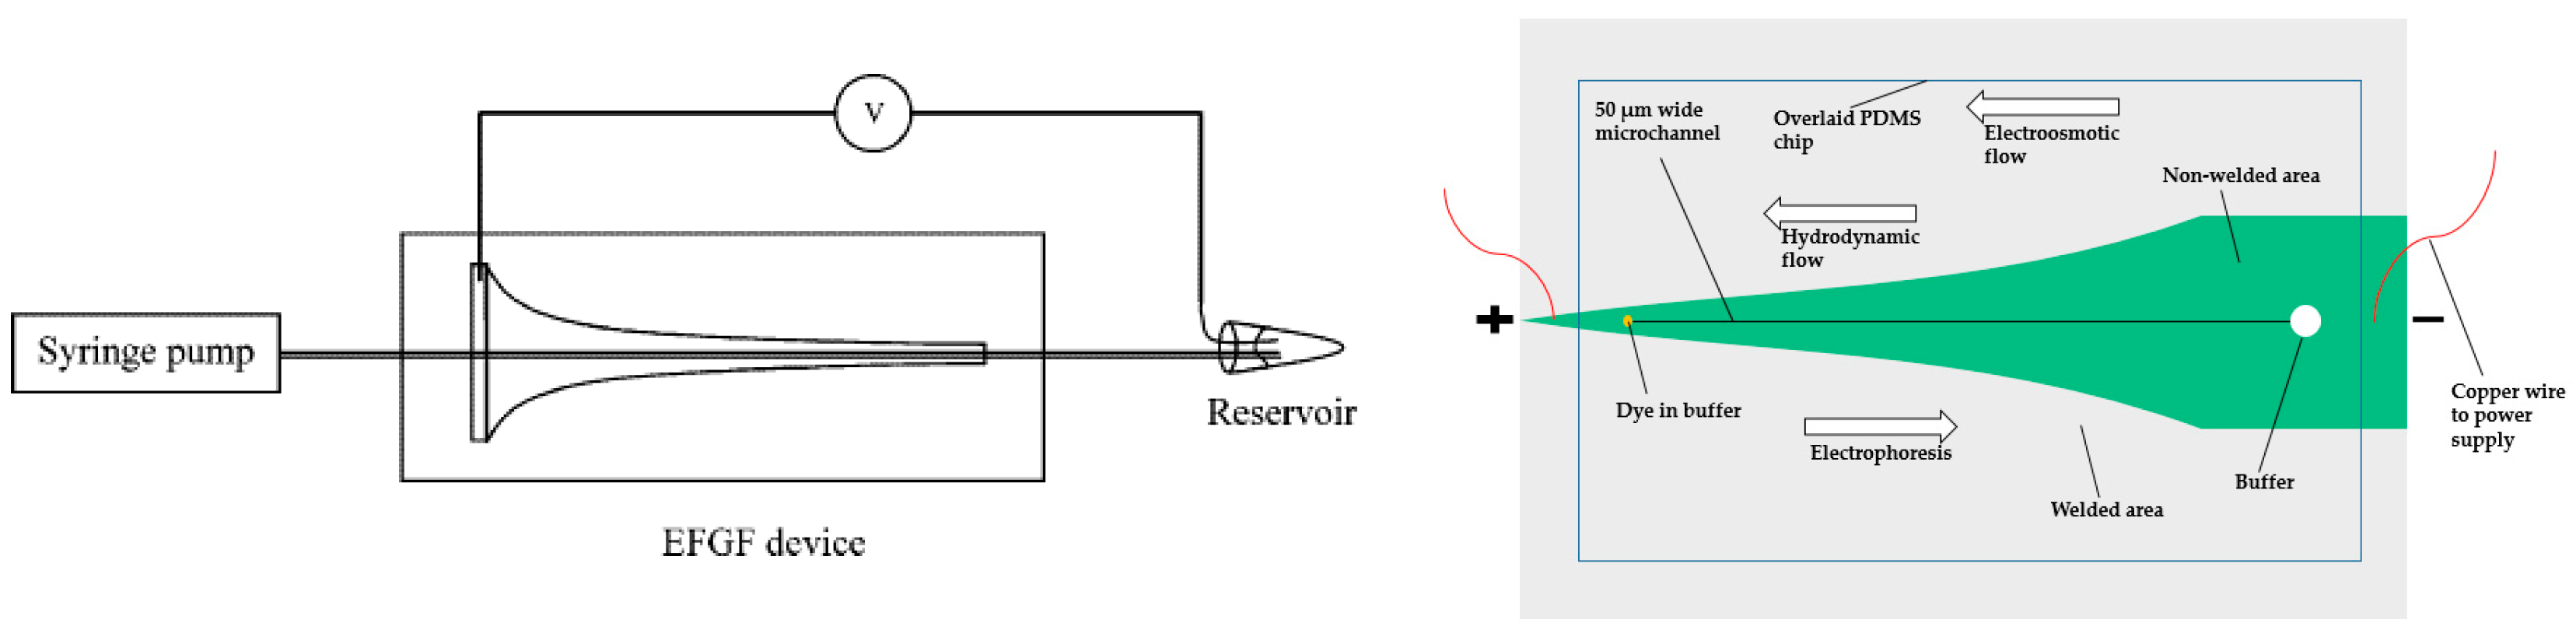
Table 2. A brief comparison between four common counterflow gradient focusing strategies.
TechniquesEFGF-Ivory [36,72]EFGF-Lee [76,77,78,79,80]GEMBE [85,86,87,88]EE [90,91,92,94]
ForcesElectrophoretic force, constant convective forceElectrophoretic force, constant bulk fluid flowBulk flow swept from high to low, electrophoretic migration constantHydrodynamic flow, electrophoretic velocity
Sample injectionA sample loopElectrokinetic injection or pumpedContinuous introductionPipetting small volume or syringe pump
Pressure controlA back-pressure regulatorA syringe pumpA precision pressure controllerA rotatable board or syringe pump
Electric field gradient establishmentA shaped chamberA horn-shaped chamberDistal electrode and standard CE capillaryElectrode and sudden expansion channel-reservoir interface
EOF controlNot mentionedSuppressed with poly(vinyl alcohol) coating the capillary wallCoating DDAB on capillary surfaceSuppressed with low pH buffer or polyimide
Detection methodUV detectorLaser-induced fluorescence detectionFluorescence microscope, current, C4DFluorescence microscope
Concentration degree2~3-fold in ~7 hUp to 14,000-fold in 60 min (bilinear)110× with a conductivity ratio of 8.211200 times in 60 s (bench-top), estimated more than 10-fold in 30 s (microdevice)

