Preliminary to the online coupling of the A4F multidetector platform with MPS for the simultaneous analysis of MNP size, concentration, and magnetism, the performance of the MPS with respect to sensitivity and applicability under flow conditions was thoroughly tested. The MPS online detection was finally performed using pre-defined appropriate parameters and conditions.
3.1. Influence of MNP Structure
MPS measurements (
Bexc = 25 mT,
tavg = 1 s) on a set of different MNP types of the same iron concentration (
c(Fe) = 5.6 mg/mL,
V = 50 µL) clearly demonstrate that the MNP signal performance is strongly affected by differences in structural and magnetic properties (e.g.,
Rhyd,
Ms,
µ) resulting in rich harmonic spectra with an obviously distinguishable signature (
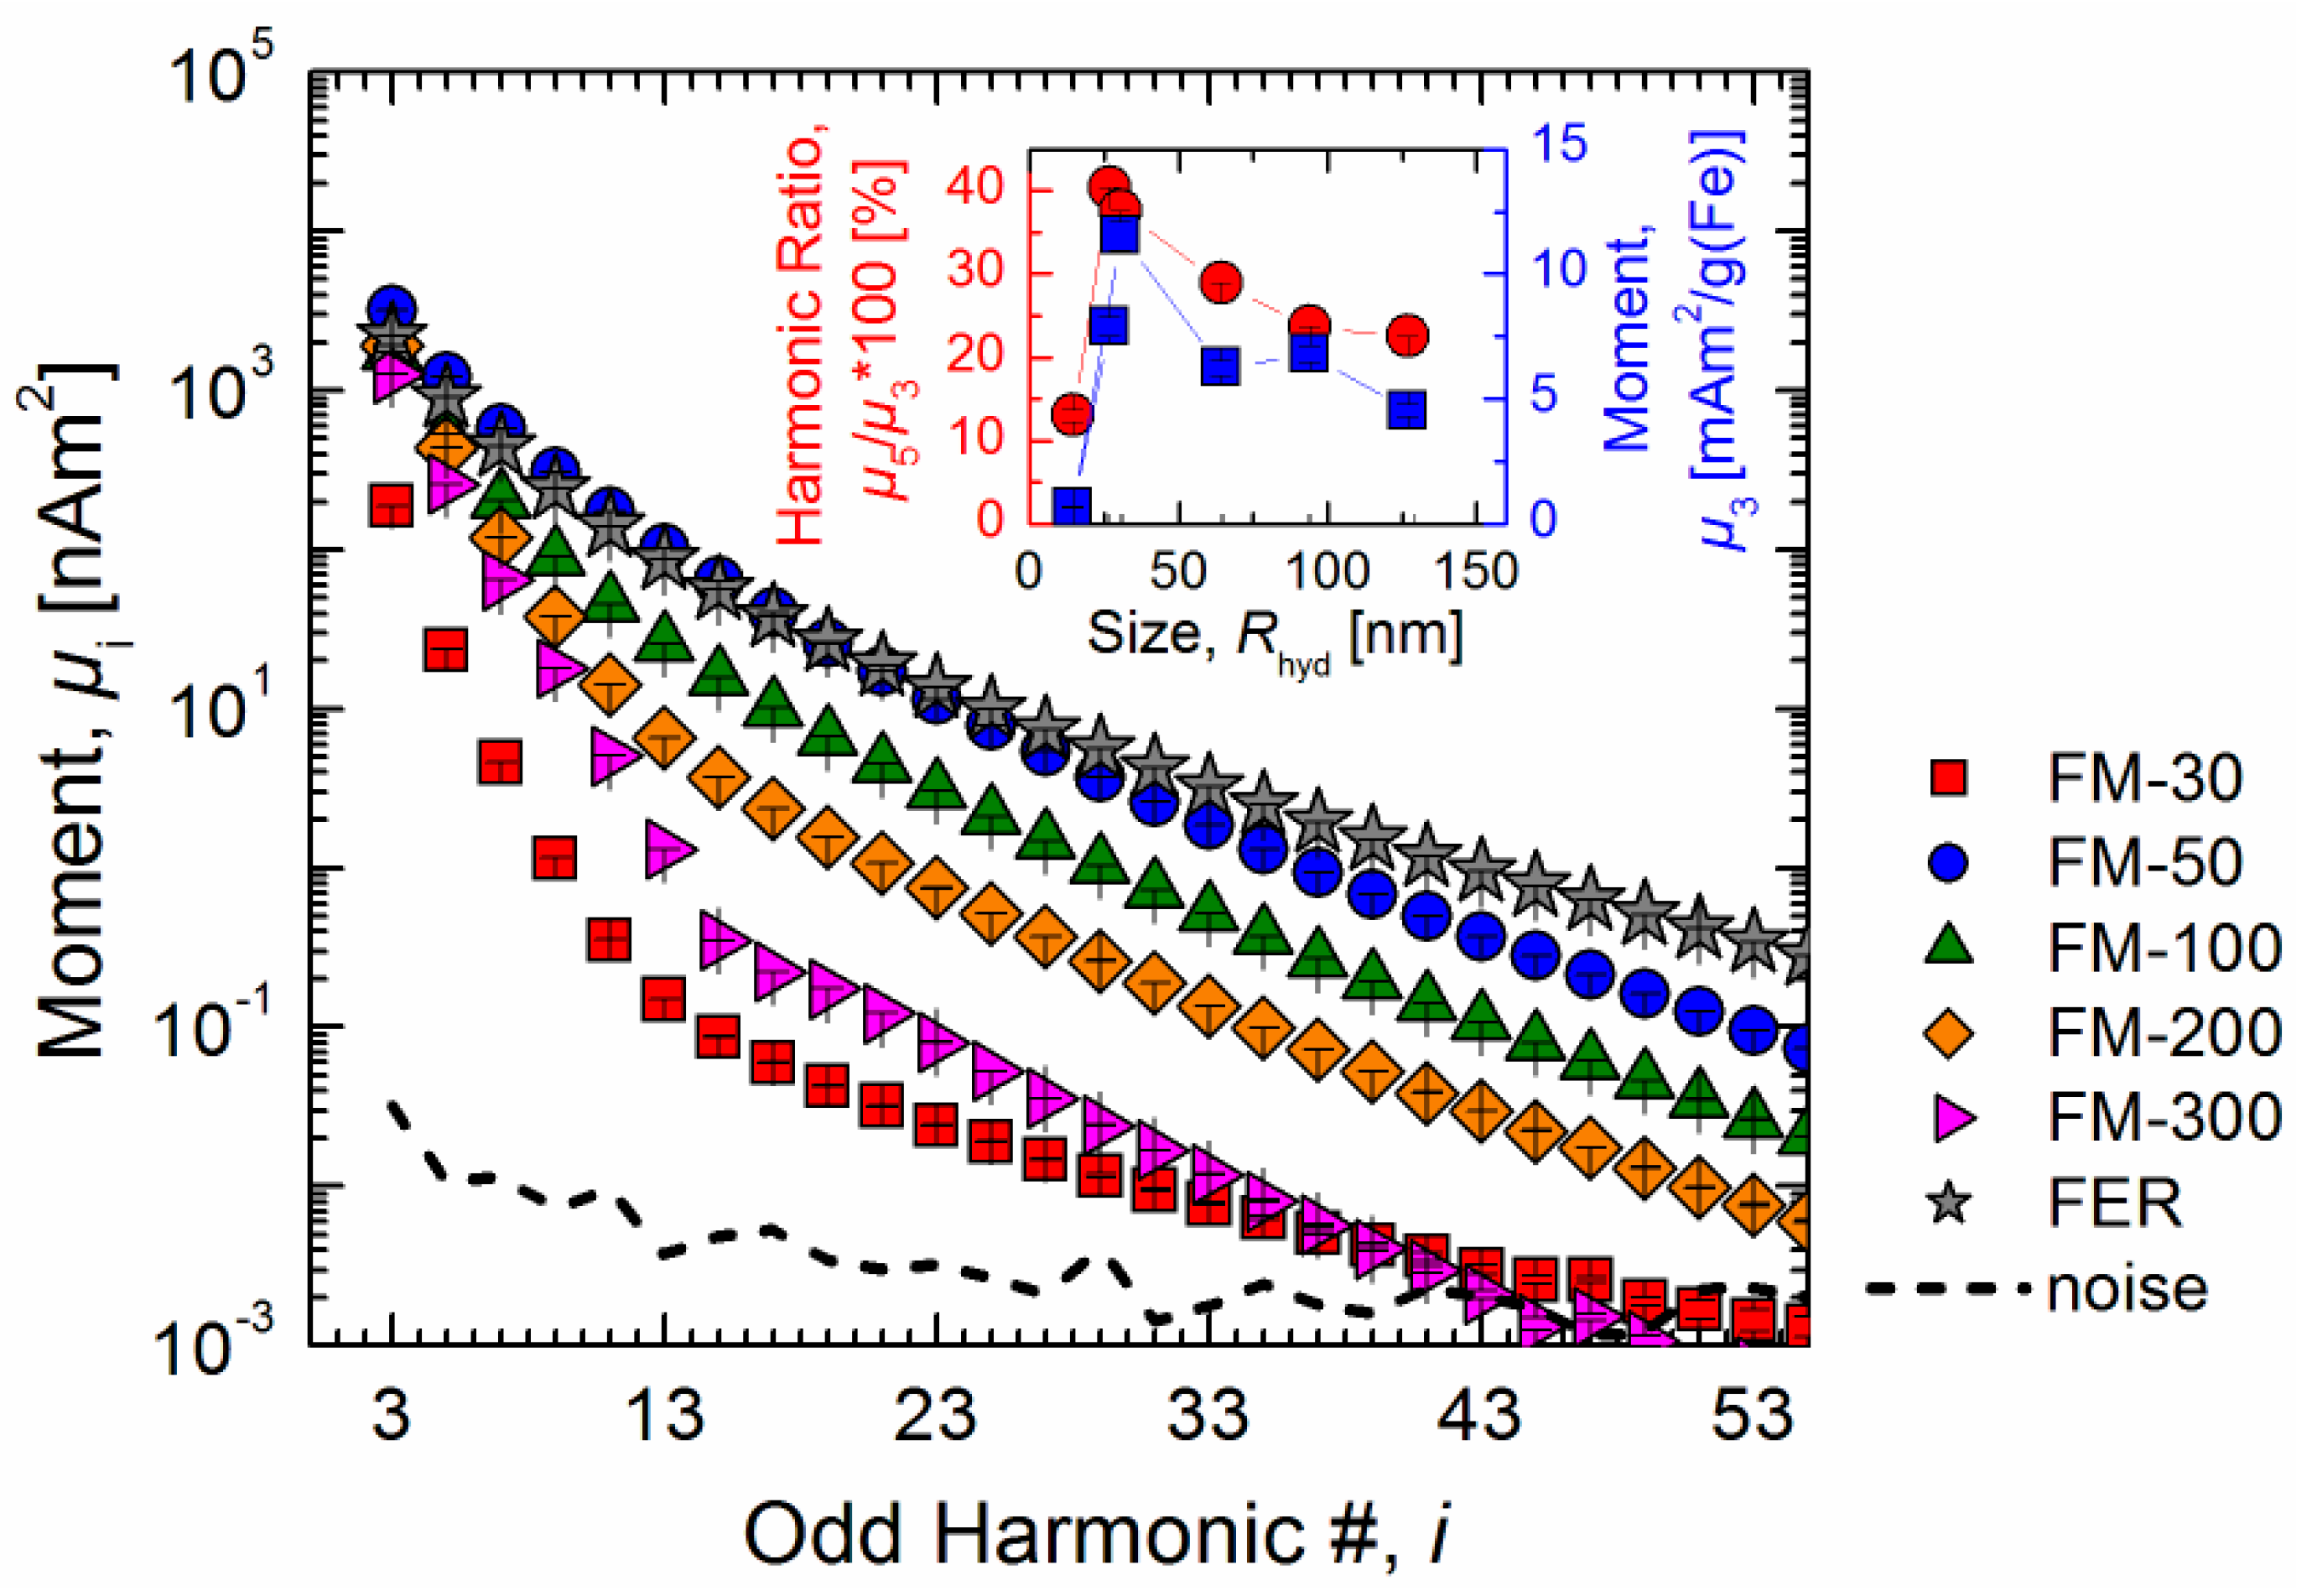
Figure 2). Two commonly used characteristic values of the spectra, the signal intensity of the third harmonic
µ3 and the shape of the spectrum (represented by the ratio of harmonics
µ5/
µ3), discern considerable differences by more than one order of magnitude for the investigated samples ranging from
Rhyd = 14.7 nm up to 127 nm. The maximum values of about 30 nm were found for
Rhyd (see inset of
Figure 2). Moreover, the resulting signal amplitudes are several orders of magnitude above the noise level which can be attributed to the high specificity of the modality. This allows for the magnetic characterization of highly diluted samples which will be further examined.
Figure 2.
MPS batch measurements (Bexc = 25 mT, tavg = 1 s) on several different MNP types of the same iron amount (m(Fe) = 280 µg). For simplicity, solely the amplitudes of the odd harmonics are shown. The noise floor of the MPS spectra (marked by a dashed line) was determined by calculating the standard deviation of 20 consecutive measurements of empty PCR tubes. The inset shows the MPS signal dependence (iron normalized third harmonic amplitude µ3 and shape of the spectrum µ5/µ3) on the hydrodynamic size as determined by DLS of the MNPs, showing a maximum at about Rhyd = 30 nm.
3.2. Influence of Dilution
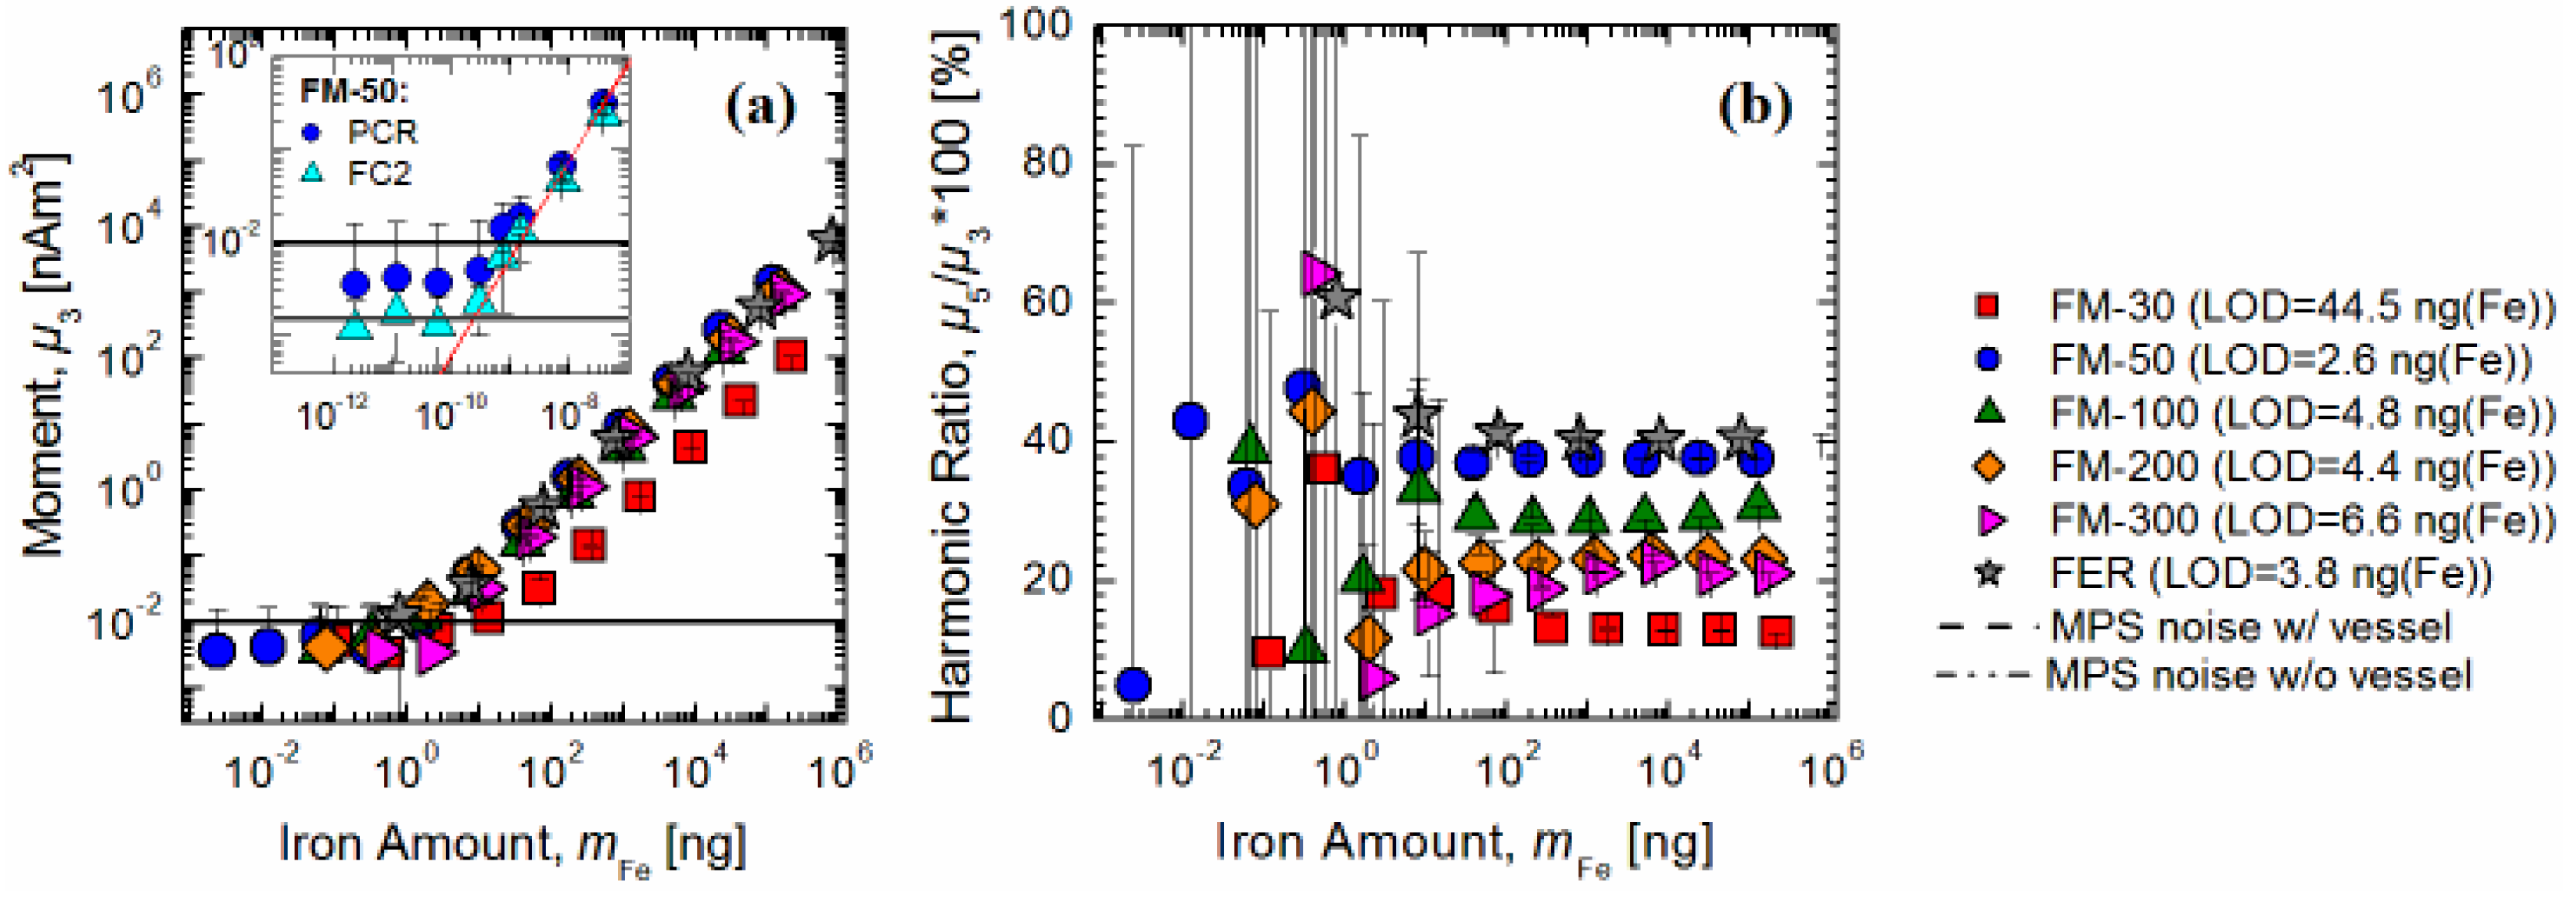
Investigation of the linearity of the MPS signal amplitude and the limit of detection (LOD) at a signal-to-noise ratio (SNR) of three was performed using MPS in batch mode (six different MNP samples in PCR tubes;
Bexc = 25 mT,
tavg = 10 s). Therefore, 16 empty PCR tubes were measured to determine the signal variation of the blank, expressed as the standard variation. The measurement results of the MNP dilution series demonstrate a highly linear correlation (
R2 = 0.9997) between the signal amplitude
µ3 and the iron amount
mFe (see
Figure 3). The wide dynamic range, e.g., from 780 µg down to 3.3 ng for FER, is of particular note.
Figure 3.
MPS batch measurements (Bexc = 25 mT, tavg = 10 s) on serial dilutions of MNPs. (a) The third harmonic amplitude µ3 decreases linearly with the decreasing iron amount of the sample. Depending on MNP properties the limit of detection was between 44.5 ng (FM-30) and 3.4 ng (FM-50). Due to the lower variation of the background signal when using a flow cell, the LOD was further reduced by factor of 10. (b) The shape of the MPS spectra (µ5/µ3) was not affected by dilution with respect to uncertainty. The increasing uncertainties at lower iron concentrations result from the lower signal intensities of µ5 compared to µ3, leading to a lower detection limit of µ5.
Depending on the specified MNP properties, the LOD ranged from 54.7 ng (FM‑30) down to 2.2 ng (FM-50). In contrast, the harmonic ratio µ5/µ3 was completely unaffected by dilution and enabled the distinction of magnetically different particles down to the LOD of µ5, ranging from 252 ng for FM-30 down to 5.6 ng for FM-50.
Additionally, a serial dilution of FM-50 was measured using FC2 for comparison with results obtained from standard batch mode measurements. Between each sample measurement the flow cell was not removed or repositioned but cleaned by flushing with ultra pure water. The variation of the background signal of FC2 was therefore measured without removing the cell from the unit between each of 16 measurements, as this corresponds to the use case. When comparing the resulting signal variations, the noise level found for the flow cell measurement was lower by a factor of six. We attribute this to the variability of sample introduction (positioning) and magnetic contaminants of the sample container (PCR tubes) affecting MPS batch mode measurements. Thus, the comparison of dilution series in PCR tubes and FC2 revealed the higher sensitivity of flow cell measurements. The resulting LOD of FM-50 was considerably lower when measured in the flow cell (LOD
FC2 = 700 pg, LOD
batch = 3.4 ng) as can be seen in the inset of
Figure 3a. A further important fact is that the measured spectral amplitudes
µi in batch and flow cell mode coincided perfectly (
R2 = 1).
Note that the lowest iron concentration that can be reliably measured by online MPS also directly depends on the detection volume of the flow cell. Thus, the simple adjustment of detection volume (via the inner diameter of the capillary) allows for the optimization according to desired resolution as well as sensitivity for each experiment.
3.3. Influence of Excitation Field
For a more comprehensive study of the magnetic properties of MNPs it is advantageous to apply different excitation fields
Bexc [
17]. Therefore, to test the applicability, the influence of field amplitude
Bexc on LOD was studied by measuring MNP-filled PCR tubes from
Bexc = 0.05 mT up to 25 mT in 20 logarithmic steps each with 20 repetitive measurements (
tavg = 1 s). The fluctuation in the background signal, the MPS noise, obtained at each field was quantified by calculating the standard deviation of
µ3 on an empty sample vessel. As the MNP magnetization exhibits a nonlinear behavior, the MPS signal amplitude
µ3 as a function of field amplitude
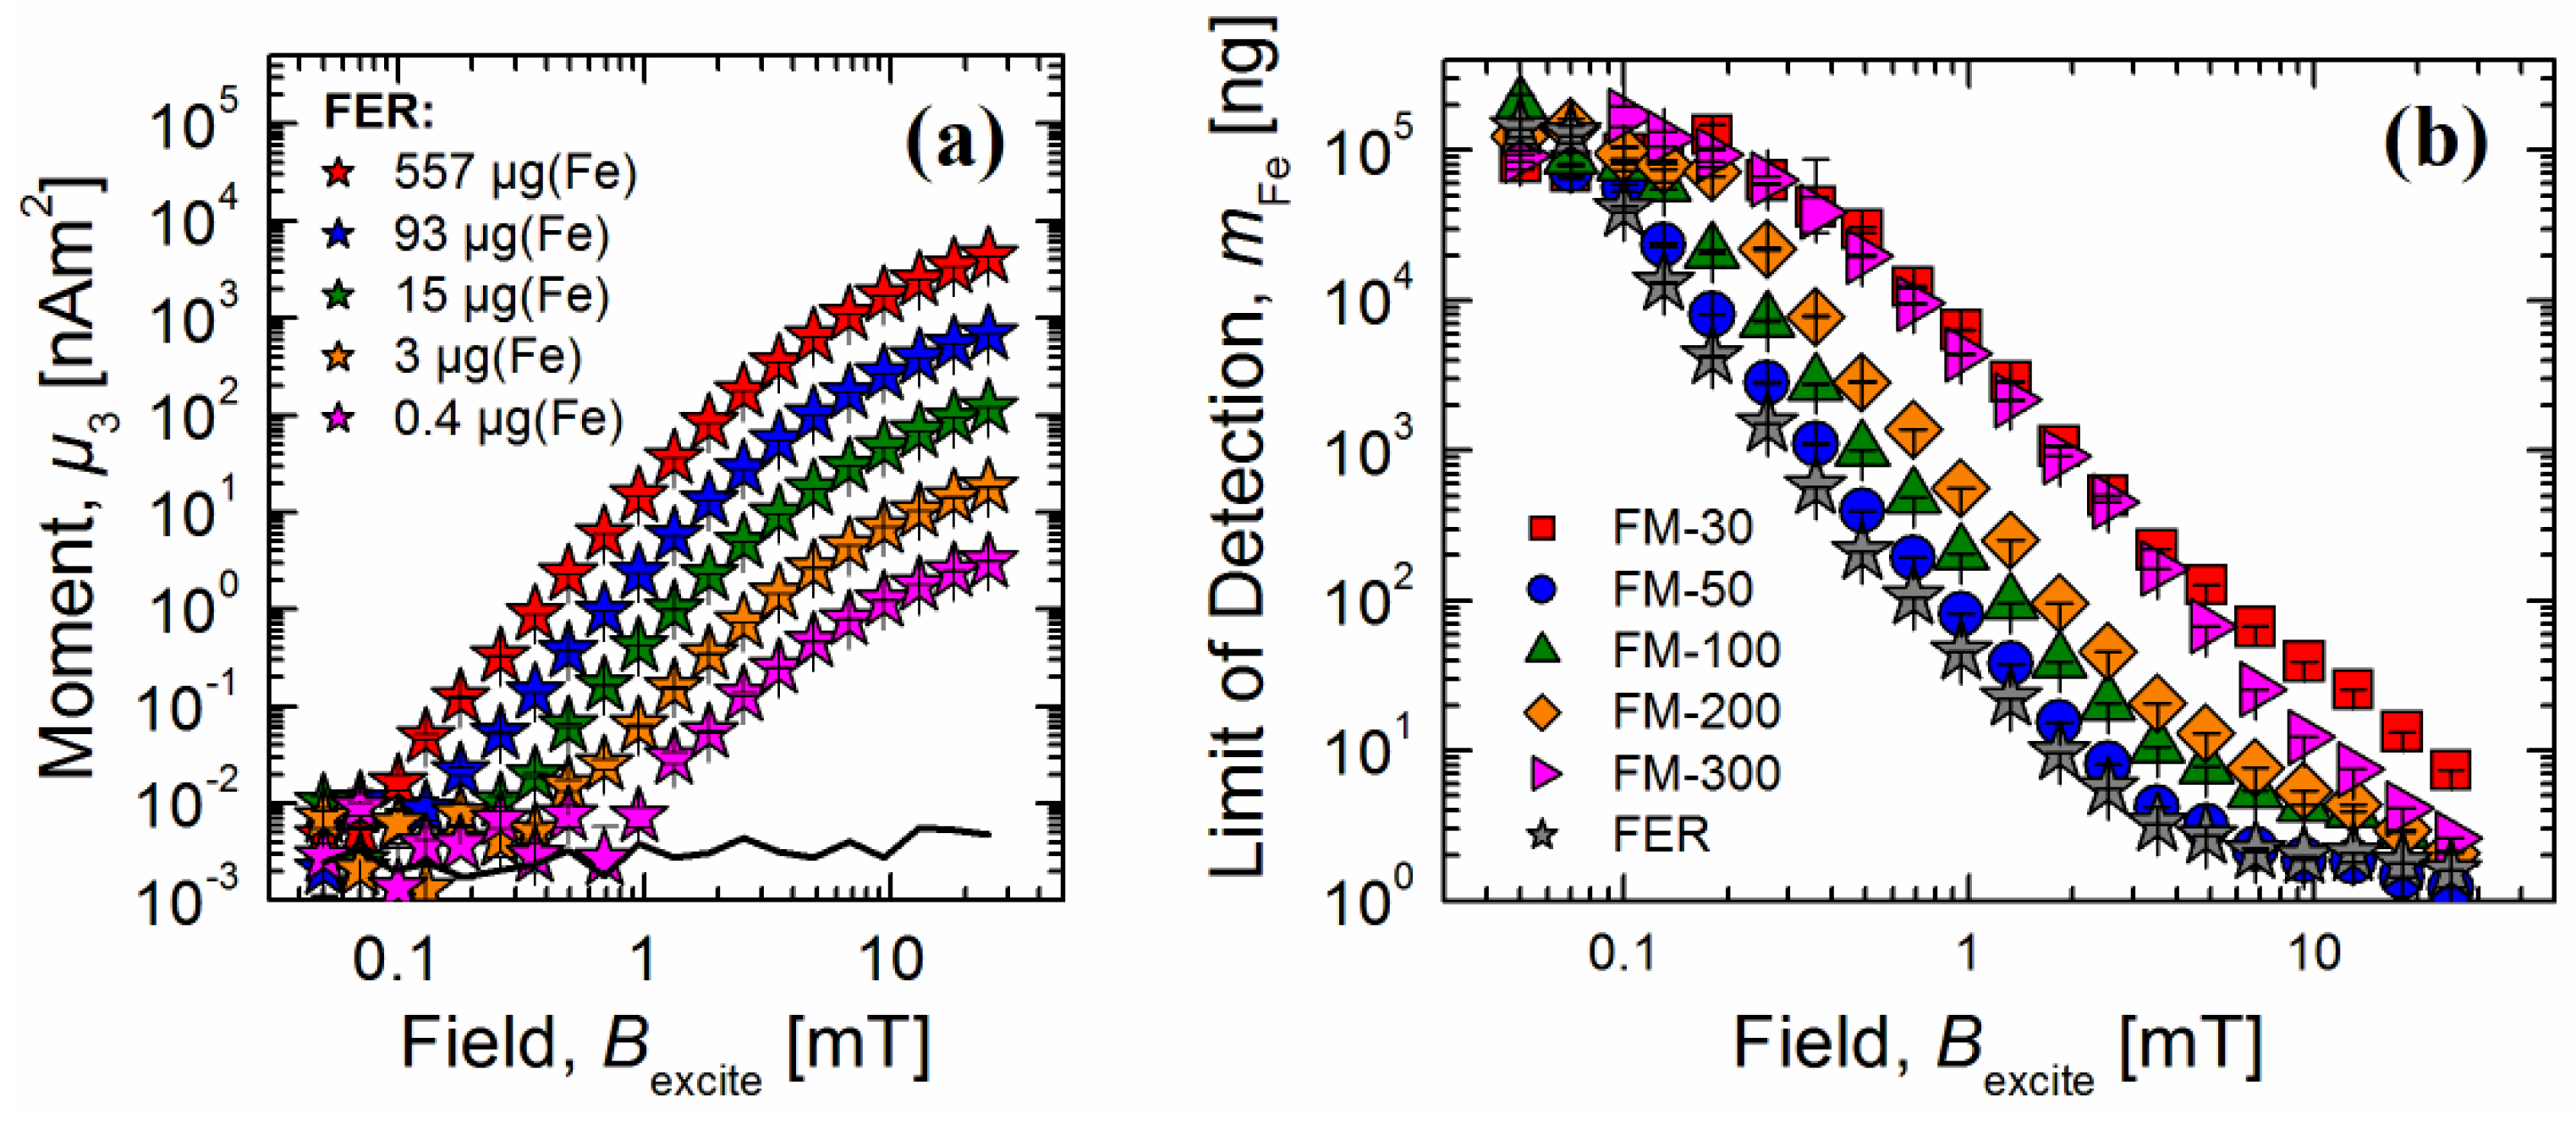
Bexc also creates a nonlinear curve as can be seen in
Figure 4a for five dilutions of FER. For all MNP samples the LOD was determined for each
Bexc using the above-mentioned procedure (see
Section 3.2). The LOD decreases on average by five orders of magnitude (from approximately 1 mg(Fe) down to 10 ng(Fe)) when the field is increased by at least two orders of magnitude (from 0.1 mT up to 10 mT). Note that all measurements were performed with an averaging time
tavg of 1 s which resulted in a 3.16-times higher noise floor compared to
Section 3.2 (measurements performed with
tavg = 10 s) due to the proportionality of noise to (
tavg)
0.5.
3.4. Influence of Flow Rate
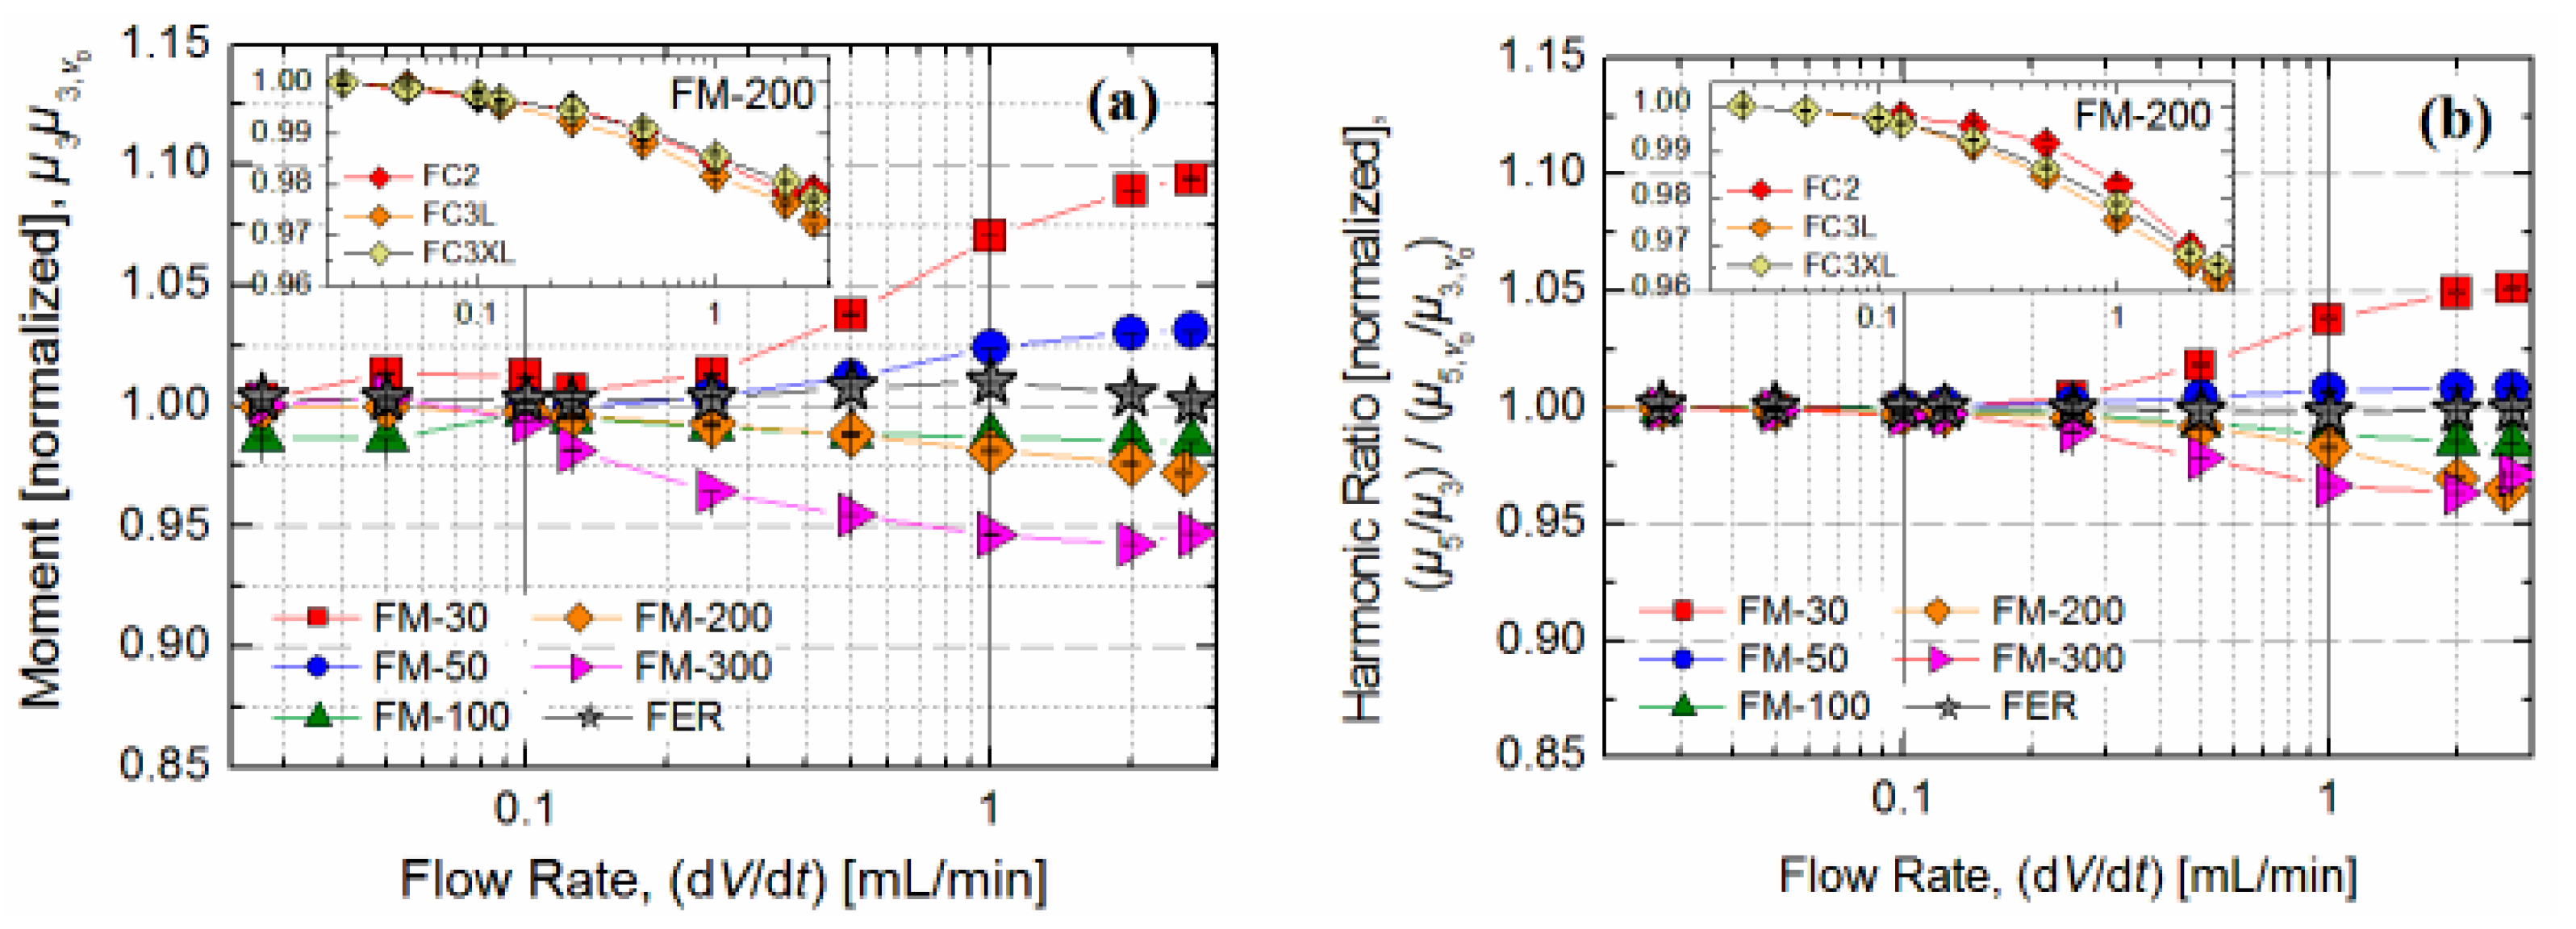
To show the applicability of MPS measurements in continuous flow, the signal dependence of different MNP samples with the same iron concentration (
c(Fe) = 279 µg/mL) on nine different flow rates, ranging from 27 µL/min–2.7 mL/min, was determined. For comparison, the signals were normalized to MPS signals obtained at d
V/d
t = 0 mL/min of the respective samples.
Figure 5a shows that changes of the signal amplitude
µ3 due to an increasing flow rate are below 10% for all MNP samples. The largest deviations were found for the smallest and largest particles (
Rhyd = 14.7 nm and
Rhyd = 127 nm, respectively) at the highest flow rate of 2.7 mL/min. The
µ5/
µ3 shape factor changed in the same course but was only half as strong as
µ3. In the range of usual operating flow rates for A4F (100 µL/min–1 mL/min) the measured spectra changed less than 7% and 5% for
µ3 and for
µ5/
µ3, respectively. Moreover, the use of different flow cells did not affect the flow-dependent signal change significantly, as can be seen in the insets of
Figure 5. To assess the influence of the MPS flow, experiments on MNP size DLS measurements were performed before and after application on sample aliquots. The results obtained confirmed the previous findings as
Rhyd did not change significantly.
Figure 4.
(a) The field-dependent MPS signal amplitude µ3 shown for a serial dilution of FER exhibits a nonlinear curvature. (b) This mainly affects the limit of detection which additionally depends on the MPS noise slightly increasing by a factor of three (see (a)).
Figure 4.
(a) The field-dependent MPS signal amplitude µ3 shown for a serial dilution of FER exhibits a nonlinear curvature. (b) This mainly affects the limit of detection which additionally depends on the MPS noise slightly increasing by a factor of three (see (a)).
Figure 5.
Influence of flow rate on the MPS signal. The changes were evaluated from the ratio of MPS signal ((a) µ3; (b) µ5/µ3) measured during liquid flow and without flow. (b) The insets of (a) and (b) show the degree of signal change for FM-200 measured in the three different flow cells. No significant variations between the different flow cells were observed.
3.5. MPS Online Detection
Finally, the A4F multidetector platform incorporating UV, DLS, and MALS detection was extended by MPS to demonstrate that the developed MPS online detection is applicable to fractionation experiments. Therefore, the magnetic characterization during fractionation was performed using optimized parameters (
Bexc = 25 mT,
tavg = 10 s, d
V/d
t = 100 µL/min) gained from preliminary experiments to obtain the highest sensitivity. The hydrodynamic separation was carried out on FER, which is known to have a polydisperse size distribution consisting of single crystallites and clusters [
20,
21,
22,
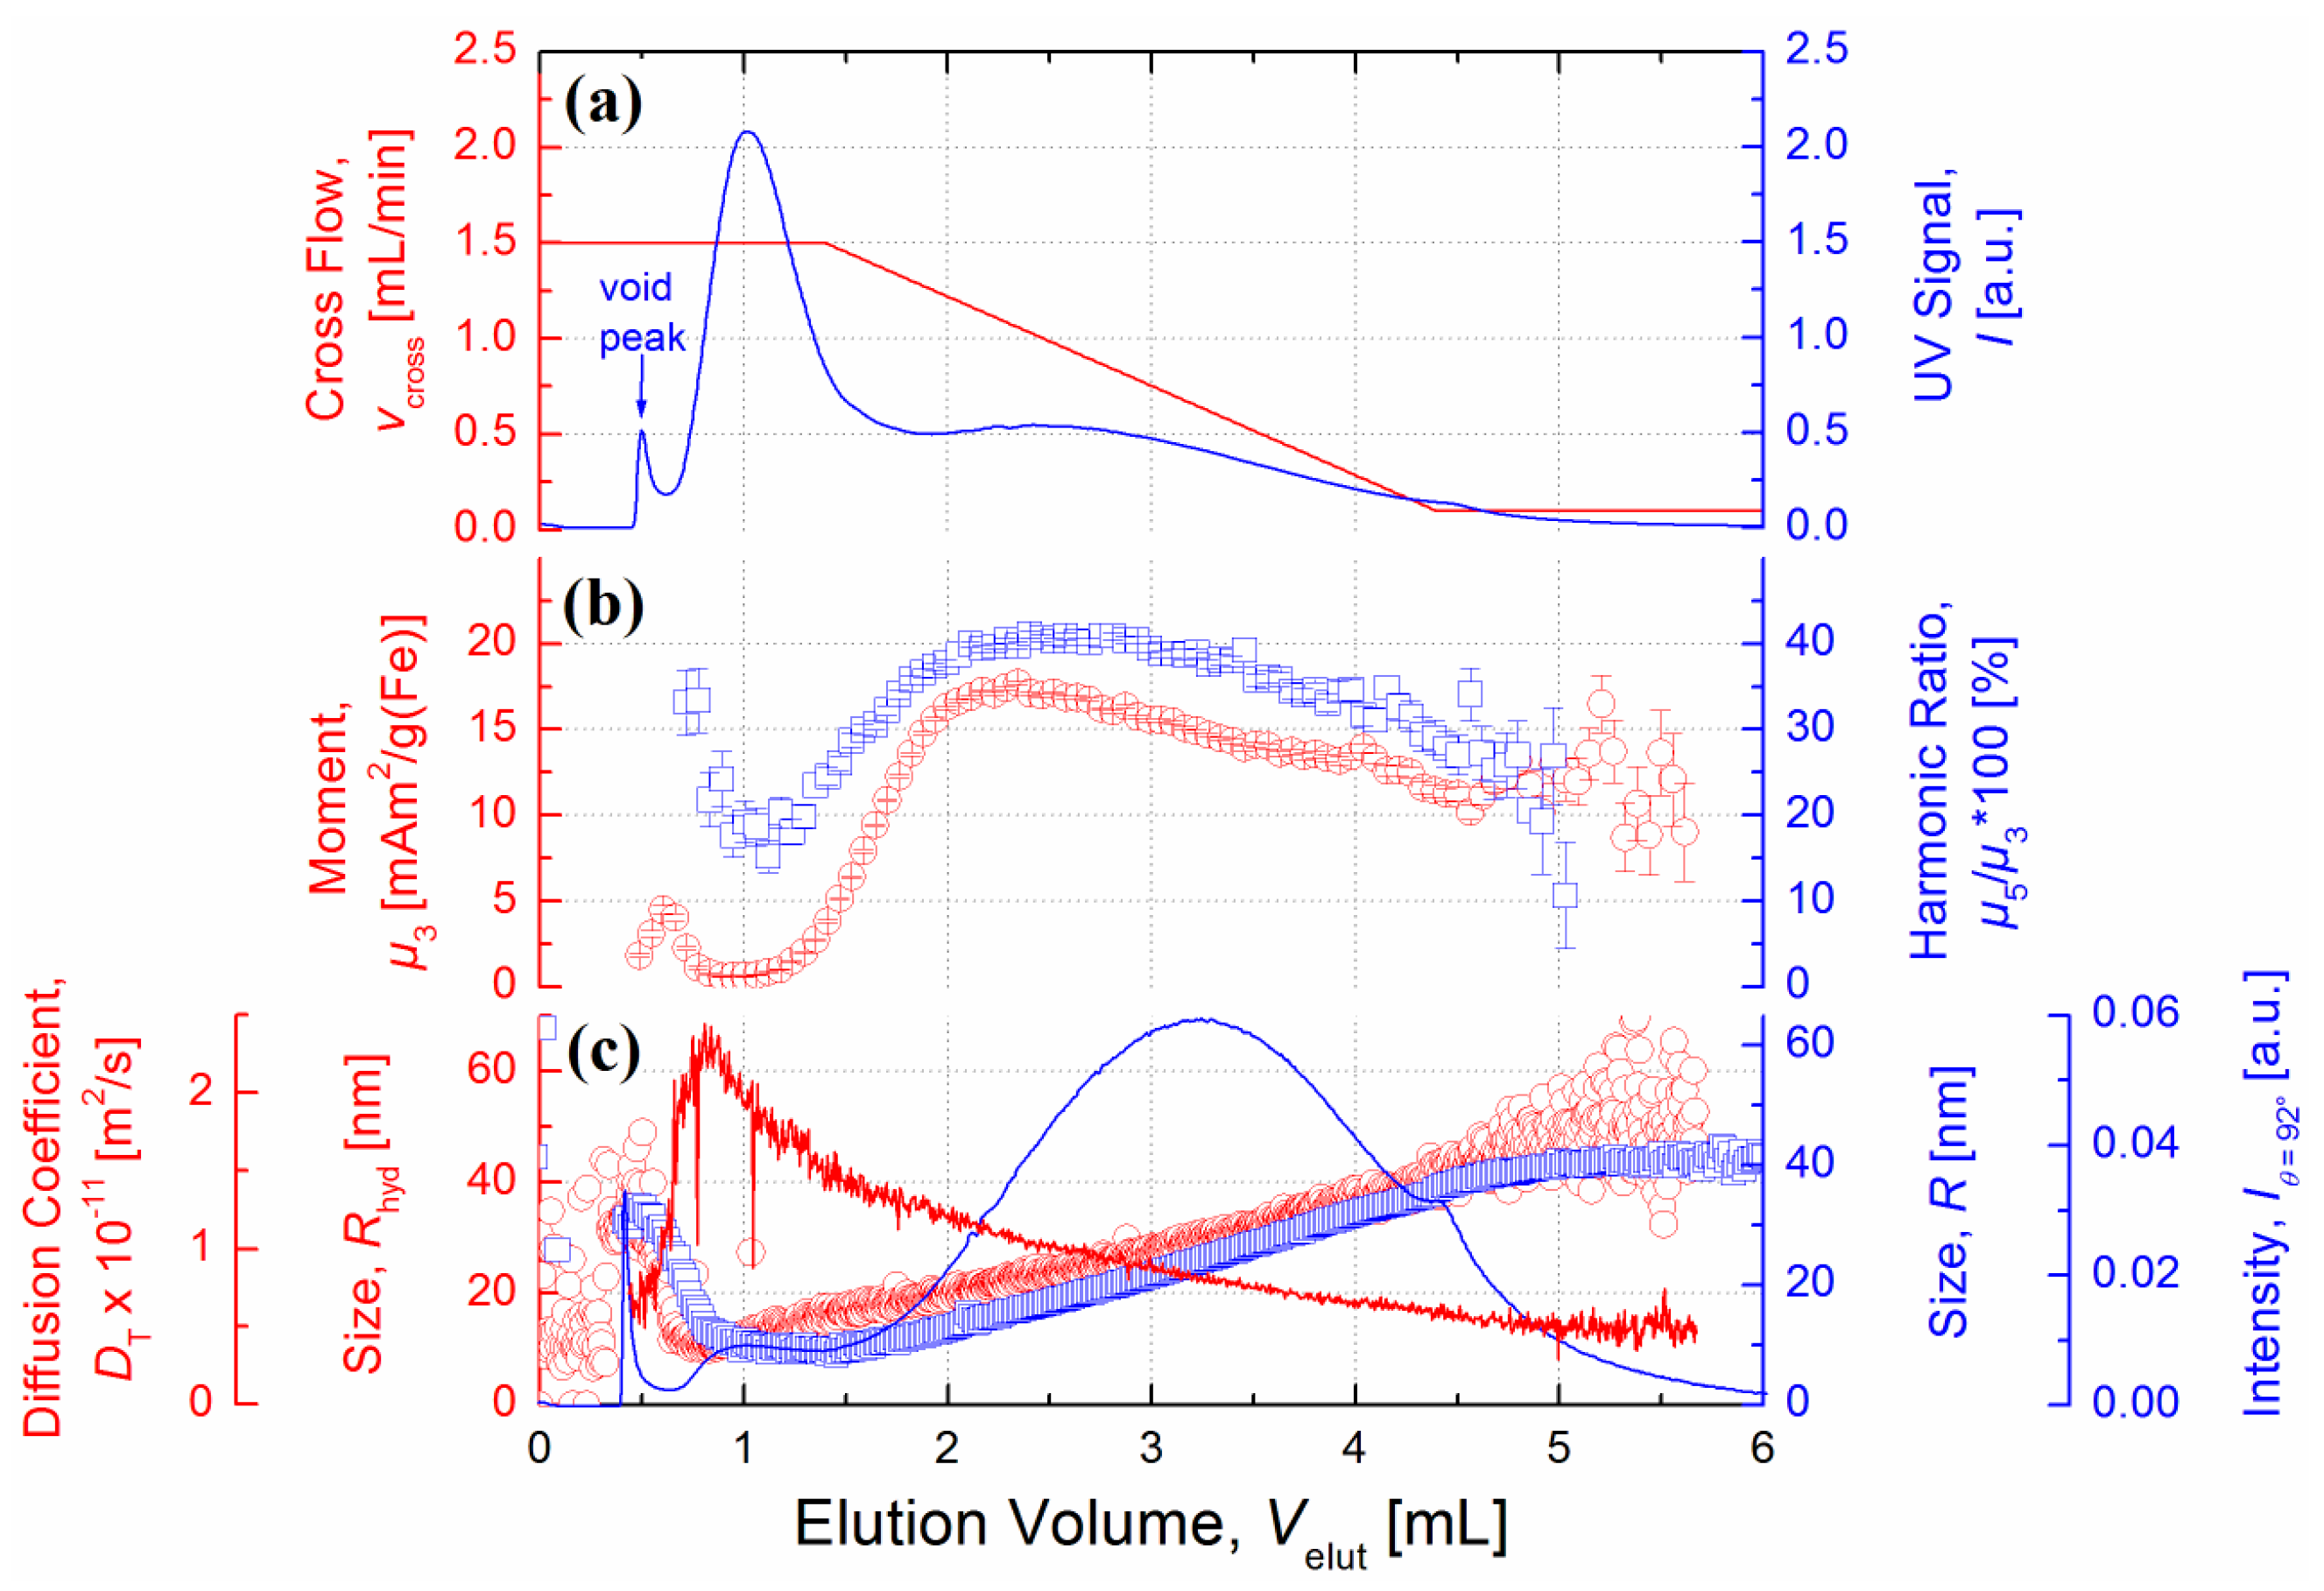
23]. Accordingly, this was also confirmed by the measured UV fractogram showing the presence of a bimodal distribution (
Figure 6a) exhibiting two distinct maxima with retention coefficients
R =
t0/
tr = 0.5 and 0.2, respectively. To extract the peak areas of the UV fractogram, a bimodal Gaussian function was used. Consequently, 42% of the eluting species belong to the first population of hydrodynamically small MNPs, whereas 57% can be associated with a second population of larger MNPs, which is in good agreement with experimental data obtained from literature [
20]. The calibrated UV signal was further used to determine the iron concentration in the fractions with which the MPS signal amplitudes were normalized.
After elution of the void peak,
Rhyd as well as
R increased linearly with
Velut as can be seen from the results of particle sizing methods DLS and MALS, respectively (
Figure 6c). The smaller and larger population peak have a hydrodynamic size
Rhyd of about 13 nm and 25 nm, respectively. Notably,
Rhyd of the large population is nearly equal to the value obtained for the initial state of FER (see
Table 1) which highlights the underestimation of small species using DLS in batch mode. In addition to
Rhyd, the radii obtained by MALS are shown in
Figure 6c. As the MALS contribution of the stabilizing carboxydextran shell is negligible,
R is significantly smaller than
Rhyd at any point during fractionation. Thus, a mean shell thickness of about 7 nm can be derived.
The magnetically characteristic signature of the eluting MNPs represented by
µ3 and the
µ5/
µ3 ratio was strongly affected by the hydrodynamic splitting of FER as measured by MPS online detection. To avoid misinterpretation, signals below an SNR of three are not shown in
Figure 6b. To ensure comparability, concentration-dependent
µ3 values were divided by respective iron amounts. As can be seen in
Figure 6b, MPS spectra of the smaller population peak have considerably lower signal amplitudes (
µ3 ~ 0.7 mAm
2/g(Fe)) and a steeper decay (
µ5/
µ3 ~ 15%) compared to the larger population. These results are in line with the data obtained by MPS batch mode measurements reported in
Section 3.2 (
Figure 2) showing that MNPs of similar hydrodynamic size (FM‑30:
Rhyd = 13.7 nm) were characterized by a
µ5/
µ3 ratio of about 13% and an iron normalized signal amplitude of about 0.7 mAm
2/g(Fe). Whereas the maximum signal amplitude
µ3 ~ 18 mAm2/g(Fe) of the second MNP population (at a size of
R = 15.7 nm and
Rhyd = 22 nm) is a factor of 2.2 higher compared to unfractionated FER, the
µ5/
µ3 ratio improved only slightly from 39% to 41%. Nevertheless, these values are in very good agreement with previous measurements on separated FER using MPS in batch mode [
23]. For even later elution times,
i.e., lager sizes, both
µ3 as well as
µ5/
µ3 again decreased.
This nonlinear MPS signal dependence on MNP size is in accordance with observations in
Section 3.2 and other studies [
27]. It was experimentally shown that narrowly distributed single-core MNPs of
R = 10 nm and
Rhyd = 15 nm yield the highest MPS signal intensity. These values are only slightly smaller compared to ours obtained from fractionation of FER which, on the contrary, consists of clusters of small primary particles (thus called multi-core) MNPs. The size-dependent optimum in MPS signal is known to be caused by magnetic relaxation effects increasing with MNP size.
The first considerably smaller peak located at the void peak can be explained by pre-elution of partially unretained MNPs caused by repulsion between MNPs and the membrane surface.
Figure 6.
(a) A linear decay of Vx (red line) from 1.5 mL/min to 0.1 mL/min was applied at VCh = 0.5 mL/min, resulting in an enforced elution of hydrodynamically larger MNPs. The A4F fractogram of FER with UV detection at λ = 280 nm (blue line) exhibits a double-peak indicating the existence of two distinct hydrodynamic size modes. (b) Characteristic MPS signal parameter µ3 (red circles) and the µ5/µ3 ratio (blue squares) were characterized by a nonlinear correlation to the determined sizes, reaching a maximum at about 21 nm and 15 nm for Rhyd and R, respectively. Values below the noise floor are not shown. (c) The sizes determined by DLS (red circles) and MALS (blue squares) showed a linear increase from 10 nm up to 45 nm and 9 nm up to 41 nm for Rhyd and R, respectively. The corresponding diffusion coefficient determined by DLS (red line) strongly decreases from Velut = 0.8 mL to 5.5 mL by a factor of five. The light scattering intensity (detected at θ = 92°) shows a maximum at Velut = 3.3 mL.
![Chromatography 02 00655 g006]()


