3.1. Prediction of Retention Time and Peak Profile at Varying Flow Rates
Both the retention time and peak profile are affected by the flow rate. Therefore, this factor (alone or used with other factors) can be useful to optimize the elution conditions to get appropriate analysis time and resolution. For this purpose, accurate predictions of both retention time and half-widths are needed to reproduce the chromatographic peaks using appropriate peak functions [
22,
23] and to quantify peak overlapping as a function of flow rate [
24]. As known, the retention time exhibits a linear variation with the inverse flow rate (1/
F):
Accordingly, accurate linear fittings of tR versus 1/F were obtained for all cases examined in this work, with determination coefficients R2 > 0.9999. Therefore, Equation (7) can be used to predict the retention at several flow rate values, with mean prediction errors below 0.5%.
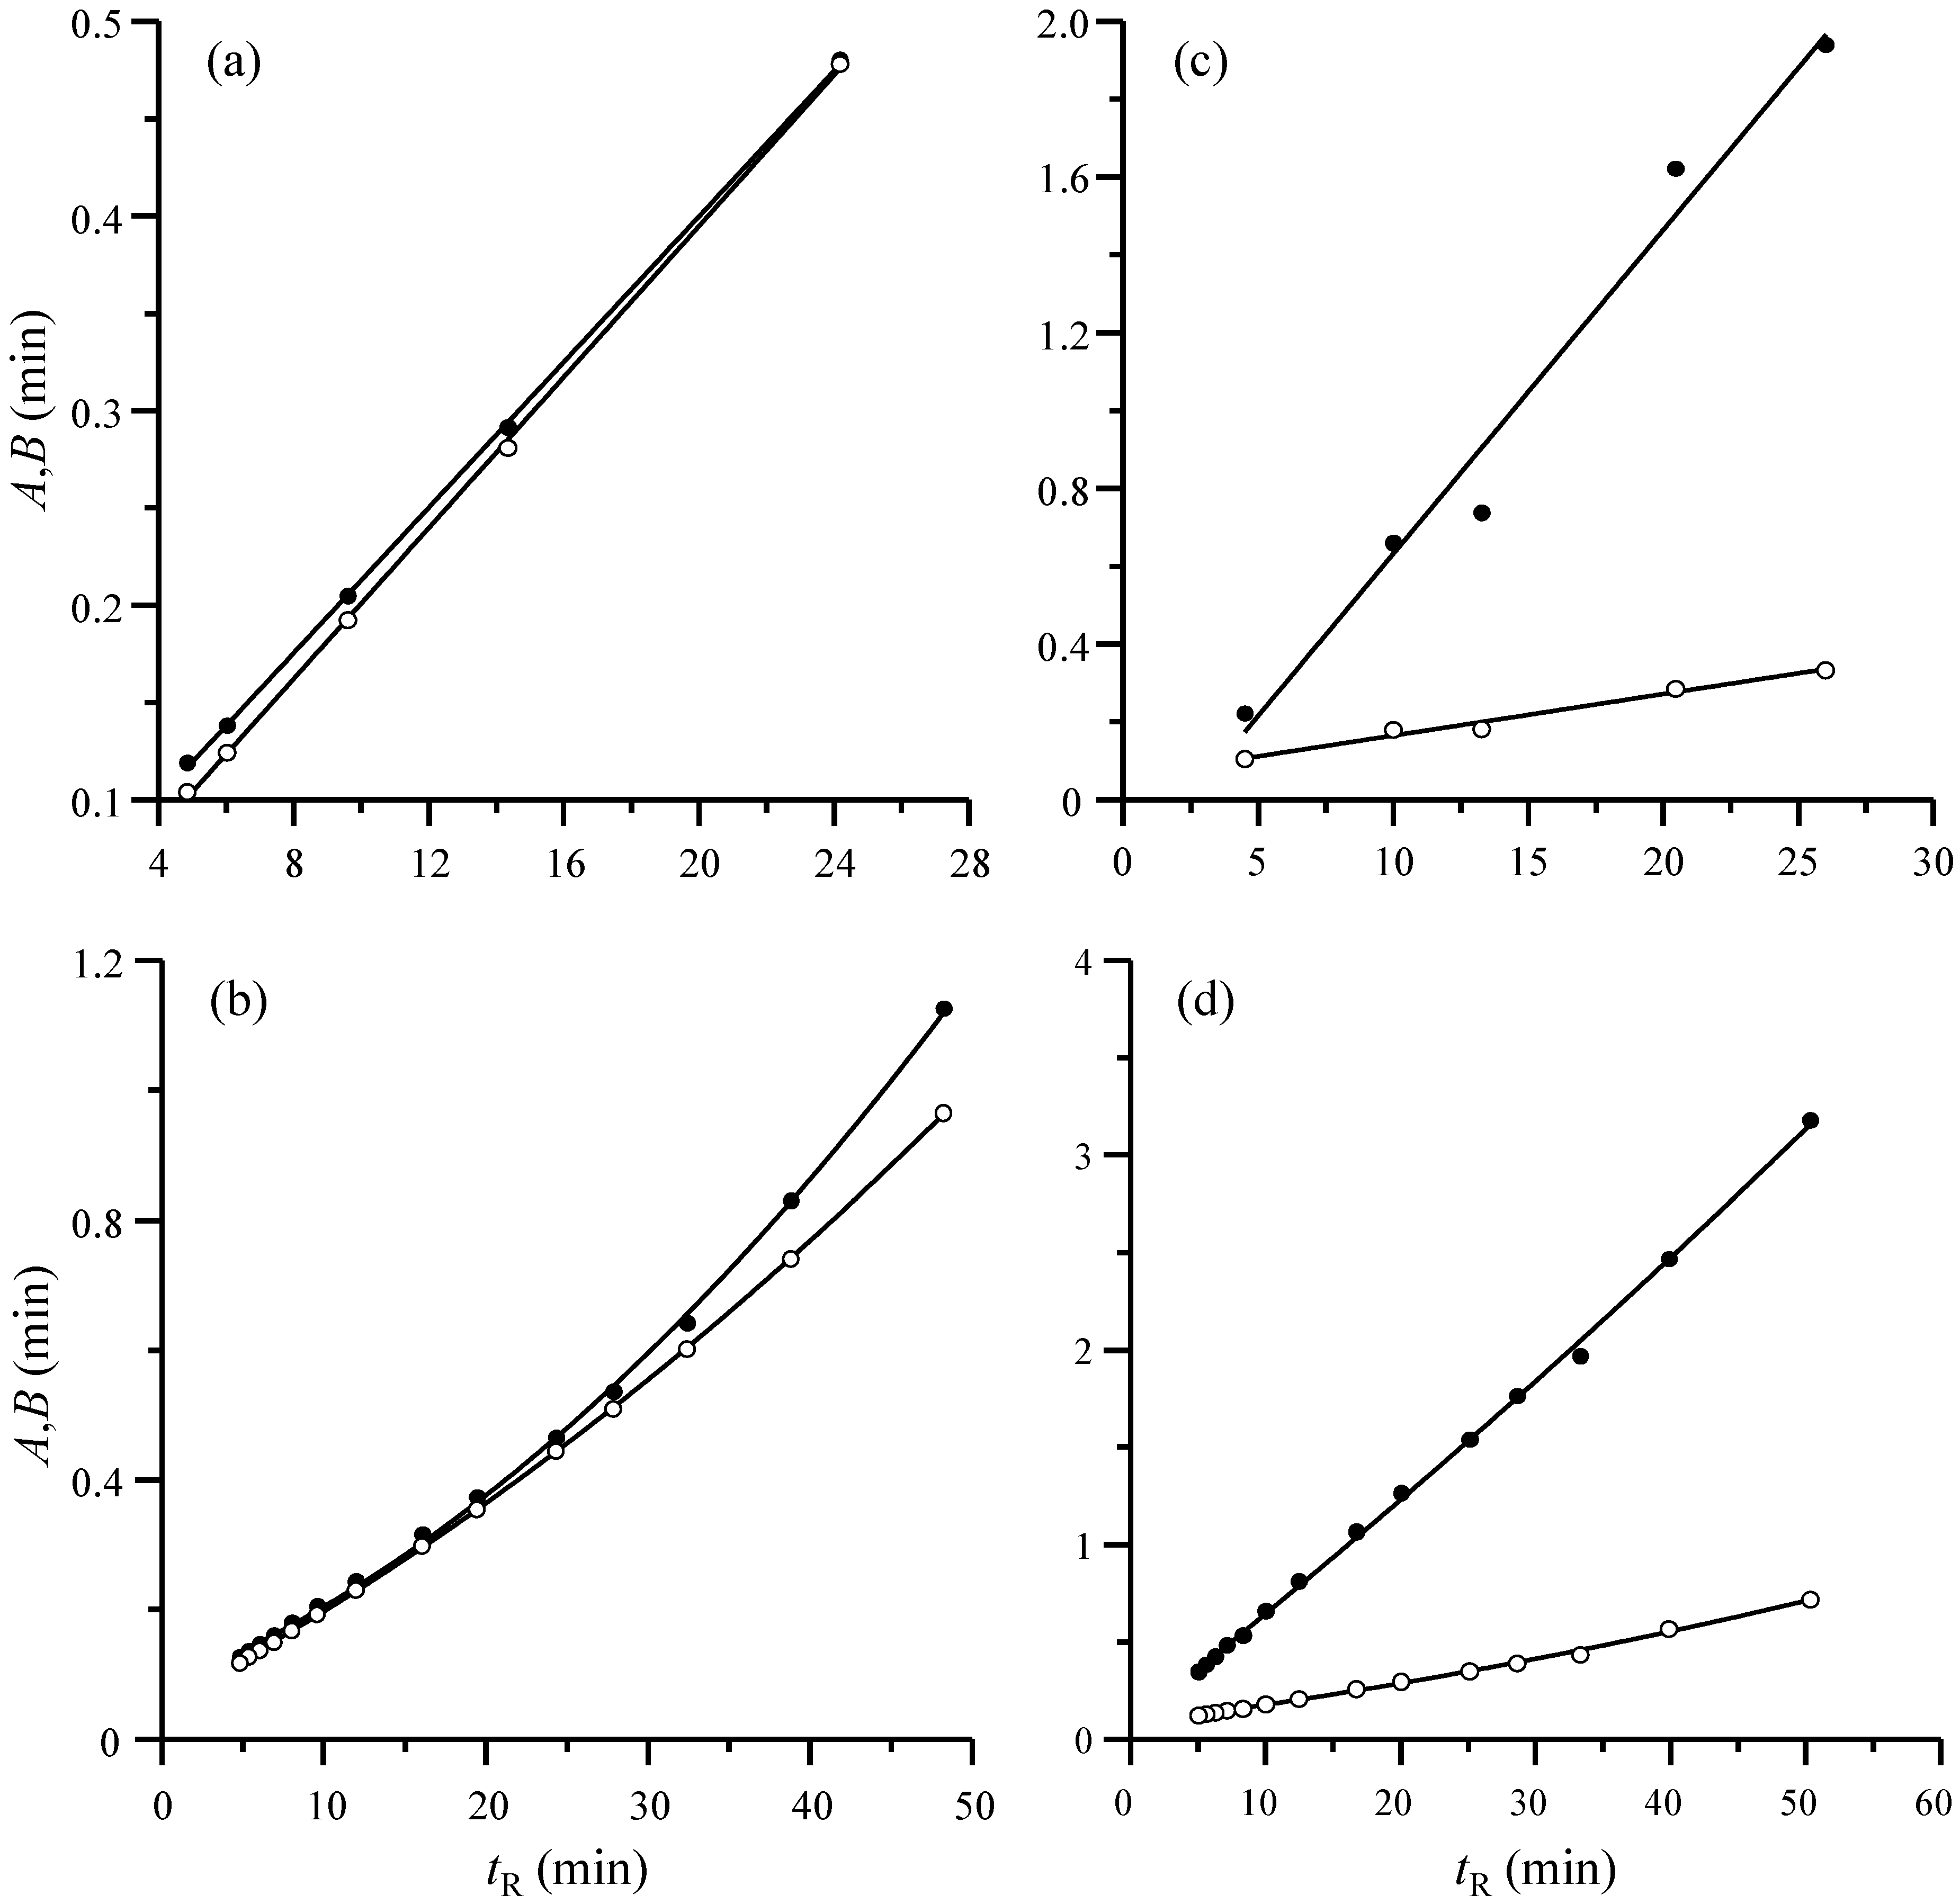
The prediction of half-widths (or widths for symmetrical peaks) is also fundamental for the optimization of a chromatographic separation, as this allows the accurate quantification of the overlapping between adjacent peaks. In
Figure 1, the left and right half-widths for the sets of sulfonamides (
Figure 1a,b) and β-blockers (
Figure 1c,d), analyzed with the Spherisorb column, are represented against the retention time at fixed (
Figure 1a,c) and variable (
Figure 1b,d) flow rates. At a fixed flow rate, the behavior is linear (
i.e., the trends in Equations (4) and (5) are followed) for both sets of compounds. In contrast, when the retention times change as a consequence of the flow rate, the behavior is parabolic (
i.e., the slope changes), since the efficiency changes: at high and low flow rates, the half-widths are larger than expected, considering the optimal linear behavior. For sulfonamides, the peaks are almost symmetrical, and consequently, the plots for the right and left half-widths practically agree, whereas for β-blockers, the peaks are significantly tailing. Therefore, the slope of the plot for the right half-width is larger. In this case, the flow effects are hidden by the general deterioration of the efficiency.
Figure 1.
Peak half-width plots for the sets of sulfonamides (a,b) and β-blockers (c,d), eluted from the Spherisorb column. Half-widths correspond to: (a,c) five compounds eluted at 1 mL/min and (b) sulfachloropyridazine and (d) acebutolol eluted at variable flow rates in the range 0.2 to 2 mL/min. Mobile phase: 20% v/v acetonitrile for sulfonamides, and 65% v/v for β-blockers. Left (A, ○) and right (B, ●) half-widths.
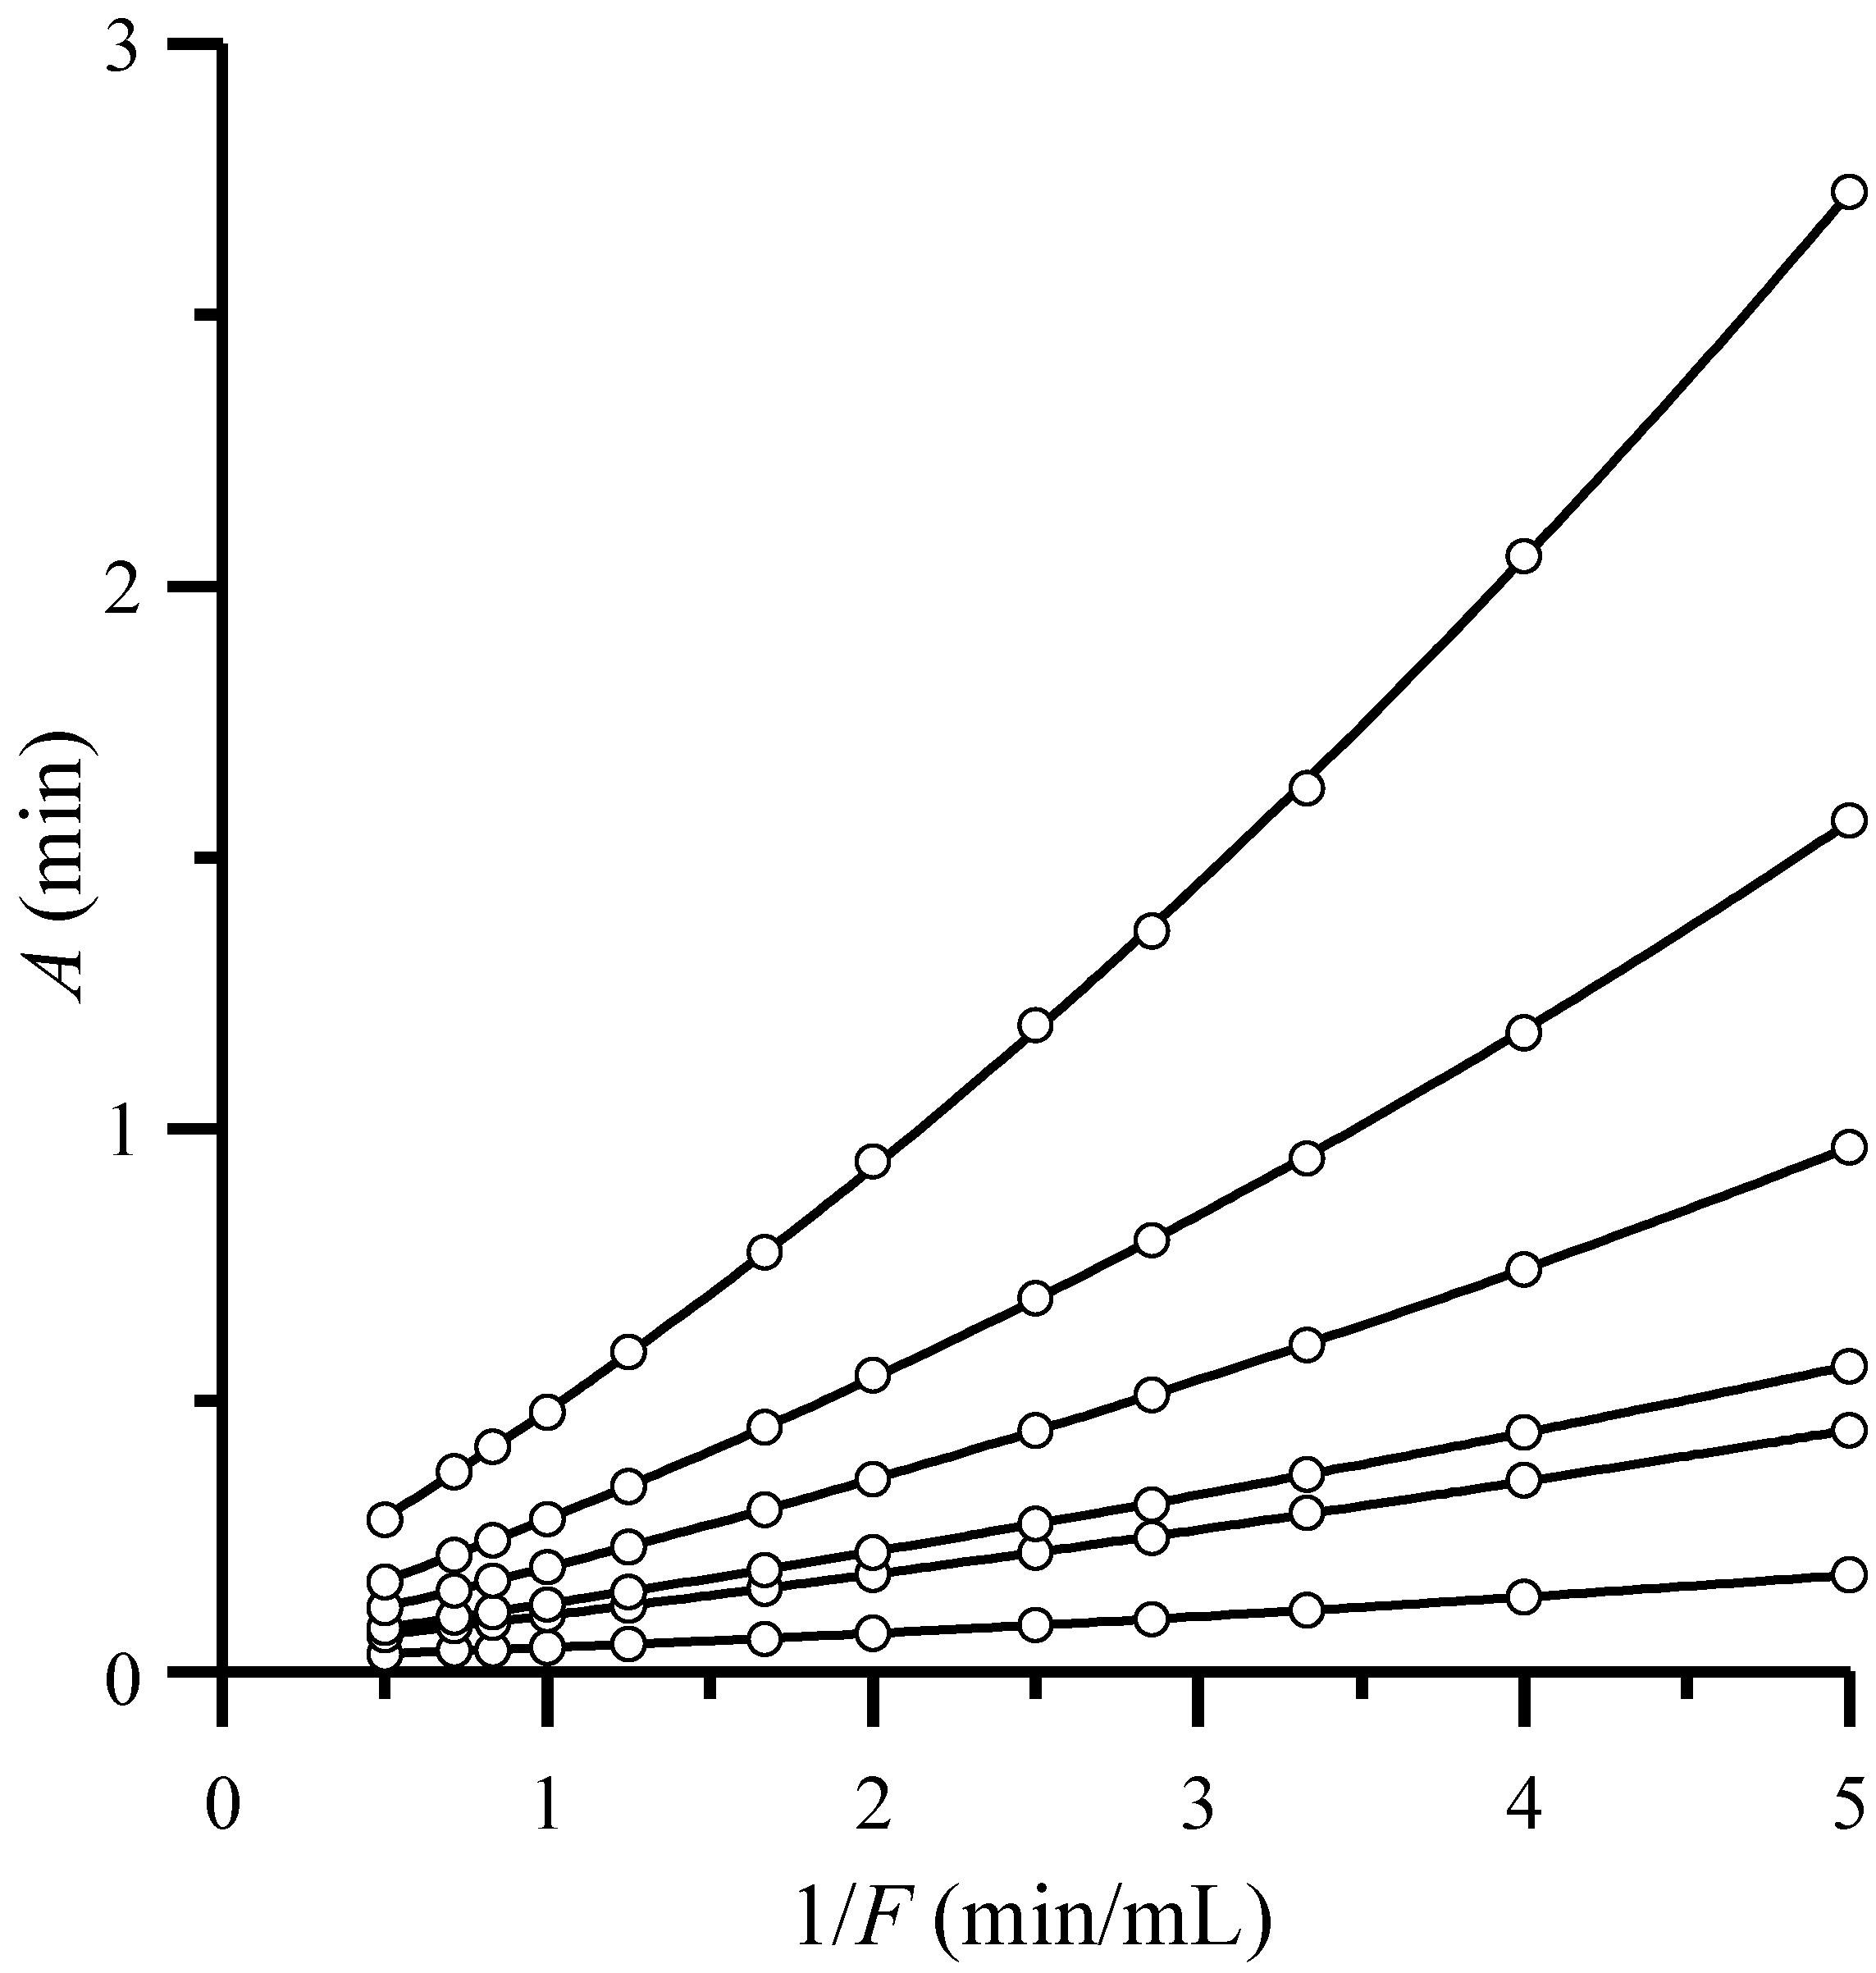
In
Figure 2, the dependence of the left half-widths (
A)
versus the inverse flow rate is shown for the set of five sulfonamides and the dead time marker. In all cases, the half-widths fit a parabola:
where
a2,
b2 and
c2 are model parameters. Equation (8) (and a similar equation for the right half-width,
B, and for the width,
w) allows a simple prediction of the half-widths at any flow rate in the measured range, with errors below 0.6% for the right half-width and below 2.0% for the left half-width for the solutes under study (the determination coefficients were always
R2 > 0.9998). As observed in
Figure 2, the half-widths depend on the retention behavior of each compound. Consequently, particular models should be fitted.
Figure 2.
Dependence of the left (A) half-width with the inverse flow rate, for the set of sulfonamides and the dead time marker (uracil), analyzed using the Spherisorb column and 20% v/v acetonitrile. From top to bottom: sulfamerazine, sulfamethizole, sulfachloropyridazine, sulfisoxazole, sulfadimethoxine and uracil. Similar plots can be obtained for the right half-width and the width.
3.2. Characterization of the Column Performance Based on the Peak Half-Widths
Next, it is shown how the performance of chromatographic columns can be described based on the dependence of the slopes for the representation of the right and left half-width plots (mA and mB in Equations (4) and (5)) or a similar plot for the width (mW in Equation (6)) versus the flow rate. For this purpose, we propose three approaches, for which a separate measurement of the extra-column contribution is not needed, since this would only affect the intercept of the plots.
3.2.1. Approach I
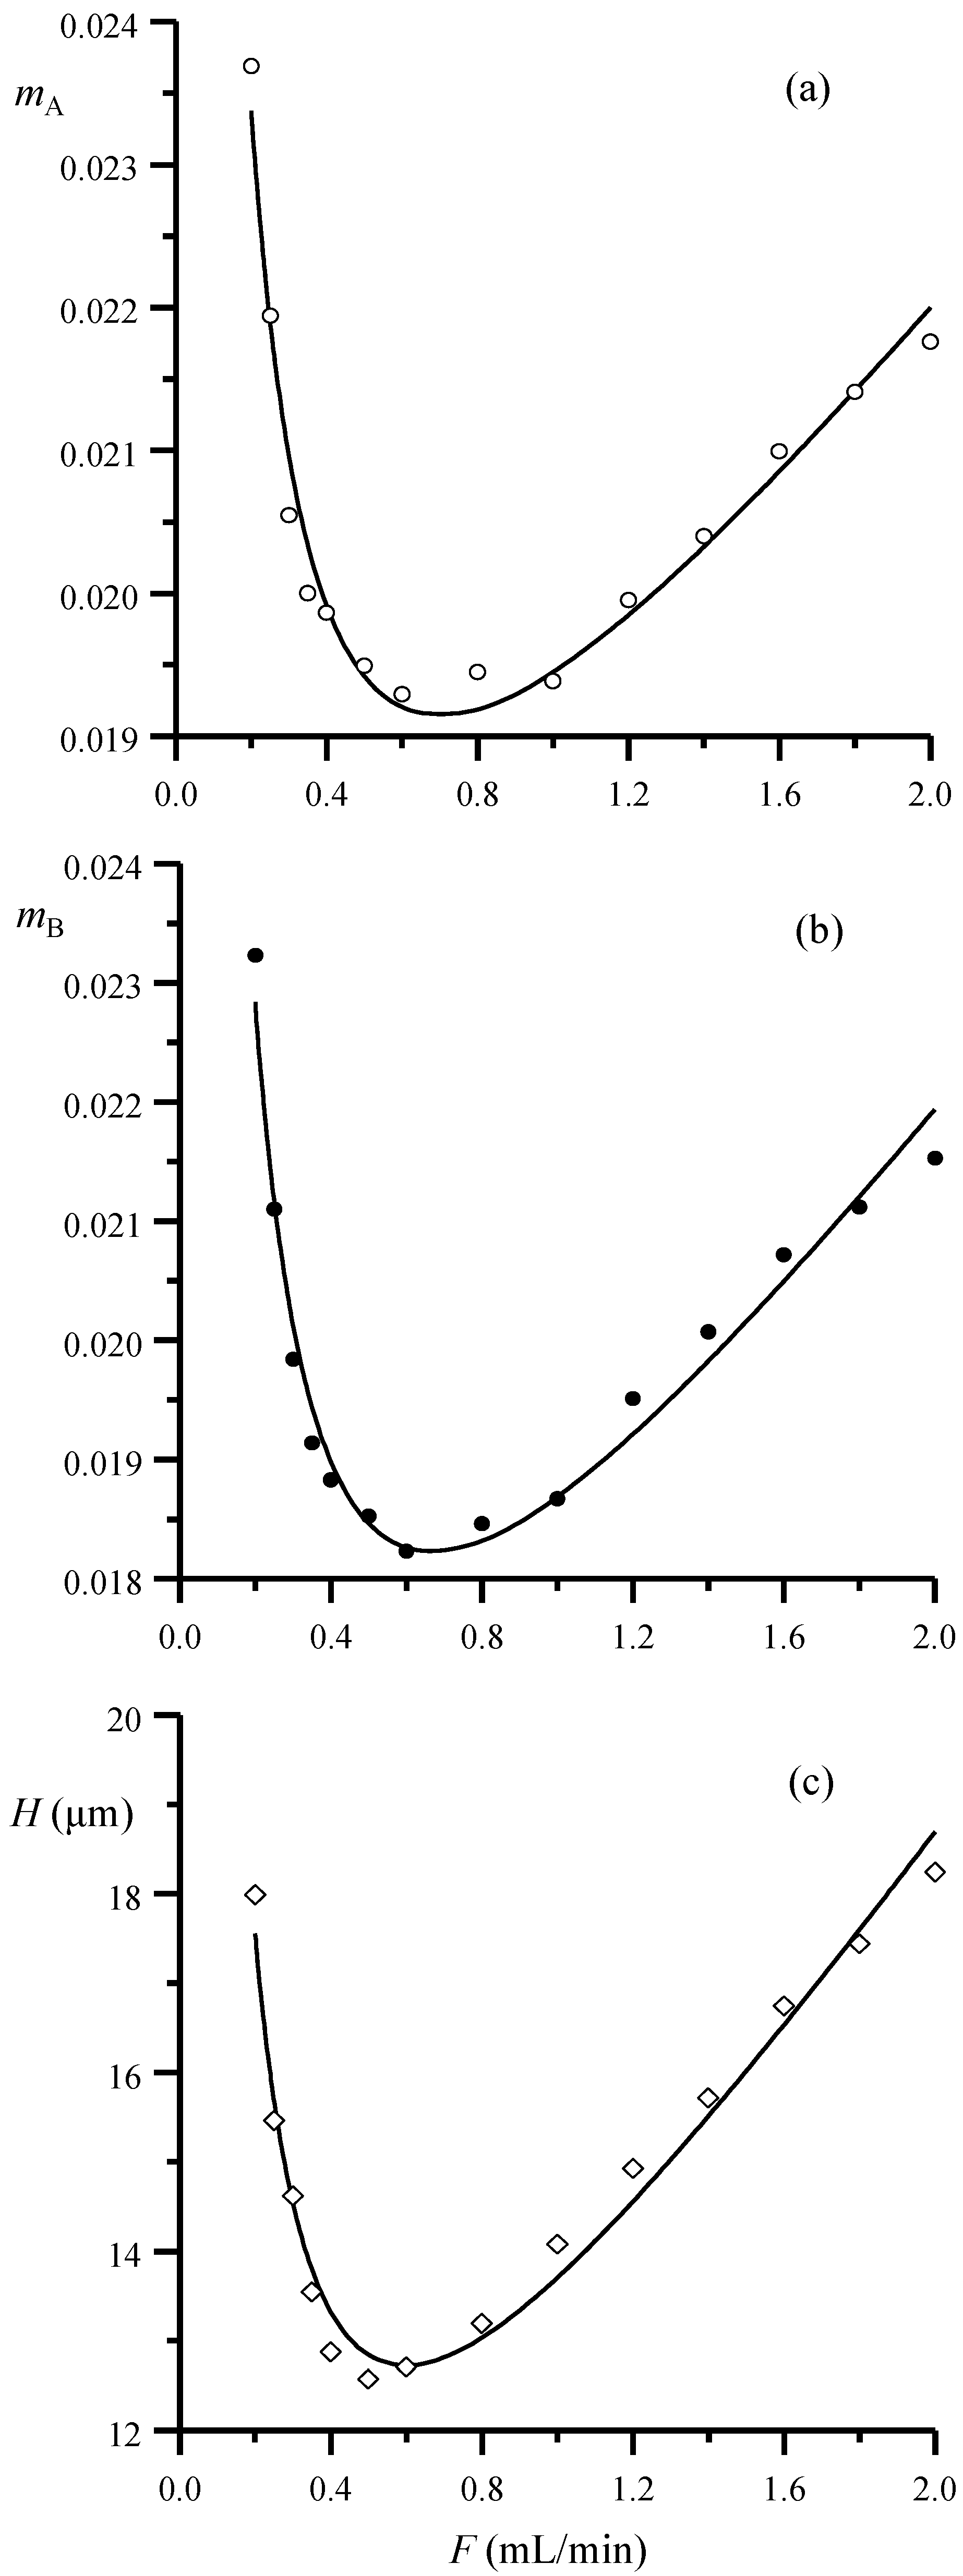
In
Figure 3a,b, the slopes in Equations (4) and (5) are represented as a function of the flow rate and compared to the change in height equivalent to a theoretical plate, calculated according to Equation (2), for the same dataset (
Figure 3c). Similar trends are obtained for both half-widths and theoretical plates: the behavior of the slopes for the peak half-width and width plots can be thus described using an equation of the same type as the theoretical plates. For the left half-width:
and similarly for the right half-width (
B) and the width (
w). The parameters
a,
b and
c in Equation (9) can be useful to characterize a chromatographic column. Note that these parameters do not have the same physical meaning as the parameters in the van Deemter equation. However, the practical application of the new approach and its interpretation is very simple, since
mA in Equation (4) (and similar parameters for the right half-width and the width) indicates the peak broadening increment per unit time inside the column.
Therefore, the parameters in Equation (9) can be used to measure the column performance. Parameter
a is the contribution to the peak broadening independent of the flow rate. It describes the vertical shift of the curves in
Figure 3a,b and can be explained based on equilibrium considerations, convection and eddy diffusion. Parameter
b is the contribution explained by factors that increase at decreasing flow rate, as the diffusion. Finally, parameter
c is the contribution explained by factors that increase at increasing flow rate, as the slow mass transfer.
Parameters a, b and c in Equation (9) can be obtained in two steps. First, the peak half-widths (or widths) for a set of compounds eluted at fixed, or at varying mobile phase composition, or for a single compound eluted at varying mobile phase compositions are linearly fitted versus the retention times, in order to obtain mA (or similar parameters for the right half-width and width). In the second step, the slopes obtained at several flow rates are non-linearly correlated with the flow rate according to Equation (9).
3.2.2. Approach II
The parabolic behavior depicted in
Figure 2 versus the flow rate (described by Equation (8)) and the trend for the slope of the half-width (or width) plots described in Equation (9) suggest that the independent term in Equations (4) to (6) (
nA,
nB and
nw) should also follow a parabolic trend, as was corroborated. Considering also Equation (7), with
d0 = 0 and
d1 =
VR, the behavior can be modelled as follows:
from which:
Figure 3.
Representation versus the flow rate of the slopes of the linear fittings of: (a) the left and (b) right half-width/retention time data (Equations (4) and (5), respectively) for the set of five sulfonamides and (c) height equivalent to a theoretical plate for sulfamerazine, calculated using Equation (3). The plotted data were obtained with a Spherisorb column and 20% v/v acetonitrile. The lines in the plots correspond to the non-linear fittings to Equation (9) (or similar).
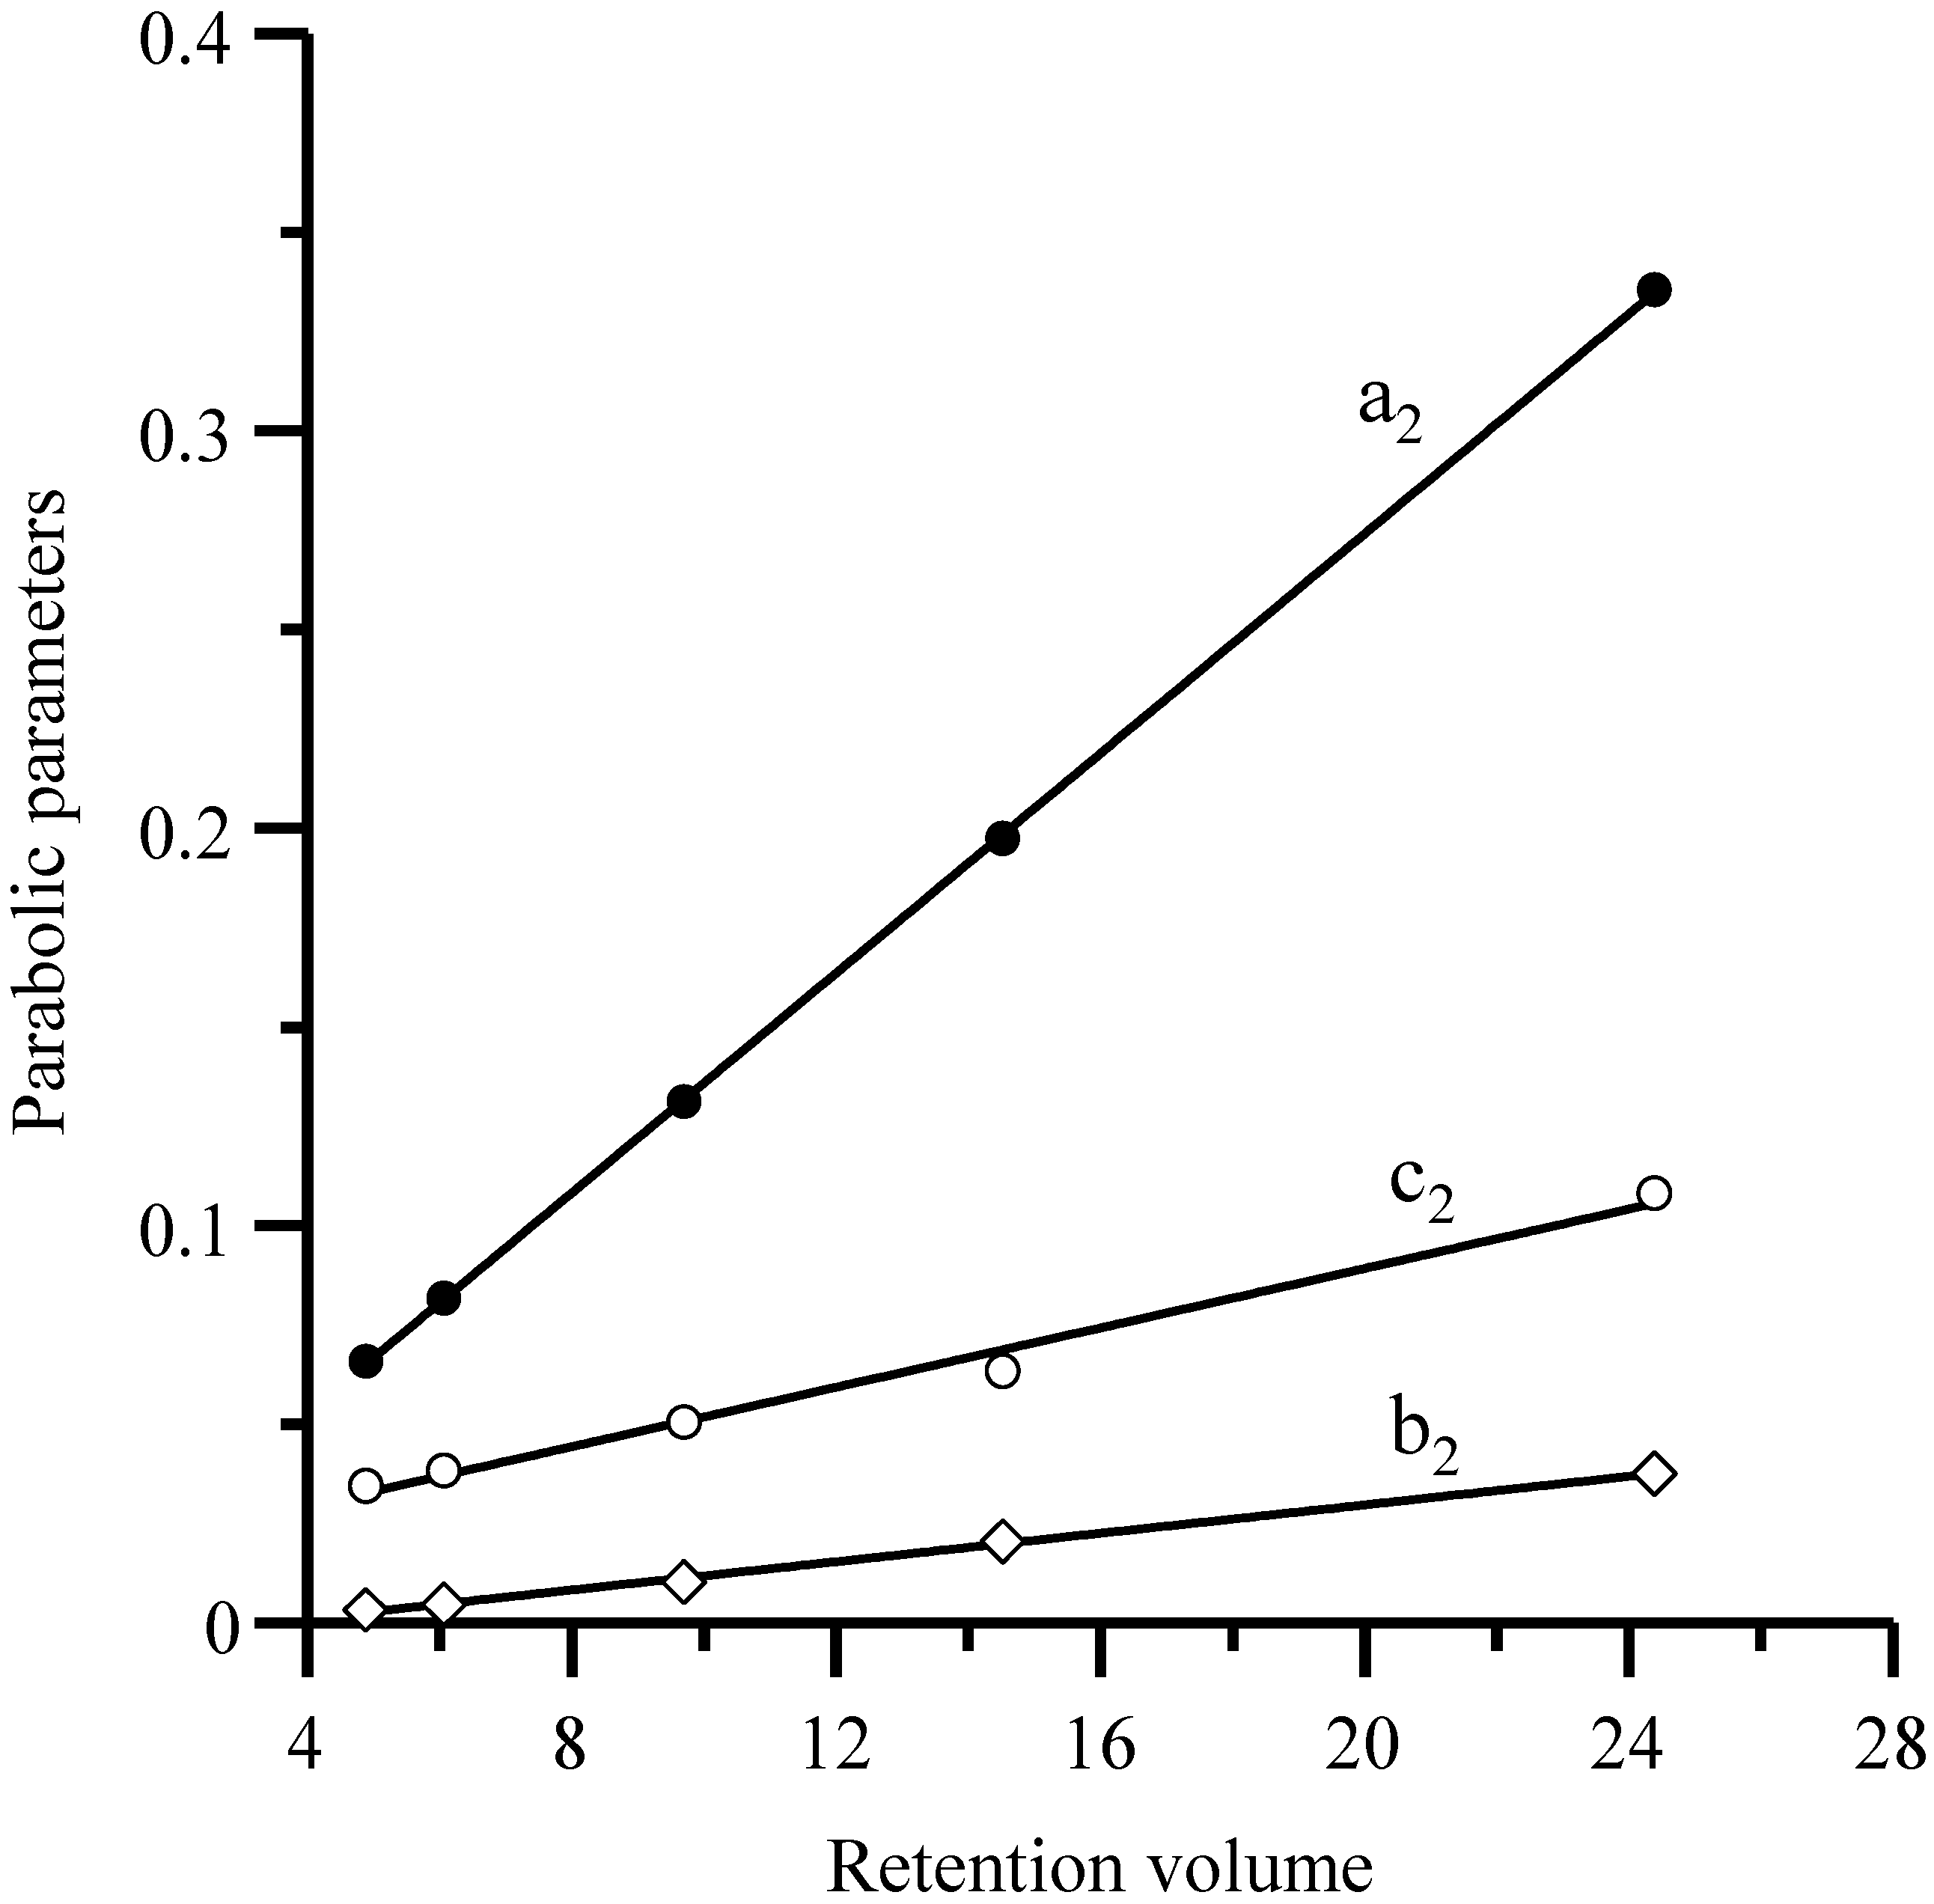
Equation (11) and similar ones indicate that the coefficients of the parabolic relationship of the half-widths (or widths) with the inverse flow rate are linearly related to the retention volumes, as shown in
Figure 4 for the Spherisorb column. This gives rise to a second approach. In the first step, the half-widths (or width) for each probe compound in the set are fitted against the flow rate according to Equation (8). In the second step, the
a2,
b2 and
c2 coefficients for the different compounds are linearly correlated with their retention volume (see Equation (11) and
Figure 4). The slopes of the fitted straight lines are the model parameters
a,
b and
c in Equation (9).
Figure 4.
Representation of parameters
a2,
b2 and
c2 in Equation (11)
versus the retention volume (
VR) for the five sulfonamides. The plotted parameters were obtained in the fitting of the left half-widths for each sulfonamide eluted with the Spherisorb column at different flow rates (see
Figure 1).
3.2.3. Approach III
Equation (10) can be taken as the basis for a third approach to obtain the model parameters
a,
b and
c in a single step, where the half-widths of several compounds at several flow rates are non-linearly fitted
versus the flow rate. In order to avoid overweighting in the least-squares fitting of the data at the lowest flow rates (and consequently, at the highest retention times), the half-widths should be better expressed in volume units:
where
VR is calculated as the product
tR ×
F.
3.3. Characterization of the Spherisorb and Chromolith Columns
In
Table 1, the model parameters in Equation (9) (obtained according to the three approaches described above) are compared for the set of sulfonamides. The results from Approaches I and III are similar. Approach III is the most practical, since all data are fitted in a single step. By applying the Excel Solver tool, fitting of the data took only a few seconds. However, Approach I has the interest of showing in detail the behavior of the half-widths (or widths) with time and flow rate. Approach II is less reliable due to the flexibility of the parabolic fitting, with parameters more strongly affected by random errors.
Table 1.
Model parameters in Equation (9) (or a similar equation for the right half-width), according to the three approaches, for the Spherisorb and Chromolith columns using the set of sulfonamides as probe compounds a.
Table 1.
Model parameters in Equation (9) (or a similar equation for the right half-width), according to the three approaches, for the Spherisorb and Chromolith columns using the set of sulfonamides as probe compounds a.
| Left half-width (A) | Right half-width (B) |
|---|
| | a | b | c | εr (%) | a | b | c | εr (%) |
|---|
| Spherisorb column |
| Approach I | 0.0144 | 0.00166 | 0.00338 | 1.5 | 0.0126 | 0.00188 | 0.00420 | 1.6 |
| Approach II | 0.0138 | 0.00179 | 0.00373 | 1.1 | 0.0118 | 0.00206 | 0.00467 | 1.4 |
| Approach III | 0.0144 | 0.00166 | 0.00339 | 1.3 | 0.0125 | 0.00188 | 0.00420 | 1.6 |
| Chromolith column |
| Approach I | 0.0340 | 0.00364 | 0.00267 | 2.1 | 0.0248 | 0.00525 | 0.00524 | 3.4 |
| Approach II | 0.0355 | 0.00342 | 0.00221 | 4.4 | 0.0270 | 0.00490 | 0.00444 | 3.2 |
| Approach III | 0.0340 | 0.00364 | 0.00268 | 2.1 | 0.0247 | 0.00525 | 0.00527 | 3.1 |
The model parameters in Equation (9) for the sets of sulfonamides and β-blockers, separated with the Spherisorb and Chromolith columns, are compared in
Table 2. Note that, as expected, the model parameters for the peak width agreed with the sum of the parameters for the left and right half-widths. The poorer fittings for the β-blockers should be explained by the differences in the interaction kinetics among these compounds with the silanols on the stationary phases. However, the information given by the model parameters is still useful and shows the large differences in the model parameters between both half-widths. However, note that the proposed approaches cannot be applied to sets of data where the compounds exhibit more different kinetics.
For sulfonamides, parameters a and b are smaller for the Spherisorb column, partially due to the longer length. The Chromolith column offers similar behavior at increasing flow rate (c parameter) for these compounds. For β-blockers, the right half-widths are more affected by the flow rate. From the parameters obtained with the data of sulfonamides and β-blockers, it is evident that the interaction behavior is different for both sets of compounds (especially for the Spherisorb column), with the largest differences associated with parameter a.
Table 2.
Model parameters according to Approach III for the Spherisorb and Chromolith columns, using the set of sulfonamides and β-blockers as probe compounds a.
Table 2.
Model parameters according to Approach III for the Spherisorb and Chromolith columns, using the set of sulfonamides and β-blockers as probe compounds a.
| Parameter | a | b | c | R2 | εr (%) |
|---|
| Spherisorb column/sulfonamides |
| A | 0.0144 | 0.00166 | 0.00339 | 0.9993 | 1.3 |
| B | 0.0126 | 0.00188 | 0.00420 | 0.9987 | 1.6 |
| w | 0.0270 | 0.00354 | 0.00759 | 0.9990 | 1.4 |
| Chromolith column/sulfonamides |
| A | 0.0340 | 0.00364 | 0.00268 | 0.9987 | 2.1 |
| B | 0.0247 | 0.00525 | 0.00527 | 0.9976 | 3.1 |
| w | 0.0587 | 0.00889 | 0.00795 | 0.9983 | 2.4 |
| Spherisorb column/β-blockers |
| A | 0.00650 | 0.00125 | 0.00330 | 0.967 | 6.2 |
| B | 0.0821 | 0.00116 | −0.00084 | 0.974 | 8.2 |
| w | 0.0886 | 0.00241 | 0.00246 | 0.975 | 7.6 |
| Chromolith column/β-blockers |
| A | 0.0268 | 0.00182 | 0.00163 | 0.986 | 5.3 |
| B | 0.0888 | 0.00067 | 0.00860 | 0.983 | 7.2 |
| w | 0.1156 | 0.00248 | 0.01022 | 0.989 | 5.7 |
3.4. Optimal Flow Rate
If the extra-column effects are neglected, the optimal flow rate (
) corresponding to the minimal band broadening inside the column can be obtained from Equation (9), as follows:
For the set of sulfonamides eluted with the Spherisorb column,
= 0.70 mL/min. If the extra-column broadening is included, the optimal flow rate should be obtained from Equation (11):
which means that the optimal flow rate will depend on the analyzed compound. Taking the parameters given in
Table 3 for each compound, the optimal flow rate ranged between
= 0.31 for sulfamerazine and
= 0.59 for sulfadimethoxine. Only for sufficiently high retention, the optimal flow rate would tend to 0.70. This means that there is no single optimal flow rate for all compounds and suggests that the application of a flow rate gradient would give rise to the best peak profile for each compound. It should be however observed that most applications use higher flow rates than the optimal, due to practical reasons.
Table 3.
Retention factor and model parameters for the left half-width for sulfonamides a.
Table 3.
Retention factor and model parameters for the left half-width for sulfonamides a.
| k | a | b | c |
|---|
| Sulfamerazine | 3.16 | 0.0135 | 0.00067 | 0.00714 |
| Sulfamethizole | 4.20 | 0.0135 | 0.00077 | 0.00626 |
| Sulfachloropyridazine | 7.26 | 0.0137 | 0.00103 | 0.00520 |
| Sulfisoxazole | 11.35 | 0.0139 | 0.00135 | 0.00429 |
| Sulfadimethoxine | 19.79 | 0.0142 | 0.00143 | 0.00416 |
| Set of five sulfonamides | ‒ | 0.0144 | 0.00166 | 0.00339 |
The geometrical interpretation of the optimal flow rate is depicted in
Figure 5 for sulfamerazine. The half-widths measured in volume units (
A ×
F) are represented
versus the flow rate in
Figure 5a. It may be observed that in this plot, the changes in the half-widths with respect to the optimal value (the minimum indicating the optimal flow rate) are accentuated. In contrast, the representation of
A in time units
versus 1/
F depicts a parabolic behavior, where the loss of linearity is only remarkable at low flow rates, corresponding to the loss of efficiency due to the diffusion (
Figure 5b). The optimal flow rate corresponds to the point where the slope of the parabola matches the straight line that goes through the origin (
i.e., the parabola tangent). From Equations (8) and (11):
which yields:
This result agrees with Equation (14). Finally, representing
A ×
F2 versus the flow rate (
Figure 5c), a parabola is also obtained, where the effect of high flow rates is highlighted.
The extra-column effects are isolated in Equation (10) through the
a0,
b0 and
c0 terms. Therefore, the
a,
b and
c terms refer only to the chromatographic column. In
Table 3, the column parameters for the whole set of sulfonamides eluted from the Spherisorb column are compared to the parameters fitted for each sulfonamide, making
a0 =
b0 =
c0 = 0 in Equation (12), which implies that the extra-column effects are included inside the parameters
a,
b and
c as in Equation (11). As observed, as the solute retention increases, these parameters tend to those obtained with the data for the whole set of compounds, since the extra-column effects are less important.
Figure 5.
Dependence of the left half-width and derived parameters on the flow rate (or inverse flow rate), for sulfisoxazole, showing the region of optimal elution. In each diagram, the intersection with the dashed straight lines indicates the optimal elution. The deviations from these lines can be explained by diffusion and slow mass transfer processes.
3.5. Peak Capacity
The study of column performance can be enriched by evaluating the dependence on the flow rate of the column peak capacity (
Pc), which is the maximal number of adjacent peaks located at exactly the right distance to yield enough resolution in a certain time window. The calculation of the peak capacity with the proposed approach, as a function of the peak half-widths, is rather simple:
Equation (17) has been adapted to volume units from Equation (50) in [
25], to account for the peak compression when time units are used due to the flow. In the equation,
V1 and
Vn are the extreme volumes of the range where the peak capacity is calculated. In
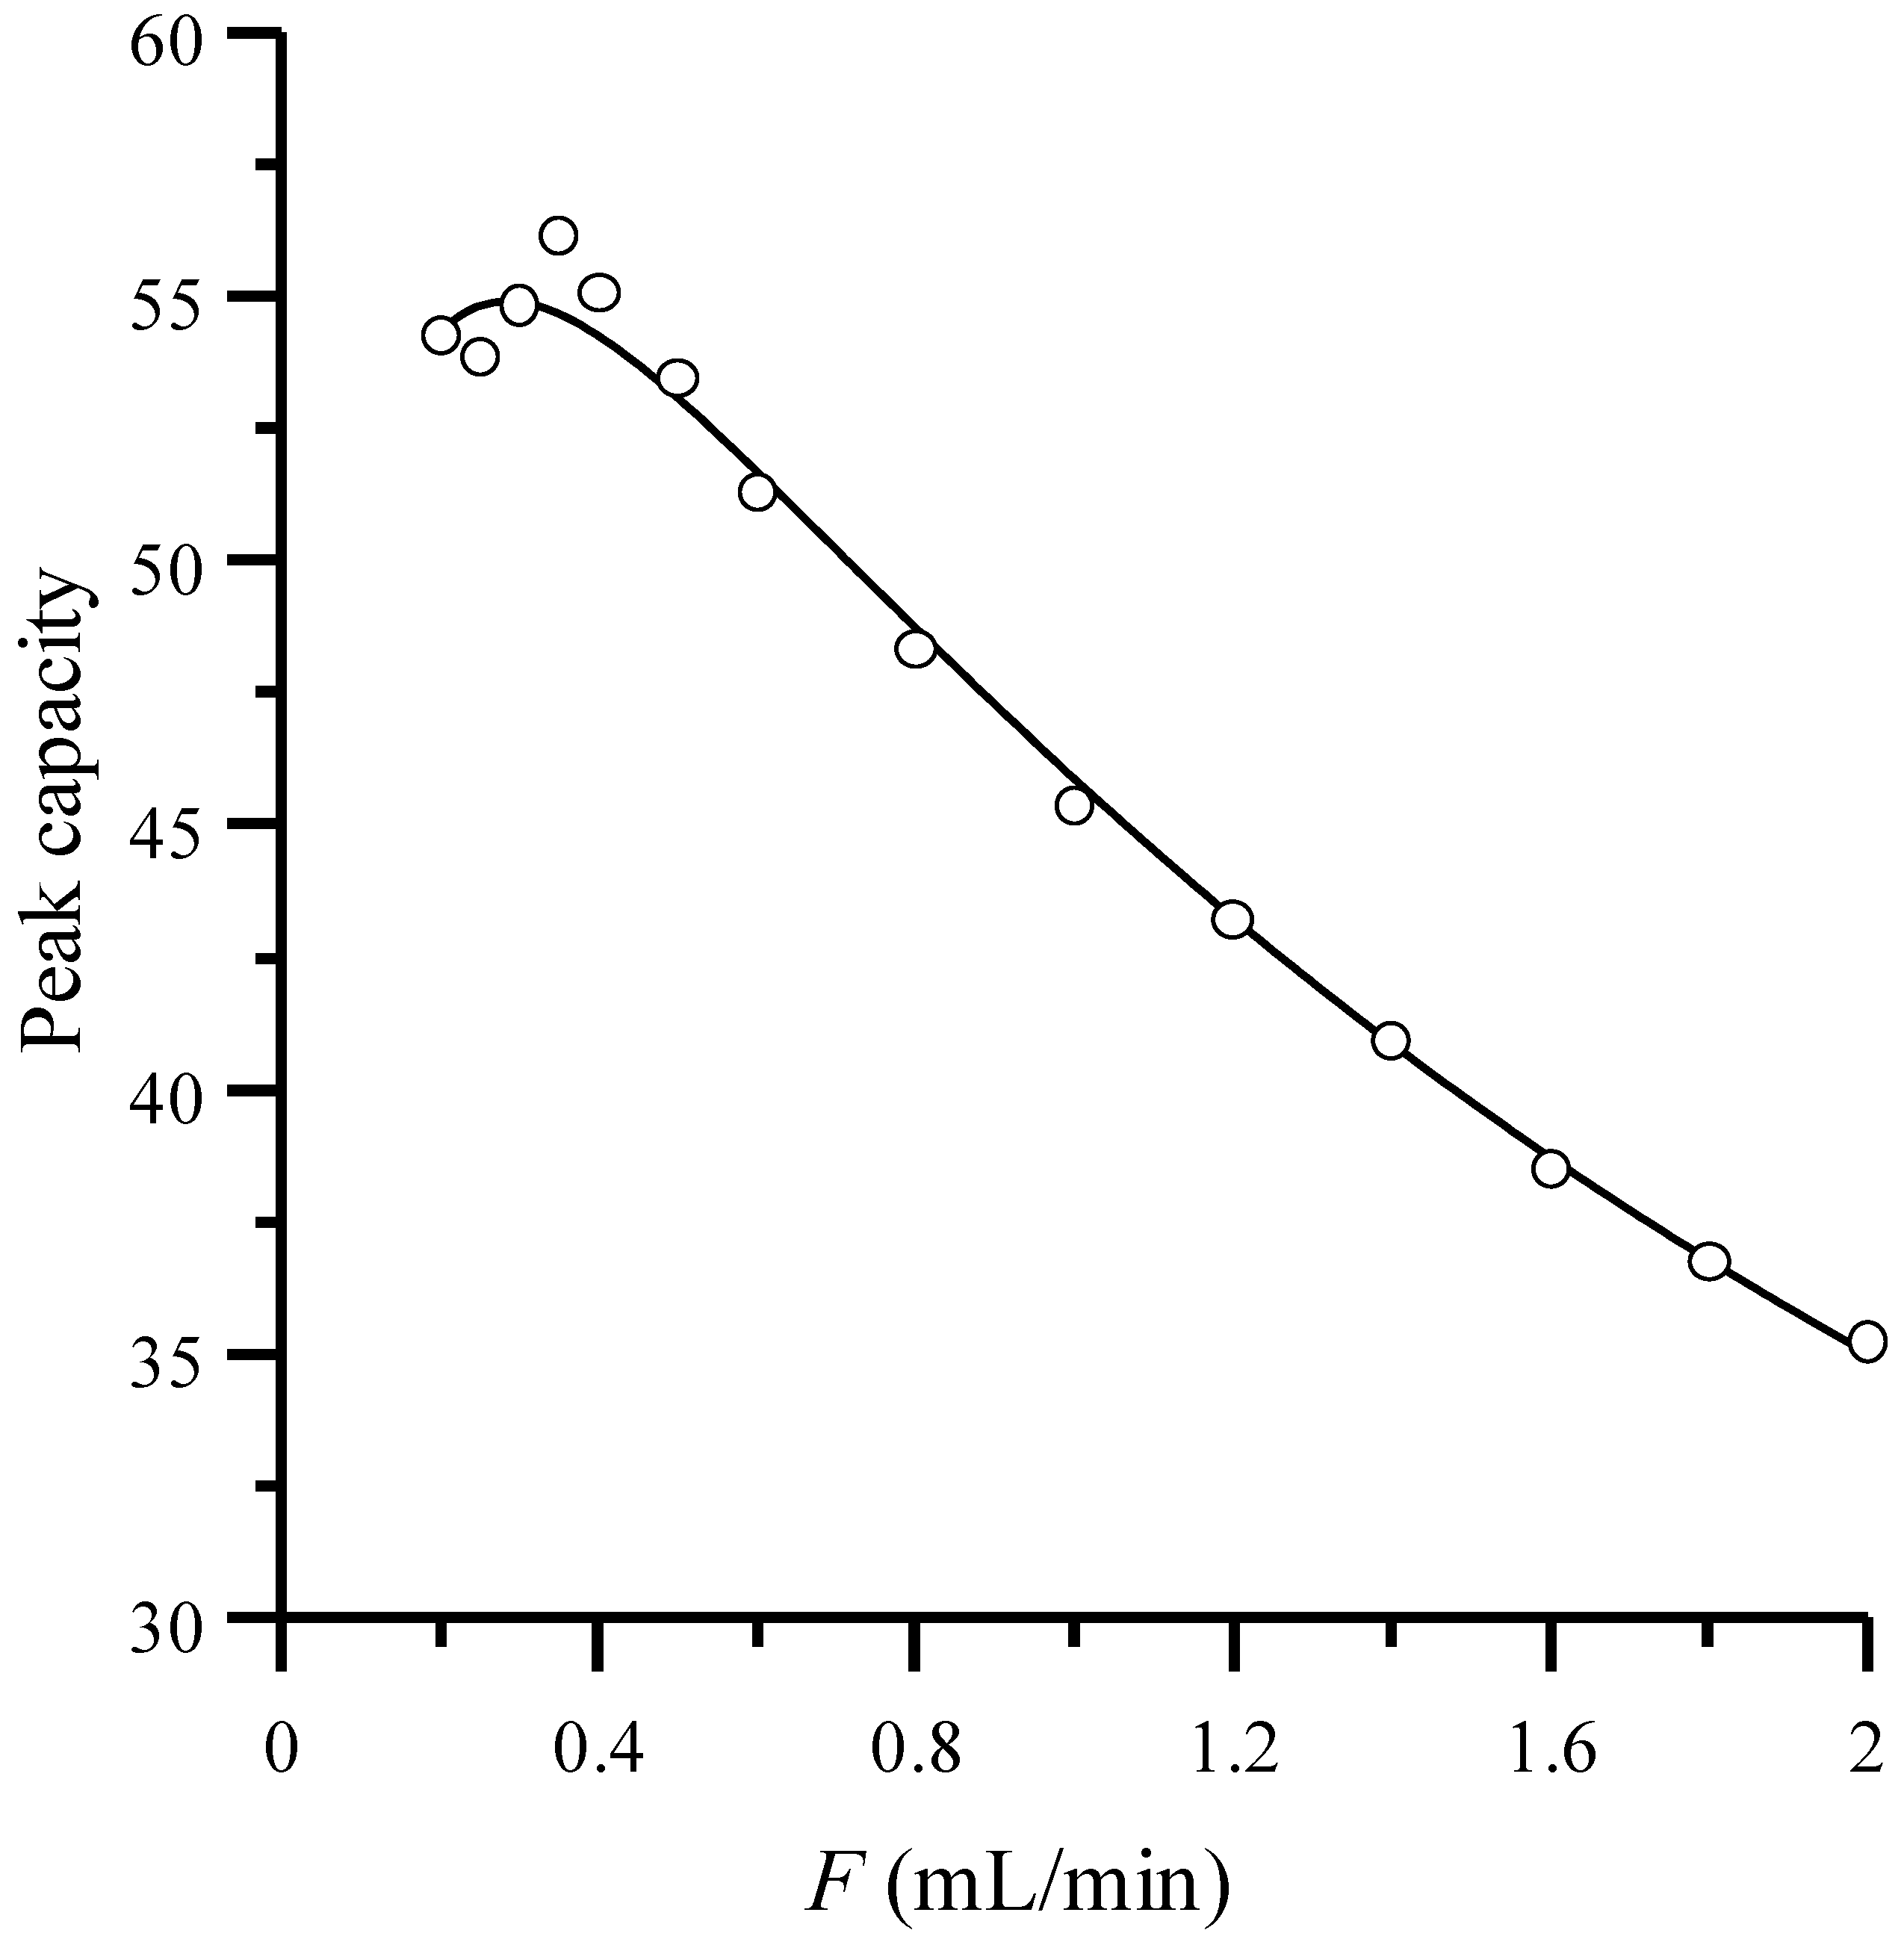
Figure 6, the experimental and predicted peak capacities for the set of sulfonamides eluted in a Spherisorb column at varying flow rates are depicted. The experimental
Pc is calculated from the
m and
n values (slope and intercept) for the linear fittings of the half-widths in volume units
versus the elution volume, using equations similar to Equations (4) and (5). The predicted peak capacities are calculated using Approach III and Equation (12) to obtain the
m and
n values from the fitted parameters (
a,
b,
c) and (
a0,
b0,
c0), respectively.
Figure 6.
Experimental (circles) and predicted (solid line) peak capacity in the first 20 mL of elution after the dead volume (V1 = V0 and Vn = V0 + 20), for the Spherisorb column, using the set of sulfonamides as probe compounds.
Figure 6.
Experimental (circles) and predicted (solid line) peak capacity in the first 20 mL of elution after the dead volume (V1 = V0 and Vn = V0 + 20), for the Spherisorb column, using the set of sulfonamides as probe compounds.


