Next Article in Journal
Development of Monolithic Column Materials for the Separation and Analysis of Glycans
Next Article in Special Issue
Determination of Trichloroethylene in Water by Liquid–Liquid Microextraction Assisted Solid Phase Microextraction
Previous Article in Journal
Analyses of Phytohormones in Coconut (Cocos Nucifera L.) Water Using Capillary Electrophoresis-Tandem Mass Spectrometry
 
 
Please note that, as of 1 January 2016, Chromatography has been renamed to Separations and is now published here.
Article

Quantification of Carbonyl Compounds Generated from Ozone-Based Food Colorants Decomposition Using On-Fiber Derivatization-SPME-GC-MS

by
Wenda Zhu
1,2,
Jacek A. Koziel
1,2,3,4,*,
Lingshuang Cai
2,5,
H. Duygu Özsoy
3,6 and
J. (Hans) Van Leeuwen
2,3,4
1
Interdepartmental Toxicology Program, Iowa State University, Ames, IA 50011, USA
2
Department of Agricultural and Biosystems Engineering, Iowa State University, Ames, IA 50011, USA
3
Department of Civil, Construction and Environmental Engineering, Iowa State University, Ames, IA 50011, USA
4
Department of Food Science and Human Nutrition, Iowa State University, Ames, IA 50011, USA
5
DuPont Crop Protection, Stine-Haskell Research Center, 1090 Elkton Road, Newark, Delaware, DE 19714, USA
6
Department of Environmental Engineering, Mersin University, Mersin 33110, Turkey
*
Author to whom correspondence should be addressed.
Chromatography 2015, 2(1), 1-18; https://doi.org/10.3390/chromatography2010001
Submission received: 3 December 2014 / Accepted: 19 December 2014 / Published: 24 December 2014
(This article belongs to the Special Issue Solid Phase Micro-Extraction)

Abstract

:
Fruit leathers (FLs) production produces some not-to-specification material, which contains valuable ingredients like fruit pulp, sugars and acidulates. Recovery of FL for product recycling requires decolorization. In earlier research, we proved the efficiency of an ozone-based decolorization process; however, it produces carbonyls as major byproducts, which could be of concern. A headspace solid-phase microextraction with on-fiber derivatization followed by gas chromatography-mass spectrometry was developed for 10 carbonyls analysis in ozonated FL solution/suspension. Effects of dopant concentration, derivatization temperature and time were studied. The adapted method was used to analyze ozonated FL solution/suspension samples. Dopant concentration and derivatization temperature were optimized to 17 mg/mL and 60 °C, respectively. Competitive extraction was studied, and 5 s extraction time was used to avoid non-linear derivatization of 2-furfural. The detection limits (LODs) for target carbonyls ranged from 0.016 and 0.030 µg/L. A much lower LOD (0.016 ppb) for 2-furfural was achieved compared with 6 and 35 ppb in previous studies. Analysis results confirmed the robustness of the adapted method for quantification of carbonyls in recycled process water treated with ozone-based decolorization. Ethanal, hexanal, 2-furfural, and benzaldehyde were identified as byproducts of known toxicity but all found below levels for concern.

1. Introduction

Fruit leathers (FLs) are prepared from fruit pulp, sugars and food-grade colorants. These candy snacks are produced at rates of thousands of tons per month in the US. The not-to-specification material is usually disposed of and results in additional costs. The waste material remains edible and contains valuable ingredients such as fruit pulp, sugars and acidulates. However, an unappetizing brownish color from the mixture of colorants is a problem with recycling FL to the production process. Colorant removal is a necessary step in the recycling procedure. Activated carbon adsorption proved suitable, but impractical [1]. Ozonation has been a treatment of choice for the removal of color from water or industrial wastewater [2,3]. Ozone actually has GRAS (generally regarded as safe) status from the US Food and Drug Administration [4]. Our previous publication described how ozonation was used for research on color removal from waste FLs [5]. In this research, we describe analytical method development for quantification of ozonation by-products in a very complex matrix of FL suspension/solution.
Food colorants as used in FLs, 2-naphthalenesulfonic acid (Allura Red AC, Red 40), tartrazine (Yellow 5), and erioglaucine (Brilliant Blue FCF, Blue 1), were successfully decolorized by ozone treatment. A concern of this process is generation of carbonyl compounds [5]. Among the detected carbonyl compounds, 2-furfural and benzaldehyde are of some health concern [6]. In addition, both ethanal (acetaldehyde) that has food uses as a flavor adjuvant [7] or natural occurrence in food [8], and hexanal, used in foods as a flavorant at 0.005 to 4 ppm to impart a fruit flavor [9], can be of concern at higher concentrations [10].
Ozonation of azo dyes has also been shown to result in a variety of aldehydes, such as butanal, hexanal, heptanal, octanal, nonanal, and decanal [11]. Carbonyl compounds have also been found as major byproducts in other ozonolysis applications, such as treatment of paper pulp and water [12] and in the oxidative disinfection of drinking water [13]. Although most of these aldehydes are of negligible or minor concern, toxicity can arise during metabolism. The two major metabolic pathways of aldehydes in the human body are oxidation to carboxylic acids and reduction to alcohols, with oxidation being both dominant and irreversible [14]. Another metabolic pathway involves interaction between the carbonyl group and thiol or amine groups, which can lead to covalent crosslinking between DNA and proteins (DNA-protein, protein-protein, DNA-DNA) [15,16,17]. These reactions may ultimately result in mutation and tumor formation, as studies on laboratory animals have shown [10].
Derivatization is commonly used to stabilize and extract reactive compounds from complex matrixes. Carbonyl compounds are also reactive outside of the body, and are typically derivatized for sampling [12]. For example, solid-phase extraction (SPE) has also been coupled with PFBHA derivatization for the extraction of carbonyls from wine [18]. Ortiz et al. used an annular denuder coated with O-(2,3,4,5,6-pentafluorobenzyl)hydroxylamine hydrochloride (PFBHA) for collection of biofunctional carbonyl compounds from ambient air [19]. The captured aldehydes were then extracted using acetonitrile/CH2Cl2 for instrumental analysis. Derivatization reagent of 2,4-dinitrophenyl-hydrazine (DNPH) was used as the derivatization reagent coated onto silica gel cartridges in a study on carbonyls from engine exhaust [20]. A drawback of the methods described above is that they require laborious pre-analytical sample preparation and use of solvents.
Solid-phase microextraction (SPME) is a technique that integrates both sampling and sample preparation steps [21]. SPME is reusable and does not require the use of solvents. On-fiber derivatization with SPME was developed by Martos and Pawliszyn [22] for gaseous formaldehyde. Derivatization time was as short as 10–300 s in this procedure. The technique has been applied successively for analysis of carbonyls in water (bidistilled water, ozonated drinking water, and rain water), indoor air, wine, and human blood in combination with PFBHA derivatization [13,22,23,24,25]. Three options are typically available to perform derivatization with SPME: derivatization inside GC injection port, direct derivatization in sample matrix and derivatization on the surface of the SPME fiber coating. Derivatization in the GC injector calls for injection of derivatization reagent into the injector before thermal desorption of SPME fiber, and derivatization proceeds afterwards. Higher sensitivity was reported in previous studies on aldehyde analysis in water with direct derivatization in a sample matrix (bidistilled water, ozonated drinking water, and rain water) [13], drinking water [10], aqueous particulate matter extracts of diesel exhaust and wood smoke [26], beer [27], spirits and alcoholic beverages [28], and diluted grape pomace distillates [29]. However, longer derivatization times—up to several hours—were needed in a diluted solution of derivatization reagent and carbonyl compounds [10,13,26,28]. Extraction times with direct derivatization in solution was shortened to 20 min [30] with a HS autosampler and GC-MS.
On-fiber derivatization with SPME continues to be the method of choice where high specificity of extraction from complex food and beverage-related matrices is needed. Cai et al. [31] developed a SPME-based method for trans- and cis-resveratrol in wine using an on-fiber silylation derivatization with bis(trimethylsily)trifluoroacetamide (BSTFA). A summary of on-fiber derivatization with SPME-based methods applied to carbonyl analysis is presented in Table 1. To date, no studies report application of on-fiber derivatization to food processing water with suspended solids except for [32] (i.e., quantification of formaldehyde in municipal wastewater). Thus, there is a need to test this approach to multiple carbonyls in a highly complex matrix where apparent competition between analytes for derivatizing agent might be significant.
The objective of this research was to develop a sampling and analysis method for quantification of carbonyl compounds in ozonated FL solution/suspension. SPME was combined with gas chromatography and mass spectrometry (GC-MS) with an optimized derivatization procedure for the study of byproducts from the ozonolytic breakdown of food colorants. Effects of dopant concentration, derivatization temperature and derivatization time were studied. PFBHA was selected as a derivatization reagent for its superior on-fiber derivatization performance [33]. 2-Furfural with an electrophilic carbonyl carbon, and a high steric hindrance was expected to have a low affinity to PFBHA and relatively poor detection limits reported in previous studies [26,27]. The potential toxicity associated with this chemical rendered it necessary to focus specifically on achieving a lower detection limit compared with previous research and addressing apparent competitive extraction of 2-furfural from the matrix of many other carbonyl compounds.
Table 1. Comparison of studies on carbonyl compounds analysis using solid-phase microextraction (SPME) on-fiber/direct derivatization with PFBHA in liquid samples.
StudyMatrixAnalysis MethodInternal Standard(Range of Carbon Number of) Target Carbonyls(Range of) LOD/ppb(v)Description of the Study
Beránek et al., 2008 [26]Aqueous particulate matter extracts of wood smoke and diesel exhaustGC-MS (TIC)butanal-d2 and benzaldehyde-d6C1-C120.1–55A SPME-GC-MS method for trace analysis of a wide range of carbonyls was developed. Headspace and direct extractions from liquid phase with on-fiber derivatization were tested. Effects of extraction time and temperature were tested.
Ethanal3.7
Benzaldehyde2.3
2-Furfural35
Hexanal0.7
Saison et al., 2008 [27]BeerGC-MS (TIC)2-heptanol and guaiacol or p-fluorobenzaldehydeC3-C100.003–310Two SPME-GC-MS procedures for analysis of volatiles in beer were developed. Effects of time and temperature of PFBHA doping and derivatization, salt addition, and matrix effects were studied.
Hexanal0.028
Benzaldehyde0.078
2-Furfural6.0
Trenholm et al., 2008 [32]Municipal wastewaterGC-MS (TIC/SIM)acetone-d6C13.7A rapid and automated SPME-GC-MS method utilizing SPME autosampler was developed for formaldehyde analysis. Reproducibility and background contamination were reported.
Tsai et al., 2003 [34]Water (bi-distilled water, well water, chlorinated tap water)GC-MS-(TIC)decafluorobiphenylC1-C50.12–0.34A SPME-GC-MS method for the analysis of short chain aliphatic aldehydes was developed. Effects of time for PFBHA doping and derivatization were tested.
Deng et al., 2004 [23]Human bloodGC-MS (TIC/SIM)None C2-C70.44 × 10−4–6.0 × 10⁻⁴A SPME-GC-MS method was developed for the analysis of short chain aliphatic aldehydes in human blood as a diagnostic measure of cancer status. Effects of derivatization time and temperature were tested.
Ethanal0.44 × 10−4
Hexanal6.0 × 10−4
Wang et al., 2005 [33]Particle board, wine and fishGC-MS/FIDNone C1-C92–25An automated SPME-GC-MS method was developed for the analysis of low-molecular mass aldehydes in the given sample. PFPH was compared with PFBHA. Limiting factor was determined to be diffusion of analytes from sample to headspace.
Ethanal0.5
Hexanal0.5
This studyWastewater (ozonated fruit leather) solution / suspension)GC-MS (TIC/SIM)NoneC2-C70.016–0.030A SPME-GC-MS method was developed for the analysis of carbonyls from ozone-based food colorant decomposition. Effects of dopant concentration, derivatization temperature and time were studied. Inaccuracy from competitive derivatization was minimized with a short derivatization time.
Ethanal0.030
Hexanal0.029
Benzaldehyde0.016
2-Furfural0.016

2. Experimental Section

2.1. Reagents and Materials

Standards of carbonyls used were of 95% and higher purity. Methanol, acetone, 2-heptanone, hexanal, octanal, benzaldehyde and PFBHA were from Sigma-Aldrich (Milwaukee, WI, USA); ethanal, propanal, butanal and pentanal were from Acros Organics, Thermo Fisher Scientific (New Jersey, NJ, USA); and 2-furfural was from Alfa Aesar (Ward Hill, MA, USA). All SPME fibers and holders were from Supelco (Bellefonte, PA, USA).

2.2. Response Factor Calculation

The evaluation of extraction efficiency requires interpreting the MS detector response to each chemical and calibrating it to its mass of product extracted by on-fiber derivatization in SPME. The response factor of the specific chemical resulting in the derivatization reaction, i.e., as a ratio of the MS peak area (in single ion mode) count of a carbonyl to known amount by its mass:
Response factor = peak area count of oxime (isomers)/mass (ng) of injected derivatized carbonyl
A specific amount of carbonyl compound was spiked to PFBHA methanol solution for reaction to obtain carbonyl derivatives for response factor calculations. The molar concentration of PFBHA solution was 10 times higher than that of the carbonyl compound to ensure a quantitative reaction, and the reaction was carried out in the dark at room temperature for at least 2 h [12]. The solution was then quantitatively introduced into the GC-MS system by direct injection.

2.3. On-fiber Derivatization HS-SPME

The derivatizing agent was selected based on findings in the literature. PFBHA was found to be the optimal derivatization reagent for SPME analysis [22]. Other derivatizing agents, e.g., 2,4-dinitrophenylhydrazine (DNPH) and hydroxymethyl piperidine (HMP) were found to generate a number of byproducts and potentially interfering chromatographic peaks in application with SPME. Several researchers reported that at least 30 min of derivatization reaction time is required in a diluted solution of derivatization reagent and carbonyl compounds for direct (i.e., from the liquid phase) derivatization [13,26,27]. An on-fiber derivatization method was used in the present study similarly to the approach taken by others [22,23,24,26]. The derivatization reagent is first doped onto the SPME fiber in this process, and then the fiber coated with PFBHA is exposed to the headspace of the sample solution to react with carbonyl compounds. A 65 µm PDMS/DVB (poly-dimethylsiloxane/divinylbenzene) fiber was selected according to a previous study by Martos and Pawliszyn (2001) [22].
The effects of dopant concentration, derivatization temperature and derivatization time were studied in this research. PFBHA doping concentrations ranged from 0.5, 3.75 and 17 mg/mL. The latter being consistent with [22,24]. Lower dopant concentrations were tested in order to further economize on the use of dopant and derivatization time in this method. The concentration of each carbonyl compound in the standard solution was about 5 µg/L A 1 cm PTFE-coated stir bar was placed in the sample, to stir at 800 rpm, and the vial was placed in a water bath set to a specific temperature (40, 60 or 80 °C, depending on the experiment) during both the doping and derivatization procedures. All experiments were conducted using aqueous solutions of 1 mL that were placed in a 4 mL polytetrafluoroethene (PTFE)-capped vial to perform HS-SPME. For PFBHA doping, a PDMS/DVB fiber was exposed to the headspace of 1 mL PFBHA aqueous solution for 15 min. The SPME fiber was introduced into the headspace of a sample solution immediately after doping with PFBHA. Direct extensions by immersing a PFBHA coated PDMS/DVB fiber into the sample solution was found to dissolve the PFBHA coating [26]. Headspace extraction was performed for a specific time ranging from 2 s to 60 min. The doping procedure and on-fiber derivatization were both performed in the same thermal water bath at the same temperature. Derivatization efficiencies were evaluated by comparing the MS detector response to carbonyl derivatives for determination of optimum SPME conditions.

2.4. GC-MS Condition for Carbonyls Analysis

The SPME fiber was introduced to the injection port of the GC instrument for thermal desorption after on-fiber derivatization. An Agilent 6890N GC system was equipped with Agilent 5975C VL MSD. Samples were separated with a 60 m × 0.32 mm × 0.25 µm SGE BP-21 column. The GC injection port temperature was 250 °C. The oven temperature was raised from 120 °C to 180 °C at a 4.5 °C/min ramp, and then to 220 °C ramped at 15 °C/min, holding for 3 min. Helium was the carrier gas and the flow rate was 1.7 mL/min. The scanning range of the MS detector was m/z = 33 to 352. Temperatures of the MS source and MS quadrupole were 230 °C and 150 °C, respectively. A selective ion monitoring (SIM) mode was run simultaneously with total scanning mode for quantification. The following ions were used for quantification for ethanal, hexanal, 2-furfural, and benzaldehyde: 209, 239, 291 and 301, respectively. The full list of SIM ions of carbonyl-PFBHA derivatives is listed in a previous study of the ozonation of colorants [5].

2.5. Validation of the Method

Method development was based on the analysis of ten selected carbonyls generated from ozone induced decomposition of food colorants, including ethanal, propanal, butanal, pentanal, hexanal, octanal, acetone, 2-heptanone, 2-furfural, and benzaldehyde [5]. Target aldehydes for quantification were selected based on their known toxicity and presence in ozonated FL solution/suspension. Calibration curves of target aldehydes of ethanal, hexanal, 2-furfural, and benzaldehyde were generated, and the concentrations were in the range of 2–50 µg/L, 20–8000 µg/L, 0.04–0.8 ng/L, and 0.1–1.5 µg/L respectively. Standard concentration ranges corresponded to the range of concentrations in the real sample of ozonated FL solution/suspension. The limit of detection (LOD), and limit of quantification (LOQ) were determined by analyzing 0.1 µg/L spiked aqueous solutions in 7 replicates [35]. The LODs were estimated as the product of standard deviation of (n = 7) replicate analyses and Student’s t-value for the 99% confidence level with n−1 degrees of freedom. The LOQ were estimated as a product of standard deviation of replicate analyses (n = 7) and 10.

2.6. Analyses of Ozonated Fruit Leather Solution / Suspension Samples

Ozone-based decolorization of waste FL is a new possible ozone application. This ozone application is an indispensable procedure in a colored-food-material recycle practice. Colorants are selectively removed to avoid an unappetizing brownish color from mixed colorants. The ozonation system for ozone-based decolorization described in the previous study [5] was used in FL solution/suspension treatment. Three ozone dosages, 6.2 g/L, 15.4 g/L, and 21.6 g/L, were applied to 200 mL of 100% FL solution/suspension in replicates. Treatments at a zero ozone dosage served as the control group. One mL of post-treatment sample was transferred to a 4 mL PTFE-capped vial, and submitted for sampling with derivatization and analysis using the newly developed method immediately after each treatment.

3. Results and Discussion

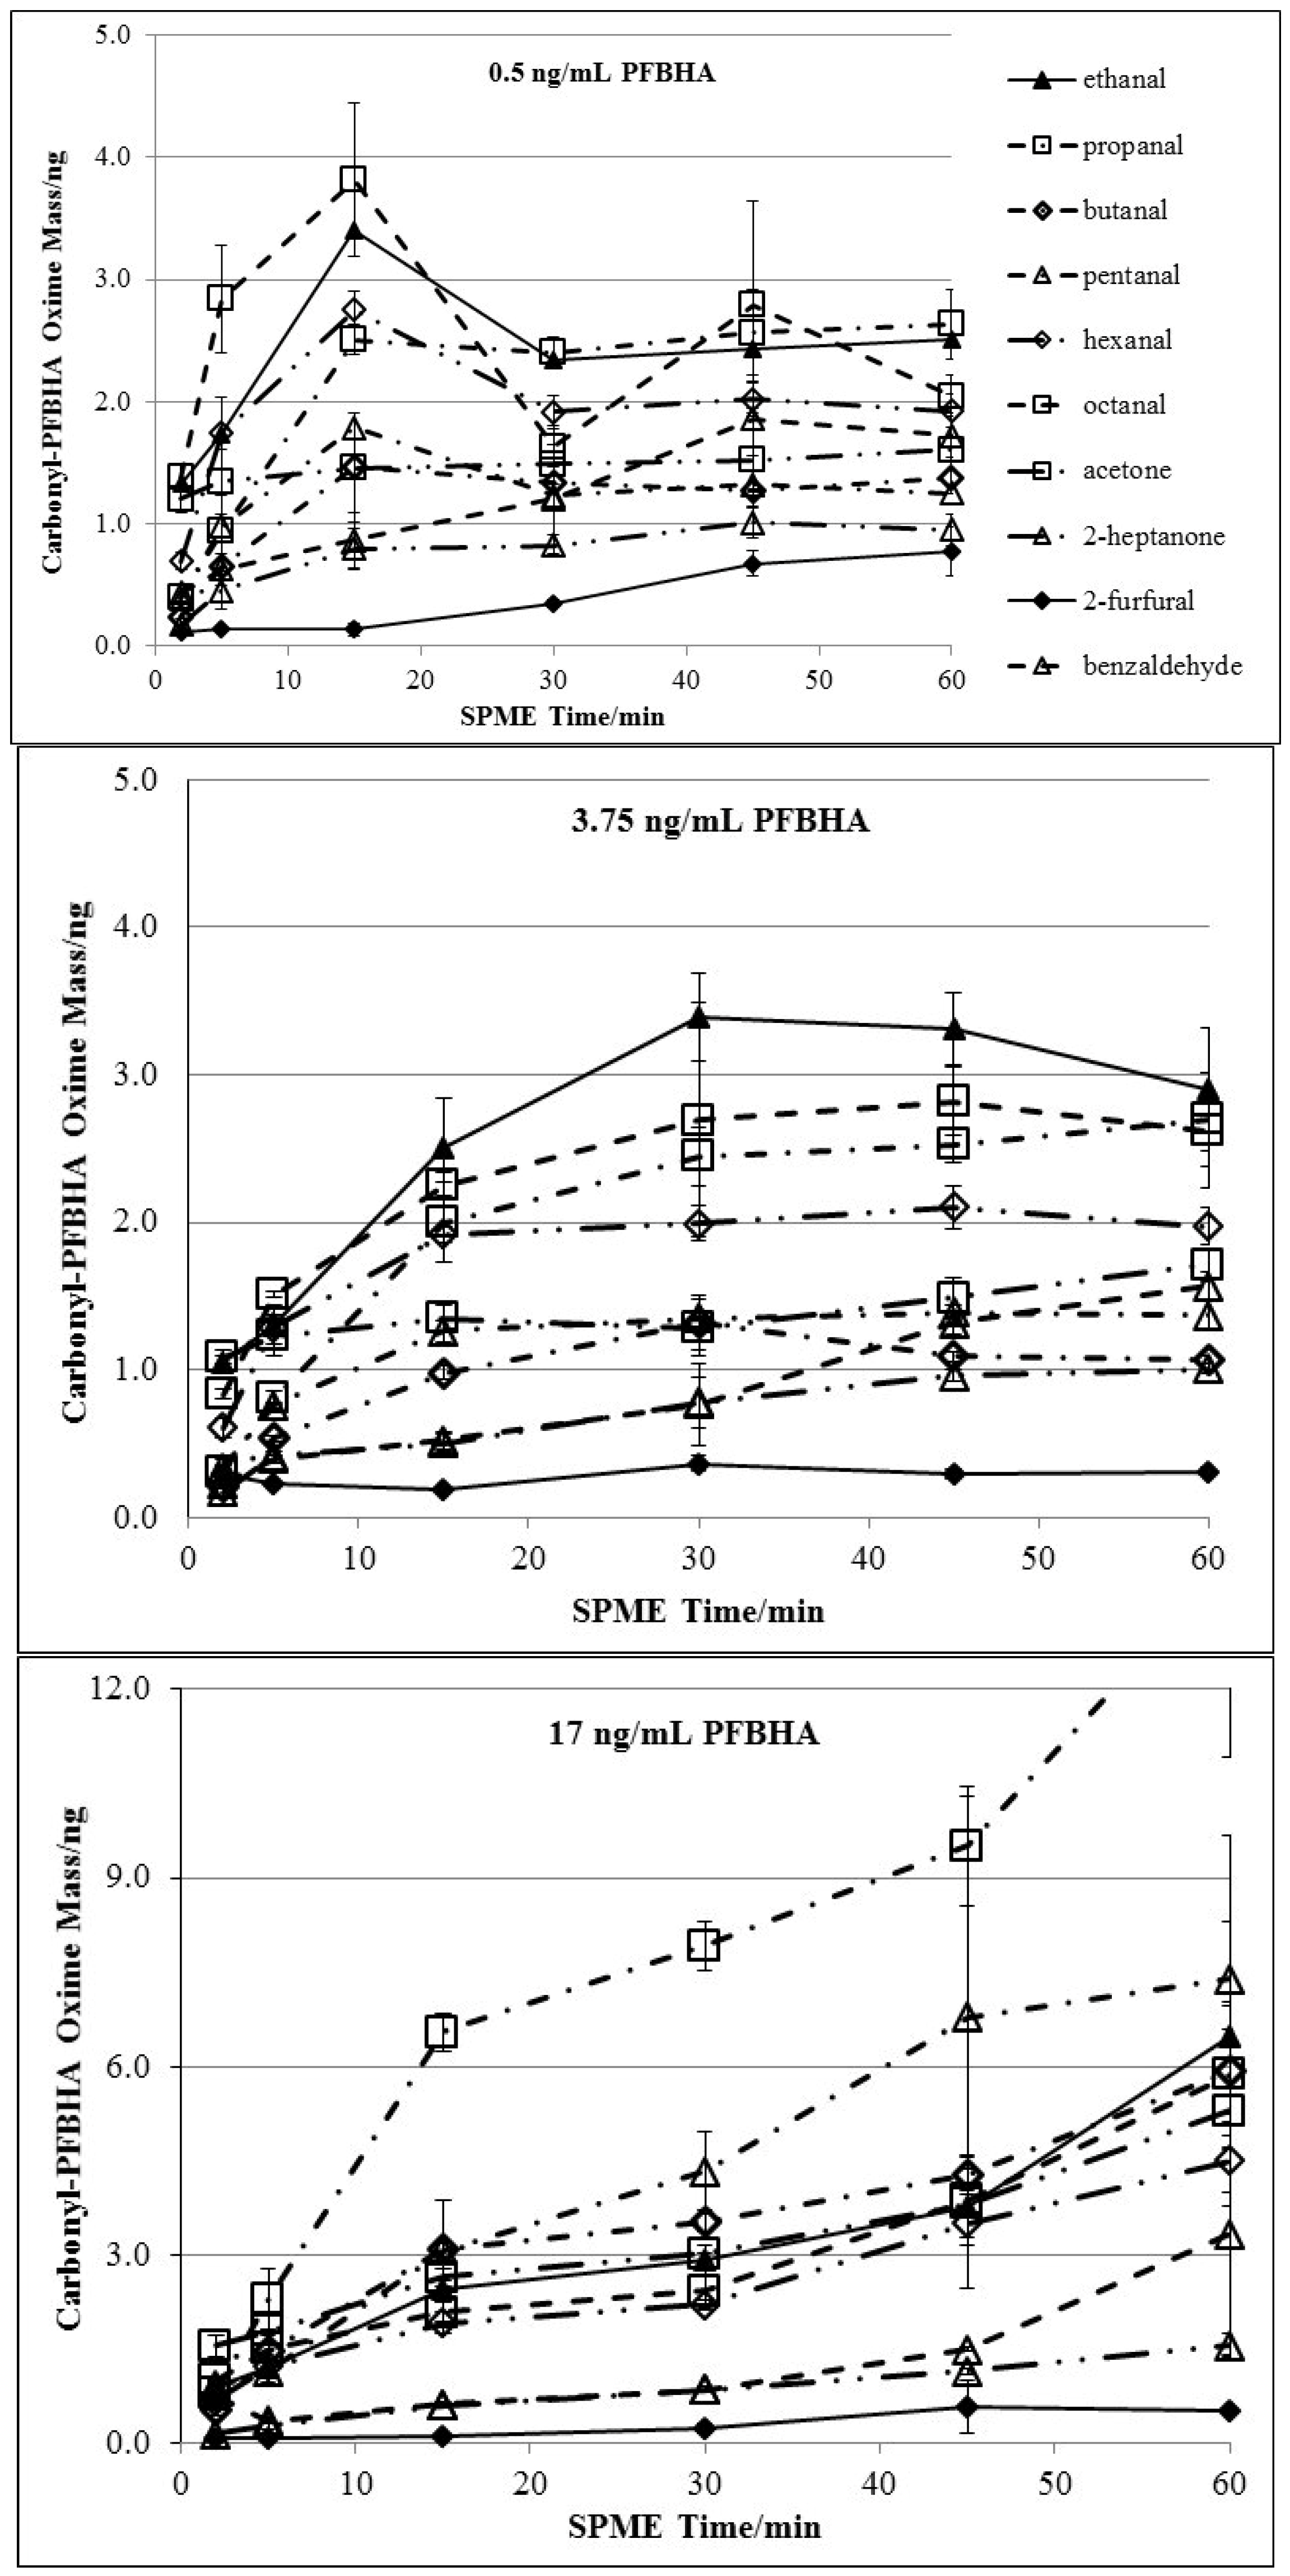
3.1. Doping of PFBHA

The selected fiber, 65 µm PDMS/DVB, was chosen because of its high affinity to PFBHA. The benzene rings both in DVB phase in SPME coating and PFBHA/oxime derivatives are expected to form a strong conjugated bond. The PDMS/DVB coating doped with PFBHA was found to retain a large amount of dopant after exposed in ambient air [22]. Main factors influencing the uptake of carbonyls include: (1) availability of reaction (derivatization) sites on SPME fiber coated/doped with PFBHA; (2) the kinetics of derivatization reactions; and (3) mass transport/diffusion of analytes from liquid phase to headspace, and through the boundary layer around the SPME fiber coating. On-fiber derivatization mass extracted vs. time profiles for 10 carbonyls were generated based on different PFBHA doping concentrations (0.5, 3.75 and 17 mg/mL). The concentration of each carbonyl compound in the standard solution was about 5 µg/L. Figure 1 shows the effects of PFBHA dopant concentration. Maximum carbonyl recovery was clearly limited for the lower PFBHA dopant concentrations of 0.5 and 3.75 mg/mL. Specifically, the limited amount of PFBHA was limiting the derivatization reaction when extractions were carried out for longer than 15 min. Very similar derivatization rates (factor #2), were observed for different PFBHA dopant concentrations within the first 15 min of derivatization, since there was no limitation to the dopant availability.
Figure 1. Comparison of the effects of different PFBHA doping concentrations on derivatization-time reaction profiles. Part A: PFBHA concentration at 0.5 ng/mL. Part B: PFBHA concentration at 3.75 ng/mL. Part C: PFBHA concentration at 17 mg/mL.
Chromatography 02 00001 g001
Aldehyde extraction within the first 15 min of derivatization increased steadily regardless of PFBHA dopant concentration. The effect of PFBHA dopant concentration on aldehydes uptake within the first 15 min are shown in Table 2 and Figure 2. The mass of derivatized carbonyl taken up reflects the overall derivatization rate over a certain derivatization time. No significant differences resulting from different PFBHA dopant concentrations were observed for several aldehydes at the same derivatization time (Table 2). Derivatization rates did not proportionally increase against PFBHA dopant concentration for the other aldehydes either (Figure 2). No proportional relationship of derivatization rate against PFBHA dopant concentration was observed for the first 15 min of derivatization. This observation shows that reaction sites were not saturated with aldehydes within 15 min derivatization at the lower and lowest PFBHA doping concentrations. PFBHA doping concentration had no significant effect on aldehydes uptake in this case.
Table 2. F-test results on the effect of PFBHA dopant concentration on aldehydes uptake at specific derivatization times from 2 to 15 min.
Chemical2 min derivatization5 min derivatization15 min derivatization
P valueSignificant DifferenceP valueSignificant DifferenceP valueSignificant Difference
Ethanal0.011N0.052N0.003Y
Propanal0.003Y0.003Y0.000Y
Butanal0.001Y0.001Y0.000Y
Pentanal0.000Y0.084N0.008Y
Hexanal0.399N0.021N0.000Y
Octanal0.001Y0.002Y0.002Y
Acetone0.016N0.018N0.002Y
2-Heptanone0.671N0.180N0.036N
2-Furfural0.015N0.000Y0.057N
Benzaldehyde0.001Y0.013N0.050N
Note: The F-test hypothesis: PFBHA dopant concentration does not contribute to the difference in each individual aldehyde extraction efficiency. Y: P > 0.01, indicating that there is no significant difference of the extraction efficiency for a certain aldehyde at a particular derivatization time. N: P < 0.01, indicating significant difference of the extraction efficiency for a certain aldehyde at various derivatization times as a result of PFBHA dopant concentration variation.
Figure 2. PFBHA dopant concentration versus aldehydes uptake profile at specific derivatization times. Part A: 2 min derivatization. Part B: 5 min derivatization. Part C: 15 min derivatization.
Chromatography 02 00001 g002aChromatography 02 00001 g002b
However, a significant decrease in recovery after 15 min derivatization was observed for 0.5 mg/mL dopant concentration. Such a decrease was also observed after 30 min with 3.75 mg/mL dopant concentration. This indicated that the number of available PFBHA sites for reaction with headspace carbonyls (factor #1) became the limiting factor at lower PFBHA doping concentrations. However, no apparent limitation of dopant availability was observed for up to 60 min derivatization and the highest, 17 mg/mL PFBHA concentration. This was expected since higher PFBHA concentration and on-fiber loading was proportional to the higher PFBHA doping concentration. To achieve maximum carbonyl derivatization rates, the highest dopant solution concentration of 17 mg/mL was selected. This PFBHA concentration was selected by default in earlier studies [23,26,32,34]. Doping time, i.e., loading of PFBHA onto the fiber, was 15 min. Since no significant reduction of recovery was observed for lower PFBHA dopant concentration within 15 min derivatization time, use of lower PFBHA concentrations is feasible in future to lower analytical expenses, especially if shorter extraction/derivatization times are used and aldehyde concentrations are very low.

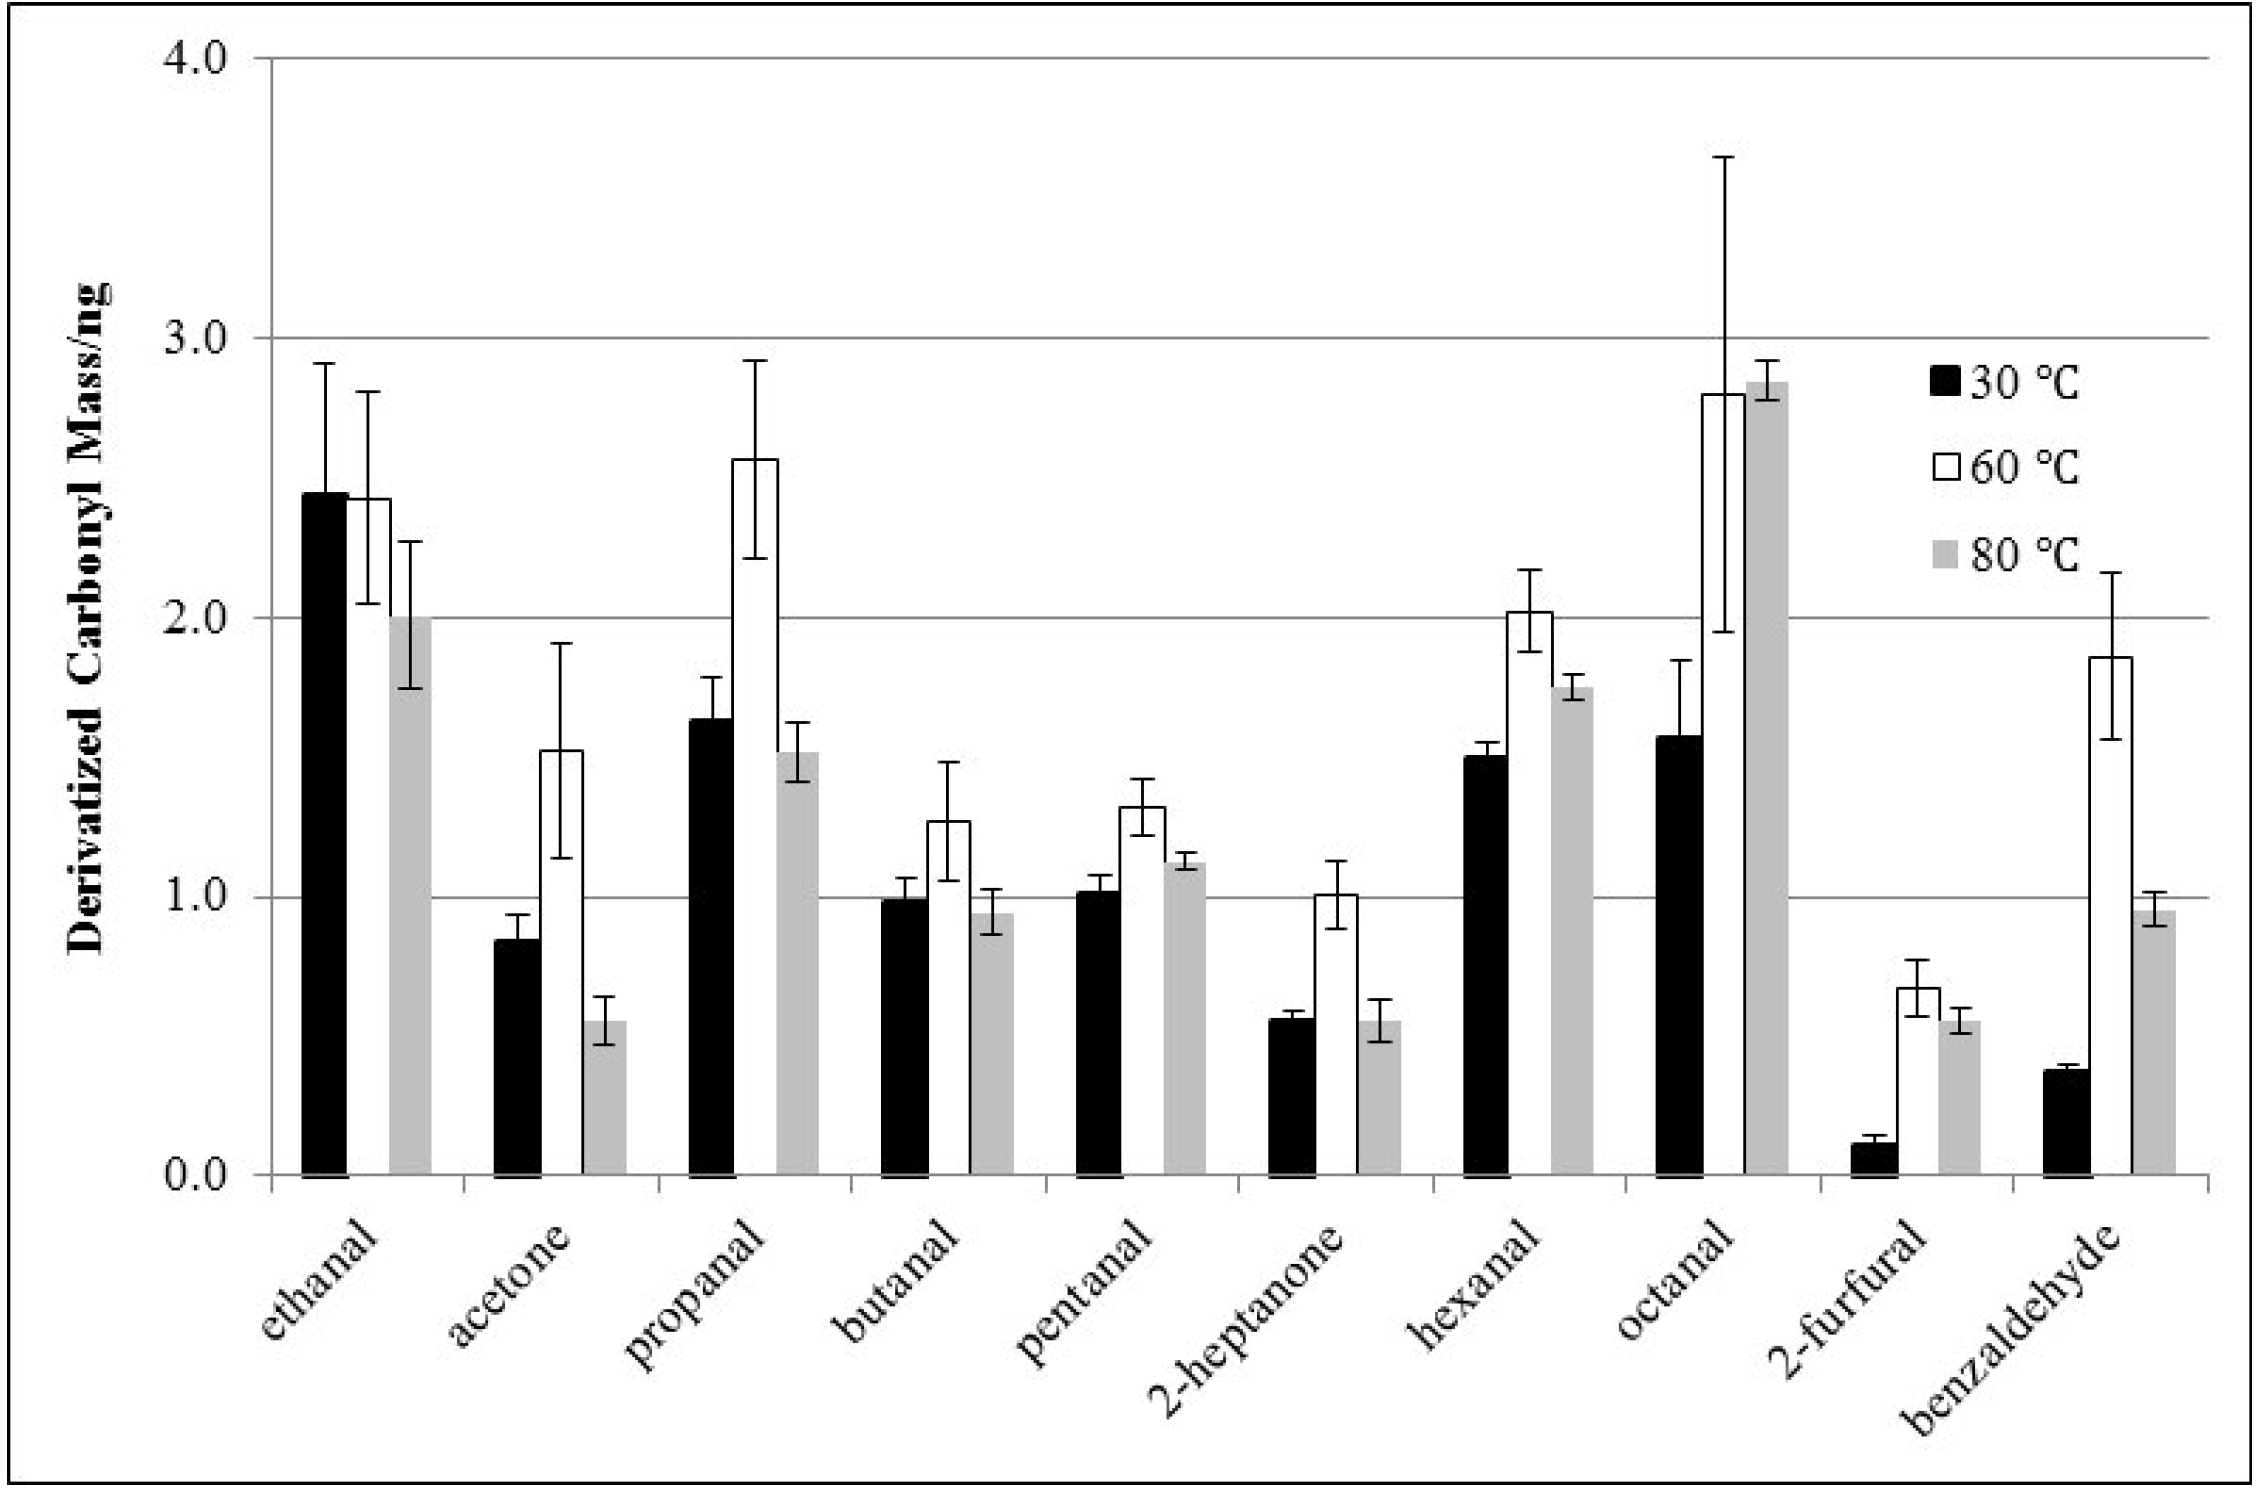
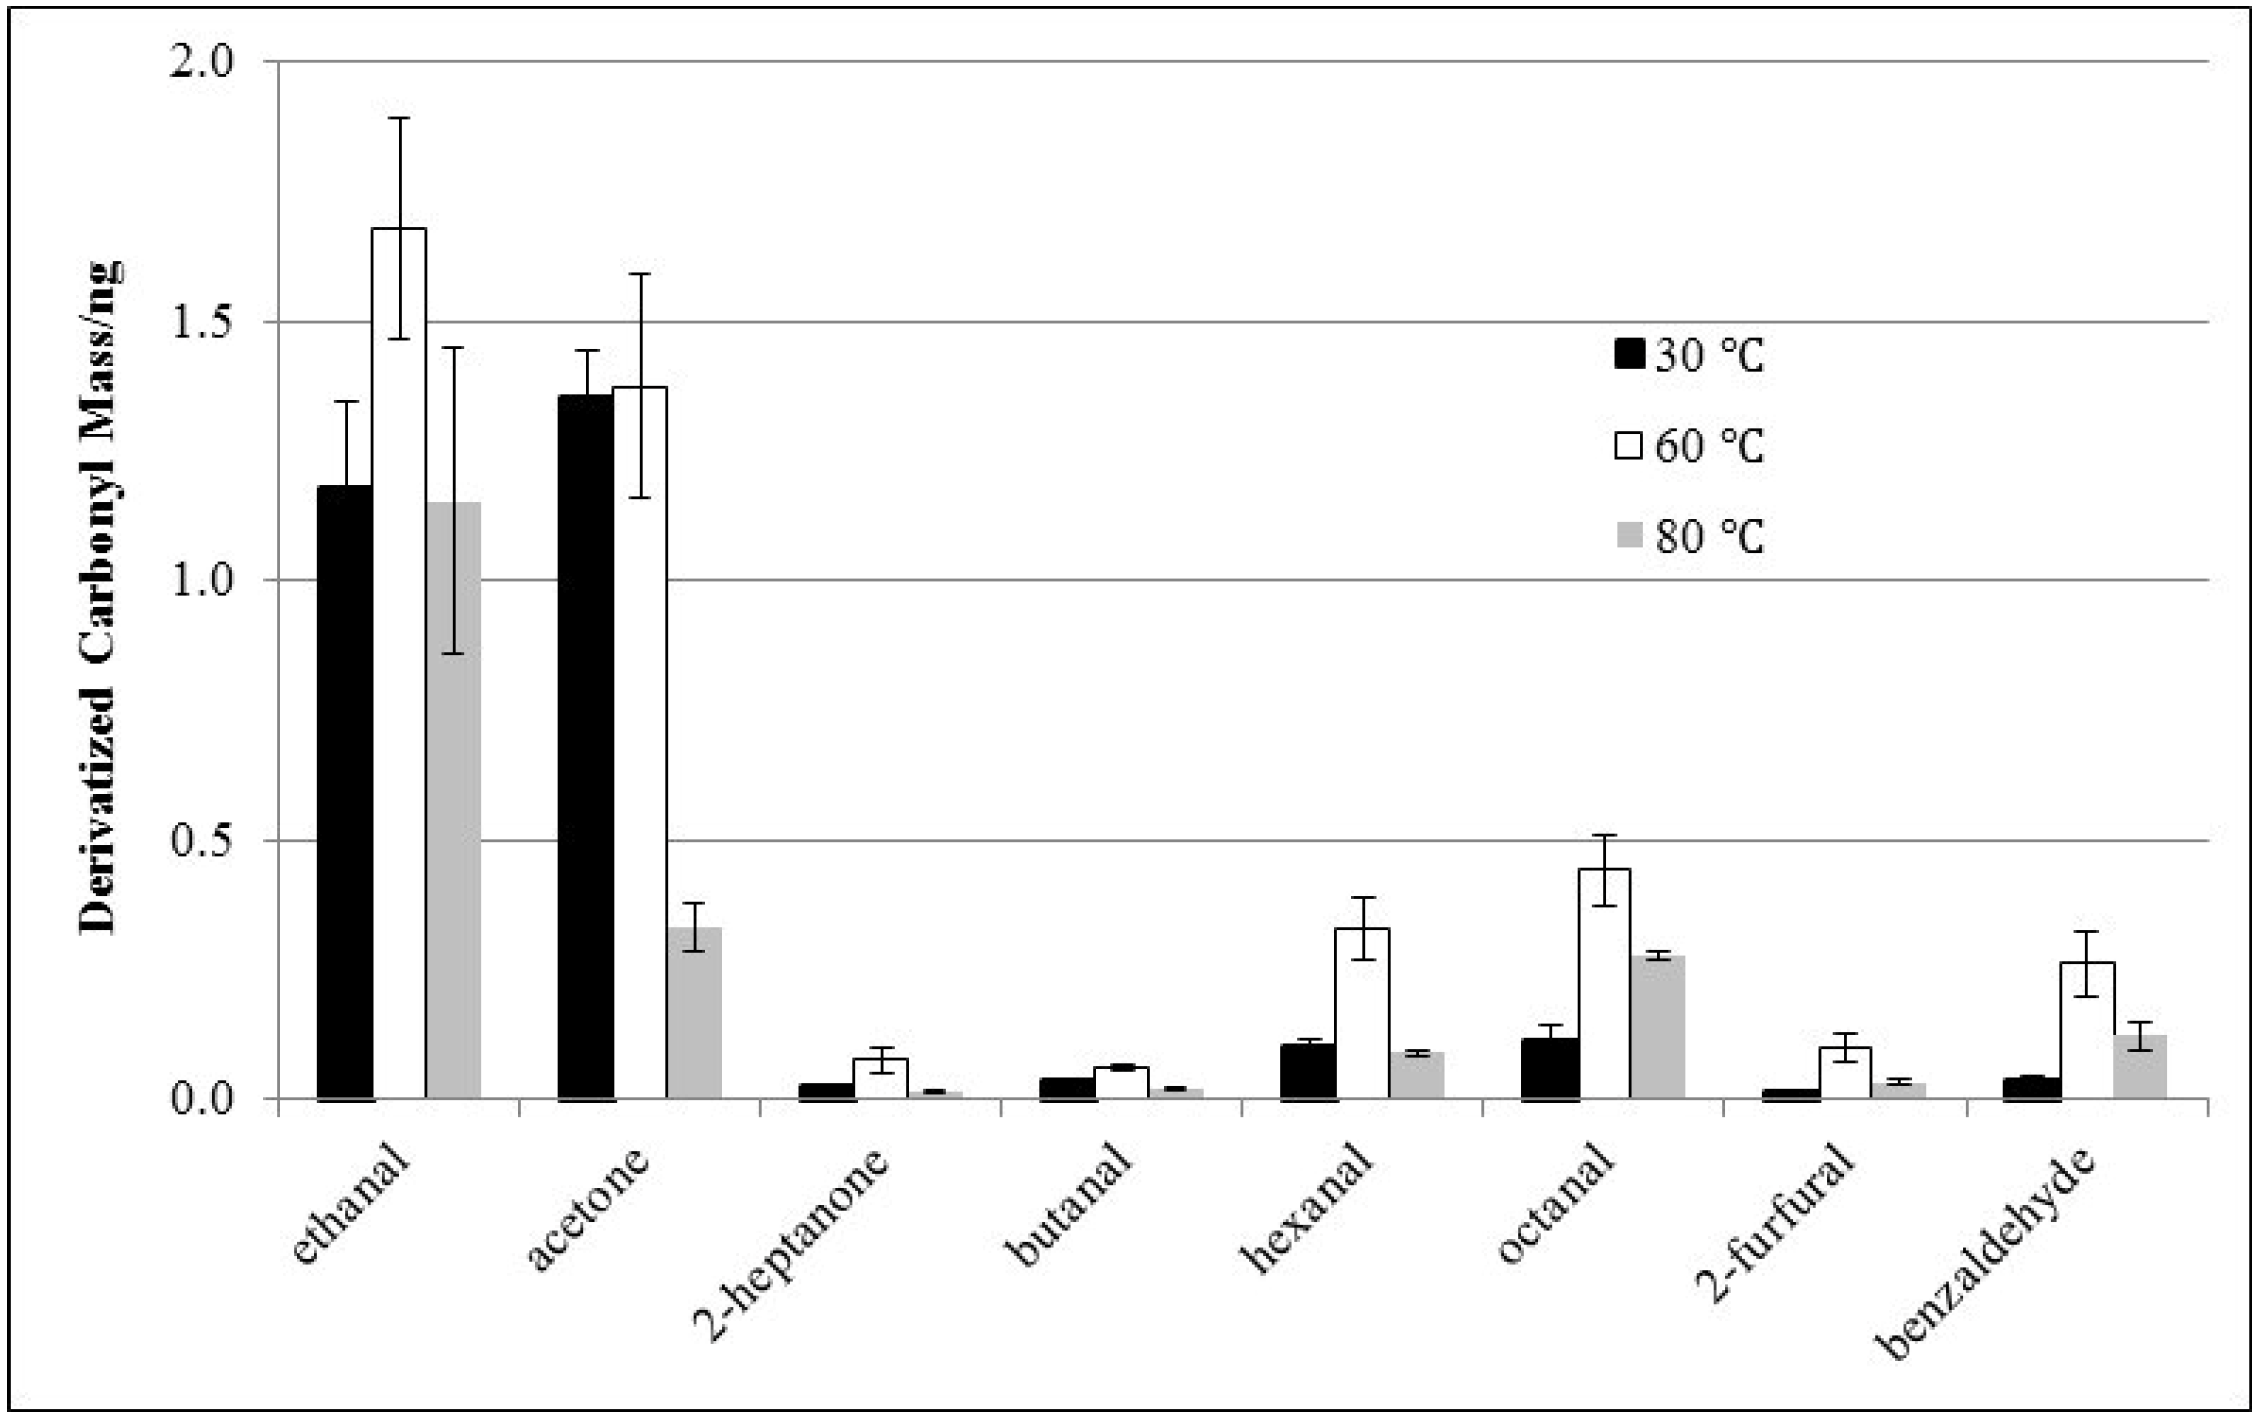
3.2. Effects of Derivatization Temperature

The effects of temperature on the uptake efficiency of carbonyls in shown in Figure 3 and Figure 4 for very short (10 s) and long (45 min) extractions, respectively. The fiber was doped with 17 mg/mL PFBHA at the same temperature, 40, 60 or 80 °C, as in the derivatization procedure. The concentration of each carbonyl compound in the standard solution was about 5 µg/L for the 45 min extraction test. Ethanal was at 2 µg/mL for the 10 s extraction test, while other target chemicals were at 5 µg/L. The highest recovery of the majority of target compounds was obtained at 60 °C. The lower recovery results at 40 °C is likely due to lower carbonyl concentrations in the headspace (driven by Henry’s law) and lower reaction rates between PFBHA coating and carbonyls in the headspace. Extraction at 60 °C generated the highest carbonyls recovery from headspace. The maximum temperature of 80 °C was also tested. However, a decrease in recovery was observed with 80 °C extraction. The increase in headspace carbonyl concentrations was likely offset by desorption of PFBHA and oximes from the SPME fiber. This finding is consistent with the observation by Beránek et al. [26]. Thus, PFBHA doping and on-fiber derivatization were performed at 60 °C for the rest of this study.
Figure 3. Effects of temperature on on-fiber derivatization efficiency. Identical derivatization time of 10 s was used for comparisons.
Chromatography 02 00001 g003
Figure 4. Effects of temperature on on-fiber derivatization efficiency. Identical derivatization time of 45 min was used for comparisons.
Chromatography 02 00001 g004

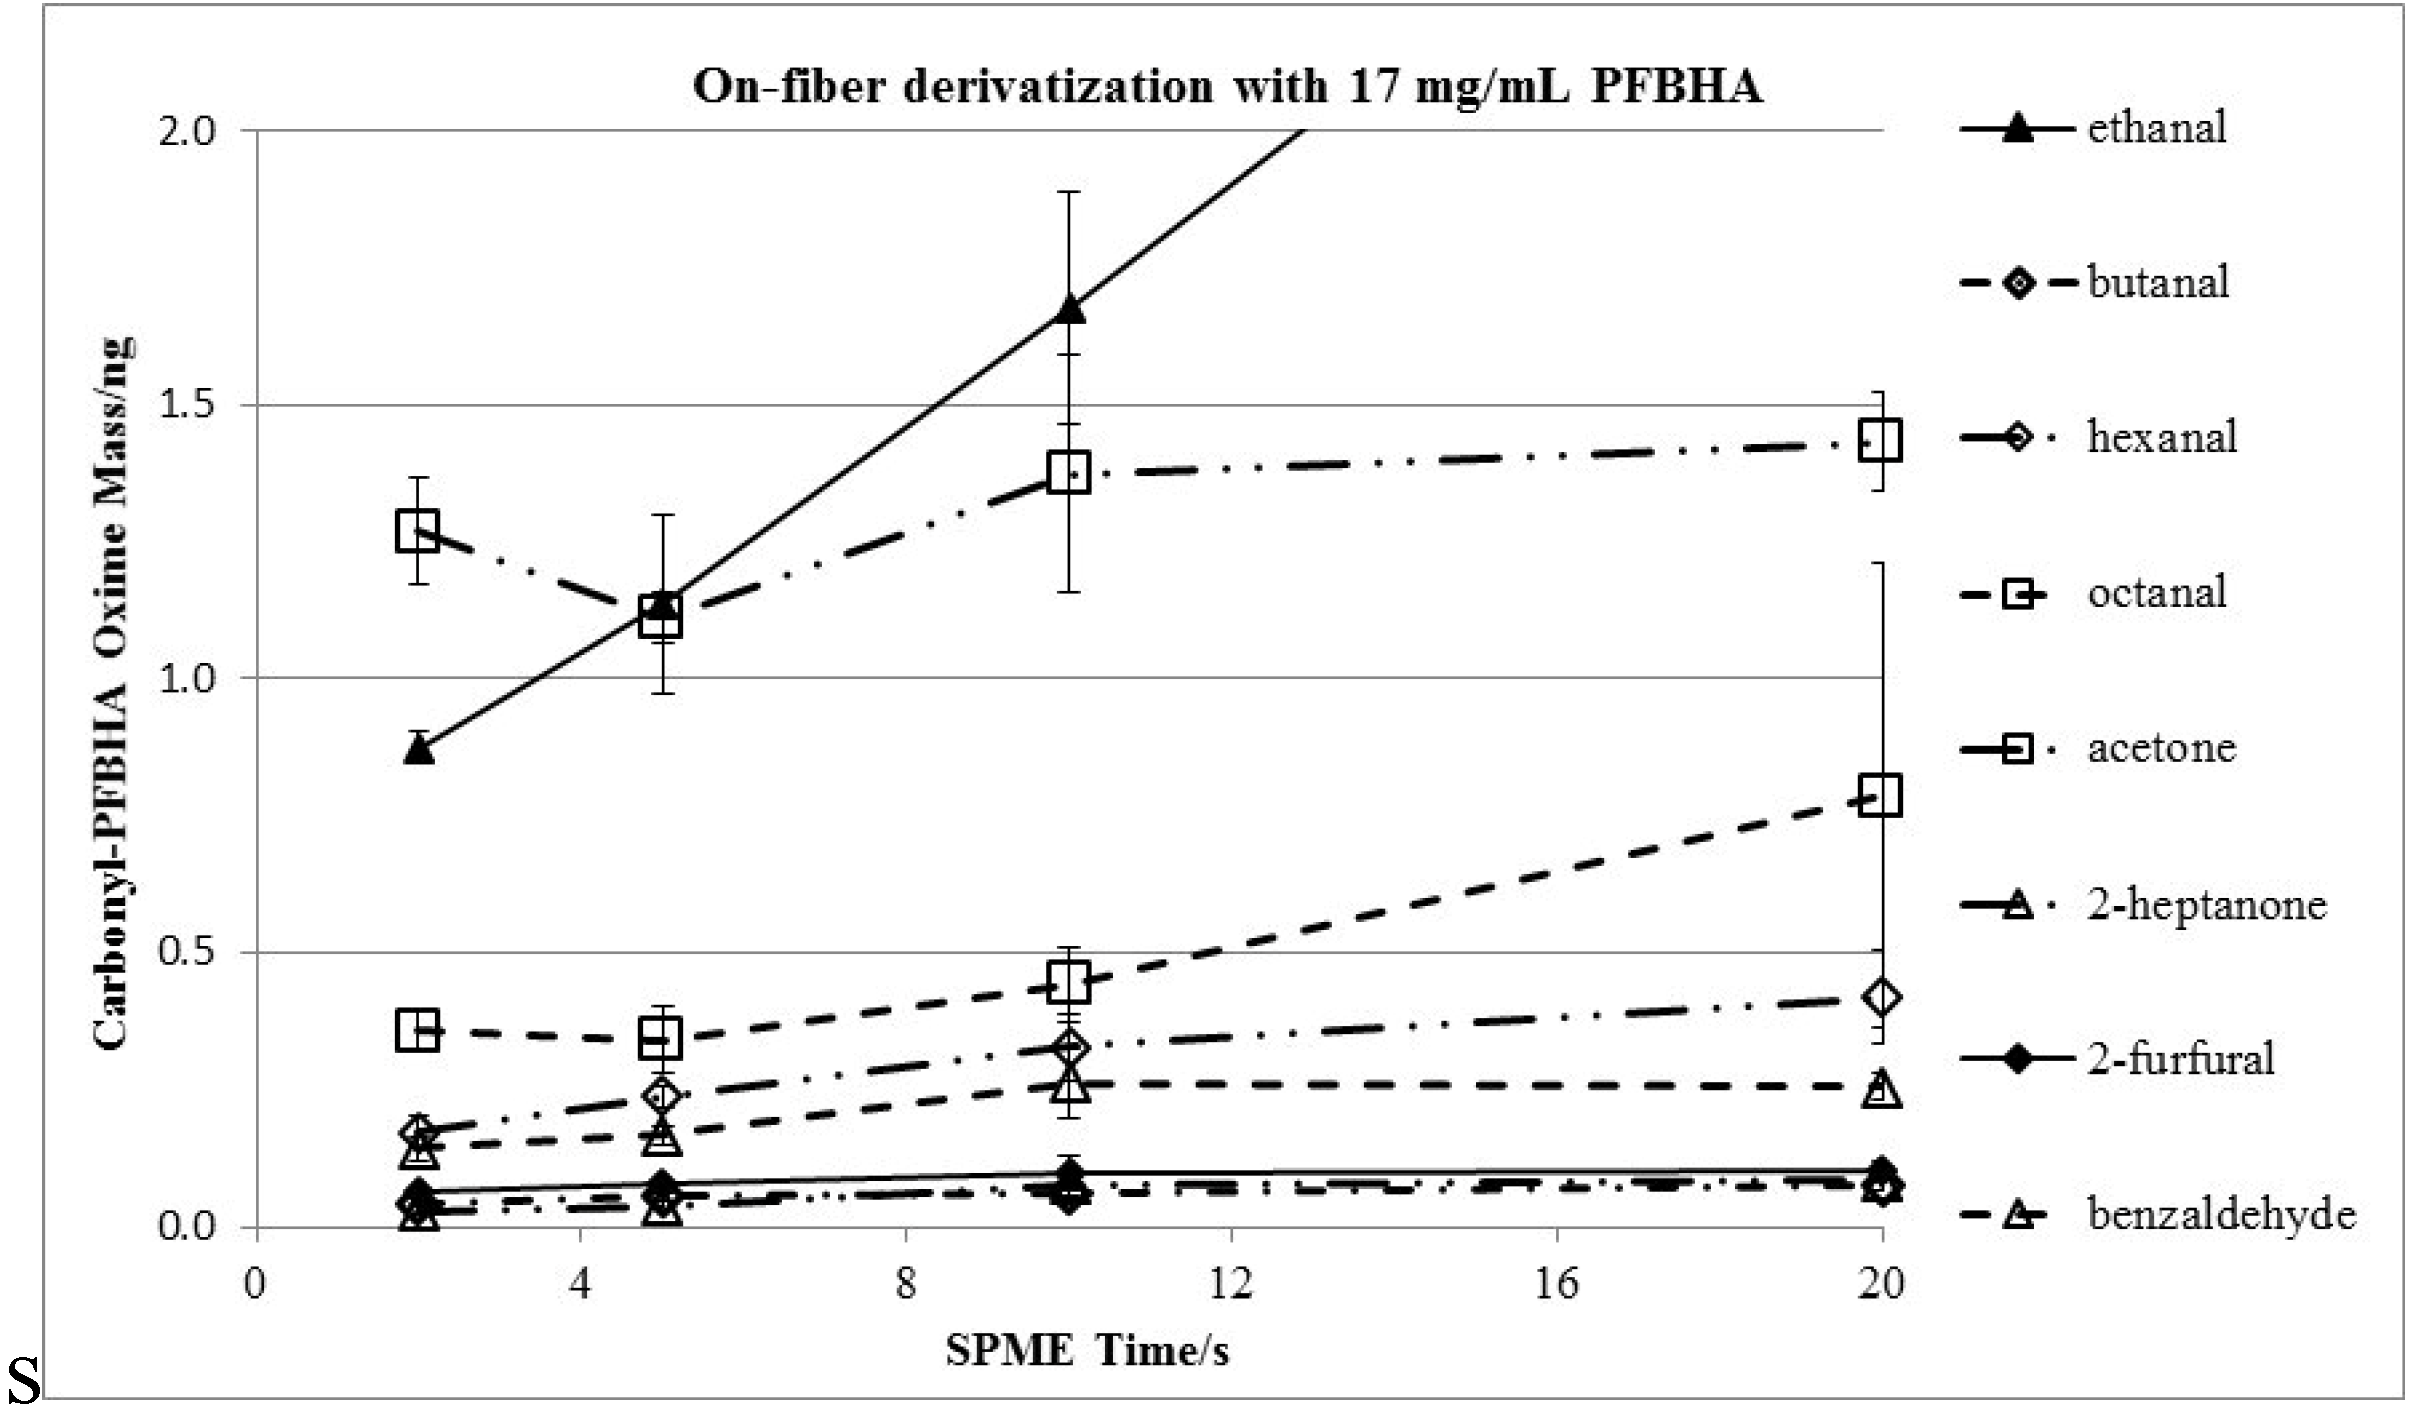
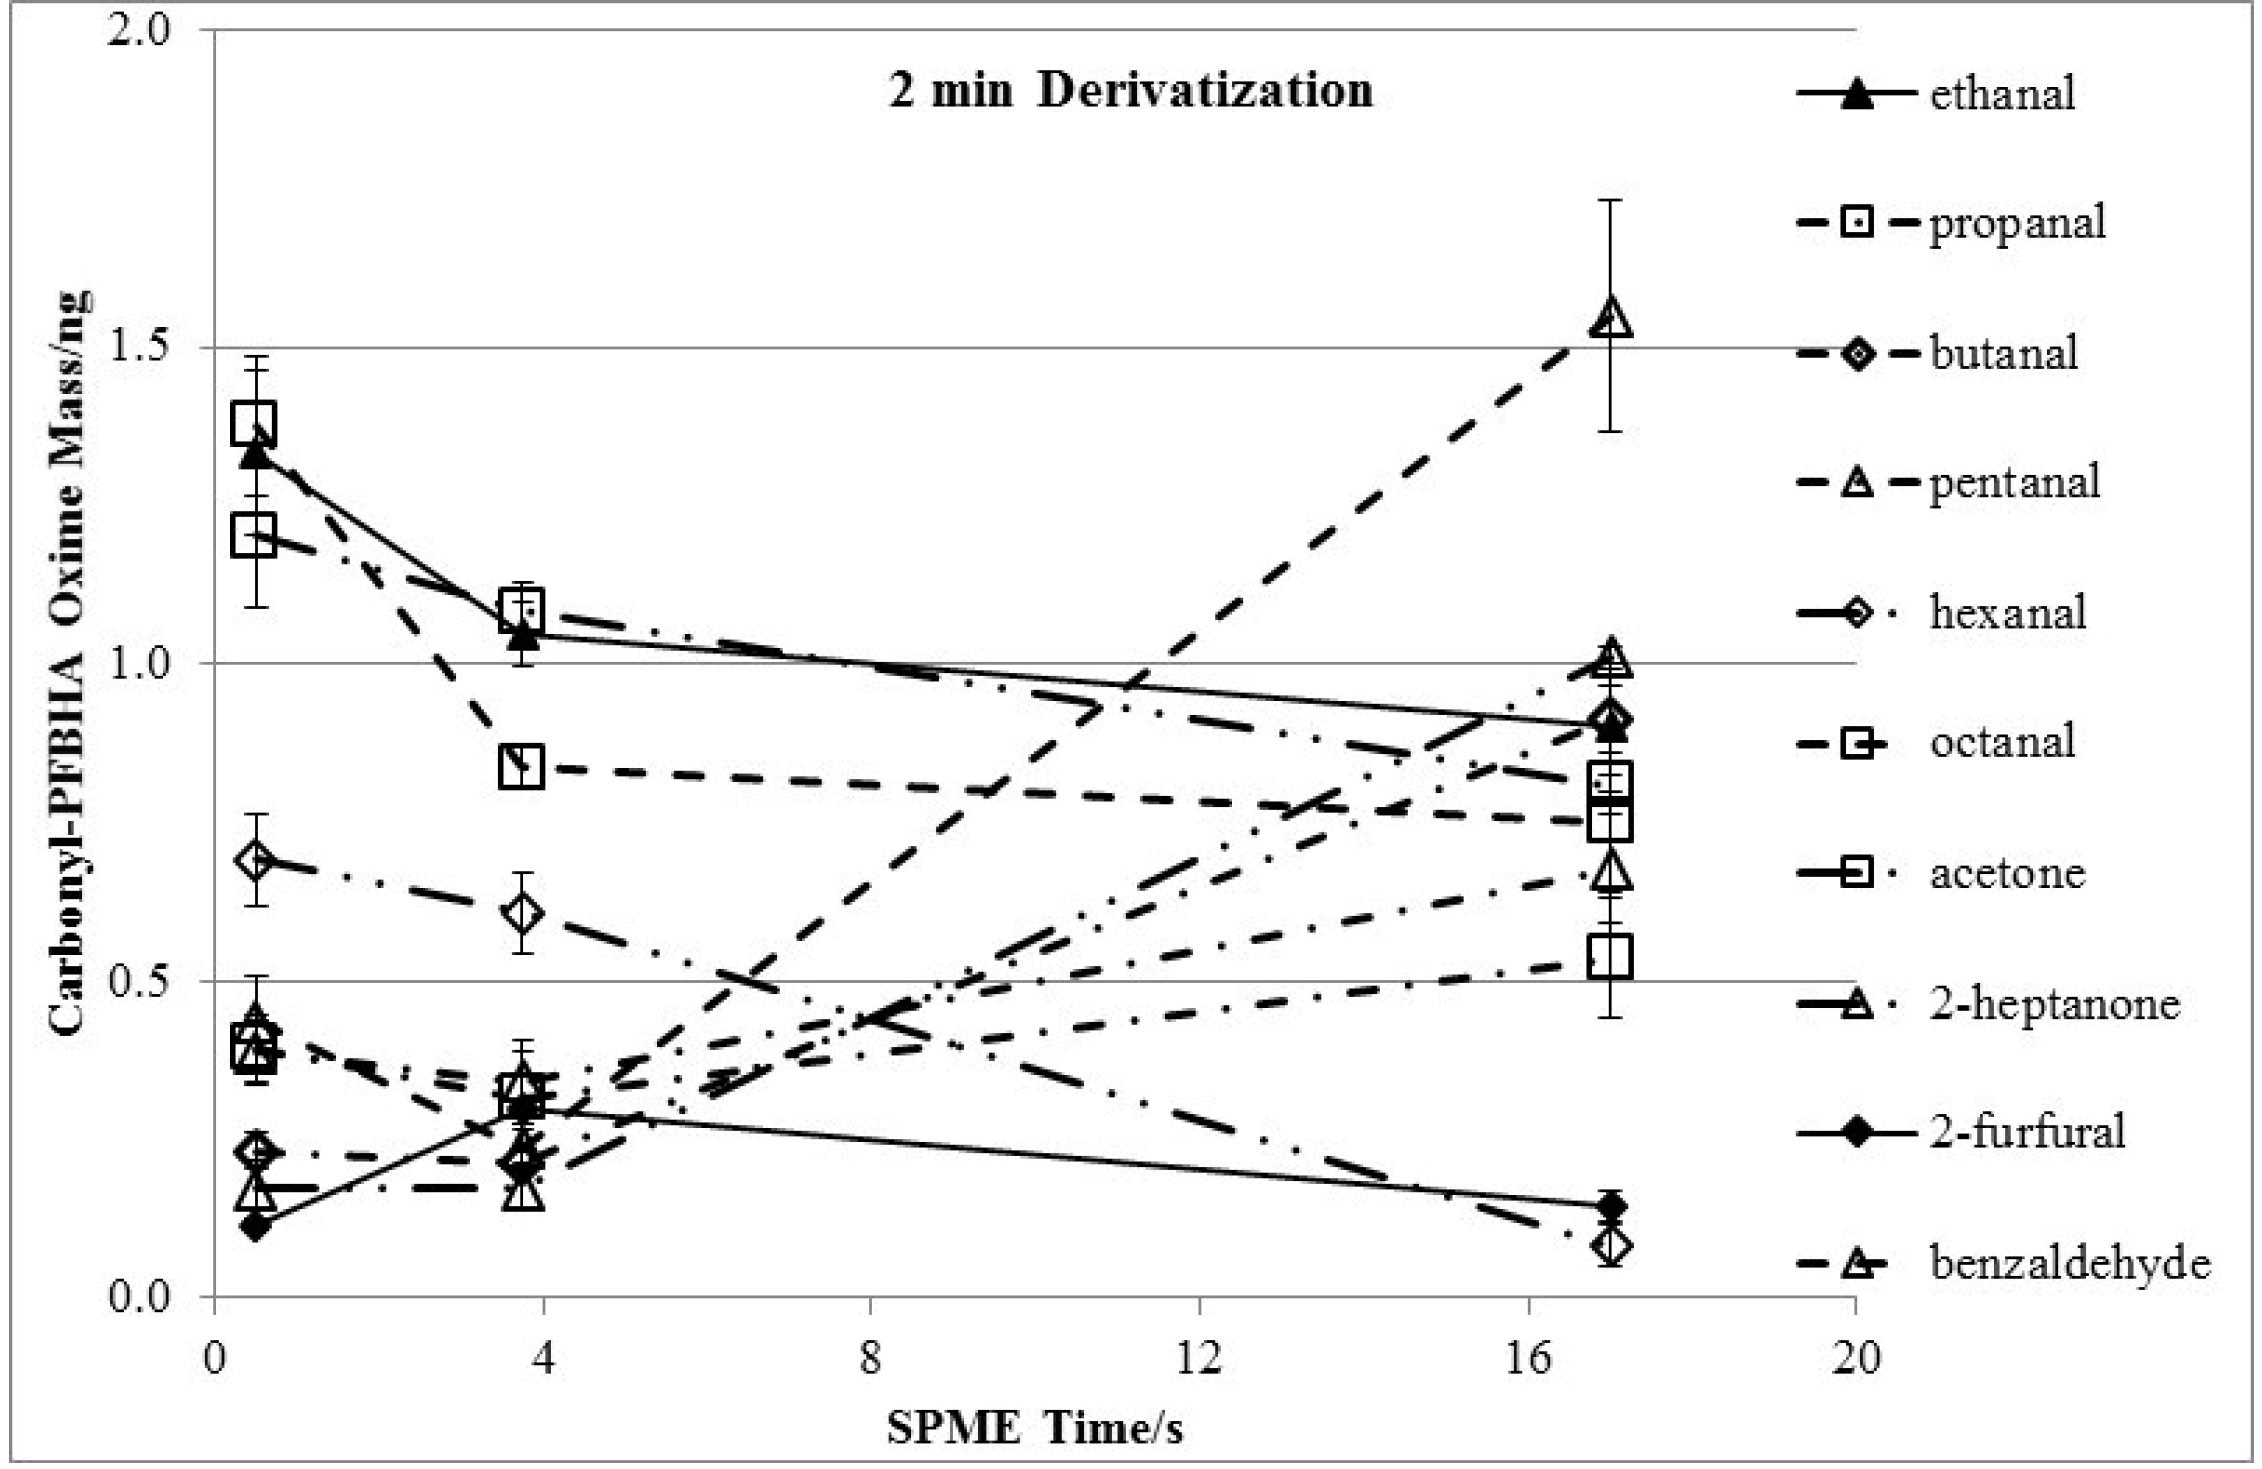
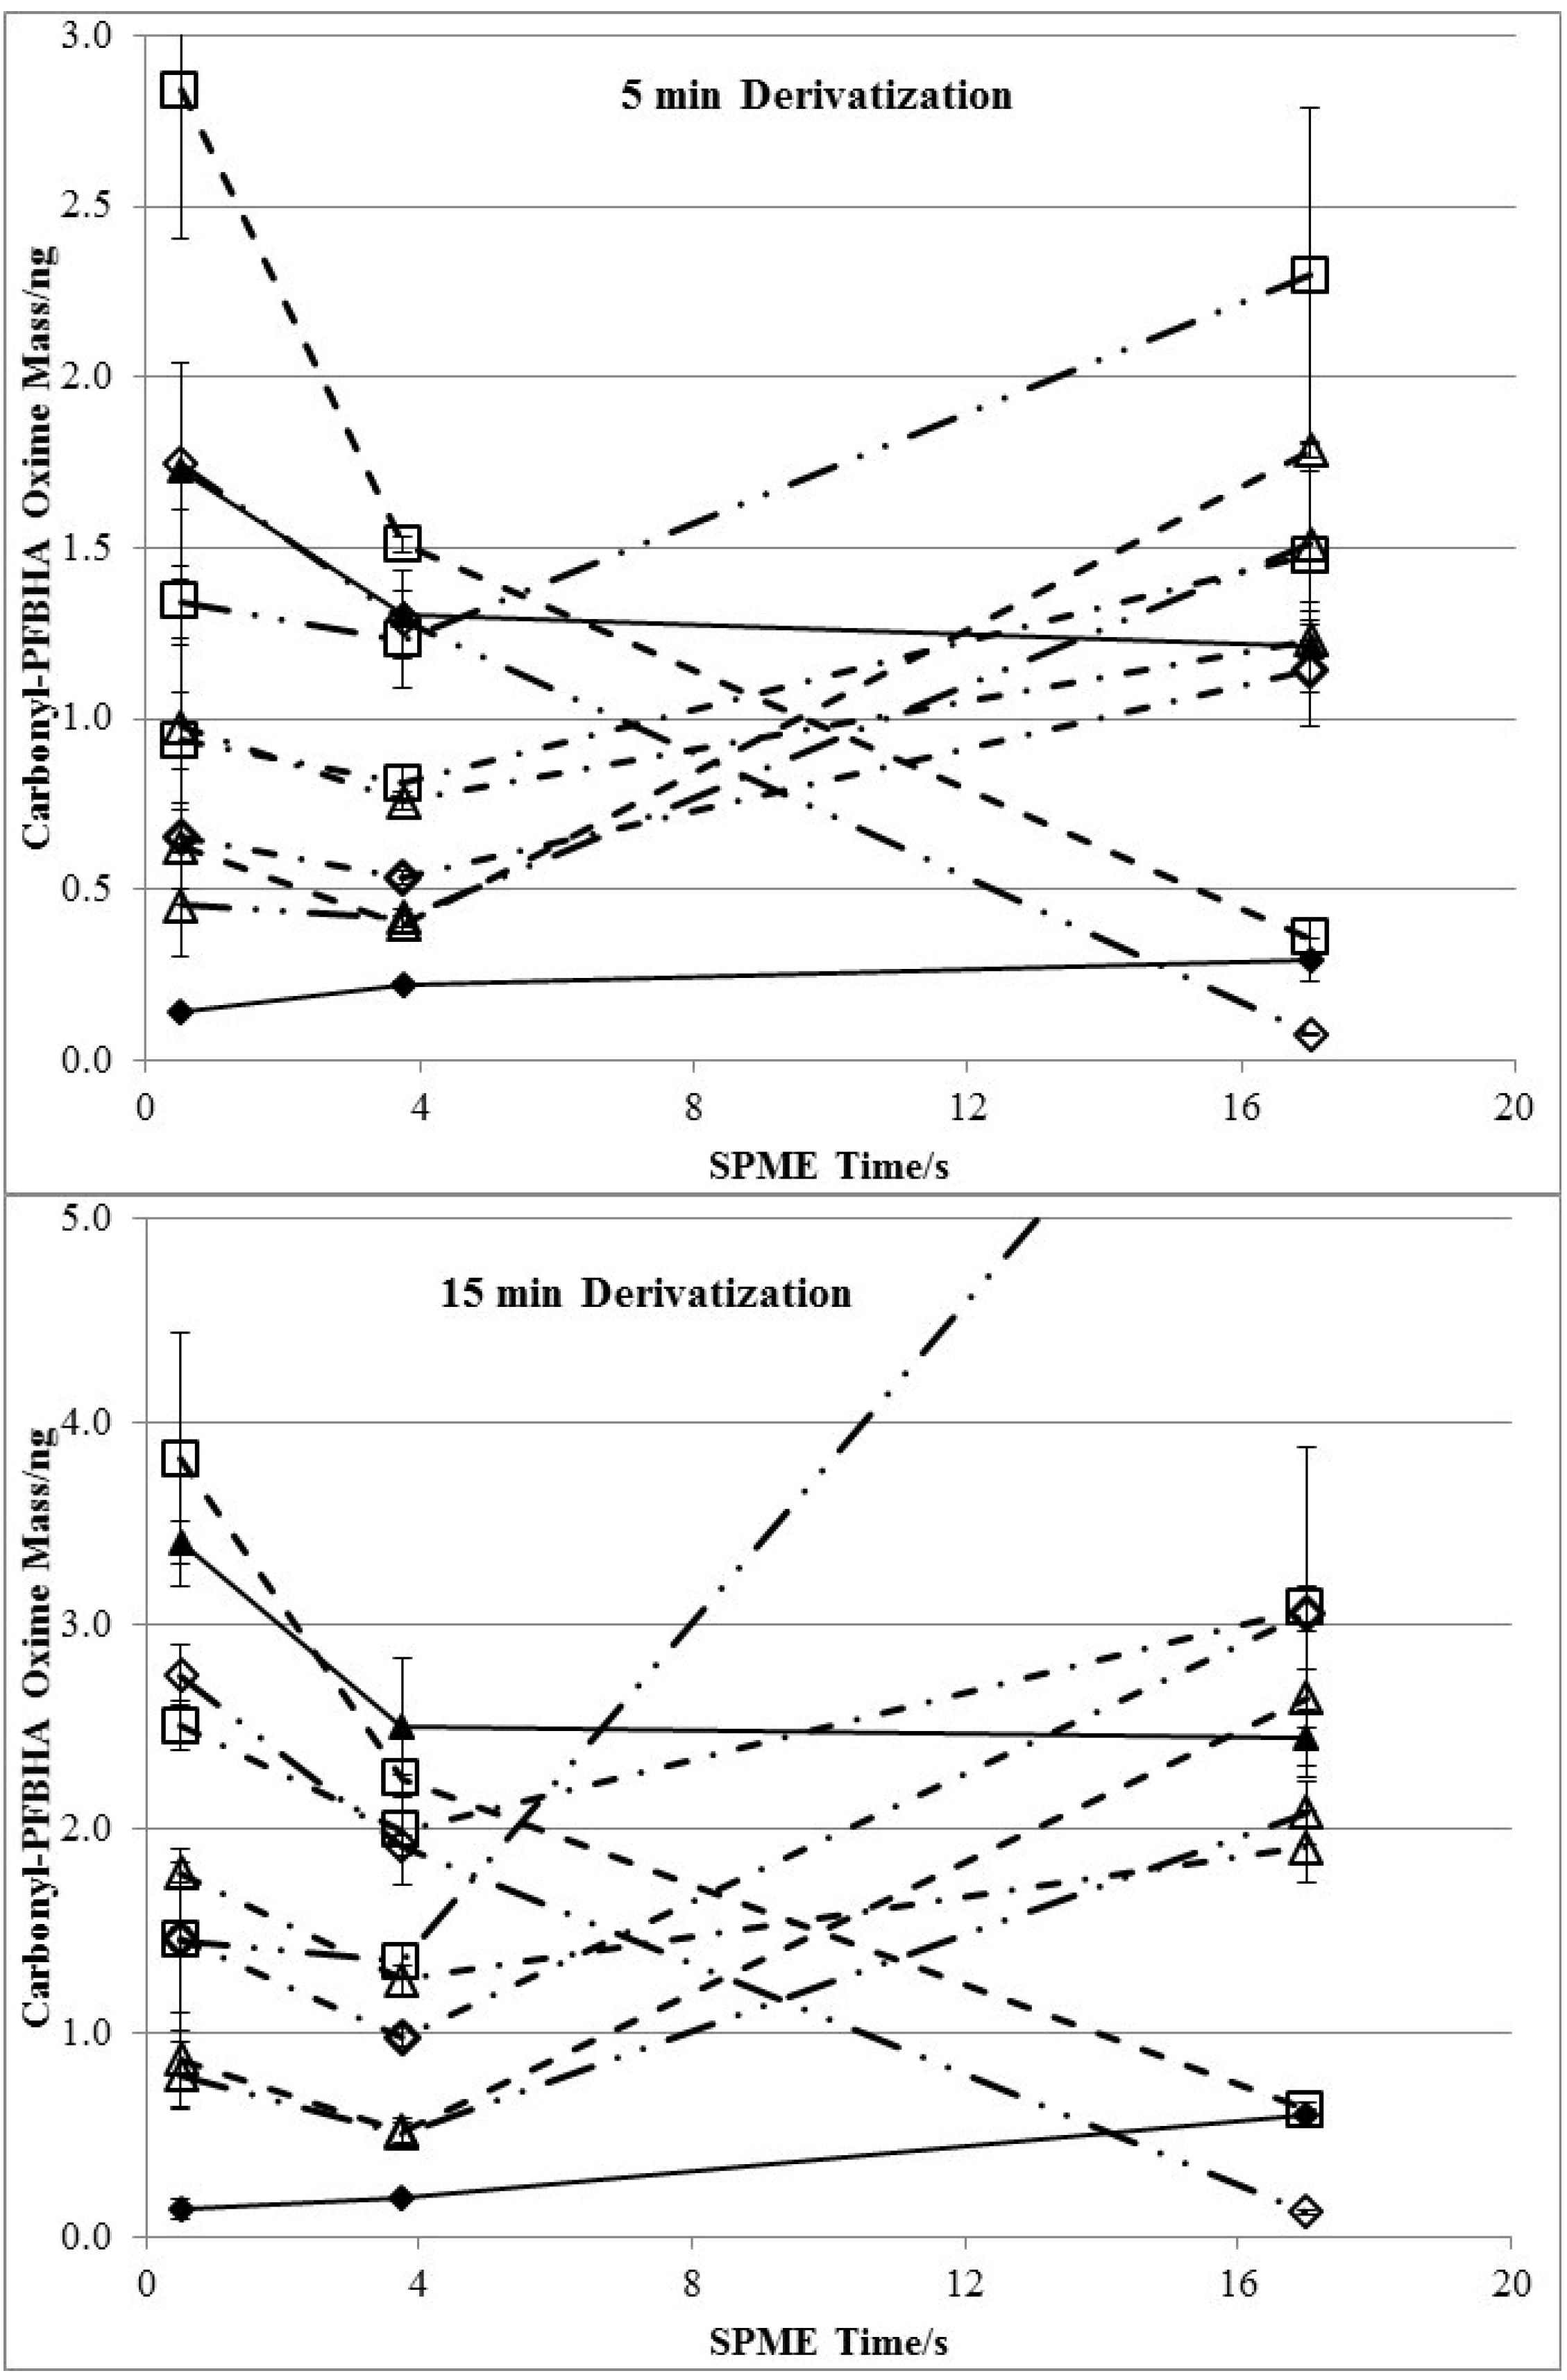
3.3. Effects of Derivatization Time and Displacement of 2-Furfural

Summary of the effects of derivatization time is shown in Table 3. Extraction of aliphatic aldehydes (ethanal, propanal, butanal, pentanal, hexanal, and octanal), and aliphatic ketones (acetone, and heptanone) with PFBHA at 17 mg/mL, increased linearly with time with R2 > 0.93 up to the 60 min reaction time tested (Table 3).
Table 3. Comparison of on-fiber derivatization at different derivatization time ranges.
ChemicalHenry’s Law Constant/(M/atm)RFExtraction-time Linearity (R2)Average Uptake of Carbonyls/ng eAverage RSD (%)
2–60 min2–20 s60 min5 s2–60 min2–20 s5 s
Ethanal15 a86,6000.9320.9326.49 ± 1.821.14 ± 0.16 f12.710.214.4
Propanal13 a60,2000.942ND14.01 ± 3.10ND13.7NDND
Butanal8.7 a342,0000.9300.9695.93 ± 1.020.05 ± 0.0111.18.9410.4
Pentanal6.8 a73.400.973ND7.39 ± 2.27ND24.6NDND
Hexanal4.7 a64,2000.9730.9574.50 ± 0.740.24 ± 0.0212.315.97.90
Octanal1.9 a31,4000.9410.9305.87 ± 1.150.34 ± 0.0610.524.417.7
Acetone25 a112,0000.9680.5625.29 ± 1.291.11 ± 0.058.648.434.19
2-Heptanone7.0 a125,3000.9880.8251.56 ± 0.180.04 ± 0.0110.825.017.3
2-Furfural263.2 b100,8000.8740.963 d0.51 ± 0.050.08 ± 0.0029.114.31.61
Benzaldehyde42 c130,9000.7760.999 d3.32 ± 1.940.17 ± 0.0217.114.49.34
Note: PFBHA dopant concentration was at 17 mg/mL. Response factor (RF) = peak area count/carbonyl injection mass (ng). ND: not detected. a Buttery et al., 1969 [36]. Henry’s law constants at T = 298.15 K were measured in the lab. b SRC, 2006 [37]. Henry’s law constant at T = 298.15 K was estimated. c Zhou and Mopper, 1990 [38]. Henry’s law constant at T = 298.15 K was measured in the lab. d Linearity was calculated for the 2 to 10 s of extraction times. e Concentration of each carbonyl was ~5 µg/L. f Concentration of ethanal in this series was ~2 µg/mL.
An exception was observed with 2-furfural, whose derivative (oxime) decreased with progressing derivatization reaction as early as 5 min. This compound is of special interest. According to information provided in Material Safety Data Sheets of corresponding byproducts from ozonated FL solution/suspension, the oral LD50 in rats of 2-furfural is the lowest among the detected byproducts [39]. Thus, a low LOD of 2-furfural was required in this study. The highest average RSD of 29.1% during 5 to 60 min derivatization was also observed with 2-furfural. The lowest Henry’s law constant of 2-furfural among other aldehydes indicates it is the slowest to diffuse from aqueous phase to headspace (Table 3). This diffusion process from sample to headspace was found to be decisive to derivatization efficiency of on-fiber derivatization SPME [33]. A 1 cm magnetic bar, stirring at 800 rpm, was used here to facilitate the sample-to-headspace diffusion of analytes. The carbonyl carbon of 2-furfural is adjacent to the conjugate ring with an electrophilic oxygen, and has a relatively low affinity to the nitrogen nucleus of PFBHA. This, and the high steric hindrance of the furan ring, suggest a low reaction kinetic between 2-furfural and PFBHA. Desorption of carbonyl derivatives and PFBHA doped onto SPME fiber associated with longer derivatization time [33] is expected to be another factor affecting the uptake of 2-furfural. It is hypothesized that the apparent decrease of 2-furfural derivative uptake with time, and the high RSD resulted from the low affinity to PFBHA and desorption of 2-furfural-PFBHA oxime. That is to say, desorption kinetic of 2-furfural oxime is significant compared with the low reaction kinetics of 2-furfural derivatization in a lengthy on-fiber derivatization procedure. Thus, much shorter 2 s to 20 s on-fiber derivatization time was tested to optimize derivatization of 2-furfural and to prevent this apparent competitive, non-linear reaction. This had to be accomplished simultaneously with derivatization of other target compounds.
The concentration of ethanal was ~2 µg/mL, while each of the other chemicals was at ~5 µg/L to simulate carbonyl content in ozonated FL solution/suspension. Despite a significant drop in uptake rate after 5 s of extraction, the derivatization efficiency of 2-furfural became higher than propanal, butanal, pentanal, and 2-heptanone (Table 3 and Figure 5). The apparent displacement effect associated with derivatization of 2-furfural was minimized with very short, 5 s derivatization. The calibration RSDs with 2-furfural for 2–20 s derivatization were reduced to 14.3% (Table 3). Subsequently, 5 s on-fiber derivatization were tested and the calibration RSD improved to 1.61%. Carbonyl recovery decreased with a shorter derivatization time (Figure 1 and Figure 5), while the accuracies on 2-furfural and benzaldehyde were enhanced. Thus, the 5 s extractions/derivatizations were selected for simultaneous sampling of all target aldehydes in this study.
Figure 5. Time-profile of derivatization time from 2 s to 20 s.
Chromatography 02 00001 g005

3.4. Method Validation

Optimum analysis conditions were established to be: PFBHA dopant concentration at 17 mg/mL, doping time 15 min, derivatization/extraction time 5 s, and doping and derivatization temperature 60 °C. The optimized parameters other than derivatization time (5 s) are similar to those in other studies on on-fiber derivatization SPME analysis of carbonyls (Table 1) although a much shorter derivatization time was used in this study to optimize 2-furfural derivatization. Quality parameters, such as linearity, detection limit and precision, were determined based on the extraction method developed (Table 4). With optimization of important derivatization parameters, a very short derivatization time of 5 s generated detection limits comparable with previous studies, while a significantly low LOD on 2-furfural was still achieved (Table 1). However, shorter derivatization time sacrificed uptake rate (recovery) of target aldehydes (Figure 1 and Figure 5). Specifically, propanal and pentanal could not be detected with 5 s derivatization (Table 3). Minimum 2 min derivatization was needed for quantification of propanal and pentanal. Calibration curves of ethanal, hexanal, 2-furfural and benzaldehyde were generated by plotting quantification ion peak areas against the corresponding carbonyl compound concentration in the standard sample. The analytical method developed was applied to ozonated FL solution/suspensions (Figure 6).
Table 4. Calibration curves of major potentially toxic carbonyl compounds.
CompoundCalibration CurveR2LOD (µg/L)
Ethanaly = 1.2 × 10³x + 703240.98310.030
Hexanaly = 9.2 × 10²x + 290240.99590.029
2-Furfural *y = 3.7 × 10⁴x + 353130.95790.016
Benzaldehydey = 4.1 × 10⁴x + 385230.98740.016
Note: Calibration curves for all the compounds were generated as following: a PDMS/DVB fiber was exposed to the headspace of 17 mg/mL PFBHA aqueous solution for 15 min; and then the fiber loaded with PFBHA was exposed to the headspace of standard solution at gradient concentrations to perform on-fiber derivatization for 5 s. Two steps of extraction were both performed on 1 mL solution in a 4 mL vial at 60 °C, with a 1 cm PTFE coated bar stirring at 800 rpm. * 5-nitro-,4-(3-(diethylamino)propyl)semicarbazone, or 5-Nitro-2-furaldehyde 4-(3-(diethylamino) propyl) semicarbazone or 1-(5-Nitro-2-furfurylidine)-3-N,N-diethylpropylaminourea hydrochloride.
Figure 6. Chromatogram (SIM mode) of on-fiber derivatization SPME of ozonated fruit leather solution/suspension. 2. Ethanal at 0.620 mg/L, 3. Propanal, 4. Butanal, 5. Pentanal, 6. Hexanal at 67.6 mg/L, 7. Heptanal, 8. Octanal, 9. Nonanal, 10. Decanal. Note: Two isomeric oximes (trans/cis) were formed for each aldehyde (except for acetone with a symmetric structure). Peak areas of both isomers were summed up for quantification.
Chromatography 02 00001 g006

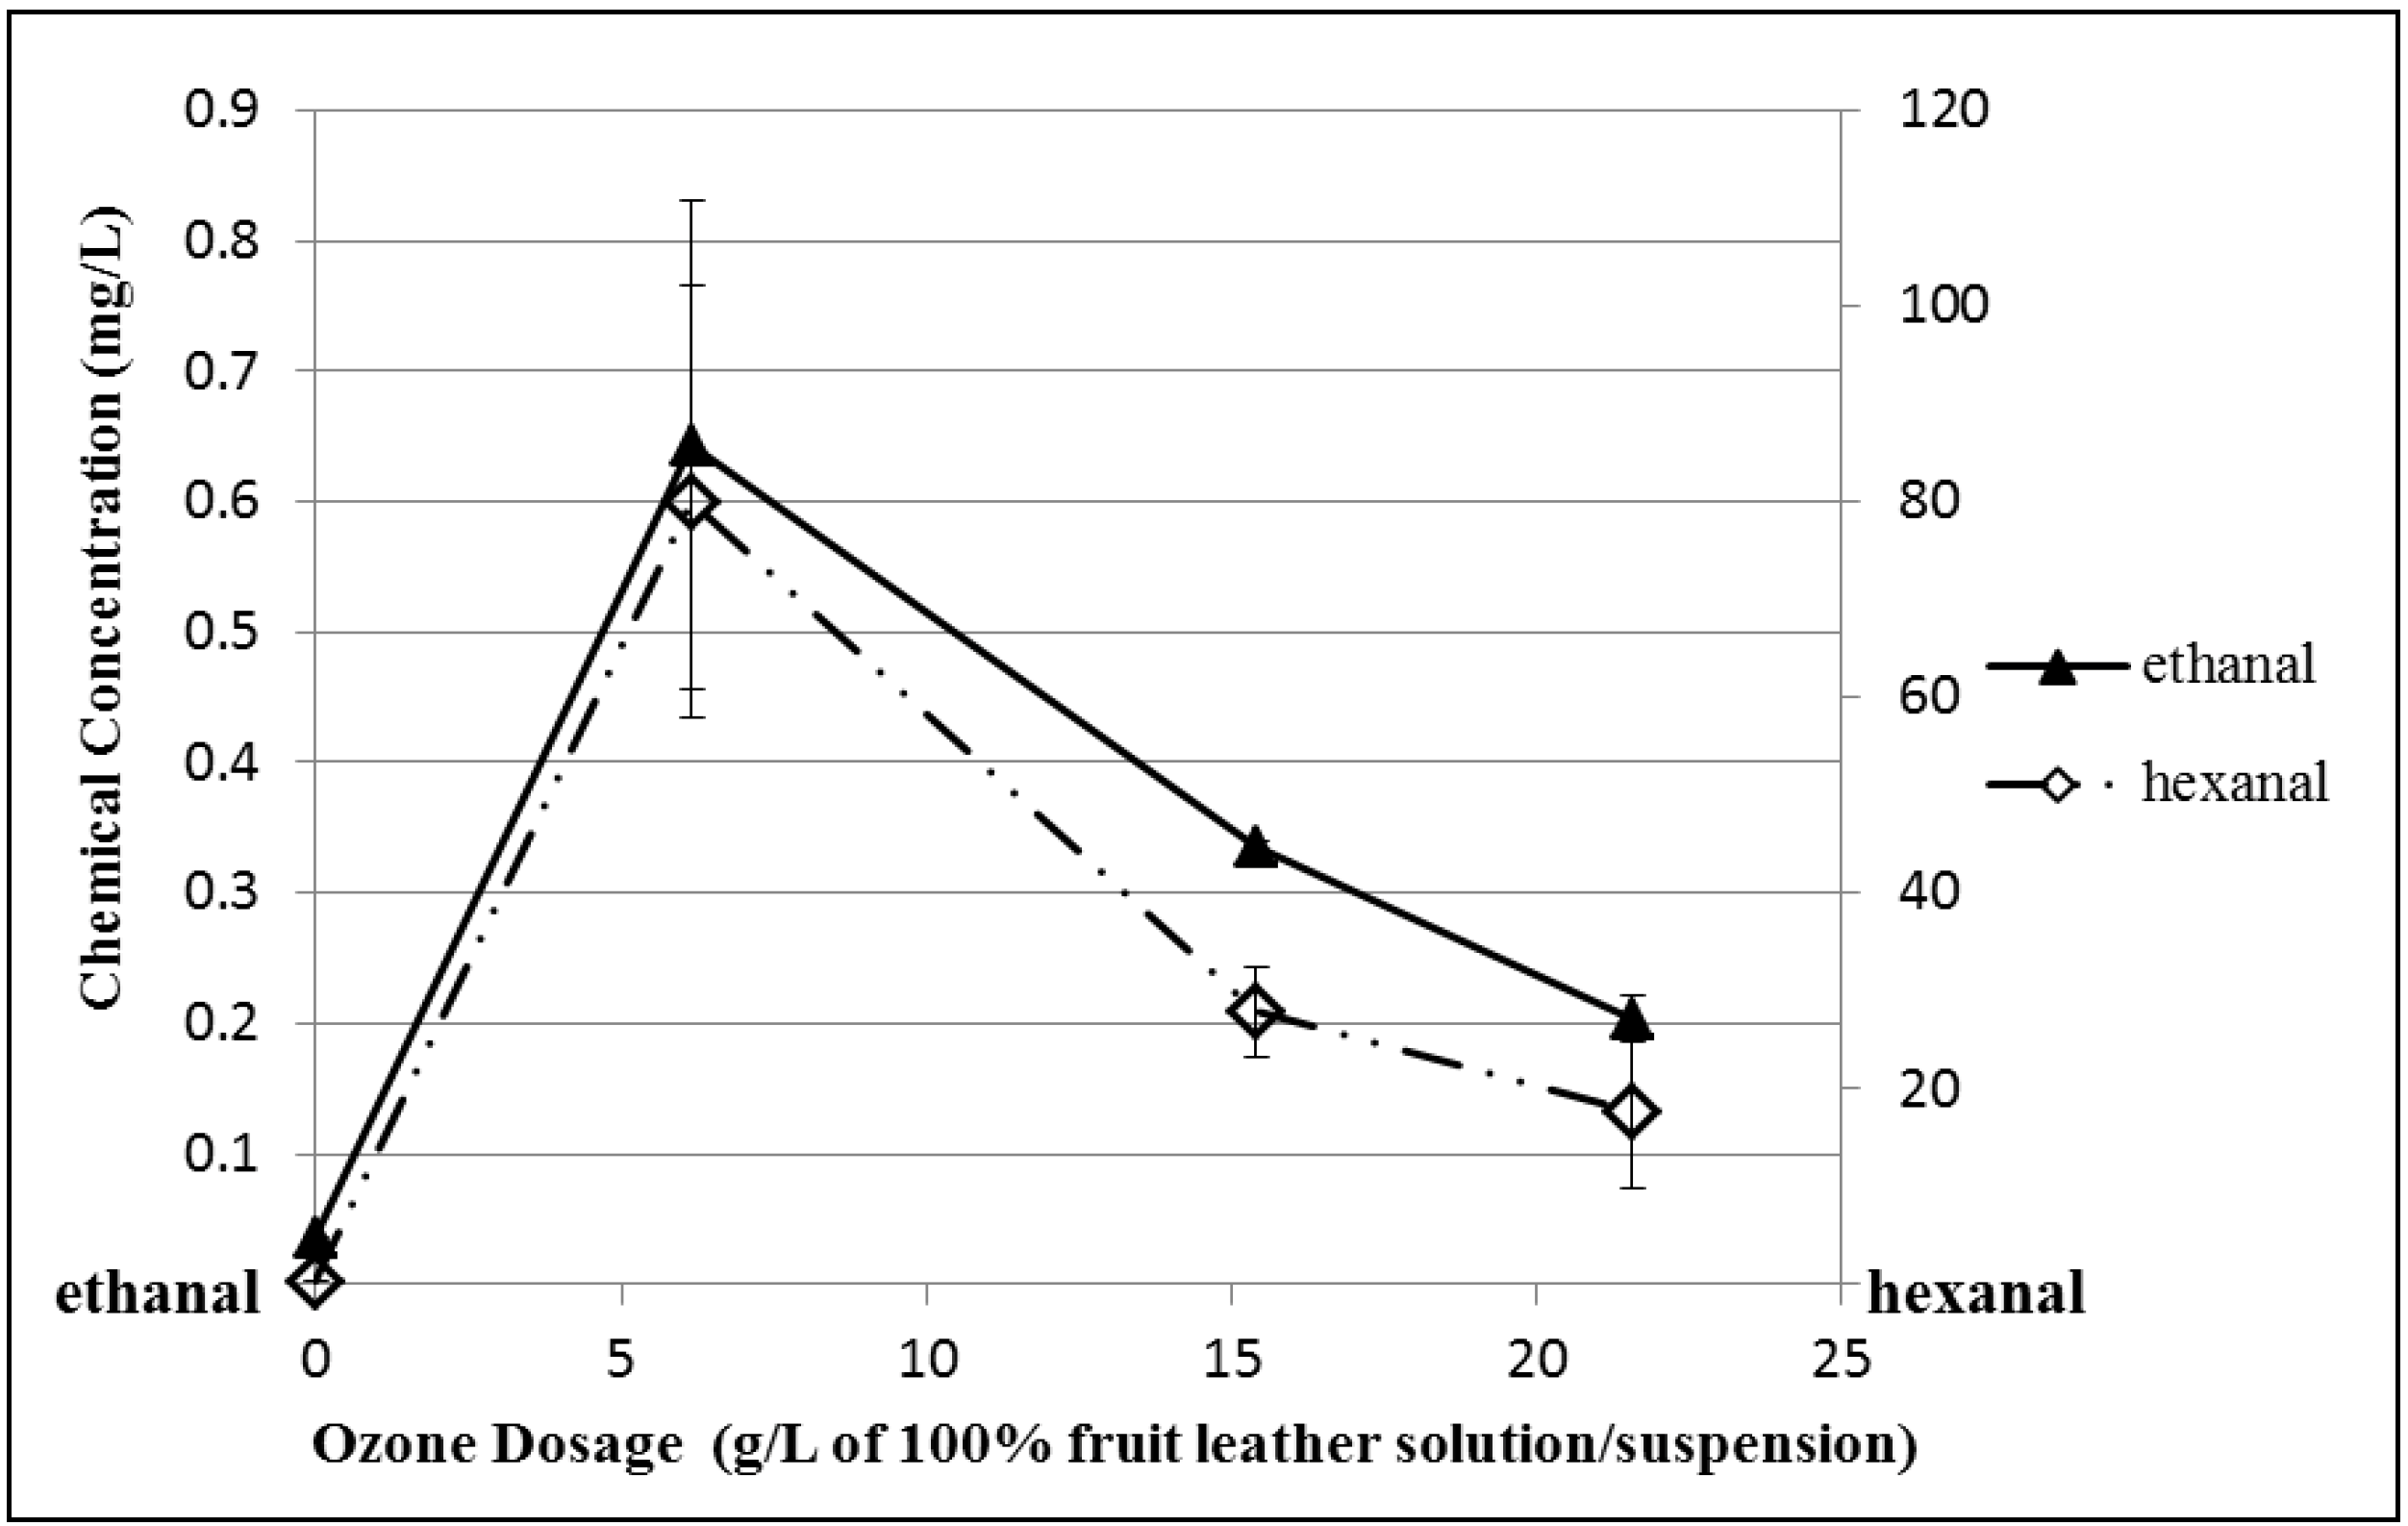
3.5. Ozonated Fruit Leather Solution/Suspension Sample Analysis

This is the first study to apply on-fiber derivatization SPME on carbonyls generated from ozonolysis treatment. The ozonated FL solution/suspension is a complex sample matrix with a large amount of suspended particles. Generation of the four major potentially toxic carbonyls, ethanal, hexanal, 2-furfural and benzaldehyde was quantified in ozonated FL solution/suspension. In the post-treatment samples, 2-furfural and benzaldehyde were below LODs, i.e., 0.016 µg/L each, while the maximum amounts of ethanal and hexanal were determined to be 0.644 ± 0.188 mg/L and 80.0 ± 22.0 mg/L, respectively (Figure 7). In our previous study, a primary health risk assessment was performed regarding ozonolysis byproducts in the recycled FL, where the existence of the four major potentially toxic carbonyls in recycled FL were determined to be far below reference doses [5]. The real and improved sample analysis results addressed byproduct toxicity concerns regarding ozone-based decolorization in FL recycling.
Figure 7. Ethanal and hexanal generation-ozone dose profile (ozone was introduced into 200 mL of 100% fruit leather solution/suspension at 26.6 mg/(L∙min) ozone dosage rate).
Chromatography 02 00001 g007

4. Conclusions

A SPME-GC-MS method was adapted based on previous studies for the simultaneous analysis of 10 carbonyls from ozone-based food colorant decomposition. On-fiber derivatization SPME for aldehydes extraction was improved compared to previous studies using the same method. PFBHA dopant concentration, doping and derivatization temperature, and derivatization time were optimized. Inaccuracy of 2-furfural analysis resulting from competitive derivatization was minimized with a shortened derivatization time of 5 s. The short derivatization time also shortened the on-fiber derivatization SPME-GC-MS cycle. The LOD values of the developed method were in the range of 0.016 to 0.030 ppb. A much lower LOD of 0.016 ppb for 2-furfural was achieved compared with 6 and 35 ppb in other studies [26,27].
This enhanced method was applied for the first time in the analysis of carbonyls as ozonolysis byproducts, certainly in a complex matrix of ozonated FL solution/suspension. Among the ozonolysis byproducts, benzaldehyde and 2-furfural in waste fruit leather were generated below their LODs, both 0.016 µg/L of 100% fruit leather solution/suspension, while hexanal was the most abundantly generated, and the maximum generation was 80.0 ± 22.0 mg/L. The test results on the new possible ozone application demonstrated that through adapted methodology, byproduct toxicity concern was addressed regarding the use of ozone in colorant removal from food material.

Acknowledgments

Authors would like to thank for partial support for this study from the Interdepartmental Toxicology Program and the Institute for Physical Research and Technology, both at Iowa State University. This article does not contain any studies with human participants or animals performed by any of the authors. Informed consent was obtained from all individual participants included in the study.

Author Contributions

W.Z., J.K., L.C., H.D.Ö. and J.v.L. conceived and designed the experiments; J.K. and J.v.L. supervised the student; W.Z. performed the experiments; W.Z. analyzed the data; W.Z., J.K., L.C., and J.v.L. contributed reagents/materials/analysis tools; W.Z., J.K., L.C., H.D.Ö. and J.v.L wrote the paper.

Conflicts of Interest

The authors declare no conflict of interest.

References

  1. Ozsoy, H.D.; van Leeuwen, J. Removal of color from fruit candy waste by activated carbon adsorption. J. Food Eng. 2010, 101, 106–112. [Google Scholar] [CrossRef]
  2. Van Leeuwen, J.; Pipe-Martin, C.; Lehmann, R. The South Caboolture Water Reclamation Process. Ozone Sci. Eng. 2003, 25, 107–120. [Google Scholar] [CrossRef]
  3. Van Leeuwen, J.; Sridhar, A.; Esplugas, M.; Onuki, S.; Cai, L.; Harrata, A.K.; Koziel, J.A. Improving biodegradation of organic pollutants with ozonation during biological wastewater treatment. Ozone Sci. Eng. 2009, 31, 63–70. [Google Scholar] [CrossRef]
  4. FDA, US Food and Drug Administration. Sec. 173.368 Ozone. Part 173 D, Title 21, Secondary direct food additives permitted in food for human consumption, Specific Usage Additives. 1 April 2013. Available online: http://www.accessdata.fda.gov/scripts/cdrh/cfdocs/cfcfr/cfrsearch.cfm?fr=173.368 (accessed on 15 December 2014).
  5. Zhu, W.; Koziel, J.A.; Cai, L.; Brehm-Stecher, B.; Özsoy, H.D.; van Leeuwen, J. Ozonation-based decolorization of food dyes for recovery of fruit leather wastes. J. Agric. Food Chem. 2013, 61, 8198–8206. [Google Scholar] [CrossRef] [PubMed]
  6. O’Brien, P.J.; Siraki, A.G.; Shangari, N. Aldehyde sources, metabolism, molecular toxicity mechanisms, and possible effects on human health. Crit. Rev. Toxicol. 2005, 35, 609–662. [Google Scholar] [CrossRef] [PubMed]
  7. FDA, US Food and Drug Administration. Sec. 182.60 Title 21,3 Substances generally recognized as safe, Synthetic flavoring substances and adjuvants. 1 April 2013. Available online: http://www.accessdata.fda.gov/scripts/cdrh/cfdocs/cfcfr/CFRSearch.cfm?fr=182.60 (accessed on 15 December 2014).
  8. Uebelacker, M.; Lachenmeier, D.W. Quantitative determination of acetaldehyde in foods using automated digestion with simulated gastric fluid followed by headspace gas chromatography. J. Autom. Method. Manag. 2011, 2011, 907317. [Google Scholar]
  9. FDA, US Food and Drug Administration. Sec 172.515 Title 21, 3 Synthetic flavoring substances and adjuvants. 1 April 2013. Available online: http://www.accessdata.fda.gov/scripts/cdrh/cfdocs/cfcfr/CFRSearch.cfm?fr=172.515 (accessed on 15 December 2014).
  10. Cancho, B.; Ventura, F.; Galceran, M.T. Determination of aldehydes in drinking water using pentafluorobenzylhydroxylamine derivatization and solid-phase microextraction. J. Chromatogr. A 2002, 943, 1–13. [Google Scholar] [CrossRef] [PubMed]
  11. Van Leeuwen, J.; Sridhar, A.; Esplugas, M.; Onuki, S.; Cai, L.; Koziel, J.A. Ozonation within an activated sludge system for azo dye removal by partial oxidation and biodegradation. Ozone Sci. Eng. 2009, 31, 279–286. [Google Scholar] [CrossRef]
  12. Le Lacheur, R.M.; Sonnenberg, L.B.; Singer, P.C.; Christman, R.F.; Charles, M.J. Identification of carbonyl compounds in environmental samples. Environ. Sci. Technol. 1993, 27, 2745–2753. [Google Scholar] [CrossRef]
  13. Bao, M.L.; Pantani, F.; Griffini, O.; Burrini, D.; Santianni, D.; Barbieri, K. Determination of carbonyl compounds in water by derivatization-solid-phase microextraction and gas chromatographic analysis. J. Chromatogr. A 1998, 809, 75–87. [Google Scholar] [CrossRef] [PubMed]
  14. Sladek, N.E.; Manthey, C.L.; Maki, P.A.; Zhang, Z.; Landkamer, G.J. Xenobiotic oxidation catalyzed by aldehyde dehydrogenases. Drug Metab. Rev. 1989, 20, 697–720. [Google Scholar] [CrossRef] [PubMed]
  15. Chaw, Y.M.; Crane, L.E.; Lange, P.; Shapiro, R. Isolation and identification of cross-links from formaldehyde treated nucleic acid. Biochemistry 1980, 19, 5525–5531. [Google Scholar] [CrossRef] [PubMed]
  16. Feldman, V.J.; Kruysse, A. Effects of exposure to acrolein vapor in hamsters simultaneously treated with benzo[α]pyrene or diethylnitrosamine. J. Toxicol. Environ. Health 1978, 3, 379–394. [Google Scholar]
  17. Ma, T.H.; Harris, M.M. Review of the Genotoxicity of formaldehyde. Mutat. Res. 1988, 196, 37–59. [Google Scholar] [CrossRef] [PubMed]
  18. Culleré, L.; Cacho, J.; Ferreira, V. Analysis for wine C5–C8 aldehydes through the determination of their O-(2,3,4,5,6-pentafluorobenzyl)oximes formed directly in the solid phase extraction cartridge. Anal. Chim. Acta 2004, 524, 201–206. [Google Scholar] [CrossRef]
  19. Ortiz, R.; Hagino, H.; Sekiguchi, K.; Wang, Q.; Sakamoto, K. Ambient air measurements of six bifunctional carbonyls in suburban area. Atmos. Res. 2006, 82, 709–718. [Google Scholar] [CrossRef]
  20. Pang, X.; Mu, Y.; Yuan, J.; He, H. Carbonyls emission from ethanol-blended gasoline and biodiesel-ethanol-diesel used in engines. Atmos. Environ. 2008, 42, 1349–1358. [Google Scholar] [CrossRef]
  21. Pawliszyn, J. Handbook of Solid Phase Microextraction; Chemical Industry Press: Beijing, China, 2009. [Google Scholar]
  22. Martos, P.A.; Pawliszyn, J. Sampling and determination of formaldehyde using solid-phase microextraction with on-fiber derivatization. Anal. Chem. 1998, 70, 2311–2320. [Google Scholar] [CrossRef] [PubMed]
  23. Deng, C.; Zhang, X. A simple, rapid and sensitive method for determination of aldehydes in human blood by gas chromatography/mass spectrometry and solid-phase microextraction with on-fiber derivatization. Rapid Commun. Mass Spectrom. 2004, 18, 1715–1720. [Google Scholar] [CrossRef] [PubMed]
  24. Koziel, J.A.; Noah, J.; Pawliszyn, J. Field sampling and determination of formaldehyde in indoor air with solid-phase microextraction and on-fiber derivatization. Environ. Sci. Technol. 2001, 35, 1481–1486. [Google Scholar] [CrossRef] [PubMed]
  25. Schmarr, H.; Sang, W.; Ganß, S.; Fischer, U.; Köpp, B.; Schulz, C.; Potouridis, T. Analysis of aldehydes via headspace SPME with on-fiber derivatization to their O-(2,3,4,5,6-pentafluorobenzyl)oxime derivatives and comprehensive 2D-GC-MS. J. Sep. Sci. 2008, 31, 3458–3465. [Google Scholar] [CrossRef] [PubMed]
  26. Beránek, J.; Kubatova, A. Evaluation of solid-phase microextraction methods for determination of trace concentration aldehydes in aqueous solution. J. Chromatogr. A 2008, 1209, 44–54. [Google Scholar] [CrossRef] [PubMed]
  27. Saison, D.; De Schutter, D.P.; Delvaux, F.; Delvaux, F.R. Optimisation of a complete method for the analysis of volatiles involved in the flavour stability of beer by solid-phase microextraction in combination with gas chromatography and mass spectrometry. J. Chromatogr. A 2008, 1190, 342–349. [Google Scholar] [CrossRef] [PubMed]
  28. Wardencki, W.; Sowinski, P.; Curylo, J. Evaluation of headspace solid-phase microextraction for the analysis of volatile carbonyl compounds in spirits and alcoholic beverages. J. Chromatogr. A 2003, 984, 89–96. [Google Scholar] [CrossRef] [PubMed]
  29. López-Vázquez, C.; Orriols, I.; Perelló, M.-C.; de Revel, G. Determination of aldehydes as pentafluorobenzyl derivatives in grape pomace distillates by HS-SPME-GC/MS. Food Chem. 2012, 130, 1127–1133. [Google Scholar] [CrossRef]
  30. Serrano, M.; Gallego, M.; Silva, M. Static headspace gas chromatography–mass spectrometry for the one-step derivatisation and extraction of eleven aldehydes in drinking water. J. Chromatogr. A 2013, 1307, 158–165. [Google Scholar] [CrossRef] [PubMed]
  31. Cai, L.; Koziel, J.A.; Dharmadhikari, M.; van Leeuwen, J. Rapid determination of trans-resveratrol in red wine by solid phase microextraction with on fiber derivatization and multidimensional gas chromatography-mass spectrometry. J. Chromatogr. A 2009, 1216, 281–287. [Google Scholar] [CrossRef] [PubMed]
  32. Trenholm, R.A.; Rosario-Ortiz, F.L.; Snyder, S.A. Analysis of formaldehyde formation in wastewater using on-fiber derivatization–solid-phase microextraction–gas chromatography–mass spectrometry. J. Chromatogr. A 2008, 1210, 25–29. [Google Scholar] [CrossRef] [PubMed]
  33. Wang, Q.; Reilly, J.O.; Pawliszyn, J. Determination of low-molecular mass aldehydes by automated headspace solid-phase microextraction with in-fibre derivatisation. J. Chromatogr. A 2005, 1071, 147–154. [Google Scholar] [CrossRef] [PubMed]
  34. Tsai, S.W.; Chang, C.M. Analysis of aldehydes in water by solid-phase microextraction with on-fiber derivatization. J. Chromatogr. A 2003, 1015, 143–150. [Google Scholar] [CrossRef] [PubMed]
  35. Munch, J.W.; Munch, D.J.; Winslow, S.D.; Wendelken, S.C.; Pepich, B.V. Determination of carbonyl compounds in drinking water by pentafluorobenzylhydroxylamine derivatization and capillary gas chromatography with electron capture detection. Method 556.1; U.S. Environmental Protection Agency: Cincinnati, OH, USA, 1998. [Google Scholar]
  36. Buttery, R.G.; Ling, L.C.; Guadagni, D.G. Volatilities of aldehydes, ketones, and esters in dilute water solutions. J. Agric. Food Chem. 1969, 17, 385–389. [Google Scholar] [CrossRef]
  37. SRC, Syracuse Res Corp; syracuse, NY, USA. Furfural, The Physical Properties Database (PHYSPROP). Available online: http://esc.syrres.com/fatepointer/webprop.asp?CAS=98011 (accessed on 7 January 2014).
  38. Zhou, X.; Mopper, K. Apparent partition coefficients of 15 carbonyl compounds between air and seawater and between air and freshwater; Implications for air-sea exchange. Environ. Sci. Technol. 1990, 24, 1864–1869. [Google Scholar] [CrossRef]
  39. PubChem, National Institutes of Health. 2-Furaldehyde. Available online: http://pubchem.ncbi.nlm.nih.gov/compound/7362 (accessed on 15 December 2014).

