Sequential Detection of Palladium and Chromium Oxyanion by a Fluorescein Based Chemosensor in Mixed Aqueous Media


Center of Research Excellence in Nanotechnology, King Fahd University of Petroleum and Minerals, Dhahran 31261, Saudi Arabia
Chemosensors 2020, 8(1), 4; https://doi.org/10.3390/chemosensors8010004
Submission received: 20 November 2019
/
Revised: 14 December 2019
/
Accepted: 22 December 2019
/
Published: 26 December 2019
(This article belongs to the Collection Optical Chemosensors and Biosensors)
Abstract
:A new highly selective chemosensor, based on fluorescein-allyloxy benzene conjugate 1, was developed for the sequential detection of palladium and chromium oxyanions in a mixed aqueous media, and was studied by UV-visible and fluorescence spectroscopy. The sensing of palladium ions produces a chemodosimetric and ratiometric change in the emission band of 1 from 450 to 525 nm, followed by the sensing of chromate ions by 2 that quenches the emission band at 525 nm in a buffered H2O: DMF solution (9:1, pH = 7.4). The rate constants of palladium and chromate ions were found to be 8.6 × 10⁵ M−1, 2.1 × 10⁵ M−1, and 5.4 × 10⁴ M−1 respectively. The chemosensor 1 has a palladium detection limit of 49 ppb while the sequential detection limit of chromate ions (CrO42− and Cr2O72−) were 127 and 259 ppb. The ratiometric change in the emission is produced due to the deallylation of 1 by palladium to produce 2 that restores the ESIPT (excited state intramolecular proton transfer) of the phenolic ring and enhances the electron transfer (ET) phenomenon from the phenolic group to fluorescein. The sequential binding of chromate ions to 2 inhibits the ESIPT and causes chelation enhanced quenching (CHEQ) of the fluorescence.
1. Introduction
Palladium is a rare transition metal that belongs to the platinum-group elements (PGEs). It plays a significant role in chemical transformations and acts as a catalyst in reactions such as the Suzuki–Miyaura, Heck, Sonogashira, Buchwald–Hartwig, hydrogenation, and dehydrogenation reactions that are widely used to make complex molecules in the pharmaceuticals industries [1,2,3]. It is also extensively used as an important ingredient in various materials such as fuel cells, fine jewelry, dental crowns, and alloys [4,5]. Palladium is also an imperative material in high-tech fields such as navigation, aviation, and in the automotive industry, especially in automobile catalytic converters [6]. Its increased emission in the environment and non-biodegradable nature can cause serious health hazards by accumulation in the food chain. Excess of palladium can result in the degradation of DNA and cell mitochondria, and enzyme inhibition [7]. Thus, the proposed maximum dietary intake for this ubiquitous and poisonous heavy metal is less than 1.5–15 μg per person per day and its threshold in drugs is 5–10 ppm [8].
There are many traditional analytical techniques used for the sensing of palladium that include atomic absorption/emission spectroscopy (AAS), solid-phase microextraction high performance liquid chromatography (SPME-HPLC), inductively coupled plasma atomic emission spectroscopy (ICP-AES) etc. However, all of these methods need expensive facilities, complicated sample-pretreatment, and rigorous experimental conditions [9,10]. Recently, optical (colorimetric and fluorescent) chemosensors or probes have attracted more and more importance for sensing and monitoring of heavy and transitional metal ions (HTM) due to its high selectivity, sensitivity, operational simplicity, rapidity, and nondestructive nature [11,12,13,14,15]. One of the common ways to synthesize a palladium sensor is to use palladium catalyzed reactions such as Pd-catalyzed cyclization for the formation of pyrone, pyrrole, and oxazole [16,17], Pd-catalyzed depropargylation reactions [18] and deallylation reactions [19], the Pd-catalyzed Heck [20], and the Suzuki–Miyaura coupling reactions [21]. However, many of them still have impediments such as interference from other metal ions, insolubility in water, requirement for additional reagents for analysis, and laborious synthesis procedures with expensive chemicals.
Chromium as a heavy metal is also toxic in nature. Its hexavalent chromium ion is soluble in water and is carcinogenic and mutagenic in nature causing damage of DNA, protein, and enzymes [22,23,24]. It plays a very important role in the printing, electroplating, leather tanning, metal polishing, and agricultural industries [25,26,27]. There are several chemical and instrumental methods applied for the detection of chromate ions, among them inductively coupled plasma mass spectrometry (ICP-MS) [28] and high-performance liquid chromatography coupled with atomic absorption spectrometry [29] are most commonly used. However, these methods involve expensive instruments, time consuming, and have prolonged sample pretreatments. On the other hand, the colorimetric or fluorometric methods are much easier to handle and fast responsive.
Xanthenes (fluorescein and rhodamine) based chemosensors are very efficient fluorescent chemosensor as they can be (a) easily synthesized and functionalized; (b) their excitation and emission wavelengths lie in the visible region; (c) they also have a high fluorescence quantum yield, molar extinction coefficient, photostability and water solubility; (d) they also possess an excellent biocompatible nature [30,31,32,33,34]. Moreover, they are ideal for the construction of switch on–off type chemosensors due to the conversion of spirolactam (nonfluorescent) to ring-opened amide (fluorescent) structure [35]. The presence of heteroatoms such as oxygen, nitrogen, phosphorus, and sulfur with the xanthene ring helps in the binding of soft metal ion like palladium and chromium [36]. However, these sensors suffer from the interference of other coexisting metal ions, and also the pH-sensitive fluorescein or rhodamine fluorophore may pose detection errors to the results. So it is extremely desirable to produce a chemosensor that has the optical properties of a xanthene but are highly selective and less pH sensitive. Recently, we synthesized a new chemosensor based on fluorescein hydrazine-imidazole conjugate as a copper chemosensor [37]. In this paper we synthesized a new chemosensor based on fluorescein hydrazone and allyloxy benzene conjugate (1) (Scheme 1), and investigated its photophysical properties with different metal ions and anions. Compound 1 showed a highly selective, chromogenic, ratiometric, and fluorogenic response upon interaction with Pd2+ in a mixed aqueous solution containing 4-(2-hydroxyethyl)-1-piperazineethanesulfonic acid (HEPES) buffer (10 mM, pH 7.4). This deallylation based chemodosimetric response (in competition with other cations) of 1 with Pd2+ leads to the formation of 2 which was then used in the same aqueous media for the sequential detection of chromate ions (CrO42−, Cr2O72−).
2. Materials and Methods
2.1. General Methods
Melting points were determined using a Thomas–Hoover capillary melting point apparatus and are uncorrected. 1H and 13C NMR spectra were recorded on a JEOL 400 MHz spectrometer (Jeol, Japan) using Me4Si as the internal standard. UV–VIS absorption spectra were obtained using a Jasco V-670 spectrophotometer (Oklahoma City, OK, USA). Fluorescence spectra were measured using a Horiba, Fluorolog-3 fluorescence spectrophotometer, equipped with a xenon discharge lamp and 1 cm quartz cells with slit width 5 nm. All of the measurements were carried out at 298 K.
Deionized water (double distilled) was used throughout the experiment as the aqueous media. All other materials used for synthesis and solvents were purchased from Aldrich Chemical Co. (St. Louis, MI, USA) and used without further purification. Compound 4 was synthesized in accordance with the literature procedure [37]. The solutions of metal ions were prepared from their nitrate and chloride salts (analytical grade), and subsequently diluted to prepare working solutions. HEPES buffer solutions at different pH values were prepared using appropriate amounts of HEPES and KOH (all of analytical grade) under adjustment by a Mettler Toledo pH meter (Saudi Arabia).
2.2 Synthesis
2.2.1. Synthesis of 3
A mixture of salicylaldehyde (250 mg, 2.0 mmol), allyl bromide (135 mg, 1.1 mmol), and potassium carbonate (275 mg, 2.0 mmol) in acetonitrile (10 mL) were refluxed for 12 h. The solvent was removed under vacuum and the residue was diluted with water and extracted with ethyl acetate. The organic layer was dried over anhydrous Na2SO4 and concentrated. The residue was purified by SiO2 column chromatography (elution with EtOAc:hexane = 1:4) to give 3 as pale yellow oil in 95% yield. 1H NMR (400 MHz, CDCl3), δ (ppm): 4.62 (d, J = 4.0 Hz, 2H), 5.30 (d, J = 8.4 Hz, 1H), 5.42 (d, J = 14.8 Hz, 1H), 6.0–6.1 (m, 1H), 6.94 (d, J = 6.8 Hz, 1H), 6.99 (t, J = 6.0 Hz, 1H), 7.49 (t, J = 6.0 Hz, 1H), 7.80 (d, J = 6.0 Hz, 1H), 10.5 (s, 1H), 13C NMR (100 MHz, CDCl3), δ (ppm): 69.0, 113.1, 118.5, 120.5, 125.3, 128.0, 132.2, 136.1, 162.1, 189.2.
2.2.2. Synthesis of 1
Fluorescein hydrazide (4, 0.5 g, 1.4 mmol) and 3 (0.275 g, 1.7 mmol) were mixed in 10 mL of ethanol. The mixture was refluxed for 12 h with stirring, resulting in the formation of a yellow precipitate. The precipitate was separated by filtration and washed with 3 × 10 mL of ethanol. After drying, compound 1 was obtained as a yellowish solid in 90% yield. Melting Point 200–202 °C (CH2Cl2-hexane); 1H NMR (400 MHz, DMSO-d6), δ (ppm): 4.51 (d, J = 4.0 Hz, 2H), 5.32 (d, J = 6.8 Hz, 1H), 5.34 (d, J = 12.4 Hz, 1H), 5.94–6.01 (m, 1H), 6.45 (d, J = 1.6 Hz, 1H), 6.46 (d, J = 1.6 Hz, 1H), 6.50 (s, 1H), 6.52 (s, 1H), 6.66 (d, J = 1.6 Hz, 2H), 6.93 (t, J = 6.4 Hz, 1H), 6.98 (d, J = 6.8 Hz, 1H), 7.1 (d, J = 6.0 Hz, 1H), 7.32 (t, J = 5.6 Hz, 1H), 7.57 (t, J = 5.6 Hz, 2H), 7.63 (t, J = 6.0 Hz, 1H), 7.93 (d, J = 6.0 Hz, 1H), 8.96 (s, 1H), 9.92 (s, 2H). 13C NMR (100 MHz, DMSO-d6), δ (ppm): 65.30, 69.01, 103.14, 103.34, 110.19, 112.88, 113.50, 117.44 117.87, 121.30, 123.16, 123.68, 124.08, 125.19, 128.23, 128.75, 129.47, 132.13, 133.59, 134.49, 135.05, 142.80, 143.00, 151.62, 152.37, 157.11, 157.41, 159.08, 164.29 (Figures S1 and S2). Anal Calcd for 1, C30H22N2O5: C, 73.46; H, 4.52; N, 5.71, found: C, 73.35; H, 4.50; N, 5.62.
2.2.3. Synthesis of 2
Compound 1 (0.590 g, 1.2 mmol) and PdCl2 (0.250 g, 1.4 mmol) were mixed in 10 mL of acetonitrile. The mixture was stirred for 1 h resulting in the formation of a yellowish precipitate. The precipitate was separated by filtration and washed with 3 × 10 mL of water. After drying, a yellowish solid in 95% yield was obtained. Melting Point 325–327 °C (MeOH-hexane); 1H NMR (400 MHz, DMSO-d6), δ (ppm): 6.48 (d, J = 2.4 Hz, 1H), 6.50 (d, J = 2.0 Hz, 1H), 6.53 (s, 1H), 6.55 (s, 1H), 6.68 (d, J = 2.0 Hz, 2H), 6.79–6.83 (m, 2H), 7.15 (d, J = 6.8 Hz, 1H), 7.22 (t, J = 7.6 Hz, 1H), 7.33 (d, J = 8.0 Hz, 1H), 7.59–7.67 (m, 2H), 7.94 (d, J = 6.4 Hz, 1H), 9.20 (s, 1H), 9.97 (s, 2H), 10.32 (s, 1H). 13C NMR (100 MHz, DMSO-d6), δ (ppm): 63.91, 109.27, 112.88, 116.31, 118.18, 118.81, 119.24, 119.82, 121.31, 123.16, 123.68, 128.23, 128.75, 129.06, 130.11, 132.13, 134.49, 136.53, 150.63, 150.72, 151.62, 152.38, 157.11, 159.08, 161.22, 164.29 (Figures S3 and S4). Anal Calcd for 2, C27H18N2O5: C, 71.99; H, 4.03; N, 6.22, Found: C, 71.88; H, 4.00; N, 6.15.
3. Results and Discussion
Compound 1 was synthesized by the conjugation of allyloxy benzaldehyde with fluorescein hydrazide to get a Schiff base in which the excited state intramolecular proton transfer (ESIPT) is inhibited by the allyloxy group. Compound 1 was prepared by the reaction of 4 with 2-(Allyloxy) benzaldehyde 3, which in turn is obtained by the allylation of Salicylaldehyde in acetonitrile. Further deallylation of 1 results in the formation of 2 (Scheme 1). Both compounds 1 and 2 were prepared in good yields and their structures were confirmed using 1H, 13C NMR, and elemental analysis (Supplementary Materials Figures S1–S4). In the 1H NMR the singlet peak at δ 8.96 and 9.19 ppm corresponds to the formation of imine = C–H proton for compounds 1 and 2 respectively. From the NMR spectrum, compounds 1 could be easily differentiated from 2 due to the presence of the doublet peaks at δ 4.51, 5.32, and 5.34 ppm and a multiplet peak at δ 5.94–6.01 ppm for the allyl group and the absence of the phenolic peak at δ 10.3 ppm. The singlet peaks at δ 9.91 and 9.97 ppm corresponds to the hydroxyl protons of the fluorescein group of 1 and 2 respectively.
All the UV-VIS absorption and fluorescence emission were investigated at a concentration of 10 μM and 1.0 μM in a water and DMF (9:1) mixed solution containing HEPES buffer (10 mM, pH 7.4) respectively. The UV-VIS spectrum of chemosensor 1 displayed an absorption peak at 320 nm, due to the absorption of the xanthene moiety [31,38]. Addition of Pd2+ into the mixed aqueous solution of 1, produces a new red-shifted absorption band at 340 nm, and simultaneously decreases the absorption band at 320 nm with an isobestic point at 330 nm (Figure S5b). The peak at 340 nm is attributed to the deallylation of the conjugated phenol ring by the Pd2+ species and formation of compound 2. The increase of the absorption bands at 340 nm is linear up to the addition of 1 equivalent of Pd2+ (Figure S5b, inset). The observed absorption response was highly selective for only Pd2+ ions as compared to other metals cations (10 equiv.), such as the transition metals, as well as alkali and alkaline earth metals, produce minute or no considerable spectral changes (Figure S5a).
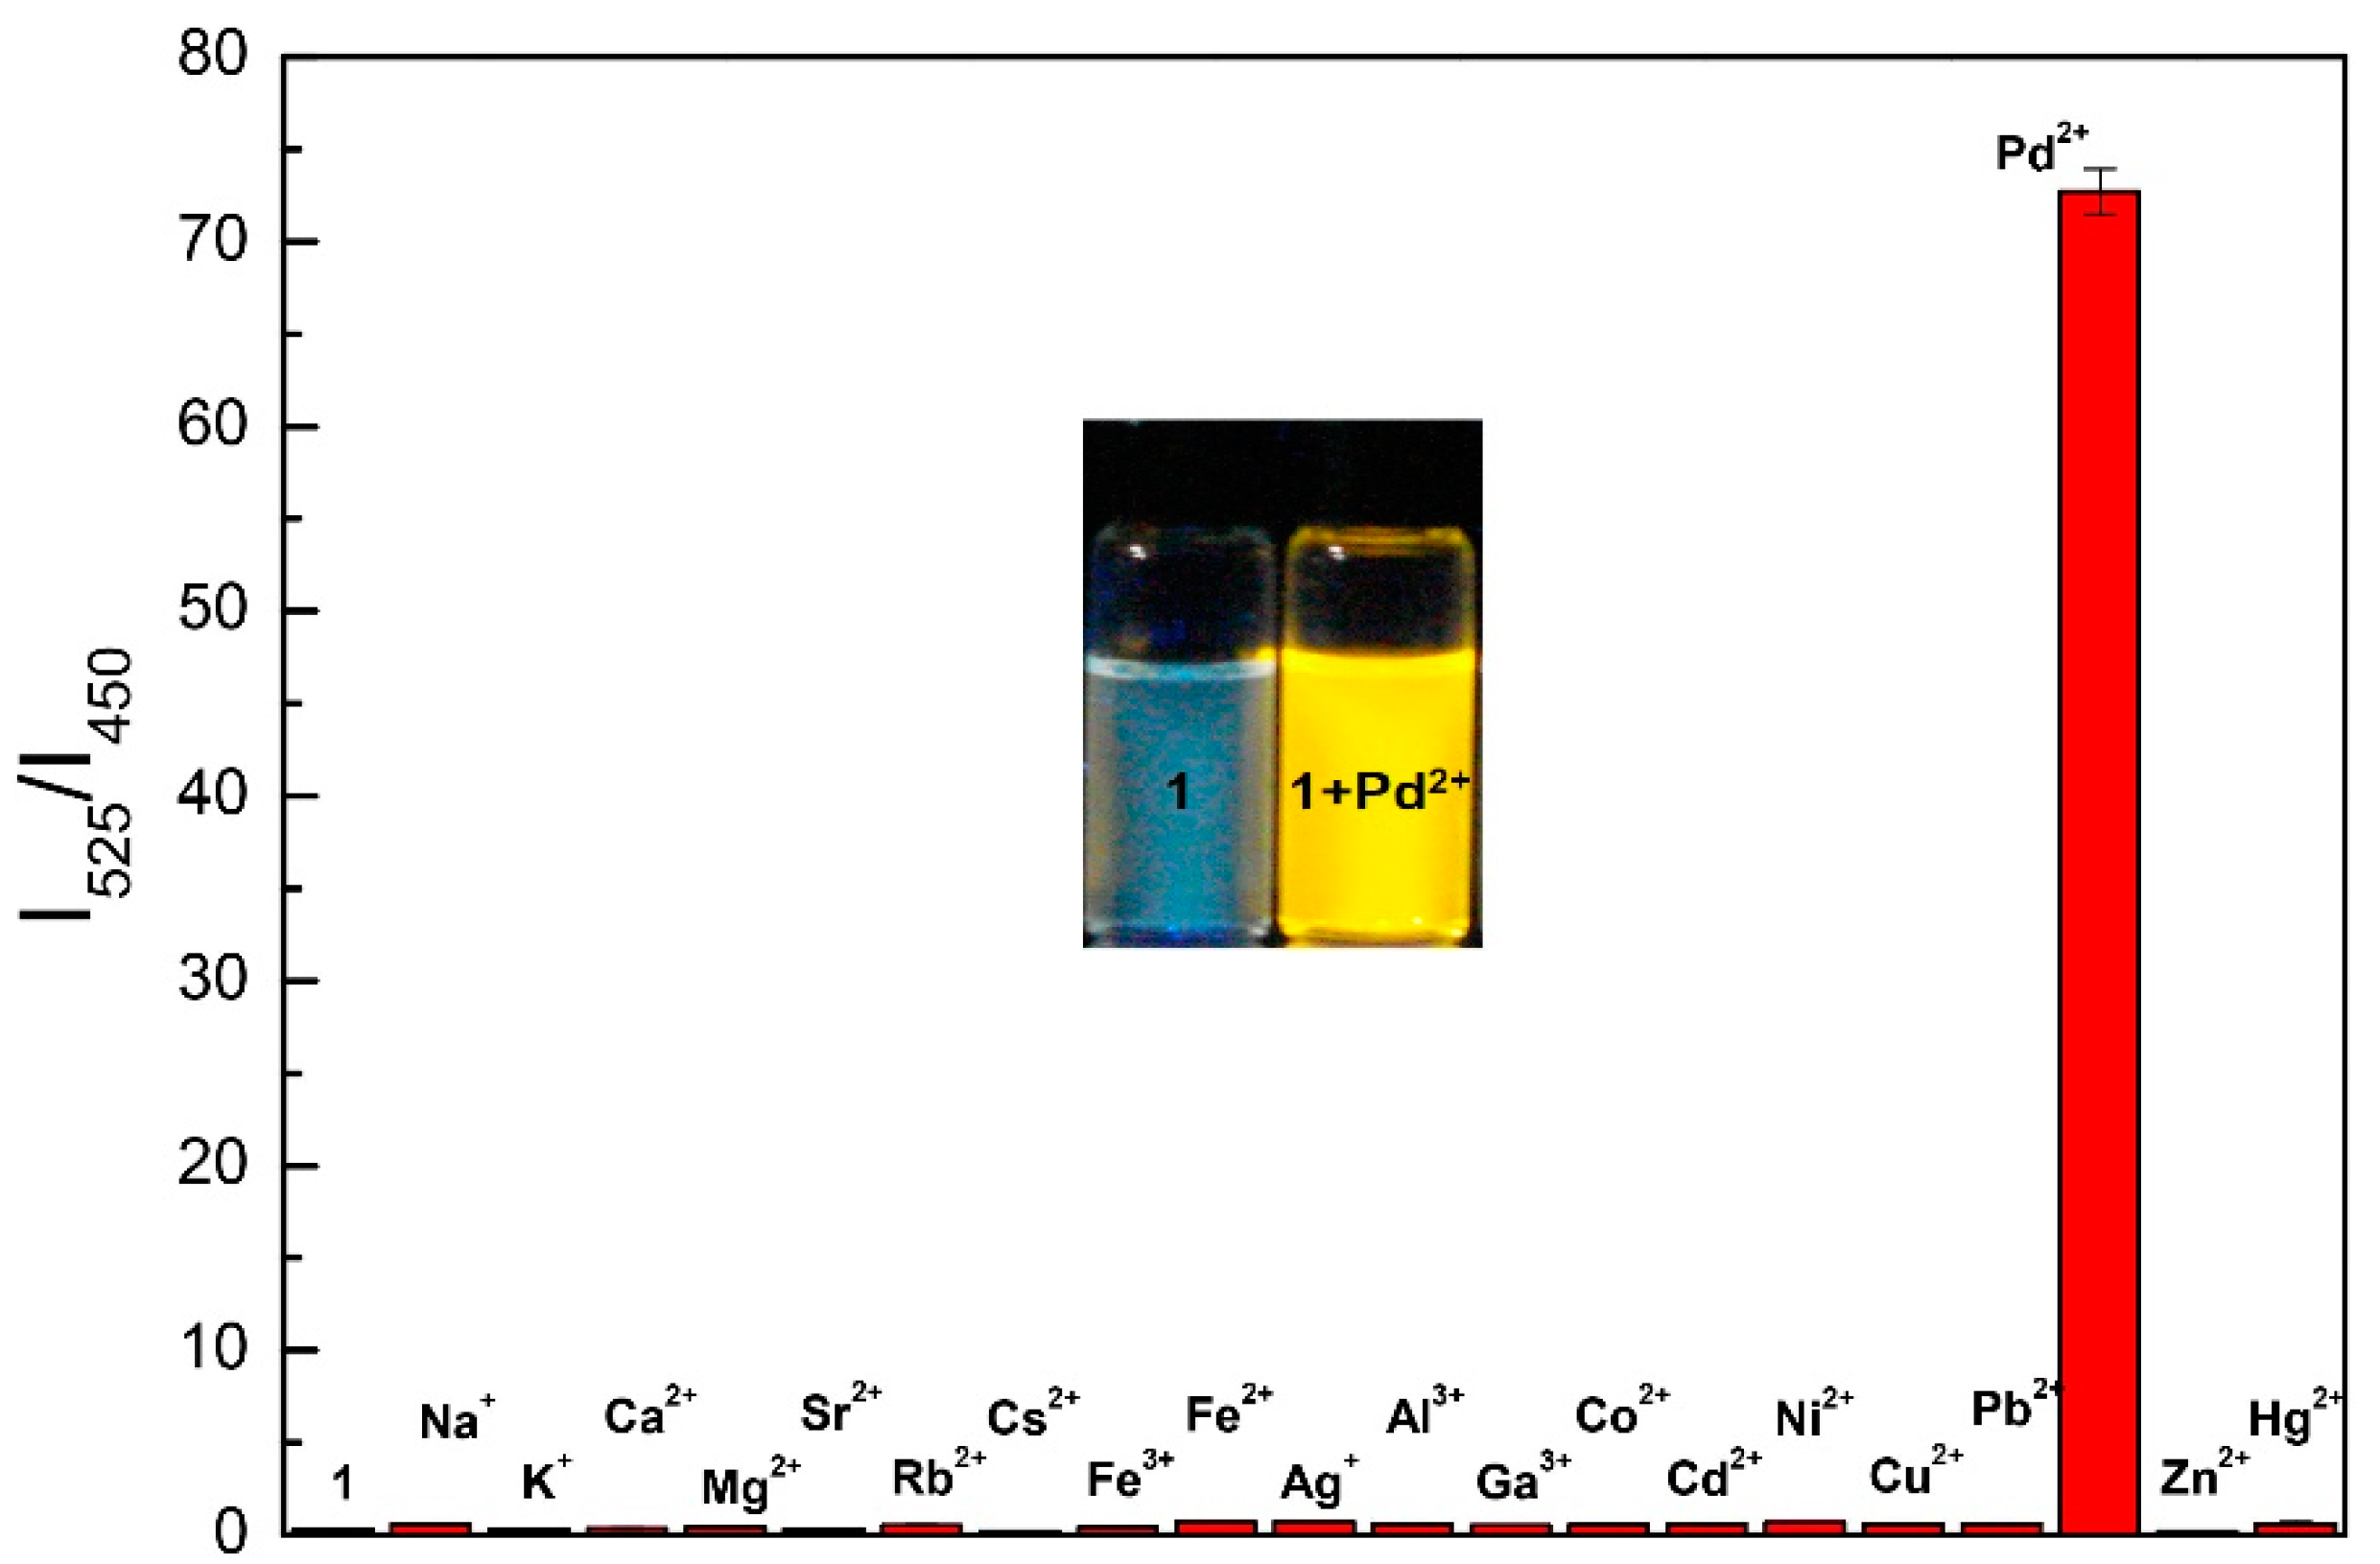
Emission properties of chemosensor 1 were investigated by studying the complexation abilities of 1(1.0 μM) with 10 equiv. of various biologically relevant and non-relevant metal cations in a mixed aqueous solution of water and DMF (9:1) with fluorescence emission. Chemosensor 1 has an emission peak at 450 nm; on the addition of Pd2+ it produces a drastic red-shifted peak at 525 nm with a fluorogenic change from blue to yellow fluorescence and a maximum ratio of fluorescence intensities (I540/I390) (λex = 330 nm) (Figure 1 and inset). This distinct emission shift on interaction with 1 was only produced by Pd2+ among all other cations (Figure S6).
In fluorescence titrations, slow addition of Pd2+ synchronously decreased the emission peak of 1 at 450 nm, and a new peak is formed at 525 nm with an isoemission point at 485 nm and a bathochromic shift of 75 nm (Figure 2). Thus, the peak at 450 nm of chemosensor 1 was completely switched off while a new peak at 525 nm was switched on, by the interaction with Pd2+ making it a potential ratiometric chemosensor. The linear enhancement of the peak at 525 nm with the increase of Pd2+ ion concentration indicated that after the addition of 1.0 equivalent of Pd2+ there is no further emission enhancement (Figure 2 inset) which showed that only one equivalent of Pd2+ interacts with one equivalent of the chemosensor 1. From the fluorescence titration, the rate constant for palladium ion was found to be 8.6 × 10⁵ M−1 (error estimated to be ≤10%) (Figure S7) [39] with a detection limit of 49 ppb (Figure S8) [40]. The fluorescence quantum yield calculated for 1 is 0.12 and after interaction with the one equivalent of Pd2+ fluorescence quantum yield was found to be 0.25 under identical conditions.
In order to study the mechanism of fluorescence we isolated the product 2 formed on the interaction of 1 with Pd2+ (Scheme 1). The 1H and 13C NMR of 2 showed that it is formed by the deallylation of 1 with Pd2+ which is confirmed by disappearance of the allyl peaks and the presence of the phenolic proton peak in 1H NMR (Figure S9). The fluorescein moiety has no absorption in the visible region and is weakly fluorescent in solution due to the preponderance of the ring-closed spirolactam structure, which is evident by 13C NMR signals at δ 65.3 and δ 63.9 ppm for compounds 1 and 2, respectively [41,42]. The blue fluorescence in 1 arises due to the electron transfer (ET) from allyloxy benzene to the fluorescein ring. Deallylation of 1 with Pd2+ restores the ESIPT of the phenolic group that assist the electron transfer (ET) phenomenon resulting in a ratiometric change in the emission [43,44,45,46,47]. The specific ratiometric response of chemosensor 1 towards Pd2+ was further investigated by a competitive binding experiment with different transition metals, alkali and alkaline earth metals. These coexisting cations, did not intervene with the ratiometric response of 1 towards Pd2+, even though their concentrations were 100-fold greater than the Pd2+ concentration (Figure S10).
Next, we also examined the fluorescence response of chemosensor 1 toward several typical palladium species such as PdCl2, Pd(PPh3)4, Pd(OAc)2, PdCl2(PPh3)4, and Pd2(dba)3. We find that the chemosensor 1 responds to most commonly used species of palladium and exhibits significant ratiometric change in the emission. Thus, this chemosensor can be used successfully for the sensing of different palladium species (Figure 3 and Figure S11).
For physiological and environmental applications, a chemosensor should operate within a broad range of pH. In order to study the effects of pH, the emission intensities of 1 and 2 were examined in the pH range of 2.0–12.0 (Figure 4). At neutral and basic pH fluorescein is colorless, non-fluorescent, and exists in a closed spirocyclic form. At low pH value both 1 and 2 undergoes protonation of the oxygen of the allyloxy benzene or the phenol ring and this impede the ET to fluorescein, resulting in diminution of fluorescence. Compound 1 and 2 showed maximum fluorescence emission from pH 5.0 to 9.0. At higher pH values (>9.0), the negative charge density on the allyloxy benzene or the phenol ring increases that consequently decreases the fluorescence intensity (Figure S12) [37,41,42,48,49].
The compound 2 obtained was then used for the sequential detection of anions (Scheme 2). We investigated the complexation abilities of 2 (1.0 μM) with 10 equiv. of various anions such as CH3CO2−, PO42−, SO42−, Cr2O72−, CrO42−, F−, Cl−, Br−, I−, HSO4−, MnO4−, and NO3−. It was found that chromium oxyanion (Cr2O72−, CrO42−) produced partial and complete quenching of the band at 525 nm on excitation at 330 nm in a mixed aqueous solution of H2O:DMF (9:1) containing HEPES buffer (10 mM, pH 7.4) (Figure 5 and Figure S13).
Fluorescence titration of the 2 with the chromium oxyanions slowly quenches the emission band at the 525 nm. Complete quenching is observed after the addition of 1 equivalent of CrO42− while partial quenching takes place after the addition of 1 equivalent of Cr2O72− (Figure 6 and Figure 7). The Job’s plot also confirms that the binding ratio of 2 with the chromium oxyanions are 1:1 (Figure S14). The binding constant calculated from the fluorescence titration plot was found to be 2.1 × 10⁵ (Error estimated to be ≤10%) (Figure S15) and 5.4 × 10⁴ (error estimated to be ≤10%) (Figure S16) for CrO42− and Cr2O72− respectively. The limit of detection was calculated to be 127 ppb and 259 ppb for CrO42− and Cr2O72− respectively (Figures S17 and S18). The 1HNMR titration of 2 with chromate anion shows that the OH peak at 10.3 ppm disappears which inhibits ESIPT (Figure S19). The binding of the chromate with 2 also results in the downfield shifts of the proton at δ 9.2 (imine proton), δ 7.63, and δ 6.81 ppm. Thus binding of the chromium oxyanion inhibits the ESIPT and results in the selective chelation enhanced quenching (CHEQ) of the emission at 525 nm [50]. We also checked the competitive binding experiment in the presence of different anions and found that the quenching of 2 by the CrO42− remain unchanged even in the presence of 100 equivalent of other anions (Figure S20).
4. Conclusions
In summary we have prepared a new chemodosimetric, ratiometric, highly sensitive, chemosensor (1) based on a fluorescein-allyloxy benzene conjugate for sequential detection of Pd2+ and chromium oxyanions in a H2O-DMF (9:1) solution containing HEPES buffer (10 mM, pH 7.4). It was found that 1 produced a large (75 nm) bathochromic shift in emission upon deallylation with Pd2+ to form 2, with an “on–off” type fluoroionophoric switching property that restores ESIPT. This behavior was identical with different species of palladium and within a pH range of 5.0–9.0. The detection limit for the chemosensor 1 for palladium was found to be 49 ppb and a rate constant of 8.6 × 10⁵ M−1. The compound 2 formed after deallylation can then sequentially detect chromium oxyanions (CrO42−and Cr2O72−) by quenching of the fluorescence due to inhibition of ESIPT. The detection limit for the chemosensor 2 for CrO42−and Cr2O72− was found to be 127 ppb and 259 ppb with a rate constant of 2.1 × 10⁵ M−1 and 5.4 × 10⁴ M−1 respectively.
Supplementary Materials
The following are available online at https://www.mdpi.com/2227-9040/8/1/4/s1, 1H NMR, 13C NMR, spectrum, absorbance and emission spectrum, NMR titration, LOD calculations, Job’s plot, competitive binding of cations and anions. Figure S1. 1H NMR of compound 1. Figure S2. 13C NMR of compound 1. Figure S3. 1H NMR of compound 2. Figure S4. 13C NMR of compound 2. Figure S5. UV-Vis spectra of 1 (10 μM) (a) with different cations (10 equivalents), (b) upon the addition of PdCl2 (100 μM) in H2O:DMF (9:1) containing HEPES buffer (10 mM, pH 7.4). Inset: Mol ratio plot of absorbance at 340 nm. Figure S6. Fluorescence spectra of 1 (1.0 μM) with different cations (10 μM) in H2O:DMF (9:1) containing HEPES buffer (10 mM, pH 7.4). (λex = 330 nm). Figure S7. Linear regression curve of 1 obtained by plotting I0/(I-I0) as a function of 1/[Pd2+] in H2O:DMF (9:1) containing HEPES buffer (10 mM, pH 7.4). (λex = 330 nm). Figure S8. Plot of normalized fluorescence intensity of 1 as a function of log[Pd2+] in H2O:DMF (9:1) containing HEPES buffer (10 mM). (λex = 330 nm). Figure S9. Partial 1H NMR spectra of 1 and 1 with PdCl2 in DMSO-d6. Figure S10. Competitive metal ion selectivity of 1: Bars indicate the fluorescence intensity (330 nm excitation, 525 nm emission). Salts of various metal ions (100 equivalent) were added to 1 and Pd2+ (a) 1 and Pd2+, (b) Ag+ + Pd2+, (c) Pb2+ + Pd2+, (d) Zn2+ + Pd2+, (e) Mg2+ + Pd2+, (f) Fe3+ + Pd2+, (g) K+ + Pd2+, (h) Co2+ + Pd2+, (i) Al3+ + Pd2+, (j) Fe2+ + Pd2+, (k) Na+ + Pd2+, (l) Cd2+ + Pd2+, (m) Sr2+ + Pd2+, (n) Rb+ + Pd2+, (o) Cu2++ Pd2+ (p) Ni2+ + Pd2+, (q) Hg2+ + Pd2+, (r) Ga3+ + Pd2+, (s) Cs+ + Pd2+ (t) Ca2+ + Pd2+ in H2O:DMF (9:1) containing HEPES buffer (10 mM). Figure S11. Change in the fluorescence emission spectrum with different palladium complexes, measured for an equimolar mixture of probe 1 (1.0 μM) and the palladium species in H2O:DMF (9:1) containing HEPES buffer (10 mM, pH 7.4). (λex = 330 nm). Figure S12. Effect of pH on the emission spectrum of 1 (390 nm) and 2 (540 nm) in H2O:DMF (9:1) containing HEPES buffer (10 mM, pH 7.4). (λex = 330 nm). Figure S13. Fluorescence spectra of 2 (1.0 μM) with different anions (10 μM) in H2O:DMF (9:1) containing HEPES buffer (10 mM, pH 7.4). (λex = 330 nm). Figure S14. Job’s plot for 2 with K2CrO4 in H2O:DMF (9:1) containing HEPES buffer (10 mM, pH 7.4). (λex = 330 nm). Figure S15. Linear regression curve of 2 obtained by plotting I0/(I-I0) as a function of 1/[CrO42−] in H2O:DMF (9:1) containing HEPES buffer (10 mM, pH 7.4). (λex = 330 nm). Figure S16. Linear regression curve of 2 obtained by plotting I0/(I-I0) as a function of 1/[Cr2O72−] in H2O:DMF (9:1) containing HEPES buffer (10 mM, pH 7.4). (λex = 330 nm). Figure S17. Plot of normalized fluorescence intensity of 2 as a function of log[CrO42−] in H2O:DMF (9:1) containing HEPES buffer (10 mM). (λex = 330 nm). Figure S18. Plot of normalized fluorescence intensity of 2 as a function of log[Cr2 O72−] in H2O:DMF (9:1) containing HEPES buffer (10 mM). (λex = 330 nm). Figure S19. Partial 1H NMR spectra of 2 and 2 with K2CrO4 in DMSO-d6. Figure S20. Competitive anion selectivity of 2: Bars indicate the fluorescence intensity (330 nm excitation, 525 nm emission). Salts of various metal ions (100 equivalent) were added to 2 and CrO42− (a) 2, (b) CH3CO2− + CrO42−, (c) PO42− + CrO42−, (d) SO42− + CrO42−, (e) Cr2O72− + CrO42−, (f) F− + CrO42−, (g) Cl− + CrO42−, (h) Br− + CrO42−, (i) I− + CrO42−, (j) HSO4− + CrO42−, (k) MnO4− + CrO42−, (l) NO3− + CrO42−, (m) CrO42− in H2O:DMF (9:1) containing HEPES buffer (10 mM).
Funding
It was funded by King Fahd University of Petroleum and Minerals, Kingdom of Saudi Arabia.
Acknowledgments
The authors gratefully acknowledge the Center of Research Excellence in Nanotechnology (CENT) in King Fahd University of Petroleum and Minerals for providing funds and availing its facilities for analysis.
Conflicts of Interest
The author declares no conflict of interest.
References
- Liu, C.; Zhang, S.K.; Zhang, Y.X.; Jin, Z.L. Arylation of pyridine N-oxides via a ligand-free Suzuki reaction in water. Chin. Chem. Lett. 2015, 26, 55–57. [Google Scholar] [CrossRef]
- Tietze, L.F.; Ila, H.; Bell, H.P. Enantioselective palladium-catalyzed transformations. Chem. Rev. 2004, 104, 3453–3516. [Google Scholar] [CrossRef] [PubMed]
- Amini, M.; Bagherzadeh, M.; Rostamnia, S. Efficient imidazolium salts for palladium-catalyzed Mizoroki–Heck and Suzuki–Miyaura cross-coupling reactions. Chin. Chem. Lett. 2013, 24, 433–436. [Google Scholar] [CrossRef]
- Lyons, T.W.; Sanford, M.S. Palladium-catalyzed ligand-directed C−H functionalization reactions. Chem. Rev. 2010, 110, 1147–1169. [Google Scholar] [CrossRef] [PubMed] [Green Version]
- Lafrance, M.; Fagnou, K. Palladium-catalyzed benzene arylation: Incorporation of catalytic pivalic acid as a proton shuttle and a key element in catalyst design. J. Am. Chem. Soc. 2006, 128, 16496–16497. [Google Scholar] [CrossRef] [PubMed]
- Alt, F.; Zereini, F. Palladium Emissions in the Environment Analytical Methods, Environmental Assessment and Health Effects; Springer: Berlin, Germany, 2006. [Google Scholar]
- Li, H.; Fan, J.; Peng, X. Colourimetric and fluorescent probes for the optical detection of palladium ions. Chem. Soc. Rev. 2013, 42, 7943–7962. [Google Scholar] [CrossRef]
- Wang, J.; Song, F.; Wang, J.; Peng, X. A near-infrared and ratiometric fluorescent chemosensor for palladium. Analyst 2013, 138, 3667–3672. [Google Scholar] [CrossRef]
- Meel, K.V.; Smekens, A.; Behets, M.; Kazandjian, P.; Grieken, R.V. Determination of platinum, palladium, and rhodium in automotive catalysts using high-energy secondary target X-ray fluorescence spectrometry. Anal. Chem. 2007, 79, 6383–6389. [Google Scholar] [CrossRef]
- Dimov, S.S.; Chryssoulis, S.L.; Lipson, R.H. Quantitative elemental analysis for rhodium and palladium in minerals by time-of-flight resonance ionization mass spectrometry. Anal. Chem. 2003, 75, 6723–6727. [Google Scholar] [CrossRef]
- Carter, K.P.; Young, A.M.; Palmer, A.E. Fluorescent sensors for measuring metal ions in living systems. Chem. Rev. 2014, 114, 4564–4601. [Google Scholar] [CrossRef]
- Huo, B.; Du, M.; Gong, A.; Li, M.; Fang, L.; Shen, A.; Lai, Y.; Bai, X.; Yang, Y. A novel intramolecular cyclization-induced fluorescent “turn-on” probe for detection of Pd2+ based on the Tsuji-Trost reaction. Anal. Methods 2018, 10, 3475–3480. [Google Scholar] [CrossRef]
- Che, C.; Chen, X.; Wang, H.; Li, J.Q.; Xiao, Y.; Fu, B.; Qin, Z. A novel 6-quinoxalinamine-based fluorescent probe for real-time detection of palladium (II) ions in pure water and bio-imaging. New J. Chem. 2018, 42, 12773–12778. [Google Scholar] [CrossRef]
- Mondal, S.; Manna, S.K.; Pathak, S.; Masum, A.A.; Mukhopadhyay, S. A colorimetric and “off–on” fluorescent Pd2+ chemosensor based on a rhodamine-ampyrone conjugate: Synthesis, experimental and theoretical studies along with in vitro applications. New J. Chem. 2019, 43, 3513–3519. [Google Scholar] [CrossRef]
- Kim, H.N.; Ren, W.; Kim, J.S.; Yoon, J. Fluorescent and colorimetric sensors for detection of lead, cadmium, and mercury ions. Chem. Soc. Rev. 2012, 41, 3210–3244. [Google Scholar] [CrossRef] [PubMed]
- Jun, M.E.; Ahn, K.H. Fluorogenic and chromogenic detection of palladium species through a catalytic conversion of a rhodamine B derivative. Org. Lett. 2010, 12, 2790–2793. [Google Scholar] [CrossRef] [PubMed]
- Pershagen, E.; Nordholm, J.; Borbas, K.E. Luminescent Lanthanide Complexes with Analyte-Triggered Antenna Formation. J. Am. Chem. Soc. 2012, 134, 9832–9835. [Google Scholar] [CrossRef]
- Balamurugan, R.; Chien, C.C.; Wu, K.-M.; Chiu, Y.-H.; Li, J.-H. A depropargylation-triggered fluorescence “turn-on” probe for the detection of Pd2+ based on a bispropargylamine–rhodamine conjugate. Analyst 2013, 138, 1564–1569. [Google Scholar] [CrossRef]
- Song, F.; Garner, A.L.; Koide, K. A highly sensitive fluorescent sensor for palladium based on the allylic oxidative insertion mechanism. J. Am. Chem. Soc. 2007, 129, 12354–12355. [Google Scholar] [CrossRef]
- Yu, S.; Rhee, H.-W.; Hong, J.-I. Fluorescent sensing system for palladium (II) based on the Heck reaction. Tetrahedron Lett. 2011, 52, 1512–1514. [Google Scholar] [CrossRef]
- Yusop, R.M.; Unciti-Broceta, A.; Johansson, E.M.V.; Sánchez-Martín, R.M.; Bradley, M. Palladium-mediated intracellular chemistry. Nat. Chem. 2011, 3, 239–243. [Google Scholar] [CrossRef]
- Ashwina, B.C.M.A.; Sivaraman, G.; Stalina, T.; Yuvakkumar, R.; Mareeswarana, P.M. Selective and sensitive fluorescent sensor for Pd2+ using coumarin 460 for real-time and biological applications. J. Photochem. Photobiol. B 2018, 183, 302–308. [Google Scholar] [CrossRef] [PubMed]
- Zhitkovich, A. Importance of chromium-DNA adducts in mutagenicity and toxicity of chromium (VI). Chem. Res. Toxicol. 2005, 18, 3–11. [Google Scholar] [CrossRef] [PubMed]
- Bagchi, D.; Stohs, S.J.; Downs, B.W.; Bagchi, M.; Preuss, H.G. Cytotoxicity and oxidative mechanisms of different forms of chromium. Toxicology 2002, 180, 5–22. [Google Scholar] [CrossRef]
- Vonburg, R.; Liu, D. Chromium and Hexavalent Chromium. J. Appl. Toxicol. 1993, 13, 225–230. [Google Scholar] [CrossRef]
- Khezami, L.; Capart, R. Removal of chromium (VI) from aqueous solution by activated carbons: Kinetic and equilibrium studies. J. Hazard. Mater. 2005, 123, 223–231. [Google Scholar] [CrossRef]
- Kamaludeen, S.P.B.; Megharaj, M.; Juhasz, A.L.; Sethunathan, N.; Naidu, R. Chromium-microorganism interactions in soils: Remediation implications. Rev. Environ. Contam. Toxicol. 2003, 178, 93–164. [Google Scholar]
- Rakhunde, R.; Deshpande, L.; Juneja, H.D. Chemical speciation of chromium in water: A review. Crit. Rev. Environ. Sci. Technol. 2012, 42, 776–810. [Google Scholar] [CrossRef]
- Mohandossa, S.; Sivakamavallib, J.; Vaseeharanb, B.; Stalina, T. Host-guest molecular recognition based fluorescence On-Off-On chemosensor for nanomolar level detection of Cu2+ and Cr2O72− ions: Application in XNOR logic gate and human lung cancer living cell imaging. Sens. Actuators B Chem. 2016, 234, 300–315. [Google Scholar] [CrossRef]
- Prakash, A.; Chandra, S.; Bahadur, D. Structural, magnetic, and textural properties of iron oxide-reduced graphene oxide hybrids and their use for the electrochemical detection of chromium. Carbon 2012, 50, 4209–4219. [Google Scholar] [CrossRef]
- Zheng, H.; Zhan, X.-Q.; Biana, Q.-N.; Zhang, X.-J. Advances in modifying fluorescein and rhodamine fluorophores as fluorescent chemosensors. Chem. Commun. 2013, 49, 429–447. [Google Scholar] [CrossRef]
- Chen, X.; Pradhan, T.; Wang, F.; Kim, J.S.; Yoon, J. Fluorescent chemosensors based on spiroring-opening of xanthenes and related derivatives. Chem. Rev. 2011, 112, 1910–1956. [Google Scholar] [CrossRef] [PubMed]
- Xiong, X.Q.; Song, F.L.; Chen, G.W.; Sun, W.; Wang, J.Y.; Gao, P. Construction of Long-Wavelength Fluorescein Analogues and Their Application as Fluorescent Probes. Chem. Eur. J. 2013, 19, 6538–6545. [Google Scholar] [CrossRef] [PubMed]
- An, J.M.; Yan, M.H.; Yang, Z.Y.; Li, T.R.; Zhou, Q.X. A turn-on fluorescent sensor for Zn (II) based on fluorescein-coumarin conjugate. Dyes Pigment. 2013, 99, 1–5. [Google Scholar] [CrossRef]
- Jua, H.; Lee, M.H.; Kim, J.; Kim, J.S.; Kim, J. Rhodamine-based chemosensing monolayers on glass as a facile fluorescent “turn-on” sensing film for selective detection of Pb2+. Talanta 2011, 83, 1359–1363. [Google Scholar] [CrossRef]
- Wang, M.; Liu, X.; Lu, H.; Wang, H.; Qin, Z. Highly Selective and Reversible Chemosensor for Pd2+ Detected by Fluorescence, Colorimetry, and Test Paper. ACS. Appl. Mater. Interfaces 2015, 7, 1284–1289. [Google Scholar] [CrossRef]
- Helal, A.; Kim, H.-S.; Yamani, Z.H.; Shaikh, M.N. Fluorescein-N-Methylimidazole Conjugate as Cu2+ Sensor in Mixed Aqueous Media Through Electron Transfer. J. Fluoresc. 2016, 26, 1–9. [Google Scholar] [CrossRef]
- Sivaram, G.; Chellappa, D. Rhodamine based sensor for naked-eye detection and live cell imaging of fluoride ions. J. Mater. Chem. B 2013, 1, 5768–5772. [Google Scholar] [CrossRef]
- Yin, W.; Zhu, H.; Wang, R. A sensitive and selective fluorescence probe based fluorescein for detection of hypochlorous acid and its application for biological imaging. Dyes Pigment. 2014, 107, 127–132. [Google Scholar] [CrossRef]
- Thordarson, P. Determining association constants from titration experiments in supramolecular chemistry. Chem. Soc. Rev. 2011, 40, 1305–1323. [Google Scholar] [CrossRef]
- Zhu, B.; Zhang, X.; Li, Y.; Wang, P.; Zhang, H.; Zhuang, X. A colorimetric and ratiometric fluorescent probe for thiols and its bioimaging applications. Chem. Commun. 2010, 46, 5710–5712. [Google Scholar] [CrossRef]
- Egawa, T.; Koide, Y.; Hanaoka, K.; Komatsu, T.; Teraia, T.; Nagano, T. Development of a fluorescein analogue, Tokyo Magenta, as a novel scaffold for fluorescence probes in red region. Chem. Commun. 2011, 47, 4162–4164. [Google Scholar] [CrossRef] [PubMed]
- Ueno, T.; Urano, Y.; Setsukinai, K.; Takakusa, H.; Kojima, H.; Kikuchi, K.; Ohkubo, K.; Fukuzumi, S.; Nagano, T. Rational principles for modulating fluorescence properties of fluorescein. J. Am. Chem. Soc. 2004, 126, 14079–14085. [Google Scholar] [CrossRef] [PubMed]
- Kumar, A.; Kim, H.-S. N-(3-Imidazolyl) propyl dansylamide as a selective Hg2+ sensor in aqueous media through electron transfer. Spectrochim. Acta Part A Mol. Biomol. Spectrosc. 2015, 148, 250–254. [Google Scholar] [CrossRef] [PubMed]
- Kumar, A.; Kim, H.S. A pyrenesulfonyl-imidazolium derivative as a selective cyanide ion sensor in aqueous media. New J. Chem. 2015, 39, 2935–2942. [Google Scholar] [CrossRef]
- Hens, A.; Maity, A.; Rajak, K.K. N, N coordinating schiff base ligand acting as a fluorescence sensor for zinc (II) and colorimetric sensor for copper (II), and zinc (II) in mixed aqueous media. Inorg. Chim. Acta 2014, 423, 408–420. [Google Scholar] [CrossRef]
- Kavallieratos, K.; Rosenberg, J.M.; Chen, W.-Z.; Ren, T. Fluorescent sensing and selective Pb (II) extraction by a dansylamide ion-exchanger. J. Am. Chem. Soc. 2005, 127, 6514–6515. [Google Scholar] [CrossRef] [Green Version]
- Santra, M.; Roy, B.; Ahn, K.H. A “reactive” ratiometric fluorescent probe for mercury species. Org. Lett. 2011, 13, 3422–3425. [Google Scholar] [CrossRef]
- Ding, J.; Yuan, L.; Gao, L.; Chen, J. Fluorescence quenching of a rhodamine derivative: Selectively sensing Cu2+ in acidic aqueous media. J. Lumin. 2012, 132, 1987–1993. [Google Scholar] [CrossRef]
- Bua, F.; Zhao, B.; Kan, W.; Ding, L.; Liu, T.; Wang, L.; Song, B.; Wang, W.; Deng, Q. An ESIPT characteristic “turn-on” fluorescence sensor for Hg2+ with large Stokes shift and sequential “turn-off” detection of S2− as well as the application in living cells. J. Photochem. Photobiol. A 2020, 387, 112165–112174. [Google Scholar] [CrossRef]
Scheme 1.
Synthesis of 1 and 2.
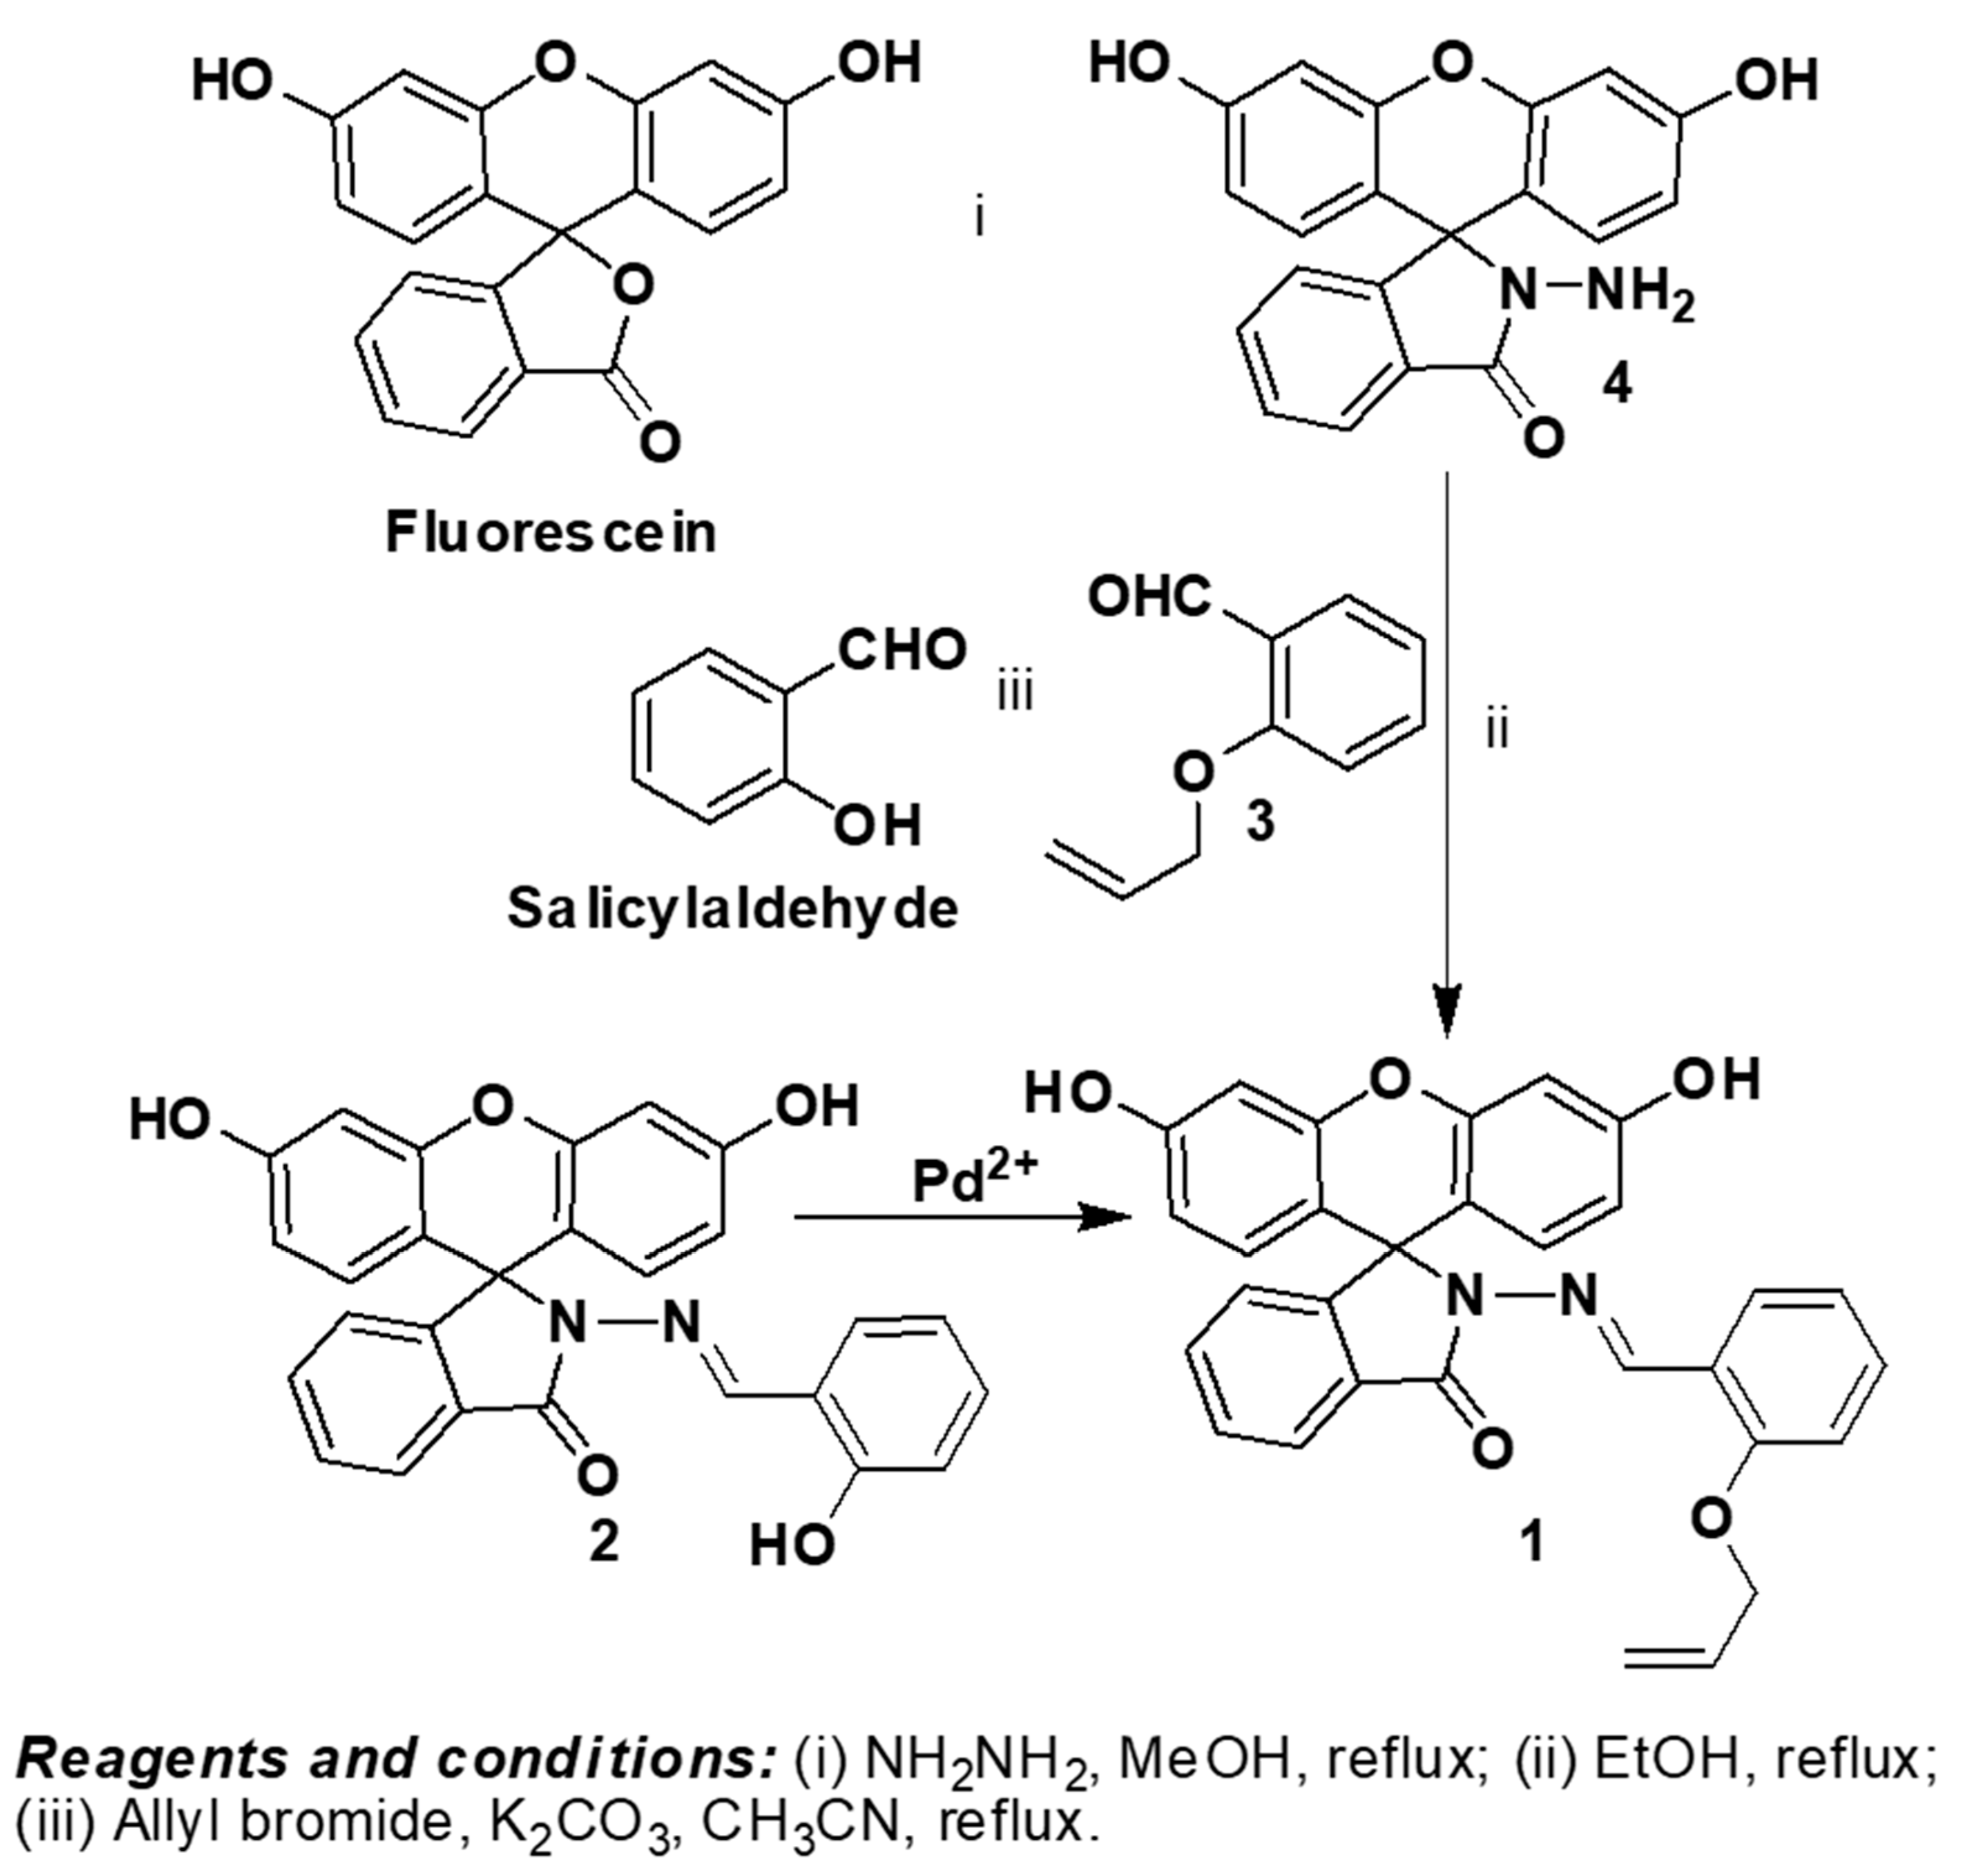
Figure 1.
Fluorescence intensities ratio (I540/I390) of 1 (1.0 μM) with different cations (10 equivalents) in H2O:DMF (9:1) containing HEPES buffer (10 mM, pH 7.4). (λex = 330 nm). Inset: fluorogenic change from blue to yellow fluorescence upon illumination at 365 nm.
Figure 1.
Fluorescence intensities ratio (I540/I390) of 1 (1.0 μM) with different cations (10 equivalents) in H2O:DMF (9:1) containing HEPES buffer (10 mM, pH 7.4). (λex = 330 nm). Inset: fluorogenic change from blue to yellow fluorescence upon illumination at 365 nm.

Figure 2.
Fluorescence spectra of 1 (1.0 μM) as a function of added PdCl2 (10 μM) in H2O:DMF (9:1) containing HEPES buffer (10 mM, pH 7.4). (λex = 330 nm). Inset: mol ratio plot of emission at 525 nm.
Figure 2.
Fluorescence spectra of 1 (1.0 μM) as a function of added PdCl2 (10 μM) in H2O:DMF (9:1) containing HEPES buffer (10 mM, pH 7.4). (λex = 330 nm). Inset: mol ratio plot of emission at 525 nm.
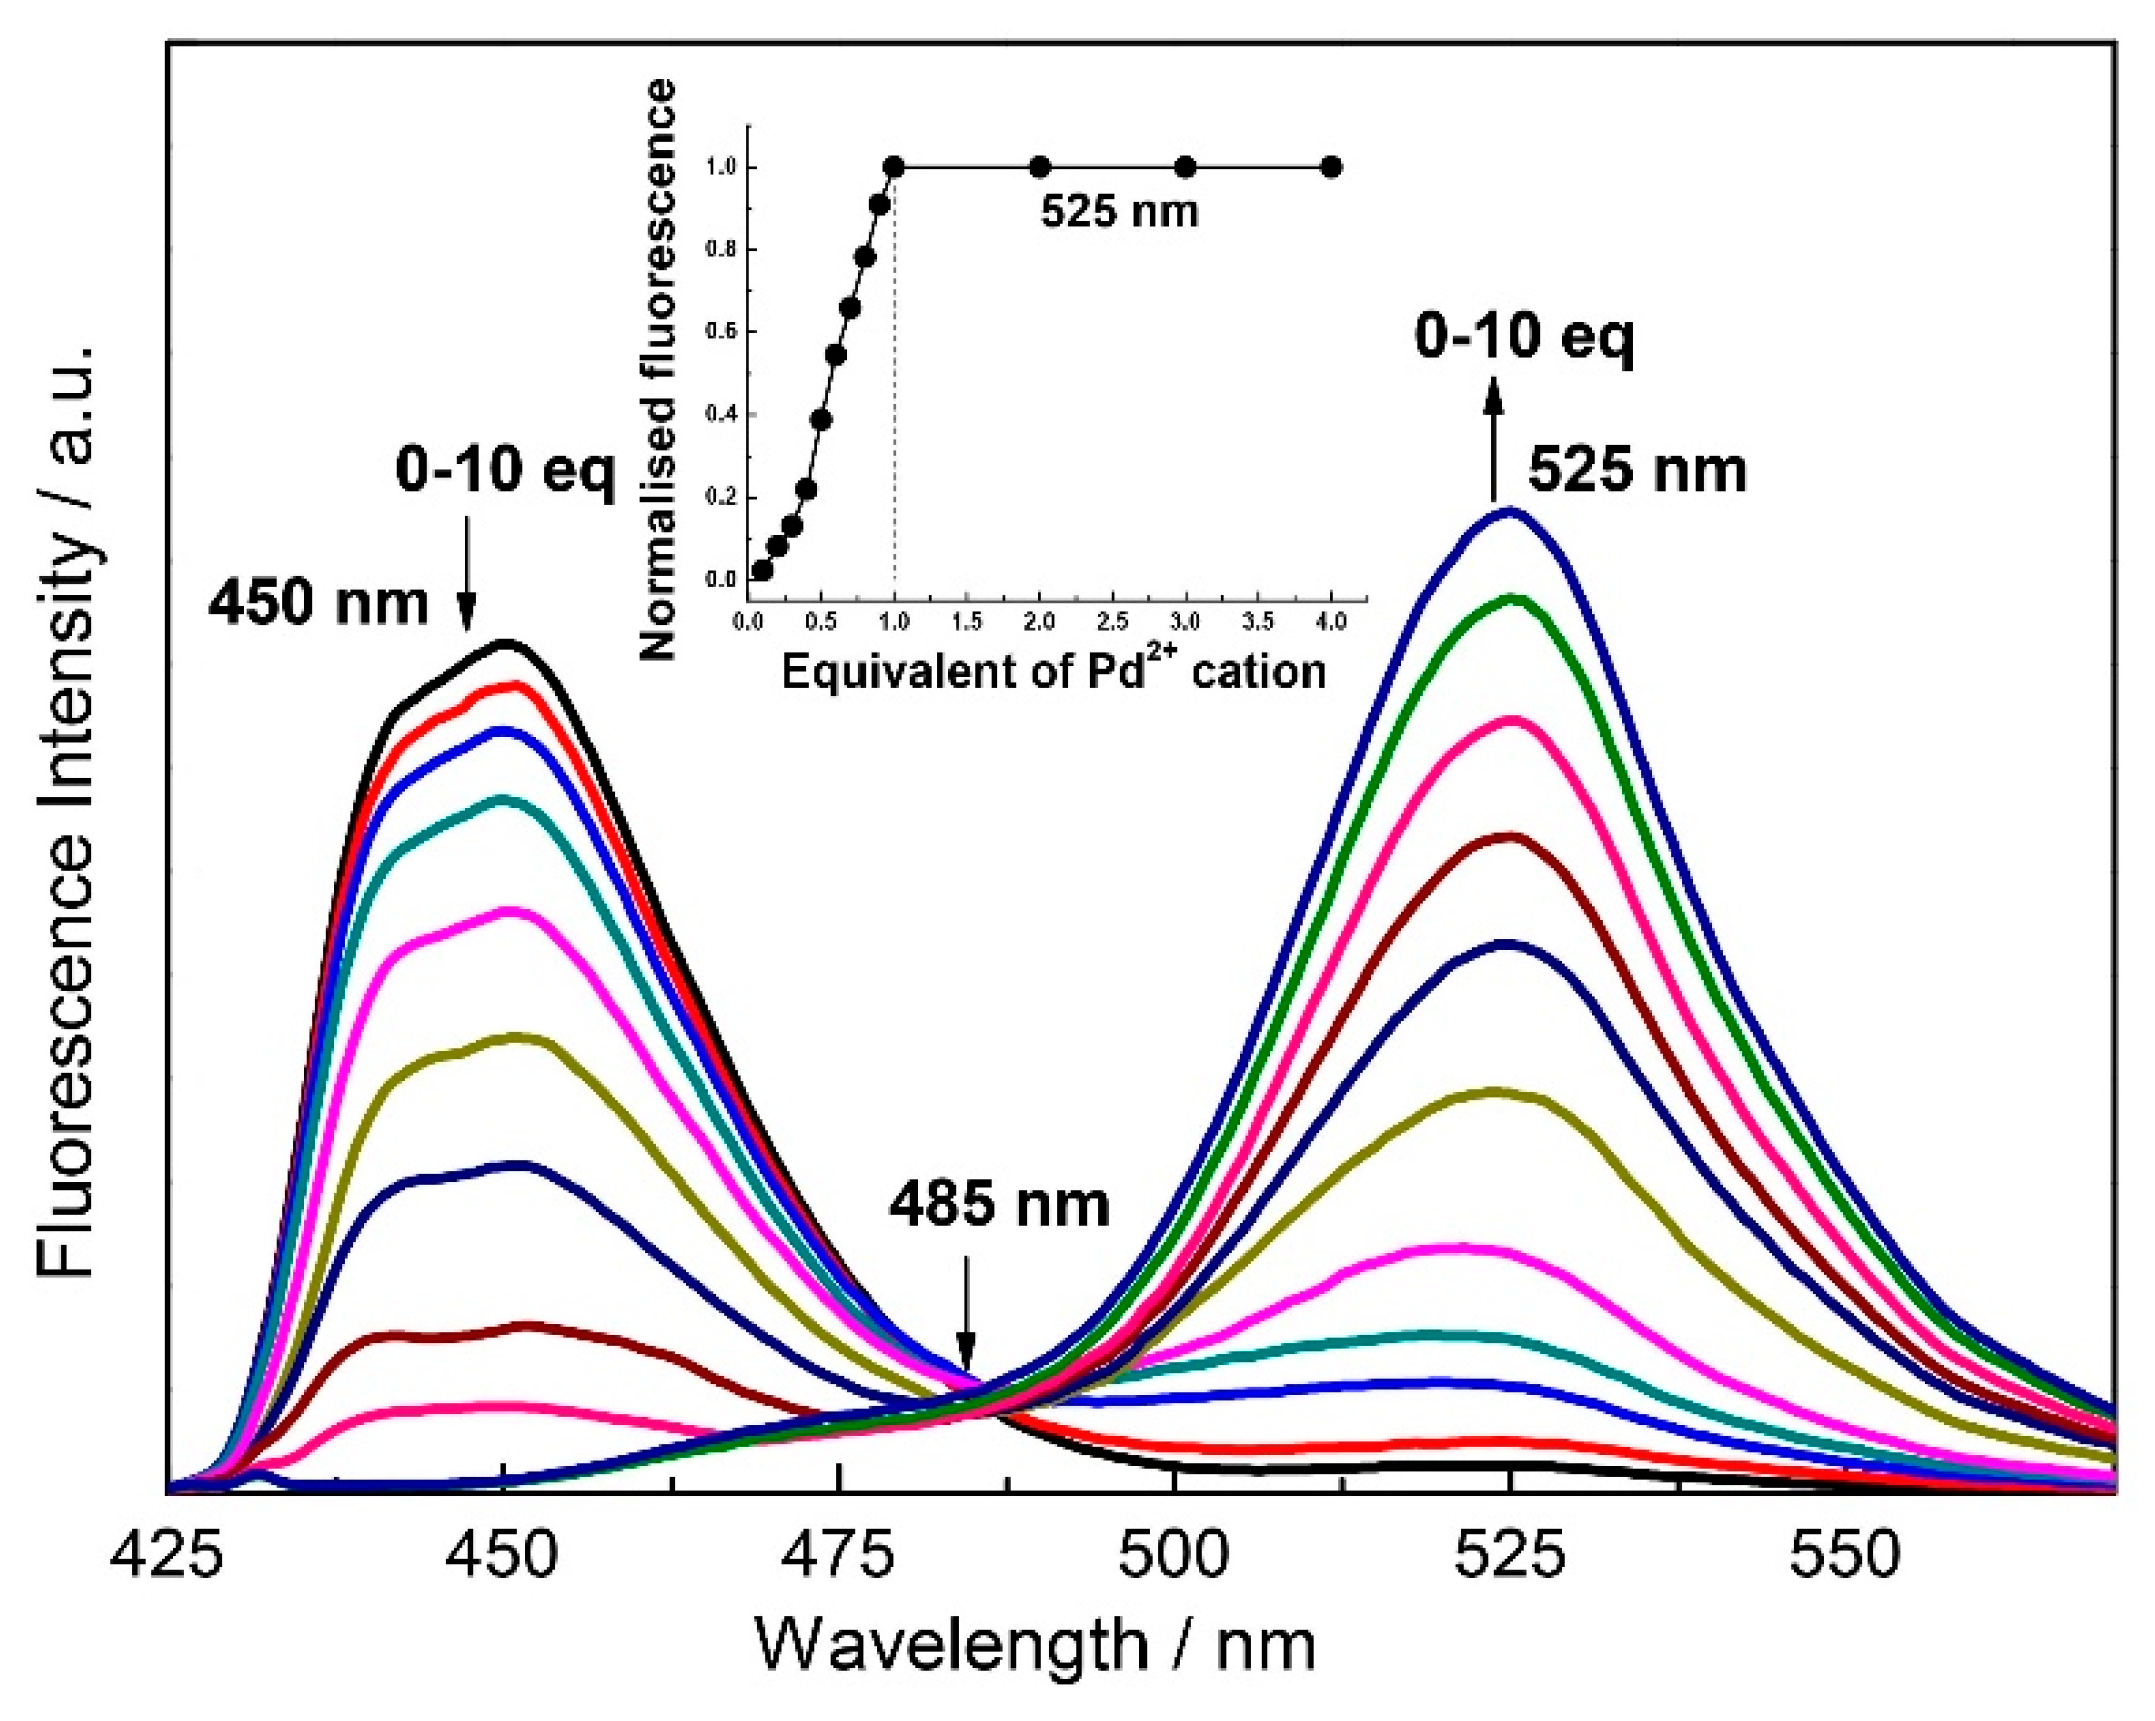
Figure 3.
Comparison of the fluorescence change depending on different palladium complexes, measured for an equimolar mixture of chemosensor 1 (1.0 μM) and the palladium species in H2O:DMF (9:1) containing HEPES buffer (10 mM, pH 7.4). (λex = 330 nm).
Figure 3.
Comparison of the fluorescence change depending on different palladium complexes, measured for an equimolar mixture of chemosensor 1 (1.0 μM) and the palladium species in H2O:DMF (9:1) containing HEPES buffer (10 mM, pH 7.4). (λex = 330 nm).

Figure 4.
Effect of pH on the emission intensities of 1 and 2, in H2O:DMF (9:1) containing HEPES buffer (10 mM, pH 7.4). (λex = 330 nm).
Figure 4.
Effect of pH on the emission intensities of 1 and 2, in H2O:DMF (9:1) containing HEPES buffer (10 mM, pH 7.4). (λex = 330 nm).

Scheme 2.
Mechanism of fluorescence on–off by the addition of the analytes.

Figure 5.
Quenching efficiencies of 2 (1.0 μM) with different anions (10 equivalents) in H2O:DMF (9:1) containing HEPES buffer (10 mM, pH 7.4). (λex = 330 nm). Inset: fluorogenic change from yellow to colorless fluorescence upon illumination at 365 nm.
Figure 5.
Quenching efficiencies of 2 (1.0 μM) with different anions (10 equivalents) in H2O:DMF (9:1) containing HEPES buffer (10 mM, pH 7.4). (λex = 330 nm). Inset: fluorogenic change from yellow to colorless fluorescence upon illumination at 365 nm.

Figure 6.
Fluorescence spectra of 2 (1.0 μM) as a function of added K2CrO4 (10 μM) in H2O:DMF (9:1) containing HEPES buffer (10 mM, pH 7.4). (λex = 330 nm). Inset: mol ratio plot of emission at 525 nm.
Figure 6.
Fluorescence spectra of 2 (1.0 μM) as a function of added K2CrO4 (10 μM) in H2O:DMF (9:1) containing HEPES buffer (10 mM, pH 7.4). (λex = 330 nm). Inset: mol ratio plot of emission at 525 nm.
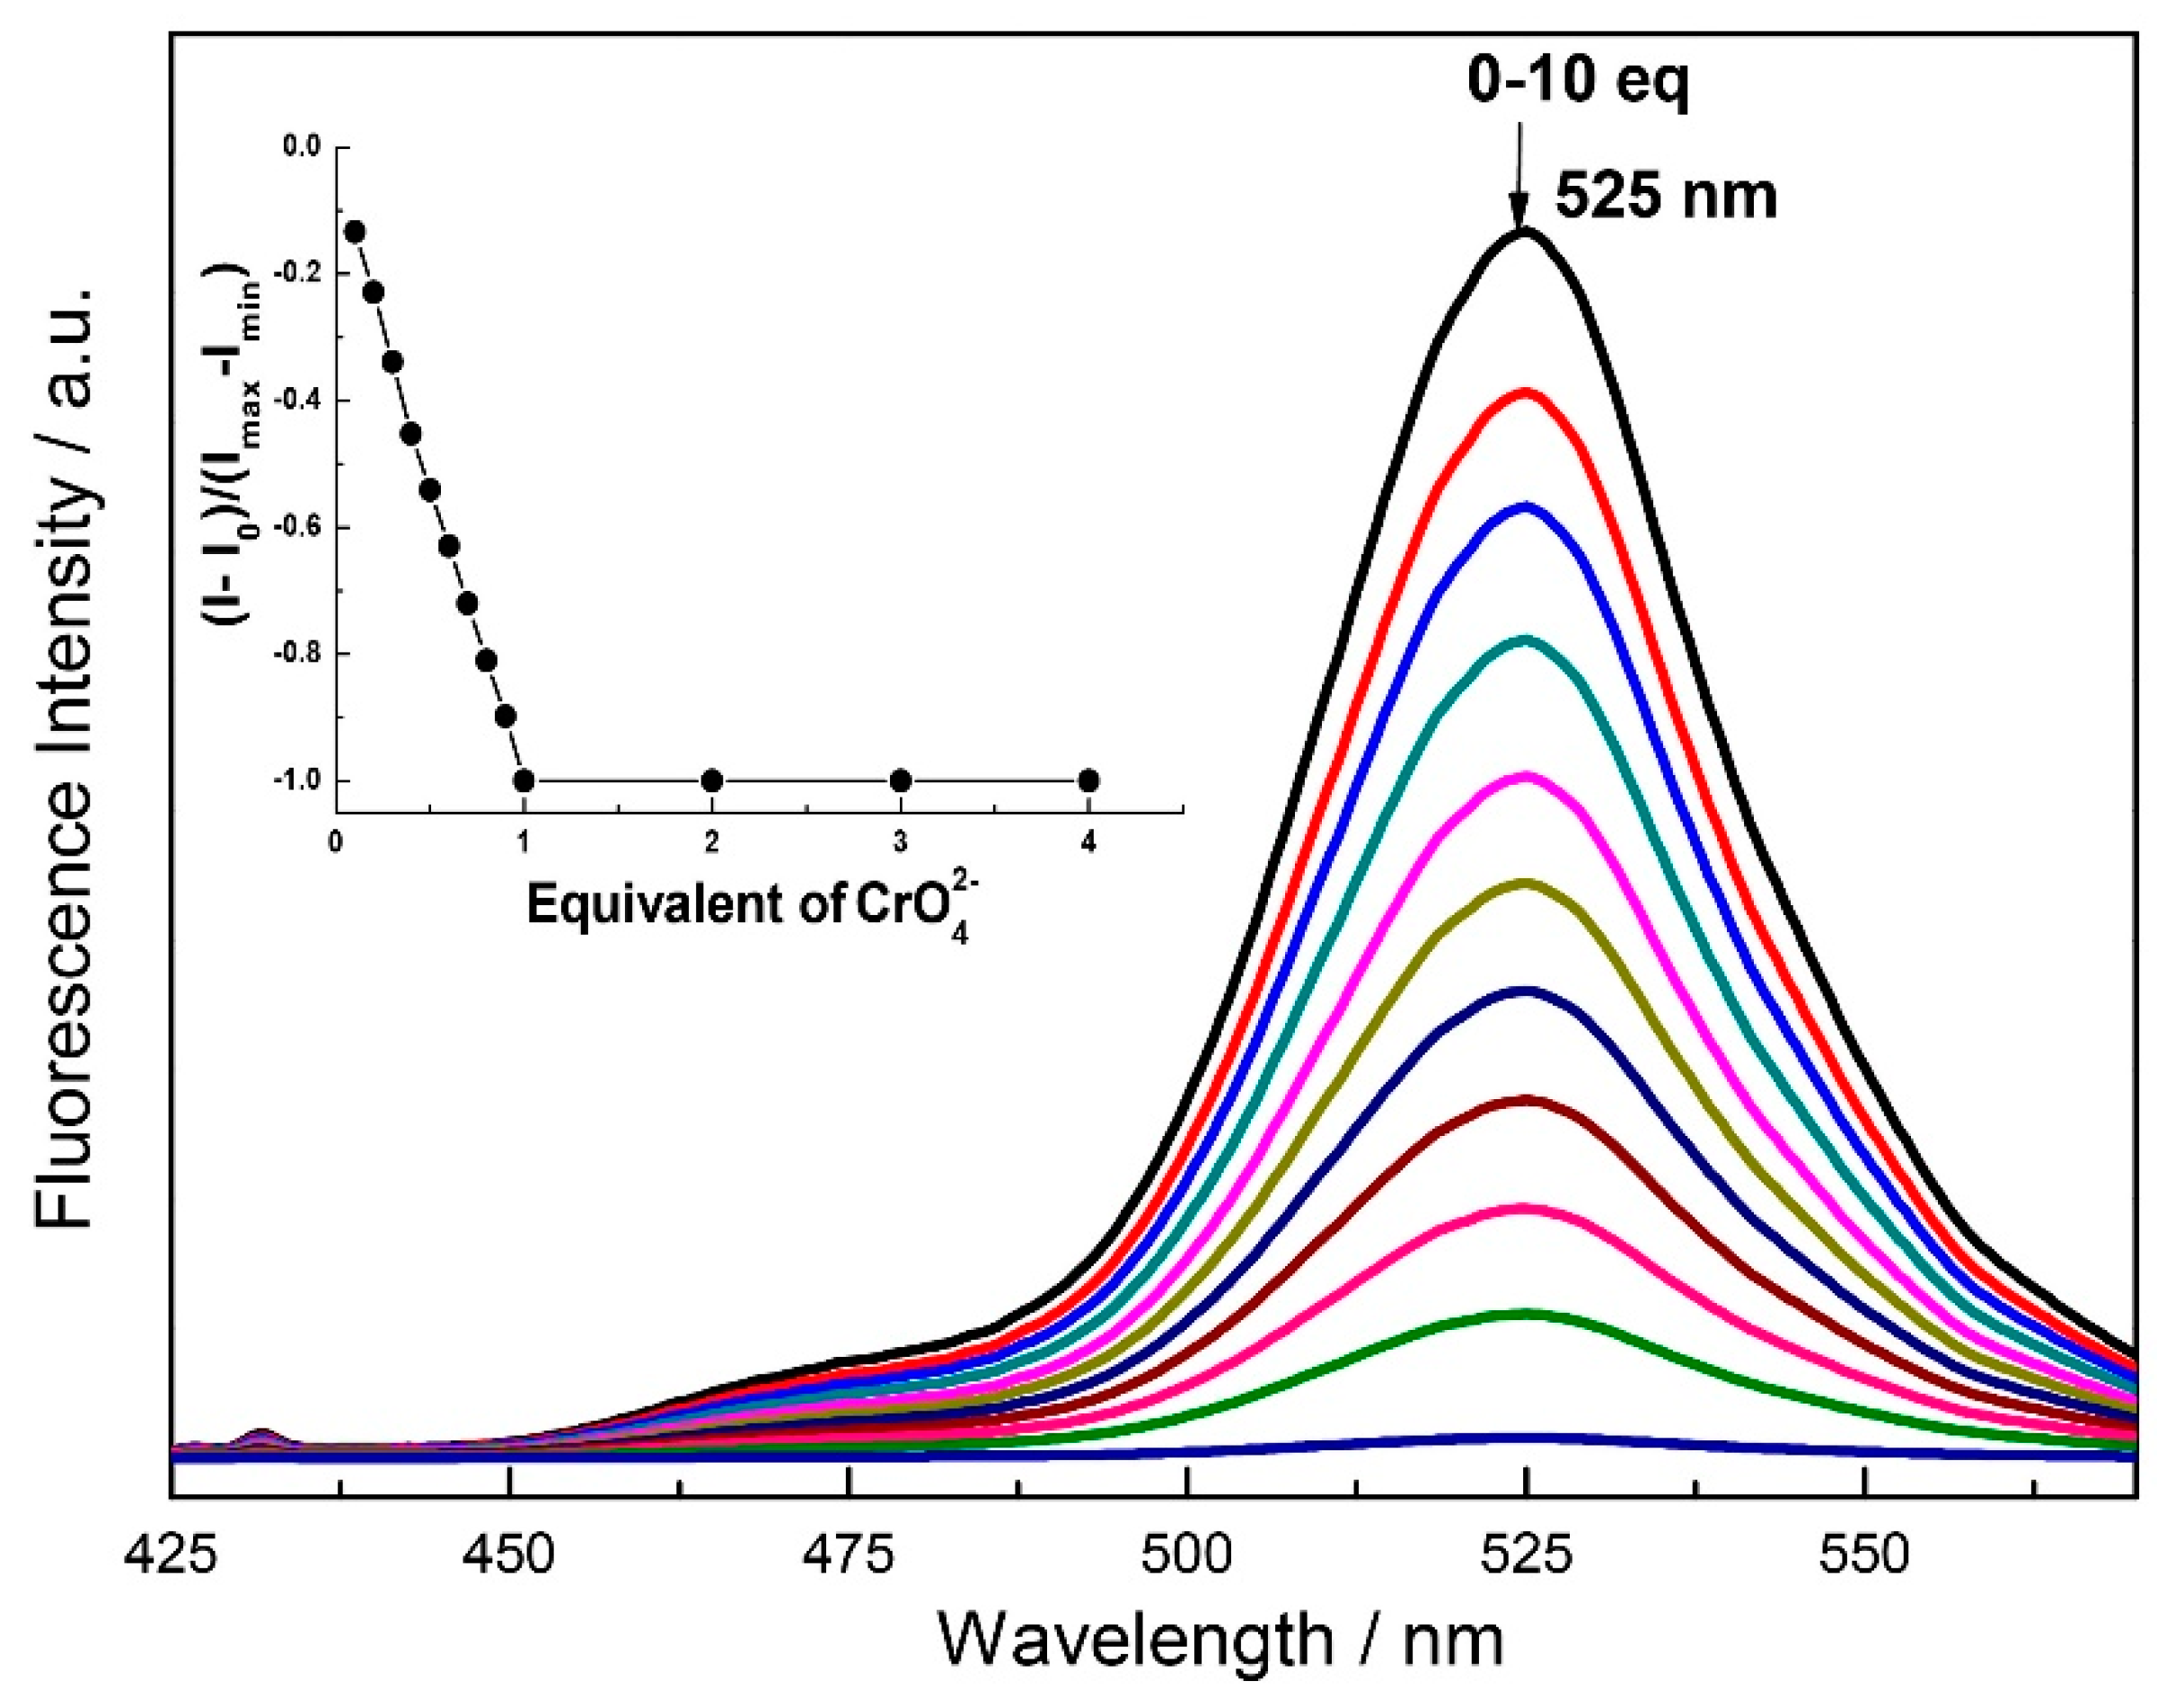
Figure 7.
Fluorescence spectra of 2 (1.0 μM) as a function of added K2Cr2O7 (10 μM) in H2O:DMF (9:1) containing HEPES buffer (10 mM, pH 7.4). (λex = 330 nm). Inset: mol ratio plot of emission at 525 nm.
Figure 7.
Fluorescence spectra of 2 (1.0 μM) as a function of added K2Cr2O7 (10 μM) in H2O:DMF (9:1) containing HEPES buffer (10 mM, pH 7.4). (λex = 330 nm). Inset: mol ratio plot of emission at 525 nm.

© 2019 by the author. Licensee MDPI, Basel, Switzerland. This article is an open access article distributed under the terms and conditions of the Creative Commons Attribution (CC BY) license (http://creativecommons.org/licenses/by/4.0/).
Share and Cite
MDPI and ACS Style
Helal, A. Sequential Detection of Palladium and Chromium Oxyanion by a Fluorescein Based Chemosensor in Mixed Aqueous Media. Chemosensors 2020, 8, 4. https://doi.org/10.3390/chemosensors8010004
AMA Style
Helal A. Sequential Detection of Palladium and Chromium Oxyanion by a Fluorescein Based Chemosensor in Mixed Aqueous Media. Chemosensors. 2020; 8(1):4. https://doi.org/10.3390/chemosensors8010004
Chicago/Turabian StyleHelal, Aasif. 2020. "Sequential Detection of Palladium and Chromium Oxyanion by a Fluorescein Based Chemosensor in Mixed Aqueous Media" Chemosensors 8, no. 1: 4. https://doi.org/10.3390/chemosensors8010004
Note that from the first issue of 2016, this journal uses article numbers instead of page numbers. See further details here.