Article

Label-Free Colorimetric Detection of Urine Glucose Based on Color Fading Using Smartphone Ambient-Light Sensor

1
School of Pharmacy, Southwest Minzu University, Chengdu 610041, China
2
School of Pharmacy, Chengdu Medical College, Chengdu 610500, China
3
Chengdu Institute of Biology, Chinese Academy of Sciences, Chengdu 610041, China
*
Authors to whom correspondence should be addressed.
Chemosensors 2020, 8(1), 10; https://doi.org/10.3390/chemosensors8010010
Submission received: 12 December 2019 / Revised: 13 January 2020 / Accepted: 20 January 2020 / Published: 27 January 2020
(This article belongs to the Collection Optical Chemosensors and Biosensors)

Abstract

:
In this work, a label-free colorimetric assay was developed for the determination of urine glucose using smartphone ambient-light sensor (ALS). Using horseradish peroxidase—hydrogen peroxide—3,3′,5,5′-tetramethylbenzidine (HRP-H2O2-TMB) colored system, quantitative H2O2 was added to samples to-be-determined for deepest color. The presence of glucose oxidase in urine led to the formation of H2O2 and the reduction of TMBred. As a result of this, the color of the urine faded and the solution changed from deep blue to light blue. We measured the illuminance of the transmitted light by a smartphone ambient light sensor, and thereby color changes were used to calculate the content of urine glucose. After method validation, this colorimetric assay was practically applied for the determination of urine samples from diabetic patients. Good linearity was obtained in the range of 0.039–10.000 mg/mL (R2 = 0.998), and a limit of detection was 0.005 mg/mL. Our method was had high accuracy, sensitivity, simplicity, rapidity, and visualization, providing a new sensor to be potentially applicable for point-of-care detection of urine glucose.

1. Introduction

Diabetes is a metabolic disease with high incidence rate in modern society, and there are globally millions of people suffering from this disease [1]. Although frequent blood-glucose monitoring can bring benefits to the health of diabetic patients [2], the disinfection process and stabbing pain during blood collection lead to very poor compliance. Besides blood glucose, the content of urine glucose is another important index for the clinical diagnosis and routine self-monitoring of the patients [3,4,5]. As urine glucose detection is non-invasive, patients’ compliance is good, and more emphasis was placed on urine glucose determination.
Colorimetric analysis is a method to determine the content of a substance to-be-measured by the color of the solution that features good stability, low cost, and implementation simplicity, making it widely applied to clinical diagnosis and detection, including in glucose analysis [3,6,7,8]. However, current liquid colorimetry primarily requires lab-based infrastructure, and its utility greatly increases the use of point-of-use deployment. Though colorimetric analysis is strongly dependent on measurement, specific equipment such as ultraviolet-visible spectrometer, fluorescence spectrometer, Raman spectrometer, or an electrochemical workstation is required for data collection. Smartphones are convenient, could be widely applied, and offer good users’ experience, making them effective instruments for on-site detection [9,10,11]. To date, most smartphone-based types of colorimetric analysis were reported using the phone’s camera for directly capturing images from samples [11,12,13,14]. For example, Xu [13] and our group [15] took photos with a smartphone camera for the quantitative detection of blood and urinary glucose through RGB image analysis. However, there are certain issues that arise when a camera is used as a detector, such as smartphone brand, focusing location, distance between camera and samples, and exogenous light pollution [10]. Ambient-light sensors have been a new smartphone part in recent years that could automatically adjust the brightness of smartphone screen according to the intensity of environmental light [16,17]. The brightness of the current smartphone display immediately changes with the intensity of external light, because the lighting sensor embedded in the smartphone responds to the integrated light intensity of a wide range of wavelengths. There was a study that showed that the ambient-light-based biosensor could be utilized without any light-source restrictions [17]. Thus, colorimetric analysis based on ambient-light sensor could effectively avoid the problems on photographs, especially focusing and taking photograph of ambient light [17,18,19].
Horseradish peroxidase—hydrogen peroxide—3,3′5,5′-tetramethylbenzidine (HRP-H2O2-TMB) is a coloring system that is commonly used in enzyme-linked immune-absorbent assay ELISA [20,21]. TMB is oxidized to blue in the presence of HRP and H2O2. We discovered the color-fading solution by excessive H2O2 color in the HRP–H2O2–TMB system and developed colorimetric detection capable of quantitative analysis with a regular smartphone. There have yet been no reports of quantitative urine sugar testing by the smartphone ambient-light sensor. Therefore, according to standard laboratory operation, we published the principle and protocol of this method that was carried out with a microplate to meet general analytic requirements and applicable universality. The change of blue and H2O2 concentration was very obvious. For this, in this work we developed a label-free colorimetric analytical method based on an HRP-H2O2-TMB coloring system using a smartphone ambient-light sensor as the data reader. First, quantitative H2O2 was added to urine to generate the deepest blue. Then, an amount of glucose oxidase (GOD) was added to generate H2O2 by glucose oxidation in the urine. The newly generated H2O2 could be faded, and the data could be read by the smartphone ambient-light sensor, realizing rapid determination of urine glucose. This proposed method has low cost, high accuracy, and offers material-free and equipment-free analysis, and a convenient, economical, and efficient detection method for diabetes.

2. Materials and Methods

2.1. Reagents

Glucose oxidase (GOD, ≥300 U/g), 3,3′5,5′-tetramethylbenzidine (TMB) and horseradish peroxidase (HRP) were purchased from Shanghai Aladdin Bio-Chem Technology Co., Ltd. (Shanghai, China). Hydrogen peroxide (H2O2), citric acid, potassium chloride (KCl), sodium chloride (NaCl), dipotassium hydrogen phosphate (K2H(PO4)3), potassium dihydrogen phosphate (KH2(PO4)3) and D−(+)-glucose were purchased from Sinopharm Chemical Reagent Co., Ltd. (Shanghai, China). The led lamp (LED) was purchased from the supermarket (Miniso, 2.4 W,10 × 19 × 35 cm).

2.2. Data Acquisition and Processing

We placed a smartphone (MIX6X, Xiaomi Technology Co. Ltd., Beijing, China) flatly onto a table and under an LED, then placed the microplate on the smartphone screen for the ambient-light-sensor target of each microplate pole to-be-determined for data reading. The vertical distance between smartphone lamp-light center and ambient-light sensor was 20 cm. Data processing was conducted with the LuxMeter application (Version 20180110).

2.3. Method Optimization

2.3.1. TMB and HRP Amount, and Reaction-Time Optimization

A 4 × 5 hole microplate was selected as the experiment platform. Then, 30 μL of TMB solution with concentrations of 1 mg/mL, 2 mg/mL, 3 mg/mL, and 4 mg/mL was added in each horizontal line, and 30 μL of HRP solutions with concentrations of 25 ng/mL, 50 ng/mL, 100 ng/mL, 200 ng/mL, and 400 ng/mL was added in each vertical line, respectively. Then 10 μL of H2O2 solution (0.75%) and 130 μL of the buffer were mixed together in each hole. After shaking slightly, we placed them until still and measured them at 1 min, 5 min, 10 min, 15 min, and 20 min respectively.

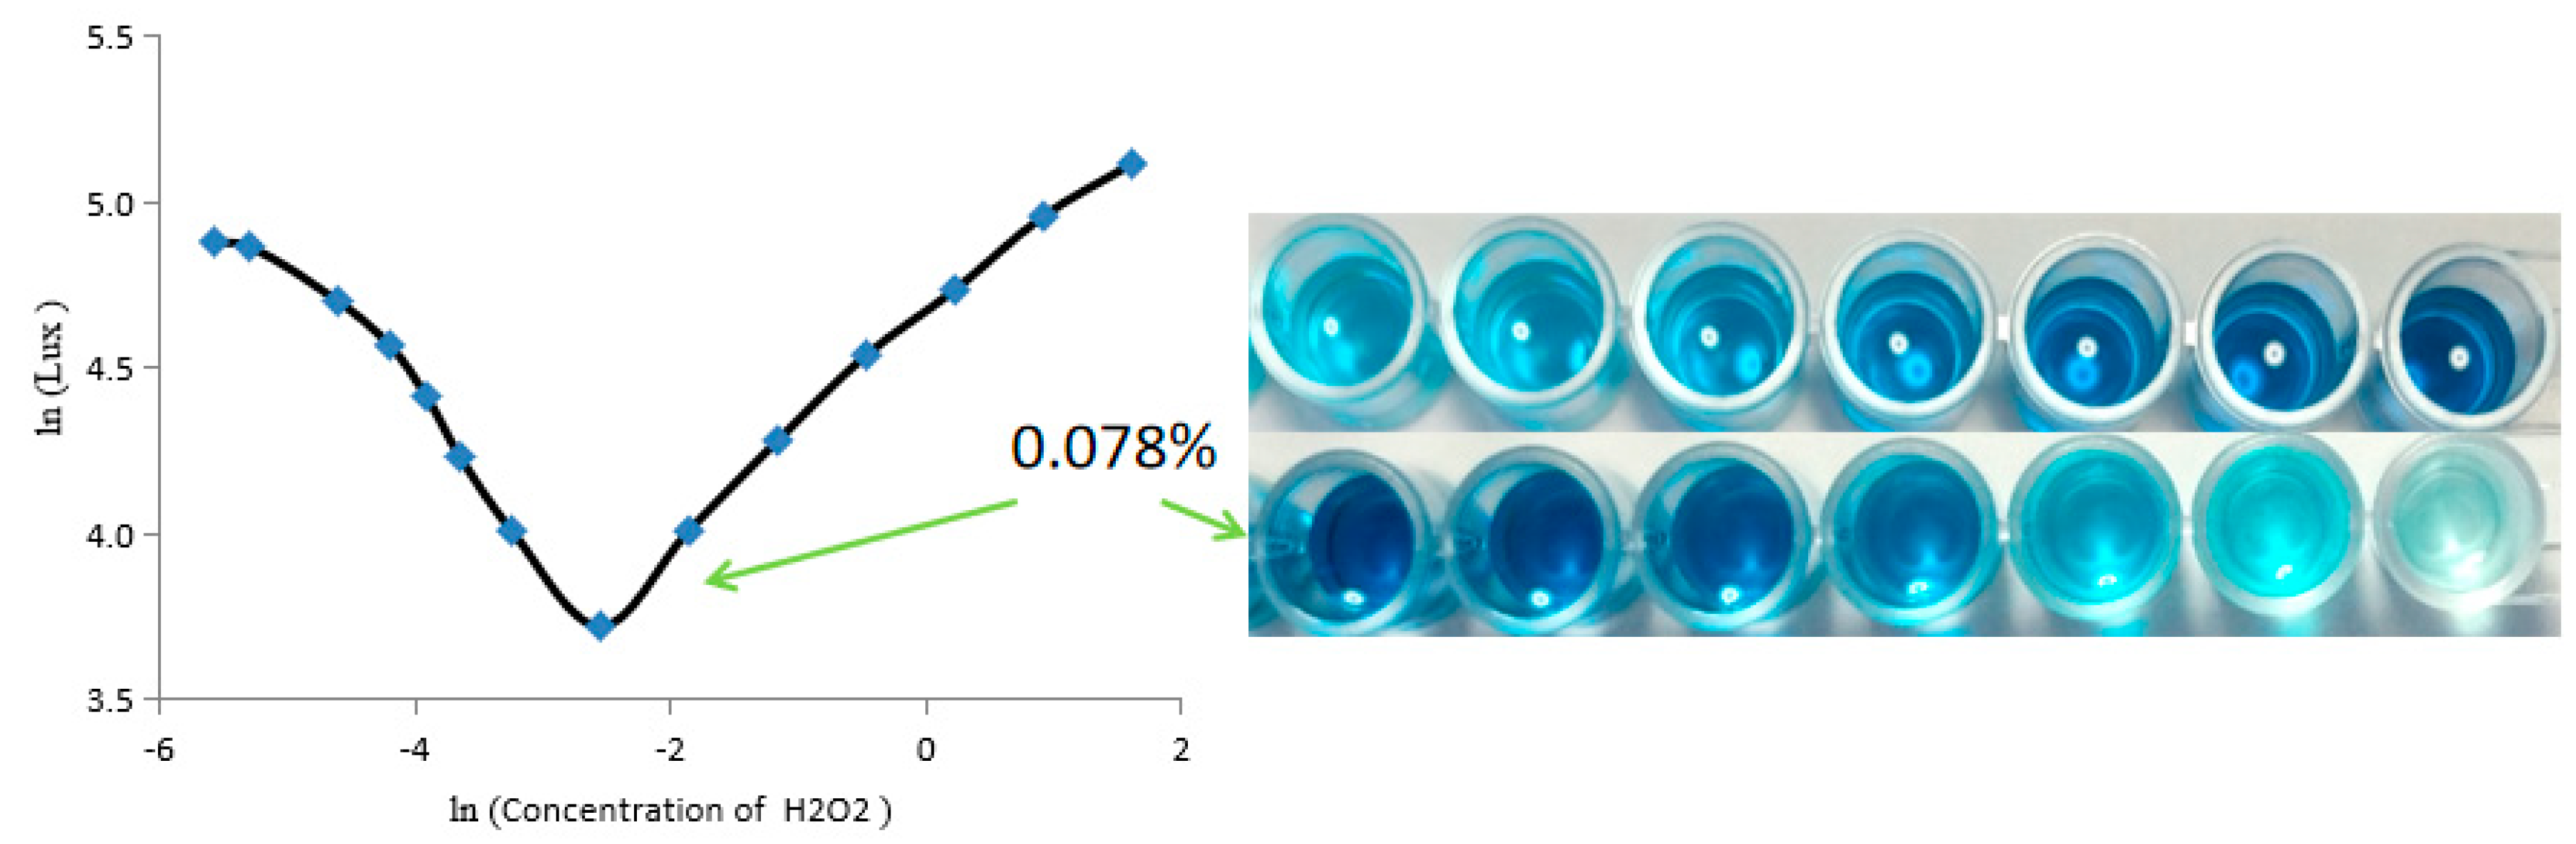
2.3.2. Additional H2O2 Quality Optimization

First, 10 μL H2O2 solution, in concentrations 0, 0.005%, 0.01%, 0.015%, 0.02%, 0.026%, 0.039%, 0.078%, 0.156%, 0.313%, 0.625%, 1.25%, 2.5%, and 5% was added into 14 microplate holes, respectively. Then 30 μL of the TMB solution (2 mg/mL), 10 μL of the HRP solution (100 ng/mL), and 130 μL of the buffer were added. After shaking slightly, we placed them until still and measured them at 10 min.

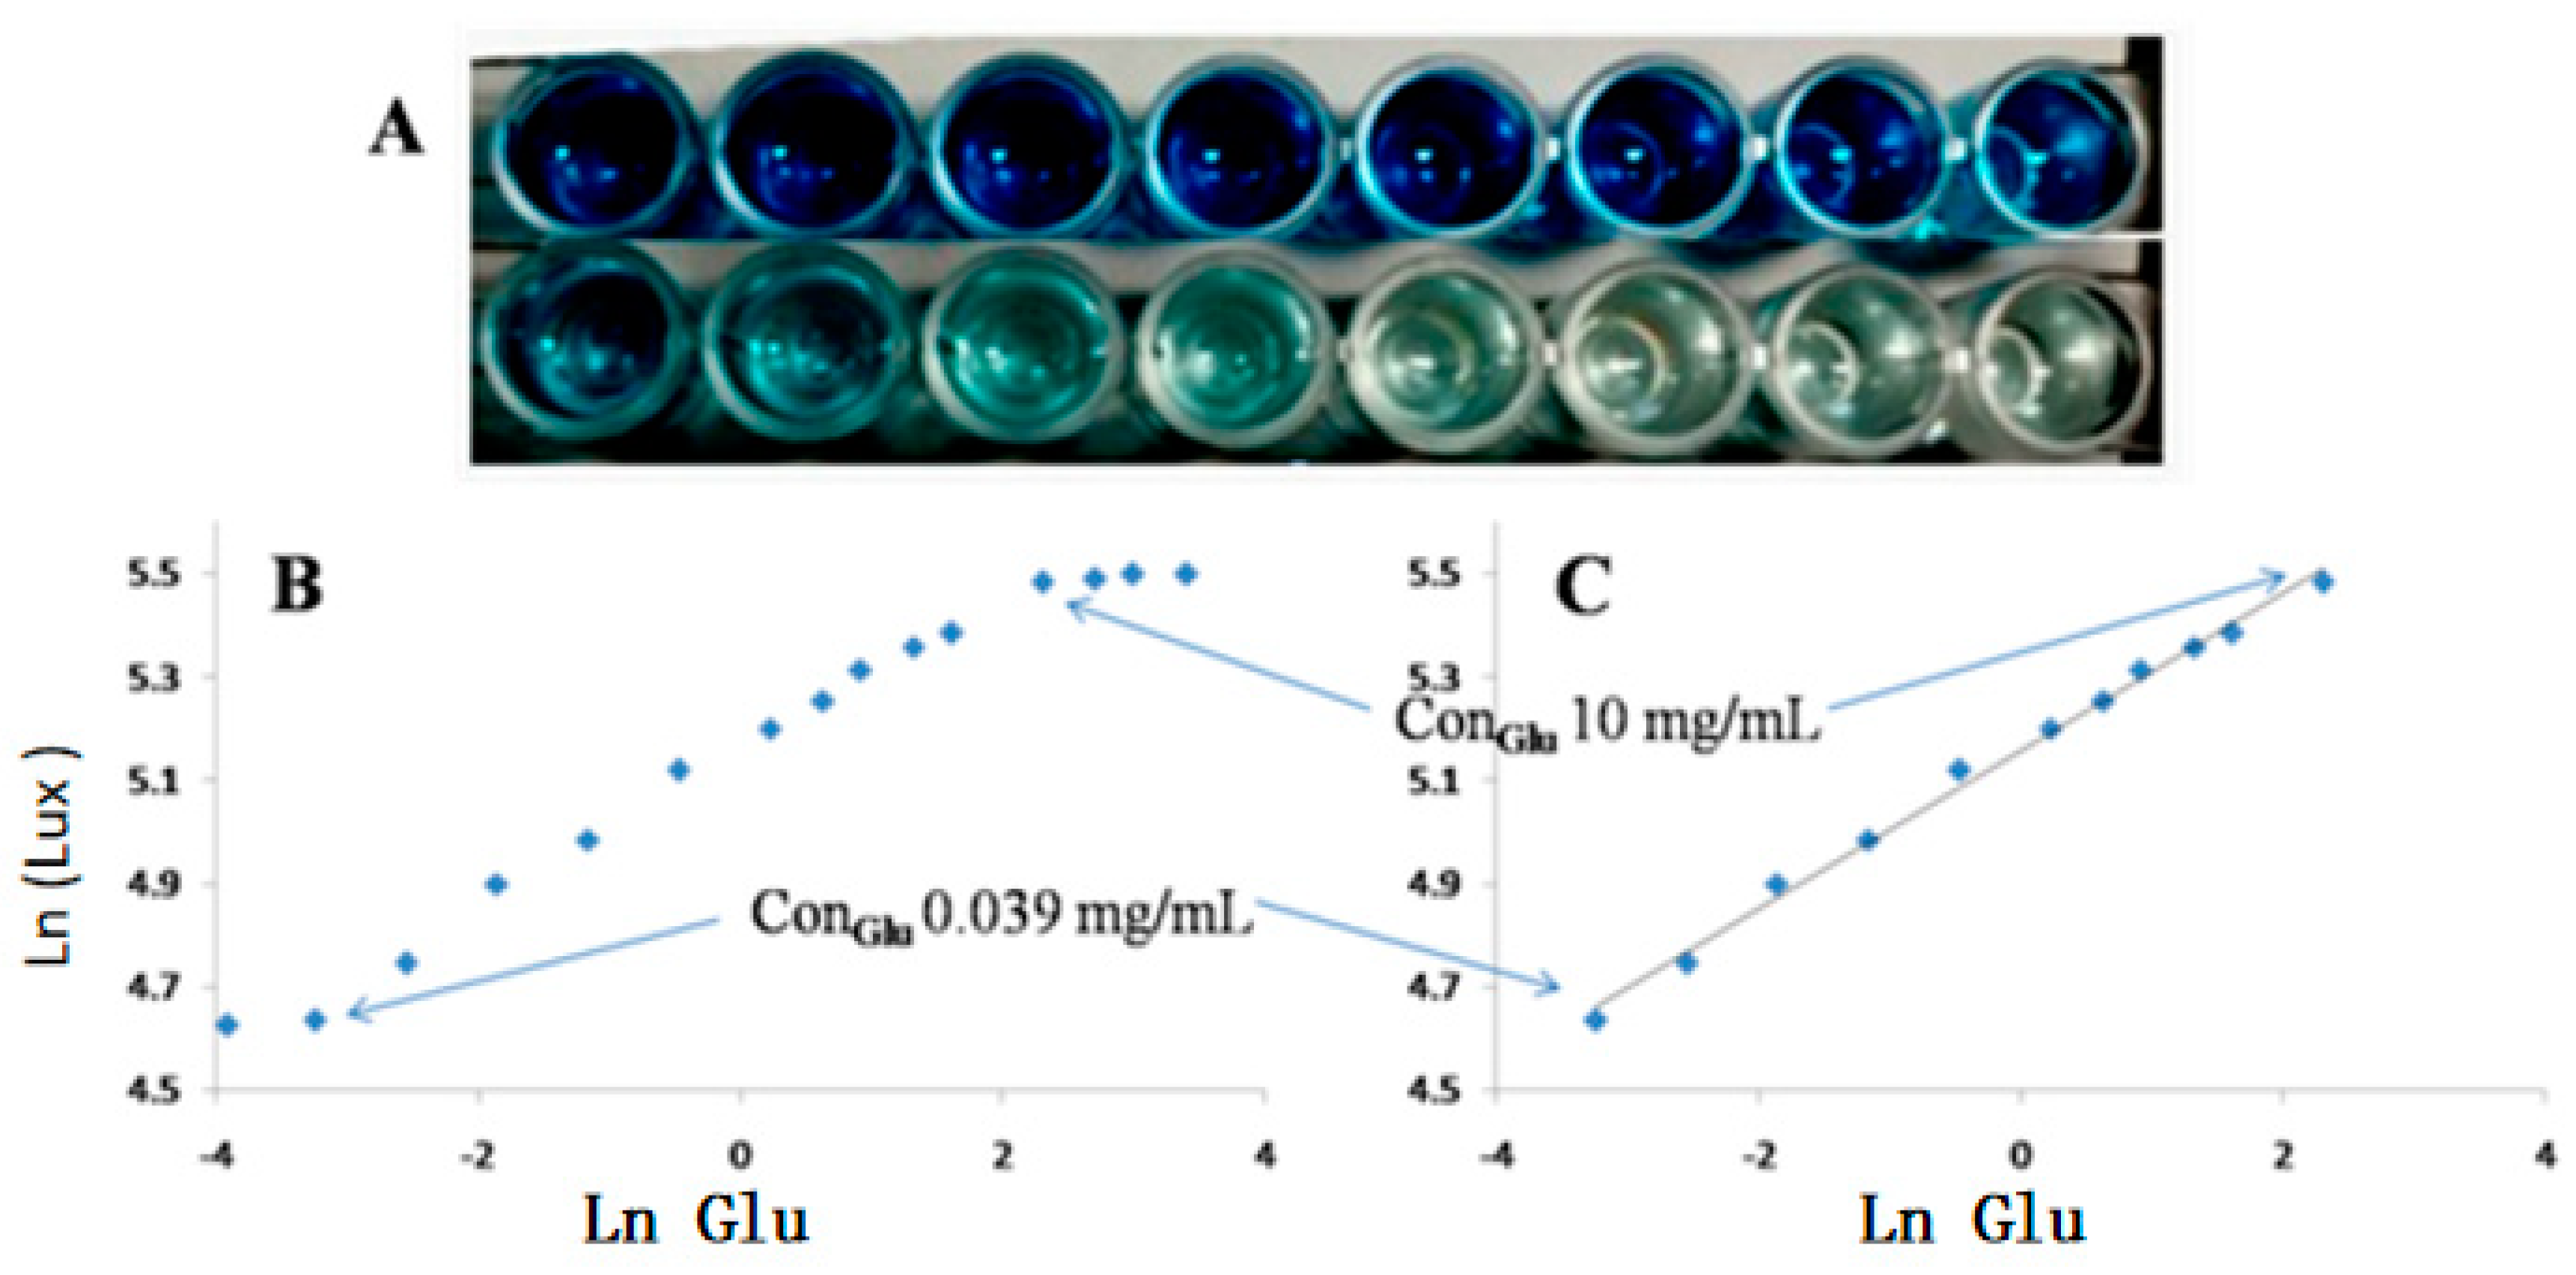
2.3.3. GOD Quality Optimization

First, 50 μL of the GOD solution, in concentrations of 1 mg/mL, 5 mg/mL, 10 mg/mL, and 15 mg/mL was added into the 4 microplate holes, respectively. Then, 30 μL of TMB solution (2 mg/mL), 10 μL of HRP solution (100 ng/mL), 10 μL of H2O2 solution (0.75%), and 130 μL of the buffer were added. After shaking slightly, we placed them until still and measured them at 10 min.

2.4. Urine Glucose Determination

We mixed together 50 μL of the urine sample, 30 μL of the TMB solution (2 mg/mL), 30 μL of the HRP solution (100 ng/mL), 10 μL of H2O2 solution (0.078%), 50 μL of GOD solution (10 mg/mL), and 130 μL of the buffer, shook slightly, placed them until still, and measured at 10 min.

2.5. Validation Procedure

Five solutions with respective concentrations of 0.039 mg/mL, 0.078 mg/mL, 0.313 mg/mL, 5.000 mg/mL, and 10.000 mg/mL were prepared by glucose standard. After the Section 2.4 procedure, the calibration curve was calculated by linear regression between response value and glucose concentration, which is defined as follows: ordinates (Ln Lux) was the intensity logarithm of transmitted light, and abscissa (Ln Glu) was the concentration logarithm. The limit of detection (LOD) was calculated by three-fold standard deviations (SD) of normal urine (blank sample). Precision was evaluated by intra- and inter-day precision, respectively. Intra- and inter-day precision was defined as the coefficient of variation (CV) by nine replicates of three standard glucose solutions (0.156 mg/mL, 1.250 mg/mL, and 5.000 mg/mL) within a day and in three days, respectively. Repeatability was evaluated through six independent determinations of a sample following Section 2.4 procedures. Recovery was evaluated by spiking 0.56 mg/mL, 0.70 mg/mL, and 0.84 mg/mL of glucose solution (equivalent to 80%, 100%, and 120% of glucose in sample) to a sample. After testing through the procedure of Section 2.4, recovery was calculated by the ratio of the detected added amounts.

3. Results and Discussion

3.1. Analysis Principle

The ambient-light sensor can automatically adjust screen brightness through sensing environmental light in which the smartphone is. Smartphone app LuxMeter is analytical software for light intensity that can measure the illuminance of the incident light. Thus, a smartphone can be used as a tool for quantitative measurement. Quantitative analysis became light-intensity analysis. The darker the solution was, the weaker the transmitted light intensity; and vice versa. In the present study, as there was correlation between glucose content in the sample solution and light intensity acquired by the smartphone, the transformation of solution color to light intensity could be the basis for quantitative calculation. Through analysis of 16 glucose solutions with different concentrations (0.000 mg/mL, 0.002 mg/mL, 0.039 mg/mL, 0.078 mg/mL, 0.156 mg/mL, 0.313 mg/mL, 0.625 mg/mL, 1.250 mg/mL, 1.880 mg/mL, 2.500 mg/mL, 3.750 mg/mL, 5.000 mg/mL,10.000 mg/mL,15.00 mg/mL, 20.000 mg/mL, and 30.000 mg/mL), it was revealed that glucose content was inversely correlated with solution color, which is shown in Figure 1A. By further analyzing the glucose concentration within a certain range and its corresponding intensity of transmission light, the functional relations between them could apply to achieve quantitative analysis. The relationship graphs between the logarithm of transmitted light intensity (Ln Lux) and logarithm of glucose concentration (Ln Glu) are shown in Figure 1. When glucose concentration was in the range of 0–30 mg/mL, LnLux is positively correlated with LnGlu, but there was no linear relationship between LnLux and LnGlu (Figure 1B), which can only be used for qualitative analysis. While when glucose concentration was in the range of 0.039–10 mg/mL, LnLux and LnGlu have good linearity (Figure 1C) and can be used for quantitative analysis.
Hydrogen peroxide (H2O2) was generated by the oxidation of glucose in the urine sample under glucose oxidase (GOD) catalysis. Then, the white 3,3′,5,5′-tetramethylbenzidine (TMBred) was oxidized by horseradish peroxidase (HRP) to its blue oxidized product (TMBox) with the participation of H2O2 [22]. Since H2O2 was also the enzyme inhibitor of HRP [23], it could be observed that, with the concentration increase of H2O2, the blue color of the solution first deepened, then lightened, until it was finally colorless. The color-fading stage was a continuous and gradual process with a long concentration range of H2O2. With the help of this phenomenon, not only could the qualitative analysis be visualized, but quantitative analysis can also be carried out by using the smartphone. In the present study, quantitative H2O2 was first added to urine to generate the deepest blue. Then, an amount of GOD was added to generate H2O2 by glucose oxidation in the urine. The newly generated H2O2 could shallow the solution color, and we finally used the smartphone ambient-light sensor for data reading, thus realizing the rapid determination of urine glucose. The above procedure is shown in Figure 2.

3.2. Optimized-Experiment Results

3.2.1. TMB and HRP Amount, and Reaction Time

The white TMBred was oxidized by HRP to its blue oxidized product (TMBox) with H2O2 participation. Results showed that the amount of TMB had little effect on coloration. However, HRP content was a key factor that had a negative correlation with coloration. After optimization, HRP and TMB concentrations were set to 100 ng/mL and 2 mg/mL, respectively. As for the choice of best reaction time, the solution color was very unstable in 5 min, solution color was almost stable in 10 min. Therefore, the preferred test point was set at 10 min.

3.2.2. Optimized Results of Additional H2O2 Amount

The key parameter of this work was the H2O2 amount. By investigating 14 batches of H2O2 solutions with different concentration level (0–5%), as shown in Figure 3 (top), with the concentration increase of H2O2, the blue of the solution first deepened, then lightened, until it was finally colorless. The color-fading stage was a continuous and gradual process with a long concentration range of H2O2. In addition, by plotting the curve between the logarithm of transmitted light intensity (Ln Lux) and the logarithm of H2O2 concentration, as shown in Figure 3 (right), the inflection point of concentration was 0.078%, which was in accordance with the visual observation shown in Figure 3 (left). Therefore, the concentration of added H2O2 was set to 0.078%.

3.3. Method Validation

Here, we described that when glucose concentration is in the range of 0.039–10 mg/mL, the logarithm of glucose concentration (lnGlu) and the logarithm of light intensity (lnLux) had good linearity (Figure 1C) and could be used for quantitative analysis. The linear-calibration curve was established as y = 0.0804x + 4.9127 (0.039–10 mg/mL) with good correlation (R2 = 0.998). LOD was determined as 0.005 mg/mL. Intra- and inter-day precision CVs were 1.63%~3.12% and 1.57%~3.62%, respectively, indicating that the method had good precision. Repeatability was evaluated with six replicates as previously described, which was 0.70 ± 0.02 mg/mL with a CV of 4.7%. Recovery was evaluated by spiking three levels of glucose (0.56 mg/mL, 0.70 mg/mL, and 0.84 mg/mL) into the urine sample, respectively. By calculating the ratio of the detected added amounts, mean recoveries were 93.33% ± 2.97%, 93.81% ± 2.18%, and 95.28% ± 6.23%, indicating good recovery. By the above method validation, it was revealed that the established analytical method met the requirements of quantitative analysis and could be used for glucose determination in urine samples. The comparison between the proposed method and an existing method for glucose determination, as shown in Table 1.

3.4. Glucose Determination in Urine Samples

The glucose content in urine samples of four diabetic patients was determined by the present method. Results were 0.14 ± 0.02, 0.70 ± 0.03, 0.25 ± 0.02, and 0.31 ± 0.02 mg/mL, respectively.

4. Conclusions

In this study, we developed a label-free colorimetric assay using a smartphone ambient-light sensor that could directly determine the urine glucose at the point-of-care. Glucose sensing for diabetes monitoring applied by smartphone was reported, but without ambient- light- sensor analysis. These tests can only be used in daily practice as a rough screening test. H2O2 is an inhibitor of HRP, so in HRP-H2O2-TMB system, excessive and quantitative H2O2 was added in advance, and the color of the solution changed gradually in different glucose levels. This can help realize the qualitative analysis for urine glucose level in diabetic patients via the smartphone ambient-light sensor. After methodological validation, our method had wide linear range, good repeatability, and high accuracy, making it simple and convenient for the routine monitoring of urine glucose.

Author Contributions

Conceptualization, Z.-F.Z.; data curation, K.G. and X.-D.L.; formal analysis, T.-T.W.; funding acquisition, T.-T.W.; investigation, X.-M.H.; project administration, Z.-F.Z. and J.X.; supervision, Z.-F.Z. and J.X.; validation, J.L.; writing—original draft, Z.-F.Z.; writing—review and editing, J.X. All authors have read and agreed to the published version of the manuscript.

Funding

This work was supported by The National Key Technology R & D Program (NO. 2019YFC1712503), Innovative Research Program for Graduates of Southwest Minzu University (No. CX2019SZ177), and Health Commission of Sichuan Province, China (No. 18PJ549).

Conflicts of Interest

The authors declare no conflict of interest.

References

  1. Cho, N.H.; Shaw, J.E.; Karuranga, S.; Huang, Y.; da Rocha Fernandes, J.D.; Ohlrogge, A.W.; Malanda, B. IDF Diabetes Atlas: Global estimates of diabetes prevalence for 2017 and projections for 2045. Diabetes Res. Clin. Pract. 2018, 138, 271–281. [Google Scholar] [CrossRef]
  2. Clarke, S.F.; Foster, J.R. A history of blood glucose meters and their role in self-monitoring of diabetes mellitus. Br. J. Biomed. Sci. 2012, 69, 83–93. [Google Scholar] [CrossRef]
  3. Karim, M.N.; Anderson, S.R.; Singh, S.; Ramanathan, R.; Bansal, V. Nanostructured silver fabric as a free-standing NanoZyme for colorimetric detection of glucose in urine. Biosens. Bioelectron. 2018, 110, 8–15. [Google Scholar] [CrossRef]
  4. Van Enter, B.J.; von Hauff, E. Challenges and perspectives in continuous glucose monitoring. Chem. Commun. 2018, 54, 5032–5045. [Google Scholar] [CrossRef]
  5. Wang, Q.-L.; Xie, J.; Liang, J.; Dong, G.-T.; Ding, L.-S.; Luo, P.; Qing, L.-S. Competitive Protein Binding Assay of Naproxen by Human Serum Albumin Functionalized Silicon Dioxide Nanoparticles. Molecules 2019, 24, 2593. [Google Scholar] [CrossRef] [Green Version]
  6. Su, L.; Feng, J.; Zhou, X.; Ren, C.; Li, H.; Chen, X. Colorimetric Detection of Urine Glucose Based ZnFe2O4 Magnetic Nanoparticles. Anal. Chem. 2012, 84, 5753–5758. [Google Scholar] [CrossRef]
  7. Huang, P.-H.; Hong, C.P.; Zhu, J.F.; Chen, T.-T.; Chan, C.-T.; Ko, Y.-C.; Lin, T.-L.; Pan, Z.-B.; Sun, N.-K.; Wang, Y.-C.; et al. Ag@Au nanoprism-metal organic framework-based paper for extending the glucose sensing range in human serum and urine. Dalton Trans. 2017, 46, 6985–6993. [Google Scholar] [CrossRef] [PubMed]
  8. Liang, M.; Ren, Y.; Zhang, H.; Ma, Y.; Niu, X.; Chen, X. One-step synthesis of nitrogen, boron co-doped fluorescent carbon nanoparticles for glucose detection. Luminescence 2017, 32, 1031–1038. [Google Scholar] [CrossRef] [PubMed]
  9. Vashist, S.K.; Luong, J.H.T. Commercially Available Smartphone-Based Personalized Mobile Healthcare Technologies. In Point-of-Care Technologies Enabling Next-Generation Healthcare Monitoring and Management; Springer International Publishing: Cham, Switzerland, 2019; Volume 10, pp. 81–115. [Google Scholar]
  10. Kanchi, S.; Sabela, M.I.; Mdluli, P.S.; Inamuddin; Bisetty, K. Smartphone based bioanalytical and diagnosis applications: A review. Biosens. Bioelectron. 2018, 102, 136–149. [Google Scholar] [CrossRef] [PubMed]
  11. Wang, Q.-L.; Huang, W.-X.; Zhang, P.-J.; Chen, L.; Lio, C.-K.; Zhou, H.; Qing, L.-S.; Luo, P. Colorimetric determination of the early biomarker hypoxia-inducible factor-1 alpha (HIF-1α) in circulating exosomes by using a gold seed-coated with aptamer-functionalized Au@Au core-shell peroxidase mimic. Microchim. Acta 2020, 187, 61. [Google Scholar] [CrossRef]
  12. Nguyen, T.T.; Vandevoorde, K.; Wouters, N.; Kayacan, E.; De Baerdemaeker, J.G.; Saeys, W. Detection of red and bicoloured apples on tree with an RGB-D camera. Biosyst. Eng. 2016, 146, 33–44. [Google Scholar] [CrossRef]
  13. Wang, X.; Li, F.; Cai, Z.; Liu, K.; Li, J.; Zhang, B.; He, J. Sensitive colorimetric assay for uric acid and glucose detection based on multilayer-modified paper with smartphone as signal readout. Anal. Bioanal. Chem. 2018, 410, 2647–2655. [Google Scholar] [CrossRef] [PubMed]
  14. Yang, X.; Wang, Y.; Liu, W.; Zhang, Y.; Zheng, F.; Wang, S.; Zhang, D.; Wang, J. A portable system for on-site quantification of formaldehyde in air based on G-quadruplex halves coupled with A smartphone reader. Biosens. Bioelectron. 2016, 75, 48–54. [Google Scholar] [CrossRef] [PubMed]
  15. Wang, T.-T.; Lio, C.k.; Huang, H.; Wang, R.-Y.; Zhou, H.; Luo, P.; Qing, L.-S. A feasible image-based colorimetric assay using a smartphone RGB camera for point-of-care monitoring of diabetes. Talanta 2020, 206, 120211. [Google Scholar] [CrossRef]
  16. Dutta, S. Point of care sensing and biosensing using ambient light sensor of smartphone: Critical review. TrAC Trends Anal. Chem. 2019, 110, 393–400. [Google Scholar] [CrossRef]
  17. Park, Y.M.; Han, Y.D.; Chun, H.J.; Yoon, H.C. Ambient light-based optical biosensing platform with smartphone-embedded illumination sensor. Biosens. Bioelectron. 2017, 93, 205–211. [Google Scholar] [CrossRef]
  18. Chen, Y.; Fu, Q.; Li, D.; Xie, J.; Ke, D.; Song, Q.; Tang, Y.; Wang, H. A smartphone colorimetric reader integrated with an ambient light sensor and a 3D printed attachment for on-site detection of zearalenone. Anal. Bioanal. Chem. 2017, 409, 6567–6574. [Google Scholar] [CrossRef]
  19. Fu, Q.; Wu, Z.; Li, X.; Yao, C.; Yu, S.; Xiao, W.; Tang, Y. Novel versatile smart phone based Microplate readers for on-site diagnoses. Biosens. Bioelectron. 2016, 81, 524–531. [Google Scholar] [CrossRef] [Green Version]
  20. Wang, Q.-L.; Li, J.; Li, X.-D.; Ding, L.-S.; Xie, J.; Qing, L.-S. A simple nano-SiO2-based ELISA method for residue detection of 2,4-dichlorophenoxyacetic acid in bean sprouts. Food Anal. Methods 2017, 10, 1500–1506. [Google Scholar] [CrossRef]
  21. Wang, Q.-L.; Li, J.; Li, X.-D.; Tao, W.-J.; Ding, L.-S.; Luo, P.; Qing, L.-S. An efficient direct competitive nano-ELISA for residual BSA determination in vaccines. Anal. Bioanal. Chem. 2017, 409, 4607–4614. [Google Scholar] [CrossRef]
  22. Wang, Q.-L.; Xie, J.; Li, X.-D.; Ding, L.-S.; Liang, J.; Luo, P.; Qing, L.-S. Development of a nano-SiO2 based enzyme-linked ligand binding assay for the determination of ibuprofen in human urine. Talanta 2017, 167, 617–622. [Google Scholar] [CrossRef] [PubMed]
  23. Arnao, M.B.; Acosta, M.; Rio, J.A.D.; Varón, R.; García-Cánovas, F. A kinetic study on the suicide inactivation of peroxidase by hydrogen peroxide. Biochim. Biophys. Acta 1990, 1041, 43–47. [Google Scholar] [CrossRef]
  24. Hossain, M.F.; Park, J.Y. Plain to point network reduced graphene oxide - activated carbon composites decorated with platinum nanoparticles for urine glucose detection. Sci. Rep. 2016, 6, 21009. [Google Scholar] [CrossRef] [PubMed] [Green Version]
  25. Pan, Z.B.; Wang, Y.C.; Chakkaradhari, G.; Zhu, J.F.; He, R.Y.; Liu, Y.C.; Hsu, C.H.; Koshevoy, I.O.; Chou, P.T.; Pan, S.W. A silver metal complex as a luminescent probe for enzymatic sensing of glucose in blood plasma and urine. Dalton Transactions 2018, 10, 1039. [Google Scholar] [CrossRef] [PubMed] [Green Version]
  26. Gabriel, E.F.M.; Garcia, P.T.; Cardoso, T.M.G.; Lopes, F.M.; Martins, F.T.; Coltro, W.K.T. Highly sensitive colorimetric detection of glucose and uric acid in biological fluids using chitosan-modified paper microfluidic devices. The Analyst 2016, 141, 4749. [Google Scholar] [CrossRef] [PubMed]
  27. Ciucu, A.A. Chemically Modified Electrodes in Biosensing. J. Biosen. Bioelectron. 2014, 5, 1000154. [Google Scholar]
Figure 1. Different colors (A) of glucose solutions with different concentrations; linear relationship between LnLux and LnGlu (B,C); From figure C, we can see that LnLux and LnGlu have a good linearity and can be used for quantitative analysis in the range of 0.039–10 mg/mL.
Chemosensors 08 00010 g001
Figure 2. Illustration of the proposed analytical procedure.
Chemosensors 08 00010 g002
Figure 3. Qualitative observation (right) and quantitative curve (left) of the relationship between the H2O2 concentration and light intensity.
Chemosensors 08 00010 g003
Table 1. Comparison of the analytical methods for glucose detection.
AnalyteProbeDetection MethodLinear Response RangeLODReference
GlucoseGRGO/AC aCyclic voltammetry method0.002–10 mM2 μM[24]
Ag@Au-Ir-Zne MOFs bPhosphorescence intensity0.05–30.0 mM0.038 mM[7]
Ag3 Phosphorescence intensity 1.0–35 mM0.09 mM[25]
NB-CNPs cFluorescence quenching0–900 μM1.8 μM[8]
ZnFe2O4 MNPs dColorimetric detection1.25–18.75 μM0.3 μM[6]
µPADs with chitosan eColorimetric detection130–380 µM.27 μM[26]
GR-CNT-ZnO fElectrochemistry-4.5 μM[27]
-Phone ALS detection g0.2–55.6 μM0.03 μMThis work
GRGO/AC a Plain to point network reduced graphene oxide—activated carbon composites decorated with platinum nanoparticles; Ag@Au–Ir–Zne MOFs b g@Au nanoprism-metal–organic frameworks (MOFs); NB-CNPs c boron co-doped carbon nanoparticles; ZnFe2O4 MNPs d ZnFe2O4 magnetic nanoparticles; µPADs e microfluidic paper-based analytical devices; GR-CNT-ZnO f graphene–carbon nanotubes–zinc oxide nanoparticles hybrid; ALS g ambient light sensor.

