
The Role of Surface Enhanced Raman Scattering for Therapeutic Drug Monitoring of Antimicrobial Agents


1
Raman Spectroscopy Lab, Department of Engineering and Architecture, University of Trieste, 34127 Trieste, Italy
2
Leibniz Institute of Photonic Technology, Member of the Research Alliance “Leibniz Health Technologies”, Albert-Einstein-Str. 9, 07745 Jena, Germany
3
Institute of Physical Chemistry and Abbe Center of Photonics, Friedrich Schiller University, Helmholtzweg 4, 07743 Jena, Germany
4
Faculty of Health Sciences, University of Macau, Macau 999078, China
*
Authors to whom correspondence should be addressed.
Chemosensors 2022, 10(4), 128; https://doi.org/10.3390/chemosensors10040128
Submission received: 14 February 2022
/
Revised: 25 March 2022
/
Accepted: 26 March 2022
/
Published: 29 March 2022
(This article belongs to the Special Issue SERS: Analytical and Biological Challenges)
Abstract
:The rapid quantification of antimicrobial agents is important for therapeutic drug monitoring (TDM), enabling personalized dosing schemes in critically ill patients. Highly sophisticated TDM technology is becoming available, but its implementation in hospitals is still limited. Among the various proposed techniques, surface-enhanced Raman scattering (SERS) stands out as one of the more interesting due to its extremely high sensitivity, rapidity, and fingerprinting capabilities. Here, we present a comprehensive review of various SERS-based novel approaches applied for direct and indirect detection and quantification of antibiotic, antifungal, and antituberculosis drugs in different matrices, particularly focusing on the challenges for successful exploitation of this technique in the development of assays for point-of-care tests.
1. Introduction
Severe infections are the most common cause of admission to intensive care units (ICUs), and a leading cause of death, affecting up to 1% of the global population annually, with increasing incidence and prevalence [1]. The incidence in Europe was reported as high as 270 new cases per 100,000 people for 2017, while more than 10 million people per year die from infection worldwide [2].
The emergence and spread of multidrug-resistant (MDR) pathogens that have acquired new resistance mechanisms, such as carbapenemase-producing enterobacteria or Acinetobacter spp., have made the treatment of infections in ICU patients increasingly challenging. At the same time, despite available guidelines, failure of antimicrobial treatment may also occur in ICU patients due to altered pharmacokinetic and pharmacodynamic properties of antimicrobial agents [3]. There is extensive evidence of sub-therapeutic exposure in critically ill patients from standard doses across different antimicrobials including aminoglycosides [4], beta-lactams [5], fluoroquinolones [6], glycopeptides [7], and azoles [8]. This can be a direct consequence of pharmacokinetic alterations coming from the complex pathophysiologic processes accompanying severe infection, including sepsis, shock, and organ failure [9].
To stop the growing number of MDR infections and reduce antimicrobial resistance (AMR), the World Health Organization approved a global action plan in 2017 [10]. Among the proposed solutions to maximize the success of antimicrobial therapy is the optimization of antibiotics use with the implementation of therapeutic drug monitoring (TDM) with the use of mathematical models to obtain a personalized dosing [11].
The basic principle of TDM is that the effects of a drug better correlate with circulating concentrations than with administered doses. Therefore, TDM involves the quantification of drug concentrations in blood, or in other biological fluids that can be linked to blood concentrations, to improve patient treatment outcome while minimizing the adverse effects inherent in the treatment. The measured drug concentration is thus used to adjust the drug dosing regimen by targeting a predefined concentration or exposure interval, called a therapeutic range. Ideally, individualized dosing strategies should account for individual pharmacokinetic (PK) changes and pathogen susceptibility [12].
Regarding the management of severe infections in ICU, the level of evidence of the benefits associated with the TDM of several antimicrobial agents is strong, with increasing interest [7,9]. TDM was traditionally adopted in clinical routine to prevent adverse toxicity effects, mainly for glycopeptides (vancomycin) and aminoglycosides (gentamycin, amikacin, and tobramycin) [3]. These antibiotics have a narrow therapeutic index, meaning that the window for either safety or toxicity is exceptionally small, and therapeutic ranges of blood concentrations have been defined. More recently, TDM of antimicrobial drugs slowly rose in broader use to guard against clinically inadequate concentrations and minimize the risk of the development of resistance, embracing diverse antibiotic classes including beta-lactams [13], antituberculosis [14], and antifungal drugs [8].
To adequately implement TDM, a range of bioanalytical techniques, such as immunoassays and single or mass-coupled chromatographic methods, are available. However, many of these methods are expensive with long turnaround times requiring specialized laboratories and trained personnel, thus limiting their use in hospitals in most underdeveloped countries. In this context, new advances in sensing technologies offer a huge opportunity to overcome these limitations. In recent years, surface enhanced Raman scattering (SERS) spectroscopy has grown dramatically with the development of nanosensors with engineered surface properties. SERS is a phenomenon associated with the amplification of the Raman signals of analytes located near the surface of nanostructured metallic substrates [15]. The growing availability of reliable commercial SERS substrates, coupled with relatively cheap portable Raman spectrometers, is helping SERS to emerge as a new innovative solution for the measurement of drugs in body fluids (especially in plasma, serum, and urine) [16,17,18,19], offering a high specific, sensitive, and low-cost technology that can be potentially brought to the patient’s bedside and easily operated by doctors or health personnel.
In this review, after illustrating the peculiarities of TDM of antimicrobials, we summarize current trends in the use of SERS for the quantification of antibiotic, antifungal, and antituberculosis drugs in different matrices. We particularly focused on the challenges for successful exploitation of this technique in the development of assays for TDM, including synthesis and use of various forms of nanostructures as SERS substrates, the coupling with recognition strategies such as molecularly imprinted polymers or monoclonal antibodies, as well as the use of chemometrics and machine learning. A secondary objective of this review is to highlight some antimicrobial agents that would greatly benefit from SERS-based methods that could be carried out at the point of care.
2. Therapeutic Drug Monitoring of Antimicrobial Agents
TDM of antimicrobials can be figured as a dynamic three-step process: (a) quantification of drug concentration in plasma (or other biofluids), (b) interpretation of the results, and (c) dosage adaptation, if needed.
First of all, the reliability of the entire process is strongly related to the specificity and sensitivity of the employed method of analysis. As with any test in a highly regulated environment, such as hospitals, these methods should ideally be fast, fit-for-purpose, accurate, precise, selective, stable, and sensitive [20]. There are, however, also other requirements with respect to antimicrobial measurements. One problem is the very short half-life of antibiotics, which is usually due to either their degradation after sampling and/or their inherent chemical instability. Therefore, the preanalytical phase (sample preparation) should be reliable and as easy as possible, but also unaffecting drugs with such low stabilities. Results should be available promptly, since turnaround times higher than 24 h should not be considered adequate for ICU requirements [12].
TDM measurements must be performed at the pharmacokinetic steady state and at the “trough” time point, i.e., at the end of the dosing interval (otherwise, special calculations are needed to estimate accumulation and elimination). As a rule of thumb, under regular dosage (intermittent administration or continuous infusion) and stable elimination mechanisms (renal excretion, hepatic metabolism), a stable steady state is reached after three to five drug elimination half-lives (Figure 1A). It is thus important to perform sampling at standardized time points after antimicrobial administration. However, defining the best sampling time may be challenging since the prescription strategy often relies on repeated administration. This underlines the need for well-documented, written protocols for managing TDM [21].
After determining the antimicrobial concentration, the physicians can interpret the result and adjust the dosing regimen for the patient, through dosing adaptation models based on the pharmacokinetic (PK) characteristics of the drug of interest. However, the PK of many antimicrobials shows huge inter-individual variability and is largely unpredictable in ICU patients [22]. The exact mechanisms of this variability are not fully elucidated, but some of the following have been suggested: slower and variable gastrointestinal absorption (e.g., ciprofloxacin), increased volume of distribution (e.g., hydrophilic drugs such as aminoglycosides and beta-lactams), increased hepatic drug metabolism (e.g., sulfamethoxazole), and increased renal clearance (e.g., aminoglycosides, cephalosporins) [9]. The quality of the PK models can thus determine how successful the dose adjustment may be and must be validated with respect to the analytical technique.
In conclusion, the success of the entire TDM process depends not only on the measurement accuracy of drug concentrations, but also on adequate sampling, the quality of the dose adaptation model, and the extent of adjustments made to include the unique pathophysiological state of the individual.
2.1. Antimicrobial Quantification Methods
Most of the analytical platforms commonly used for TDM in clinical practice rely on many different immunoassays, or on separation techniques coupled with mass spectrometry (MS). The fundamentals and applications of these platforms will not be discussed in this review but have been extensively reported elsewhere [23,24,25]. A brief summary is reported in Table 1.
Traditionally, immunoassays are routine methods used to provide the highest speed and ease of operation due to a high degree of automation. They are based on the detection of a drug via binding to drug-specific antibodies. The turnaround time is short and the cost per test is generally low. For these reasons, there are many commercially available assays for the determination of some antimicrobials requiring TDM. Some examples include QMS® Gentamicin (GENT), ARKTM Linezolid, Monoclonal Antibody (mAb) Penicillin (P2B9), QMS® Tobramycin (TOBRA), and QMS® Vancomycin. However, the low accuracy (acceptance range within ±20–25% of the nominal values at each concentration level for EMA of FDA approval [26]) of the results can be misleading. The antibodies used in the assay can provoke cross-reactivity with endogenous human antibodies and other biofluid components such as hemoglobin, drug metabolites, or structurally similar drugs, leading to falsely higher values [23]. Moreover, standardization and calibration of this type of testing are not always easy, thus requiring the expertise of trained laboratory personnel.
In contrast, reference methods such as liquid chromatography combined with tandem mass spectrometry (LC-MS/MS) might be analytically more robust and accurate than immunoassays [27], and present less/no cross-reactivity, as reflected in the less stringent acceptance criteria for a successful validation for immunoassays with respect to LC-based techniques [26]. LC-MS/MS methods have been proposed for the quantification of several antimicrobials, including penicillins, carbapenems, macrolides, glycopeptides, and daptomycin. Despite their high specificity, interferences from the biological matrix may lead to falsely low or high results. Furthermore, the analysis is time-consuming and labor-intensive, and the throughput is lower than that of the conventional immunoassay platforms. Moreover, due to high initial investment and maintenance costs, facility requirements, and the need for highly trained analytical personnel, the implementation of LC-MS/MS methods is often not feasible in smaller and less-resourced hospitals. To mitigate the disadvantages of LC-MS/MS, high-performance liquid chromatography (HPLC) methods are often employed in combination with simpler detectors such as ultra-violet (UV) or diode-array detection (DAD). In such cases, however, analytes with similar retention times may interfere with the detection and overlapping peaks can be observed, especially in presence of unknown components in complex sample matrices.
2.2. Pharmacokinetic and Pharmacodynamic Indices of Antimicrobial Agents
Pharmacokinetic (PK) indices describe the time-dependent concentration course of the antimicrobial agent. The most important PK indices include the area under the plasma concentration–time curve (AUC0–24 h), the peak plasma concentration (Cmax), and the trough (or residual) concentration (Cmin), i.e., the concentration just before the next dose (practically about 5–10 min before it), as depicted in Figure 1B. Pharmacodynamics (PD) refers to the relationship between the antimicrobial concentration and the observed effect on the target pathogen, assessed in vitro under standardized conditions through a static and imperfect readout such as the minimal inhibitory concentration (MIC) [9]. MICs for TDM can be defined by various strategies [28], and indications on how to properly use it in TDM can be found elsewhere [29].
According to the differences in the dose–response relationships, antimicrobials can be broadly classified in one or more of the following PK/PD categories (Figure 2), describing antimicrobial exposure required for bacterial stasis or killing:
- Time-dependent agents. The antimicrobial effect is dependent on the cumulative percentage of time over a 24 h period that the free (unbound) antimicrobial concentration surpasses the MIC (fT%>MIC). For these antimicrobials, the longer the concentration remains at serum levels above the MIC, the greater the effectiveness. Increasing their concentration any more than three or four times that of the MIC does not ultimately make a difference. Typical examples are beta-lactams.
- Concentration-dependent agents. The antimicrobial effect is dependent on the peak concentration in a dosing interval divided by the MIC (Cmax/MIC), with different target levels, usually Cmax/MIC >8–10. These antimicrobials would achieve optimal effect with higher immediate serum concentrations, and extending the time after which the concentration remains above the MIC would have little effect. Typical examples are aminoglycosides and daptomycin.
- Concentration-dependent with time-dependent agents. The effect is defined by the AUC0–24 h over a 24 h period divided by the MIC (AUC0–24 h/MIC). This ratio indicates the importance of both time and concentration for optimal effect. Examples are fluoroquinolones, tigecycline, linezolid, and glycopeptides. Specific targets vary according to the antimicrobial.
3. Surface Enhanced Raman Scattering and Therapeutic Drug Monitoring
As implicitly explained by the name, SERS is an analytical method based on the enhancement of the Raman scattering by nanostructured metal surfaces (generally called “SERS substrates”, commonly made of gold or silver) with exceptional optical characteristics [30,31,32]. The information present in a vibrational spectrum, such as that obtained with Raman spectroscopy by analyzing the inelastic scattering of a laser light by a molecule, is strictly dependent on molecular structure, and thus it is often seen as a kind of “molecular fingerprint” of the analyte. Such information is exploited by analytical scientists to detect, identify, or even quantify molecular targets. Since Raman scattering is an intrinsic weak effect, however, the real breakthrough of SERS is the possibility of using Raman spectroscopy to investigate aqueous solutions with analytes in low concentration, i.e., µM to nM regime. SERS is thus considered both specific (because it has the “fingerprinting” capabilities of a vibrational spectroscopy) and sensitive (down to even a “single-molecule” detection regime by applying highly optimized measurement conditions and additionally the resonance Raman effect [33]).
The reasons why Raman scattering is amplified by several orders of magnitude are still investigated, but the general consensus settled for two mechanisms: a dominant, ever present “electromagnetic” mechanism relying on the plasmonic properties of the substrate, and another mechanism relying on the formation of a chemical bond between the analyte and the metal. Details of SERS theory can be found elsewhere [34,35], but the most important mechanism of enhancement (i.e., the electromagnetic) can be qualitatively described as the huge increase in the local electromagnetic field intensity at the metal substrate due to the collective oscillations of its surface electrons (i.e., plasmon polariton modes) caused by the incident light. While no direct chemical interaction between the analyte and the substrate is required for this mechanism to work, the amplification of the field is a local effect, so SERS requires nonetheless a close proximity of the analyte to the metal. The need for an adsorption or any kind of stable interaction between the analyte and the metal surface is a defining, essential feature of SERS: it sets both limits and advantages of this technique.
Since the electromagnetic mechanism is generally considered the most important one, SERS substrates are defined by their plasmonic properties. The ever-increasing, huge variety of SERS substrates, spanning from metal nanoparticles with different sizes and shapes to nanostructured surfaces with regularly spaced nano-sized features, is fully addressed elsewhere [36,37]. For the sake of simplicity, substrates could be roughly classified depending on the chemical nature of the metal (e.g., Au, Ag) or on their “state” (colloidal or solid). Colloidal aqueous dispersions of Au and Ag nanoparticles are among the most widely used substrates, since they are relatively easy to prepare with commonly available equipment upon chemical reduction of metal salts. Since the localized surface plasmon polaritons responsible for the electromagnetic mechanism of SERS are only excited at specific wavelengths, the laser wavelength used with a substrate is important to achieve the enhancement of the Raman signal. It is of utmost importance to realize that there are no universal, all-purposes SERS substrates, and that different substrates are suited for different applications.
In general, two different detection strategies can be used for SERS analysis: direct and indirect detection. In the direct detection, also called “label-free” detection, the SERS bands observed are due to the vibrational modes of the analyte itself, which is directly adsorbed on the substrate. The direct detection strategy is the most straightforward, but it relies on the spontaneous affinity of the analyte for the metal surface of the substrate. Heterocyclic aromatic compounds and thiols, for instance, do have such an affinity for Au and Ag, and can be usually detected with a label-free approach. Conversely, in the indirect detection, the SERS bands observed are due to the vibrational modes of a “Raman label” (also called “Raman reporter”), i.e., a molecule that is known to yield an intense SERS spectrum that is supposed to be associated with the analyte and the substrate. The indirect detection is more flexible, and can virtually be applied to any analyte, but it relies on an efficient recognition element (e.g., an antibody) linking the analyte to the Raman label on the substrate of choice. This approach is often used to develop so-called “SERS immunoassays” [38,39].
Clinical Applications of SERS, including TDM, Quantitative SERS
With its sensitivity and specificity, SERS has been the object of intense research activity aimed at developing various bioanalytical and clinical applications, ranging from disease diagnosis and prognosis to identification of pathogens. The many biomedical SERS applications have been recently reviewed elsewhere [40,41,42]. For clinical applications, the availability of compact, portable, fast, and easy-to-use Raman instruments is particularly attractive to develop so-called “point-of-care” clinical applications, to be used at the patient’s bedside by non-specialized operators.
These characteristics qualify SERS as an excellent candidate to develop TDM applications [16]. In particular, SERS methods for TDM based on both direct and indirect detection strategies aim at avoiding complex, time-consuming sample pre-treatment or separation steps, which are often required by other analytical approaches.
A major challenge for the application of SERS to TDM is the interference of the biofluids matrix. Biofluids are complex mixtures of thousands of biomolecules at varying concentrations, competing with the target drug for the adsorption sites at the metal surface of the substrate. This competition is less critical for indirect detection strategies, since the recognition elements bind to the drug of interest with a certain selectivity. However, for approaches involving a direct detection with SERS, this interference of the biological matrix can be a major obstacle to the target detection, more so considering the inter-individual variability of biofluids composition. The use of multivariate analysis methods may mitigate this problem, as the signal of the drug of interest can be “extracted” from that of the matrix. Biofluids commonly used in TDM such as plasma and serum are also rich in proteins, which are known to readily adsorb on metals, causing a so-called “surface fouling” effect. Moreover, these proteins often bind to a significant fraction of the drug of interest, hampering a direct interaction of the drug with the metal surface. Where necessary, rapid pre-processing steps involving sample deproteinization are often adopted before SERS detection to solve such protein-related issues.
Another major challenge for most SERS-based TDM applications is that a quantification of the analyte drug is needed. This is considered a challenge mainly because of both intra- and inter-substrate (i.e., batch-to-batch) repeatability issues with most SERS substrates, causing uncontrolled variability in the intensity of SERS bands. These issues originate from the fact that most substrates have a random density and distribution of hot spots (i.e., nano-sized gaps between metal nanostructures where the electromagnetic enhancement is particularly intense), since these two aspects are difficult to control during the fabrication process. Increasing the number of measurements and applying a proper statistical approach might mitigate this problem, although at the cost of increasing the time of analysis. The use of internal standards, although not devoid of problems, is also considered a viable solution for this repeatability issue [43,44,45]. Even when measures are taken to quantify or compensate for substrate-related variability, the lack of a standardized approach in reporting SERS results makes difficult the comparison between methods developed by different labs [46].
4. SERS Applications for TDM of Antimicrobial Agents
Research has been undertaken to develop SERS-based technology suitable for the point-of-care detection of antibiotics [30]. A list of relevant examples is enumerated in Table 2. In addition, a selection of the most relevant developments is discussed in more detail herein. The development of SERS-based methods for antimicrobial detection and quantification initially began as a method to determine contaminants in food and the environment [47,48]; antibiotic detection in milk is one of the more commonly reported areas, due to contamination resulting from animals undergoing therapy. Although studies that provided data on real biofluids have been prioritized for this review, it should be noted that the goal of a simple and effective method for analyzing antibiotics in complex matrices, such as milk or honey, is analogous to TDM, and therefore, there is much to be gained in learning from the approaches pursued in those assays.
4.1. Time-Dependent Agents
Cephalosporins are the family of time-dependent antibiotics for which the most promising SERS data are available in studies explicitly aiming at TDM, mostly thanks to the works by Markina et al. [56,57,59,60]. The methods presented in these works, all based on a direct detection strategy, have LODs or LOQs in a biofluid (i.e., spiked urine) which are compatible with the requirements of TDM. All cephalosporins should be monitored for efficacy when used in critically ill patients, and cefepime should be monitored for both efficacy and toxicity [12]; however, due to the lack of any commercial assay, clinical laboratories must develop and validate their own assays. Urine is easily available without any invasive measures and is an analytical matrix much easier to handle than serum or plasma because it does not contain many proteins.
In particular, the most promising results were obtained for ceftriaxone, cefazolin, and cefoperazone using Cu nanoparticles with an excitation wavelength at 638 nm [57]. The use of Cu as metal, which likely has a stronger interaction with the carbonyl and carboxyl groups of the drug molecules, allowed avoiding a solid phase extraction step, which has been deemed necessary to remove interfering metabolites when Ag nanoparticles were used as substrates [56,57]. The main drawback of the Cu nanoparticles used, as reported by the authors, is their low chemical stability, requiring the use of freshly prepared batches for SERS analysis and thus limiting the versatility of the method.
With some exceptions, most SERS studies on other time-dependent antibiotics were performed in water, limiting their significance with respect to TDM applications in complex biological matrices. This is the case, for instance, of the antibiotics belonging to the penicillin family, for which several label-free SERS studies are available (see Table 2) in aqueous solutions. The reasons for the lack of SERS studies on penicillins on spiked biological fluids is that the interest for a TDM of these molecules is relatively recent (consensus on TDM-guided dosing is still lacking [5]), while research was focused on environmental or food contamination of these drugs. LODs and LOQs of SERS analysis for several penicillins are low enough to raise the interest for TDM applications, but these figures of merit are expected to worsen when interferences from biological matrix constituents come into play. Thus, further studies are needed to check the applicability of these methods on spiked biofluids. The only penicillin that has been quantified with label-free SERS from a biofluid (i.e., spiked pig plasma) is cloxacillin, by using a solid-phase extraction based on a molecular imprinted polymer, followed by a recovery step with a methanol/acetic acid mixture (Figure 3) [79]. This work by Ashley et al. is an example in which a label-free SERS detection is achieved by decreasing the complexity of the matrix by a pre-treatment step, but at the expense of an overall increase in measurement times, costs, and complexity.
Meropenem and sulfamethoxazole (two antibiotics of the carbapenem and sulfanilamide families, respectively) were also quantified by using label-free SERS methods in complex biological matrices [55,87]. In both studies, which explicitly aimed at TDM, the results were extremely promising. Muneer at al. quantified meropenem in human blood plasma down to a LOQ of 1 pM on gold nanostructures on nickel foams excited in the NIR, using a hand-held Raman spectrometer [55]. As in the case of some cephalosporins, Markina et al. succeeded in quantifying sulfamethoxazole from spiked urine samples by relying on a case-specific sample pre-treatment to separate the target from interfering metabolites [87]. In the case of sulfamethoxazole, the pre-treatment step, involving liquid–liquid extraction, pH adjustment, and dilution, was considered important to achieve a reliable SERS quantification method, at least using Ag nanoparticles as substrate (Figure 4).
As far as the antifungals are concerned, only one study on the label-free SERS quantification of 5-flucytosine in spiked serum is available [52]. Even if routine TDM for this drug is neither recommended nor discouraged, the work by Berger et al. is particularly appealing since it directly measures the drug in undiluted serum, without any sample pre-processing. Data presented suggest that a passive vertical flow system constituting several nitrocellulose membranes is capable of “cleaning” the serum sample before adsorption on Ag nanoparticles deposited on paper, allowing the drug SERS bands to be observed (Figure 5).
4.2. Concentration-Dependent Agents
TDM of aminoglycosides has been the standard of care in many hospitals since the 1970s as a means to reduce toxicity while still assuring adequate levels of these antibiotics for treatment of severe infections. McKeating et al. showed how SERS can be used in combination with localized surface plasmon resonance (LSPR) for the analysis of various aminoglycosides and performed an in-depth study of the feasibility of carrying out TDM of tobramycin in spiked human serum, down to 4 μM [51]. The study was conducted using a 633 nm laser to excite gold nanoparticles conjugated with 5,5′dithiobis-(2-nitrobenzoic acid), DTNB. Interestingly, the covering of the surface of the gold nanoparticles with DNTB, a common Raman reporter, was necessary to obtain an intense SERS spectrum directly related to the extent of aggregation provided by the aminoglycosides. Moreover, a dilution of the crude serum would be required for the analysis of real samples, due to the low sensitivity obtained.
Similarly, a SERS-based lateral flow immunosensing assay (LFIA) using DNTB-Au NPs has been proposed to identify colistin in milk. Colistin is a long-known cationic polypeptide antibiotic. Its use has recently resurged, assuming an important role as salvage therapy for otherwise untreatable infections in ICU. International consensus guidelines recommend TDM and adaptive feedback control for colistin, because drug dosage cannot be safely optimized using clinical observations and dosing algorithms alone, especially in the important early treatment period. The assay developed by Li et al. showed rapidity (assay time below 20 min), high accuracy (with recovery between 88% and 113%), and a satisfactory precision below 15%.
Liu et al. demonstrated the quantification of voriconazole from plasma samples using a portable Raman spectrometer (i-Raman Plus), relying on gold nanoparticles and chemometrics [53]. Considering the substantial and multifactorial variability in pharmacokinetics, the exposure-dependent occurrence of predominantly neurotoxic adverse effects, and significant relationships between exposure and outcome, TDM is recommended for adults and children by current international guidelines when voriconazole is used for prophylaxis or treatment of invasive fungal infections [8].
The feasibility of the SERS-based method was evaluated on five patient samples and validated using a standard HPLC method. Comparison of the voriconazole plasma concentrations, obtained using both methods, yielded a mean relative difference of 7%, indicating a good agreement. However, the authors of the work suggested that further studies using a much larger number of patient samples will be required to better assess the accuracy of the SERS-based method.
4.3. Concentration-Dependent Agents with Time Dependence
Fluoroquinolones exhibit concentration-dependent bacterial killing as serum concentrations increase to approximately 10 times the MIC, and also offer a post-antibiotic effect (PAE). However, there are few PK data in the literature for special patient populations, especially in critically ill patients. As a result, recommended doses of fluoroquinolones, and in particular, those for ciprofloxacin for special patient populations, offer an extensive range, raising the risk for both under- and over-dosage. Moreover, multiple concentration measurements widely distributed over the dosing interval are required to compute the AUC0–24h. Since more than 85% of the administered dose of levofloxacin is excreted into the urine, monitoring the clearance rate of levofloxacin could be adopted to reduce the burden of frequent sampling for both patient and personnel while providing an important way to access treatment effectiveness and reduce side effects.
The work by Shi et al. introduced a SERS-LFIA for the ultrasensitive detection of many fluoroquinolones in milk using AuNPs conjugated to 4-aminothiophenol (PATP, the Raman reporter molecule), and to monoclonal antibody against specific antibiotics [88]. The proposed method exhibited high sensitivity, specificity, and reliability, with a LOD of 0.57 × 10⁻³ ng/mL for ciprofloxacin.
More interestingly, a droplet-based microfluidic detection scheme in the form of lab-on-a-chip SERS (LOC-SERS) was applied for the SERS-based quantification of the levofloxacin in spiked human urine samples (Figure 6) [66]. Using silver nanoparticles as a method of enhancing the Raman signal, the levofloxacin spectra were elucidated from a microfluidic device at detection limits (LOD, 0.8 μM) and linear dynamic window (1–15 μM) within the target therapeutic range. Bindesri et al. reported the detection of levofloxacin from synthetic urine samples using the first fabric-based sensor combining electrochemistry (EC) and SERS [67]. Conductive inks and AgNPs paste were used to manufacture the EC-SERS sensor on a cotton blend fabric. Such wearable sensors could be included in clothing articles and facilitate continuous monitoring of a patient’s health. In this study, the authors successfully tested their sensor for levofloxacin down to a concentration of 1 mM.
Moxifloxacin was also detected in urine by Mamian-Lopez and Poppi using nanostructured gold surfaces [72]. The standard addition method in conjunction with multivariate curve resolution–alternating least squares was applied to eliminate the matrix effect and to isolate the spectral contribution of the analyte. The low LOD (0.085 μg/mL) and LOQ (0.26 μg/mL) values indicated that the quantification can be accomplished in urine up to 24 h after the administration of a single 400 mg dose.
A secondary objective of this review is to highlight some antimicrobial agents that would greatly benefit from SERS-based methods that could be carried out at the point of care. The examples provided in Table 3 constitute a subset of potential applications from a list of the most monitored drugs. The development of SERS methods for clofazimine, ertapenem, gentamycin, linezolid, oxacillin, piperacillin, ticarcillin, tigecycline, and vancomycin would be of great interest.
5. Conclusions and Perspectives
Accessible point of care tests and rapid technology-based assays for therapeutic drug monitoring (TDM) are urgently needed for more effective therapeutic regimens and a more objective approach to monitoring adequacy of antimicrobial treatment.
Huge advances in SERS spectroscopy have been recently taking place, leading to the possible full application of this technology. SERS methods offer short analysis times, low costs, and a variety of modifications and customizations, which can make them optimal tools for the transition of healthcare management in intensive care units towards precision medicine. Portable or hand-held SERS systems, possibly integrated in a device including an automated sample pre-treatment, would be required for on-site real-time and continuous point-of-care analysis. Such integrated systems are likely to become a powerful next-generation biomedical diagnostic tool—not requiring large analytical infrastructures, they will give the opportunity of a fast and reliable TDM, also in countries with inadequate arrangements, and the possibility of immediate results will make SERS devices especially beneficial for the analysis of instable agents, such as meropenem.
However, the majority of the methods reported in this review have been performed using high-end, non-portable microscope-based instruments. Even if it can be speculated that the microscope was used only as a light delivery and collection vehicle, being easily replaceable with fiber-based and more portable solutions, still only few studies used portable or hand-held devices.
To apply SERS as a routine tool for TDM, future research should address some unmet needs, namely quantitative SERS methods of different antimicrobial agents, working in real biofluids at proper concentration levels, focusing on the standardization of experimental protocols, the development of novel SERS substrates with integrated internal standards, and possibly the integration with continuous sampling devices to measure the concentration of the free antimicrobial fraction in the bloodstream. The interference of biofluid components still needs further research to obtain rapid, non-destructive, and accurate detection of antimicrobials and their metabolites.
Moreover, large-scale clinical validation studies for all the proposed methods are still missing and must be addressed before routine SERS methods can be better positioned in clinical laboratories.
Author Contributions
Conceptualization, S.F. and A.B.; data curation, S.F.; writing—original draft preparation, S.F. and A.B.; writing—review and editing, S.F., D.C.-M., V.S. and A.B.; visualization, S.F. and A.B. All authors have read and agreed to the published version of the manuscript.
Funding
This research received no external funding.
Institutional Review Board Statement
Not applicable.
Informed Consent Statement
Not applicable.
Data Availability Statement
Not applicable.
Conflicts of Interest
The authors declare no conflict of interest.
References
- Fleischmann-Struzek, C.; Mellhammar, L.; Rose, N.; Cassini, A.; Rudd, K.E.; Schlattmann, P.; Allegranzi, B.; Reinhart, K. Incidence and Mortality of Hospital- and ICU-Treated Sepsis: Results from an Updated and Expanded Systematic Review and Meta-Analysis. Intensive Care Med. 2020, 46, 1552–1562. [Google Scholar] [CrossRef] [PubMed]
- Rudd, K.E.; Johnson, S.C.; Agesa, K.M.; Shackelford, K.A.; Tsoi, D.; Kievlan, D.R.; Colombara, D.V.; Ikuta, K.S.; Kissoon, N.; Finfer, S.; et al. Global, Regional, and National Sepsis Incidence and Mortality, 1990–2017: Analysis for the Global Burden of Disease Study. Lancet 2020, 395, 200–211. [Google Scholar] [CrossRef] [Green Version]
- Roberts, J.A.; Abdul-Aziz, M.H.; Lipman, J.; Mouton, J.W.; Vinks, A.A.; Felton, T.W.; Hope, W.W.; Farkas, A.; Neely, M.N.; Schentag, J.J.; et al. Individualised Antibiotic Dosing for Patients Who Are Critically Ill: Challenges and Potential Solutions. Lancet Infect. Dis. 2014, 14, 498–509. [Google Scholar] [CrossRef] [Green Version]
- Rea, R.S.; Capitano, B.; Bies, R.; Bigos, K.L.; Smith, R.; Lee, H. Suboptimal Aminoglycoside Dosing in Critically Ill Patients. Ther. Drug Monit. 2008, 30, 674–681. [Google Scholar] [CrossRef]
- Muller, A.E.; Huttner, B.; Huttner, A. Therapeutic Drug Monitoring of β-Lactams and Other Antibiotics in the Intensive Care Unit: Which Agents, Which Patients and Which Infections? Drugs 2018, 78, 439–451. [Google Scholar] [CrossRef] [PubMed]
- Abdulla, A.; Ewoldt, T.M.J.; Hunfeld, N.G.M.; Muller, A.E.; Rietdijk, W.J.R.; Polinder, S.; van Gelder, T.; Endeman, H.; Koch, B.C.P. The Effect of Therapeutic Drug Monitoring of β-Lactam and Fluoroquinolones on Clinical Outcome in Critically Ill Patients: The DOLPHIN Trial Protocol of a Multi-Centre Randomised Controlled Trial. BMC Infect. Dis. 2020, 20, 57. [Google Scholar] [CrossRef] [PubMed]
- Roberts, J.A.; Taccone, F.S.; Udy, A.A.; Vincent, J.-L.; Jacobs, F.; Lipman, J. Vancomycin Dosing in Critically Ill Patients: Robust Methods for Improved Continuous-Infusion Regimens. Antimicrob. Agents Chemother. 2011, 55, 2704–2709. [Google Scholar] [CrossRef] [PubMed] [Green Version]
- Ashbee, H.R.; Barnes, R.A.; Johnson, E.M.; Richardson, M.D.; Gorton, R.; Hope, W.W. Therapeutic Drug Monitoring (TDM) of Antifungal Agents: Guidelines from the British Society for Medical Mycology. J. Antimicrob. Chemother. 2014, 69, 1162–1176. [Google Scholar] [CrossRef] [PubMed] [Green Version]
- Blot, S.I.; Pea, F.; Lipman, J. The Effect of Pathophysiology on Pharmacokinetics in the Critically Ill Patient—Concepts Appraised by the Example of Antimicrobial Agents. Adv. Drug Deliv. Rev. 2014, 77, 3–11. [Google Scholar] [CrossRef] [PubMed]
- Reinhart, K.; Daniels, R.; Kissoon, N.; Machado, F.R.; Schachter, R.D.; Finfer, S. Recognizing Sepsis as a Global Health Priority—A WHO Resolution. N. Engl. J. Med. 2017, 377, 414–417. [Google Scholar] [CrossRef] [PubMed]
- Wicha, S.G.; Märtson, A.-G.; Nielsen, E.I.; Koch, B.C.P.; Friberg, L.E.; Alffenaar, J.-W.; Minichmayr, I.K.; International Society of Anti-Infective Pharmacology (ISAP), the PK/PD Study Group of the European Society of Clinical Microbiology, Infectious Diseases (EPASG). From Therapeutic Drug Monitoring to Model-Informed Precision Dosing for Antibiotics. Clin. Pharmacol. Ther. 2021, 109, 928–941. [Google Scholar] [CrossRef] [PubMed]
- The Infection Section of European Society of Intensive Care Medicine (ESICM); Pharmacokinetic/Pharmacodynamic and Critically Ill Patient Study Groups of European Society of Clinical Microbiology and Infectious Diseases (ESCMID); Infectious Diseases Group of International Association of Therapeutic Drug Monitoring and Clinical Toxicology (IATDMCT); Infections in the ICU and Sepsis Working Group of International Society of Antimicrobial Chemotherapy (ISAC); Abdul-Aziz, M.H.; Alffenaar, J.-W.C.; Bassetti, M.; Bracht, H.; Dimopoulos, G.; Marriott, D.; et al. Antimicrobial Therapeutic Drug Monitoring in Critically Ill Adult Patients: A Position Paper. Intensive Care Med. 2020, 46, 1127–1153. [Google Scholar] [CrossRef] [PubMed]
- Williams, P.; Cotta, M.O.; Roberts, J.A. Pharmacokinetics/Pharmacodynamics of β-Lactams and Therapeutic Drug Monitoring: From Theory to Practical Issues in the Intensive Care Unit. Semin. Respir. Crit. Care Med. 2019, 40, 476–487. [Google Scholar] [CrossRef] [PubMed]
- Märtson, A.-G.; Burch, G.; Ghimire, S.; Alffenaar, J.-W.C.; Peloquin, C.A. Therapeutic Drug Monitoring in Patients with Tuberculosis and Concurrent Medical Problems. Expert Opin. Drug Metab. Toxicol. 2021, 17, 23–39. [Google Scholar] [CrossRef] [PubMed]
- Li, C.; Huang, Y.; Li, X.; Zhang, Y.; Chen, Q.; Ye, Z.; Alqarni, Z.; Bell, S.E.J.; Xu, Y. Towards Practical and Sustainable SERS: A Review of Recent Developments in the Construction of Multifunctional Enhancing Substrates. J. Mater. Chem. C 2021, 9, 11517–11552. [Google Scholar] [CrossRef]
- Jaworska, A.; Fornasaro, S.; Sergo, V.; Bonifacio, A. Potential of Surface Enhanced Raman Spectroscopy (SERS) in Therapeutic Drug Monitoring (TDM). A Critical Review. Biosensors 2016, 6, 47. [Google Scholar] [CrossRef] [Green Version]
- Frosch, T.; Knebl, A.; Frosch, T. Recent Advances in Nano-Photonic Techniques for Pharmaceutical Drug Monitoring with Emphasis on Raman Spectroscopy. Nanophotonics 2019, 9, 19–37. [Google Scholar] [CrossRef]
- Tommasini, M.; Zanchi, C.; Lucotti, A.; Bombelli, A.; Villa, N.S.; Casazza, M.; Ciusani, E.; de Grazia, U.; Santoro, M.; Fazio, E.; et al. Laser-Synthesized SERS Substrates as Sensors toward Therapeutic Drug Monitoring. Nanomaterials 2019, 9, 677. [Google Scholar] [CrossRef] [Green Version]
- Sloan-Dennison, S.; O’Connor, E.; Dear, J.W.; Graham, D.; Faulds, K. Towards Quantitative Point of Care Detection Using SERS Lateral Flow Immunoassays. Anal. Bioanal. Chem. 2022, 1–9. [Google Scholar] [CrossRef]
- Kaza, M.; Karaźniewicz-Łada, M.; Kosicka, K.; Siemiątkowska, A.; Rudzki, P.J. Bioanalytical Method Validation: New FDA Guidance vs. EMA Guideline. Better or Worse? J. Pharm. Biomed. Anal. 2019, 165, 381–385. [Google Scholar] [CrossRef]
- Mabilat, C.; Gros, M.F.; Nicolau, D.; Mouton, J.W.; Textoris, J.; Roberts, J.A.; Cotta, M.O.; van Belkum, A.; Caniaux, I. Diagnostic and Medical Needs for Therapeutic Drug Monitoring of Antibiotics. Eur. J. Clin. Microbiol. Infect. Dis. 2020, 39, 791–797. [Google Scholar] [CrossRef] [Green Version]
- Roberts, J.A.; Lipman, J. Pharmacokinetic Issues for Antibiotics in the Critically Ill Patient. Crit. Care Med. 2009, 37, 840–851, quiz 859. [Google Scholar] [CrossRef] [PubMed] [Green Version]
- Carlier, M.; Stove, V.; Wallis, S.C.; De Waele, J.J.; Verstraete, A.G.; Lipman, J.; Roberts, J.A. Assays for Therapeutic Drug Monitoring of β-Lactam Antibiotics: A Structured Review. Int. J. Antimicrob. Agents 2015, 46, 367–375. [Google Scholar] [CrossRef] [PubMed]
- Dasgupta, A. Immunoassays and Issues with Interference in Therapeutic Drug Monitoring. In Clinical Challenges in Therapeutic Drug Monitoring; Elsevier: Amsterdam, The Netherlands, 2016; pp. 17–44. ISBN 978-0-12-802025-8. [Google Scholar]
- Manohar, M.; Marzinke, M.A. Application of Chromatography Combined with Mass Spectrometry in Therapeutic Drug Monitoring. In Clinical Challenges in Therapeutic Drug Monitoring; Elsevier: Amsterdam, The Netherlands, 2016; pp. 45–70. ISBN 978-0-12-802025-8. [Google Scholar]
- Committee for Human Medicinal Products. Draft ICH Guideline M10 on Bioanalytical Method Validation; EMA/CHMP/ICH/172948/2019; European Medicines Agency: London, UK, 2019.
- Decosterd, L.A.; Widmer, N.; André, P.; Aouri, M.; Buclin, T. The Emerging Role of Multiplex Tandem Mass Spectrometry Analysis for Therapeutic Drug Monitoring and Personalized Medicine. TrAC Trends Anal. Chem. 2016, 84, 5–13. [Google Scholar] [CrossRef] [Green Version]
- Belanger, C.R.; Hancock, R.E.W. Testing Physiologically Relevant Conditions in Minimal Inhibitory Concentration Assays. Nat. Protoc. 2021, 16, 3761–3774. [Google Scholar] [CrossRef]
- Mouton, J.W.; Muller, A.E.; Canton, R.; Giske, C.G.; Kahlmeter, G.; Turnidge, J. MIC-Based Dose Adjustment: Facts and Fables. J. Antimicrob. Chemother. 2018, 73, 564–568. [Google Scholar] [CrossRef] [PubMed] [Green Version]
- Langer, J.; Jimenez de Aberasturi, D.; Aizpurua, J.; Alvarez-Puebla, R.A.; Auguié, B.; Baumberg, J.J.; Bazan, G.C.; Bell, S.E.J.; Boisen, A.; Brolo, A.G.; et al. Present and Future of Surface-Enhanced Raman Scattering. ACS Nano 2020, 14, 28–117. [Google Scholar] [CrossRef] [PubMed] [Green Version]
- Wang, X.; Huang, S.-C.; Hu, S.; Yan, S.; Ren, B. Fundamental Understanding and Applications of Plasmon-Enhanced Raman Spectroscopy. Nat. Rev. Phys. 2020, 2, 253–271. [Google Scholar] [CrossRef]
- Han, X.X.; Rodriguez, R.S.; Haynes, C.L.; Ozaki, Y.; Zhao, B. Surface-Enhanced Raman Spectroscopy. Nat. Rev. Methods Primer 2021, 1, 87. [Google Scholar] [CrossRef]
- Le Ru, E.C.; Etchegoin, P.G. A Quick Overview of Surface-Enhanced Raman Spectroscopy. In Principles of Surface-Enhanced Raman Spectroscopy; Elsevier: Amsterdam, The Netherlands, 2009; pp. 1–27. ISBN 978-0-444-52779-0. [Google Scholar]
- Ding, S.-Y.; You, E.-M.; Tian, Z.-Q.; Moskovits, M. Electromagnetic Theories of Surface-Enhanced Raman Spectroscopy. Chem. Soc. Rev. 2017, 46, 4042–4076. [Google Scholar] [CrossRef] [PubMed]
- Pilot, R.; Signorini, R.; Durante, C.; Orian, L.; Bhamidipati, M.; Fabris, L. A Review on Surface-Enhanced Raman Scattering. Biosensors 2019, 9, 57. [Google Scholar] [CrossRef] [Green Version]
- Mosier-Boss, P. Review of SERS Substrates for Chemical Sensing. Nanomaterials 2017, 7, 142. [Google Scholar] [CrossRef] [PubMed] [Green Version]
- Li, W.; Zhao, X.; Yi, Z.; Glushenkov, A.M.; Kong, L. Plasmonic Substrates for Surface Enhanced Raman Scattering. Anal. Chim. Acta 2017, 984, 19–41. [Google Scholar] [CrossRef] [PubMed]
- Khlebtsov, B.; Khlebtsov, N. Surface-Enhanced Raman Scattering-Based Lateral-Flow Immunoassay. Nanomaterials 2020, 10, 2228. [Google Scholar] [CrossRef] [PubMed]
- Wang, Z.; Zong, S.; Wu, L.; Zhu, D.; Cui, Y. SERS-Activated Platforms for Immunoassay: Probes, Encoding Methods, and Applications. Chem. Rev. 2017, 117, 7910–7963. [Google Scholar] [CrossRef] [PubMed]
- Zong, C.; Xu, M.; Xu, L.-J.; Wei, T.; Ma, X.; Zheng, X.-S.; Hu, R.; Ren, B. Surface-Enhanced Raman Spectroscopy for Bioanalysis: Reliability and Challenges. Chem. Rev. 2018, 118, 4946–4980. [Google Scholar] [CrossRef]
- Panikar, S.S.; Cialla-May, D.; De la Rosa, E.; Salas, P.; Popp, J. Towards Translation of Surface-Enhanced Raman Spectroscopy (SERS) to Clinical Practice: Progress and Trends. TrAC Trends Anal. Chem. 2021, 134, 116122. [Google Scholar] [CrossRef]
- Cailletaud, J.; De Bleye, C.; Dumont, E.; Sacré, P.-Y.; Netchacovitch, L.; Gut, Y.; Boiret, M.; Ginot, Y.-M.; Hubert, P.; Ziemons, E. Critical Review of Surface-Enhanced Raman Spectroscopy Applications in the Pharmaceutical Field. J. Pharm. Biomed. Anal. 2018, 147, 458–472. [Google Scholar] [CrossRef] [PubMed]
- Bell, S.E.J.; Charron, G.; Cortés, E.; Kneipp, J.; Chapelle, M.L.; Langer, J.; Procházka, M.; Tran, V.; Schlücker, S. Towards Reliable and Quantitative Surface—Enhanced Raman Scattering (SERS): From Key Parameters to Good Analytical Practice. Angew. Chem. Int. Ed. 2020, 59, 5454–5462. [Google Scholar] [CrossRef] [Green Version]
- Bell, S.E.J.; Sirimuthu, N.M.S. Quantitative Surface-Enhanced Raman Spectroscopy. Chem. Soc. Rev. 2008, 37, 1012–1024. [Google Scholar] [CrossRef]
- Goodacre, R.; Graham, D.; Faulds, K. Recent Developments in Quantitative SERS: Moving towards Absolute Quantification. TrAC Trends Anal. Chem. 2018, 102, 359–368. [Google Scholar] [CrossRef] [Green Version]
- Masson, J.-F. The Need for Benchmarking Surface-Enhanced Raman Scattering (SERS) Sensors. ACS Sens. 2021, 6, 3822–3823. [Google Scholar] [CrossRef]
- Girmatsion, M.; Mahmud, A.; Abraha, B.; Xie, Y.; Cheng, Y.; Yu, H.; Yao, W.; Guo, Y.; Qian, H. Rapid Detection of Antibiotic Residues in Animal Products Using Surface-Enhanced Raman Spectroscopy: A Review. Food Control 2021, 126, 108019. [Google Scholar] [CrossRef]
- Guo, Y.; Girmatsion, M.; Li, H.-W.; Xie, Y.; Yao, W.; Qian, H.; Abraha, B.; Mahmud, A. Rapid and Ultrasensitive Detection of Food Contaminants Using Surface-Enhanced Raman Spectroscopy-Based Methods. Crit. Rev. Food Sci. Nutr. 2020, 61, 3555–3568. [Google Scholar] [CrossRef] [PubMed]
- Balan, C.; Pop, L.-C.; Baia, M. IR, Raman and SERS Analysis of Amikacin Combined with DFT-Based Calculations. Spectrochim. Acta A Mol. Biomol. Spectrosc. 2019, 214, 79–85. [Google Scholar] [CrossRef] [PubMed]
- Shi, Q.; Huang, J.; Sun, Y.; Deng, R.; Teng, M.; Li, Q.; Yang, Y.; Hu, X.; Zhang, Z.; Zhang, G. A SERS-Based Multiple Immuno-Nanoprobe for Ultrasensitive Detection of Neomycin and Quinolone Antibiotics via a Lateral Flow Assay. Microchim. Acta 2018, 185, 84. [Google Scholar] [CrossRef]
- McKeating, K.S.; Couture, M.; Dinel, M.-P.; Garneau-Tsodikova, S.; Masson, J.-F. High Throughput LSPR and SERS Analysis of Aminoglycoside Antibiotics. Analyst 2016, 141, 5120–5126. [Google Scholar] [CrossRef] [Green Version]
- Berger, A.G.; Restaino, S.M.; White, I.M. Vertical-Flow Paper SERS System for Therapeutic Drug Monitoring of Flucytosine in Serum. Anal. Chim. Acta 2017, 949, 59–66. [Google Scholar] [CrossRef] [PubMed] [Green Version]
- Liu, H.; Wang, Y.; Wang, N.; Liu, M.; Liu, S. The Determination of Plasma Voriconazole Concentration by Surface-Enhanced Raman Spectroscopy Combining Chemometrics. Chemom. Intell. Lab. Syst. 2019, 193, 103833. [Google Scholar] [CrossRef]
- Wang, Y.; Li, Y.-S.; Wu, J.; Zhang, Z.; An, D. Surface-Enhanced Raman Spectra of Some Anti-Tubercle Bacillus Drugs. Spectrochim. Acta A Mol. Biomol. Spectrosc. 2000, 56, 2637–2644. [Google Scholar] [CrossRef]
- Muneer, S.; Sarfo, D.K.; Ayoko, G.A.; Islam, N.; Izake, E.L. Gold-Deposited Nickel Foam as Recyclable Plasmonic Sensor for Therapeutic Drug Monitoring in Blood by Surface-Enhanced Raman Spectroscopy. Nanomaterials 2020, 10, 1756. [Google Scholar] [CrossRef] [PubMed]
- Markina, N.E.; Markin, A.V. Application of Aluminum Hydroxide for Improvement of Label-Free SERS Detection of Some Cephalosporin Antibiotics in Urine. Biosensors 2019, 9, 91. [Google Scholar] [CrossRef] [Green Version]
- Markina, N.E.; Ustinov, S.N.; Zakharevich, A.M.; Markin, A.V. Copper Nanoparticles for SERS-Based Determination of Some Cephalosporin Antibiotics in Spiked Human Urine. Anal. Chim. Acta 2020, 1138, 9–17. [Google Scholar] [CrossRef] [PubMed]
- Qi, H.; Chen, H.; Zhao, S.; Huang, J. Quantitative Analysis of Ceftazidime Using SERS Based on Silver Nanoparticles Substrate. Nanophoton. MicroNano Opt. IV 2018, 10823, 1082313. [Google Scholar] [CrossRef]
- Markina, N.E.; Volkova, E.K.; Zakharevich, A.M.; Goryacheva, I.Y.; Markin, A.V. SERS Detection of Ceftriaxone and Sulfadimethoxine Using Copper Nanoparticles Temporally Protected by Porous Calcium Carbonate. Microchim. Acta 2018, 185, 481. [Google Scholar] [CrossRef] [PubMed]
- Markina, N.E.; Goryacheva, I.Y.; Markin, A.V. Sample Pretreatment and SERS-Based Detection of Ceftriaxone in Urine. Anal. Bioanal. Chem. 2018, 410, 2221–2227. [Google Scholar] [CrossRef] [PubMed]
- Wang, W.; Sang, Q.; Yang, M.; Du, J.; Yang, L.; Jiang, X.; Han, X.; Zhao, B. Detection of Several Quinolone Antibiotic Residues in Water Based on Ag-TiO2 SERS Strategy. Sci. Total Environ. 2020, 702, 134956. [Google Scholar] [CrossRef] [PubMed]
- Hidi, I.J.; Heidler, J.; Weber, K.; Cialla-May, D.; Popp, J. Ciprofloxacin: PH-Dependent SERS Signal and Its Detection in Spiked River Water Using LoC-SERS. Anal. Bioanal. Chem. 2016, 408, 8393–8401. [Google Scholar] [CrossRef]
- Hong, K.Y.; de Albuquerque, C.D.L.; Poppi, R.J.; Brolo, A.G. Determination of Aqueous Antibiotic Solutions Using SERS Nanogratings. Anal. Chim. Acta 2017, 982, 148–155. [Google Scholar] [CrossRef] [PubMed]
- Usman, M.; Guo, X.; Wu, Q.; Barman, J.; Su, S.; Huang, B.; Biao, T.; Zhang, Z.; Zhan, Q. Facile Silicone Oil-Coated Hydrophobic Surface for Surface Enhanced Raman Spectroscopy of Antibiotics. RSC Adv. 2019, 9, 14109–14115. [Google Scholar] [CrossRef] [Green Version]
- Wang, K.; Meng, Y.; Jiao, X.; Huang, W.; Fan, D.; Liu, T.C. Facile Synthesis of an Economic 3D Surface-Enhanced Raman Scattering Platform for Ultrasensitive Detection of Antibiotics. Food Anal. Methods 2020, 13, 1947–1955. [Google Scholar] [CrossRef]
- Hidi, I.J.; Jahn, M.; Pletz, M.W.; Weber, K.; Cialla-May, D.; Popp, J. Toward Levofloxacin Monitoring in Human Urine Samples by Employing the LoC-SERS Technique. J. Phys. Chem. C 2016, 120, 20613–20623. [Google Scholar] [CrossRef]
- Bindesri, S.D.; Alhatab, D.S.; Brosseau, C.L. Development of an Electrochemical Surface-Enhanced Raman Spectroscopy (EC-SERS) Fabric-Based Plasmonic Sensor for Point-of-Care Diagnostics. Analyst 2018, 143, 4128–4135. [Google Scholar] [CrossRef]
- Tian, Y.; Li, G.; Zhang, H.; Xu, L.; Jiao, A.; Chen, F.; Chen, M. Construction of Optimized Au@Ag Core-Shell Nanorods for Ultralow SERS Detection of Antibiotic Levofloxacin Molecules. Opt. Express 2018, 26, 23347. [Google Scholar] [CrossRef]
- Liu, S.; Huang, J.; Chen, Z.; Chen, N.; Pang, F.; Wang, T.; Hu, L. Raman Spectroscopy Measurement of Levofloxacin Lactate in Blood Using an Optical Fiber Nano—Probe. J. Raman Spectrosc. 2015, 46, 197–201. [Google Scholar] [CrossRef]
- Liu, S.; Rong, M.; Zhang, H.; Chen, N.; Pang, F.; Chen, Z.; Wang, T.; Yan, J. In Vivo Raman Measurement of Levofloxacin Lactate in Blood Using a Nanoparticle-Coated Optical Fiber Probe. Biomed. Opt. Express 2016, 7, 810. [Google Scholar] [CrossRef] [Green Version]
- Mohaghegh, F.; Tehrani, A.M.; Rana, D.; Winterhalter, M.; Materny, A. Detection and Quantification of Small Concentrations of Moxifloxacin Using Surface—Enhanced Raman Spectroscopy in a Kretschmann Configuration. J. Raman Spectrosc. 2021, 52, 1617–1629. [Google Scholar] [CrossRef]
- Mamián-López, M.B.; Poppi, R.J. Quantification of Moxifloxacin in Urine Using Surface-Enhanced Raman Spectroscopy (SERS) and Multivariate Curve Resolution on a Nanostructured Gold Surface. Anal. Bioanal. Chem. 2013, 405, 7671–7677. [Google Scholar] [CrossRef]
- El-Zahry, M.R.; Lendl, B. Structure Elucidation and Degradation Kinetic Study of Ofloxacin Using Surface Enhanced Raman Spectroscopy. Spectrochim. Acta A Mol. Biomol. Spectrosc. 2018, 193, 63–70. [Google Scholar] [CrossRef] [PubMed]
- März, A.; Trupp, S.; Rösch, P.; Mohr, G.J.; Popp, J. Fluorescence Dye as Novel Label Molecule for Quantitative SERS Investigations of an Antibiotic. Anal. Bioanal. Chem. 2012, 402, 2625–2631. [Google Scholar] [CrossRef] [PubMed]
- Filgueiras, A.L.; Paschoal, D.; Santos, H.F.D.; Sant’Ana, A.C. Adsorption Study of Antibiotics on Silver Nanoparticle Surfaces by Surface-Enhanced Raman Scattering Spectroscopy. Spectrochim. Acta A Mol. Biomol. Spectrosc. 2015, 136, 979–985. [Google Scholar] [CrossRef]
- Wang, L.; Zhou, G.; Guan, X.; Zhao, L. Rapid Preparation of Surface-Enhanced Raman Substrate in Microfluidic Channel for Trace Detection of Amoxicillin. Spectrochim. Acta A Mol. Biomol. Spectrosc. 2020, 235, 63–70. [Google Scholar] [CrossRef]
- Anh, N.T.; Dinh, N.X.; Tuan, H.V.; Doan, M.Q.; Anh, N.H.; Khi, N.T.; Trang, V.T.; Tri, D.Q.; Le, A.-T. Eco-Friendly Copper Nanomaterials-Based Dual-Mode Optical Nanosensors for Ultrasensitive Trace Determination of Amoxicillin Antibiotics Residue in Tap Water Samples. Mater. Res. Bull. 2022, 147, 111649. [Google Scholar] [CrossRef]
- EL-Zahry, M.R.; Refaat, I.H.; Mohamed, H.A.; Rosenberg, E.; Lendl, B. Utility of Surface Enhanced Raman Spectroscopy (SERS) for Elucidation and Simultaneous Determination of Some Penicillins and Penicilloic Acid Using Hydroxylamine Silver Nanoparticles. Talanta 2015, 144, 710–716. [Google Scholar] [CrossRef] [PubMed]
- Ashley, J.; Wu, K.; Hansen, M.F.; Schmidt, M.S.; Boisen, A.; Sun, Y. Quantitative Detection of Trace Level Cloxacillin in Food Samples Using Magnetic Molecularly Imprinted Polymer Extraction and Surface-Enhanced Raman Spectroscopy Nanopillars. Anal. Chem. 2017, 89, 11484–11490. [Google Scholar] [CrossRef] [PubMed] [Green Version]
- Zhao, K.; Wu, C.; Deng, Z.; Guo, Y.; Peng, B. Preparation of Silver Decorated Silica Nanocomposite Rods for Catalytic and Surface-Enhanced Raman Scattering Applications. RSC Adv. 2015, 5, 52726–52736. [Google Scholar] [CrossRef]
- Li, Y.-T.; Qu, L.-L.; Li, D.-W.; Song, Q.-X.; Fathi, F.; Long, Y.-T. Rapid and Sensitive In-Situ Detection of Polar Antibiotics in Water Using a Disposable Ag–Graphene Sensor Based on Electrophoretic Preconcentration and Surface-Enhanced Raman Spectroscopy. Biosens. Bioelectron. 2013, 43, 94–100. [Google Scholar] [CrossRef] [PubMed]
- Ji, W.; Yao, W. Rapid Surface Enhanced Raman Scattering Detection Method for Chloramphenicol Residues. Spectrochim. Acta A Mol. Biomol. Spectrosc. 2015, 144, 125–130. [Google Scholar] [CrossRef]
- Ding, Y.; Zhang, X.; Yin, H.; Meng, Q.; Zhao, Y.; Liu, L.; Wu, Z.; Xu, H. Quantitative and Sensitive Detection of Chloramphenicol by Surface-Enhanced Raman Scattering. Sensors 2017, 17, 2962. [Google Scholar] [CrossRef] [Green Version]
- Xiao, D.; Jie, Z.; Ma, Z.; Ying, Y.; Guo, X.; Wen, Y.; Yang, H. Fabrication of Homogeneous Waffle-like Silver Composite Substrate for Raman Determination of Trace Chloramphenicol. Microchim. Acta 2020, 187, 593. [Google Scholar] [CrossRef]
- Li, Y.; Tang, S.; Zhang, W.; Cui, X.; Zhang, Y.; Jin, Y.; Zhang, X.; Chen, Y. A Surface-Enhanced Raman Scattering-Based Lateral Flow Immunosensor for Colistin in Raw Milk. Sens. Actuators B Chem. 2019, 282, 703–711. [Google Scholar] [CrossRef]
- Sutherland, W.S.; Laserna, J.J.; Angebranndt, M.J.; Winefordner, J.D. Surface-Enhanced Raman Analysis of Sulfa Drugs on Colloidal Silver Dispersion. Anal. Chem. 1990, 62, 689–693. [Google Scholar] [CrossRef]
- Markina, N.E.; Markin, A.V.; Weber, K.; Popp, J.; Cialla-May, D. Liquid-Liquid Extraction-Assisted SERS-Based Determination of Sulfamethoxazole in Spiked Human Urine. Anal. Chim. Acta 2020, 1109, 61–68. [Google Scholar] [CrossRef] [PubMed]
- Shi, Q.; Huang, J.; Sun, Y.; Yin, M.; Hu, M.; Hu, X.; Zhang, Z.; Zhang, G. Utilization of a Lateral Flow Colloidal Gold Immunoassay Strip Based on Surface-Enhanced Raman Spectroscopy for Ultrasensitive Detection of Antibiotics in Milk. Spectrochim. Acta A Mol. Biomol. Spectrosc. 2018, 197, 107–113. [Google Scholar] [CrossRef]
- Gatta, M.M.F.; Mendez, M.E.; Romano, S.; Calvo, M.V.; Dominguez-Gil, A.; Lanao, J.M. Pharmacokinetics of Amikacin in Intensive Care Unit Patients. J. Clin. Pharm. Ther. 1996, 21, 417–421. [Google Scholar] [CrossRef]
- Roberts, J.A.; Paul, S.K.; Akova, M.; Bassetti, M.; De Waele, J.J.; Dimopoulos, G.; Kaukonen, K.-M.; Koulenti, D.; Martin, C.; Montravers, P.; et al. DALI: Defining Antibiotic Levels in Intensive Care Unit Patients: Are Current Lactam Antibiotic Doses Sufficient for Critically Ill Patients? Clin. Infect. Dis. 2014, 58, 1072–1083. [Google Scholar] [CrossRef]
- Lorenzen, J.M.; Broll, M.; Kaever, V.; Burhenne, H.; Hafer, C.; Clajus, C.; Knitsch, W.; Burkhardt, O.; Kielstein, J.T. Pharmacokinetics of Ampicillin/Sulbactam in Critically Ill Patients with Acute Kidney Injury Undergoing Extended Dialysis. Clin. J. Am. Soc. Nephrol. CJASN 2012, 7, 385–390. [Google Scholar] [CrossRef] [PubMed] [Green Version]
- Ismail, R.; Teh, L.K.; Choo, E.K. Chloramphenicol in Children: Dose, Plasma Levels and Clinical Effects. Ann. Trop. Paediatr. 1998, 18, 123–128. [Google Scholar] [CrossRef] [PubMed]
- Nahid, P.; Mase, S.R.; Migliori, G.B.; Sotgiu, G.; Bothamley, G.H.; Brozek, J.L.; Cattamanchi, A.; Cegielski, J.P.; Chen, L.; Daley, C.L.; et al. Treatment of Drug-Resistant Tuberculosis. An Official ATS/CDC/ERS/IDSA Clinical Practice Guideline. Am. J. Respir. Crit. Care Med. 2019, 200, e93–e142. [Google Scholar] [CrossRef]
- Tsuji, B.T.; Pogue, J.M.; Zavascki, A.P.; Paul, M.; Daikos, G.L.; Forrest, A.; Giacobbe, D.R.; Viscoli, C.; Giamarellou, H.; Karaiskos, I.; et al. International Consensus Guidelines for the Optimal Use of the Polymyxins: Endorsed by the American College of Clinical Pharmacy (ACCP), European Society of Clinical Microbiology and Infectious Diseases (ESCMID), Infectious Diseases Society of America (IDSA), International Society for Anti-Infective Pharmacology (ISAP), Society of Critical Care Medicine (SCCM), and Society of Infectious Diseases Pharmacists (SIDP). Pharmacotherapy 2019, 39, 10–39. [Google Scholar] [CrossRef] [PubMed]
- Galar, A.; Muñoz, P.; Valerio, M.; Cercenado, E.; García-González, X.; Burillo, A.; Sánchez-Somolinos, M.; Juárez, M.; Verde, E.; Bouza, E. Current Use of Daptomycin and Systematic Therapeutic Drug Monitoring: Clinical Experience in a Tertiary Care Institution. Int. J. Antimicrob. Agents 2019, 53, 40–48. [Google Scholar] [CrossRef] [PubMed]
Figure 1.
(A) Antimicrobial concentration–time curves. (B) Pharmacokinetic and pharmacodynamic parameters of antimicrobials at steady state. %fT>MIC, the percentage of time for which a drug’s concentration remains above the minimum inhibitory concentration (MIC) for a dosing period; Cmax/MIC, the ratio of the maximum antimicrobial concentration (Cmax) to MIC; fAUC/MIC, the ratio of the area under the concentration–time curve during a 24 h time period (AUC0–24 h) to MIC.

Figure 2.
PK/PD classification of most common antimicrobial agents in intensive care units.

Figure 3.
(A) SERS spectra for different amounts of cloxacillin deposited on the nanopillar substrate. SERS intensities were normalized to improve visual clarity. (B) The nonlinear calibration plot (n = 3). Each ratio of intensity was averaged over 121 spectra obtained in a 1 mm × 1 mm droplet footprint. Reproduced with permission from [79]. Copyright 2017 American Chemical Society.

Figure 4.
An example of urine sample preparation and LLE procedure. Reproduced with permission from [87]. Copyright 2022 Elsevier.
Figure 4.
An example of urine sample preparation and LLE procedure. Reproduced with permission from [87]. Copyright 2022 Elsevier.

Figure 5.
Setup, vertical flow, and detection schematic. Vertical flow using a microporous membrane scheme separates the flucytosine from the serum. SEM of the inkjet-printed AgNPs on cellulose paper is shown. The SERS signal is read from the paper SERS sensors. Reproduced with permission from [52]. Copyright 2017 Elsevier.
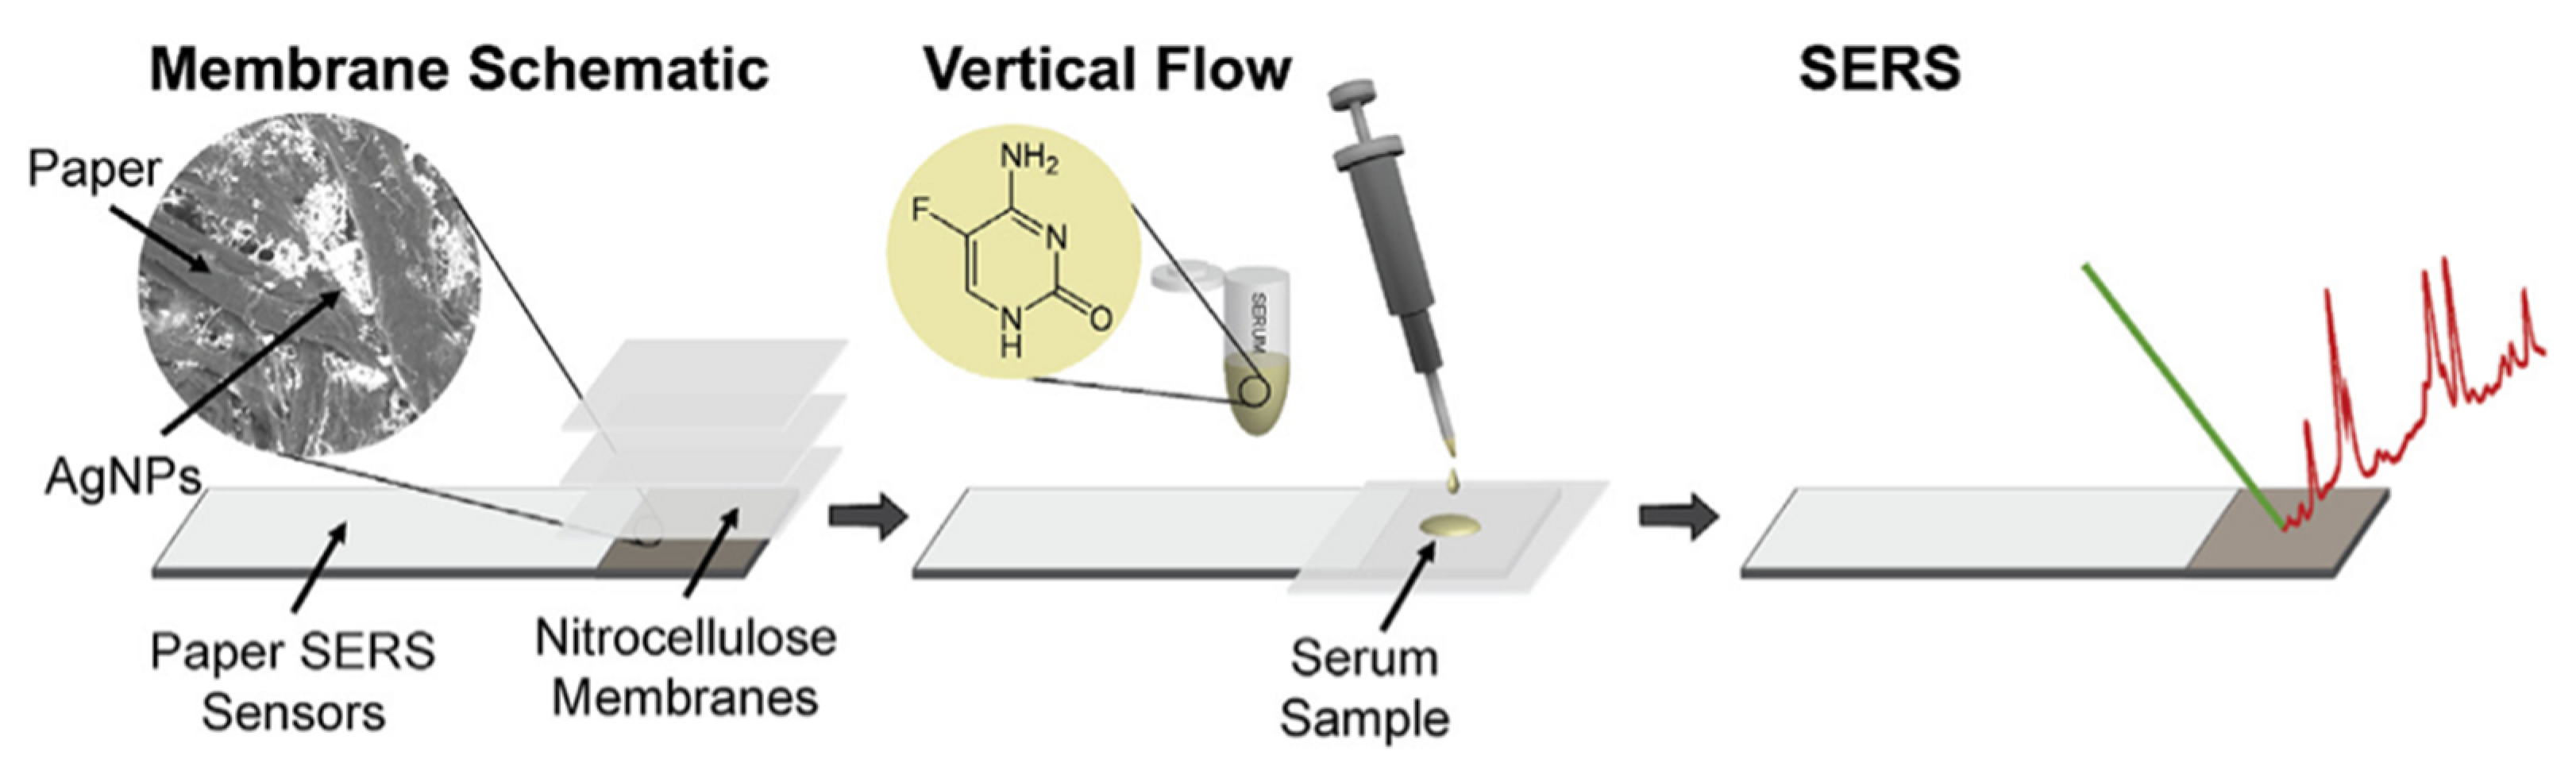
Figure 6.
PLS prediction plots for spiked human urine samples (three individual, S1, S2 and S3, and three pooled urine samples, P0, P1 and P2) using seven concentrations for training (black scatter) and five (red scatter) for predicting. Reproduced with permission from [66]. Copyright 2016 American Chemical Society.


Table 1.
Comparison of different technologies for determining antimicrobials levels in biofluids.
| Method | Multianalyte | Pros | Cons | Cost/Analysis |
|---|---|---|---|---|
| Immunoassay | No | Commercially available for most AM; simple to perform; direct from primary tube | Low accuracy; interferences from other drugs; may measure combined activity of parent and metabolites; time-consuming calibration. | High |
| LC-MS/MS | Yes | High sensitivity and accuracy | Initial costs; complexity of technology; not widely available; time consuming. | Medium |
| HPLC with UV/DAD detection | Yes | Widespread technology; commercially available assays; high accuracy | Manual sample preparation; subject to interference from various substances; run times may be slow. | Low |
| SERS | Yes | No need for sample preparation; fast measurement; ready for POC-T | Very often high RSD of the SERS substrates; method optimization needed for each drug. | Low |
HPLC, high-performance liquid chromatography; LC-MS/MS, liquid chromatography combined with tandem mass spectrometry; POC-T, point-of-care testing.
Table 2.
A summary of the selected SERS-based application for the detection and quantification of antimicrobial agents in different matrices.
Table 2.
A summary of the selected SERS-based application for the detection and quantification of antimicrobial agents in different matrices.
| Family | Analytes | Substrate | Laser | Matrix | LOD | LOQ | Ref |
|---|---|---|---|---|---|---|---|
| Aminoglycosides | Amikacin | cAg | 532 | water | na | na | [49] |
| Neomycin | SERS-LFA | 633 | milk | 0.37 pg/mL | na | [50] | |
| Tobramycin | Au-DTNB NPs | 633 | human serum | na | na | [51] | |
| Antifungal | 5-flucytosine | sAg | 785 | serum | 12.1 μg/mL | na | [52] |
| Voriconazole | cAu | 785 | plasma | na | na | [53] | |
| AntiTB | Isoniazid | cAG | 488 | water | 5 ng | na | [54] |
| Carbapenems | Meropenem | sAu | 785 | plasma | na | na | [55] |
| Cephalosporins | Cefazolin | cAg | 638 | urine | na | na | [56] |
| Cefazolin | cCu | 638 | urine | 8.8 μg/mL | 90 ng/mL | [57] | |
| Cefoperazone | cAg | 638 | urine | na | na | [56] | |
| Cefoperazone | cCu | 638 | urine | 36 μg/mL | 1 pM | [57] | |
| Cefotaxime | cAg | 638 | urine | na | na | [56] | |
| Ceftazidime | sAg | 785 | water | na | na | [58] | |
| Ceftriaxone | CaCO3-Cu-NPs | 633 | water | 5 μM | 89 ng/mL | [59] | |
| Ceftriaxone | cCu | 638 | urine | 7.5 μg/mL | 19 μg/mL | [57] | |
| Ceftriaxone | cAg | 638 | urine | na | na | [56] | |
| Ceftriaxone | cAg | 473 | urine | 0.4 μg/mL | 45 μg/mL | [60] | |
| Cefuroxime | cAg | 638 | urine | na | na | [56] | |
| Fluoroquinolones | Ciprofloxacin | Ag-TiO2 NPs | 633 | water | 70.8 pM | 34 μg/mL | [61] |
| Ciprofloxacin | SERS-LFA | 633 | milk | 0.57 pg/mL | na | [50] | |
| Ciprofloxacin | cAg | 514 | water | 0.1 μM | 0.1 mM | [62] | |
| Ciprofloxacin | sAg | 785 | water | na | na | [63] | |
| Ciprofloxacin | Au NRs | 633 | water | 0.01 ppm | 92 μg/mL | [64] | |
| Ciprofloxacin | sAg | 785 | water | 0.351 ppb | 2 μg/mL | [65] | |
| Enoxacin | Ag-TiO2 NPs | 633 | water | 315 pM | 280 μg/mL | [61] | |
| Levofloxacin | cAg | 532 | urine | 0.07 mM | na | [66] | |
| Levofloxacin | EC-SERS | 785 | synthetic urine | na | na | [67] | |
| Levofloxacin | Au@Ag NRs | 633 | water | 0.37 ng/L | na | [68] | |
| Levofloxacin | cAu | 633 | mice blood | na | 1 ppm | [69] | |
| Levofloxacin | optical fiber nano-probe | 633 | mice blood | na | na | [70] | |
| Moxifloxacin | sAg | 514 | water | 100 nM | na | [71] | |
| Moxifloxacin | sAu | 785 | urine | 0.085 μg/mL | na | [72] | |
| Ofloxacin | cAg | 532 | methanol | 23.5 ng/mL | na | [73] | |
| Macrolide | Erythromycin | cAg | 532 | water/ethanol | na | na | [74] |
| Monobactam | Aztreonam | cAg | 633 | water | na | na | [75] |
| Penicillins | Amoxicillin | sAg | 785 | water | 2.4 nM | na | [76] |
| Amoxicillin | cCu, Cu-GO | 785 | water | 0.0157 μM | na | [77] | |
| Ampicillin | cAg | 533 | water | 27 ng/mL | na | [78] | |
| Cloxacillin | sAu | 780 | methanol/acetic acid (9:1) | 7.8 pmol | 0.15 μg/mL | [79] | |
| Penicillin G | SiO2@Ag-NRs | 532 | water | 0.001 nM | 72.6 ng/mL | [80] | |
| Penicillin G | Ag-GO | 785 | water | 0.3 nM | na | [81] | |
| Penicillin G | cAg | 533 | water | 29 ng/mL | na | [78] | |
| Phenicols | Chloramphenicol | cAu | 785 | water | 0.1 μg/mL | na | [82] |
| Chloramphenicol | cAu | 785 | eye drops | 0.01 μM | na | [83] | |
| Chloramphenicol | sAg | 633 | honey | 4 ng/mL | na | [84] | |
| Polymixins | Colistin | SERS-LFIA | 785 | milk | 0.10 ng/mL | na | [85] |
| Sulfanilamides | Sulfadiazine | cAg | 514 | water | 1 ng/mL | na | [86] |
| Sulfamethoxazole | cAg | 488 | urine | 1.7 μg/mL | na | [87] |
cAg, silver colloidal nanoparticles; cAu, gold colloidal nanoparticles; cCu, colloidal copper nanoparticles; GO, graphene oxide; LFIA, lateral flow immunoassay; NRs, nanorods; sAu, gold solid substrate; sAg, silver solid substrate.
Table 3.
Availability of SERS-based methods for the TDM of most commonly used antimicrobial agents.
| DRUG | Effective Concentrations (μM) | Toxic Concentrations (Cmin, μM) | Protein Bound Fraction (%) | TDM | SERS Method | Ref |
|---|---|---|---|---|---|---|
| Amikacin | 7–14 (trough); 25–43 (peak) | >14 (trough); >55 (peak) | <10 | required | + | [89] |
| Amoxicillin | 86–172 | >988 | 18 | recommended for ICU patients | ++ | [90] |
| Ampicillin-sulbactam | 23–106 | >106 | 28 | recommended for ICU patients | ++ | [91] |
| Aztreonam | 207–376 | 56 (36–43) | recommended for ICU patients | + | [12] | |
| Cefazolin | 88–176 | 74–86 | recommended for ICU patients | +++ | [90] | |
| Cefepime | 10–73 | >46 | 20 | recommended for ICU patients | +++ | [90] |
| Cefotaxime | 65–132 | 35–45 | recommended for ICU patients | +++ | [90] | |
| Ceftazidime | 64–146 | <10 | recommended for ICU patients | ++ | [90] | |
| Ceftriaxone | 44–120 | 95 | recommended for ICU patients | ++ | [90] | |
| Chloramphenicol | 31–77 | >77 | 50–60 | required | ++ | [92] |
| Ciprofloxacin | 3–30 | unclear | 20–40 | recommended for ICU patients | ++ | [12] |
| Clofazimine | 1–4 | 99.99 | recommended (TB) | nr | [93] | |
| Cloxacillin | 46–115 | 95 | recommended for ICU patients | + | [12] | |
| Colistin | unclear | >2 | 69–74 | required with prolonged dosing | ++ | [94] |
| Daptomycin | <15 | >15 | 90–93 | neither recommended nor discouraged | nr | [95] |
| Ertapenem | 11–21 (trough) | 85–95 cd | recommended for ICU patients | nr | [90] | |
| Fluconazole | >33–49 (trough) | 11–12 | neither recommended nor discouraged | nr | [12] | |
| 5-Flucytosine | 194–387 (trough); 387–775 (peak) | >775 | 3–4 | neither recommended nor discouraged | +++ | [12] |
| Gentamycin | <4 (trough); 10–21 (peak) | >4 (trough); >25 (peak) | 0–30 | required | nr | [12] |
| Isoniazid | 22–51 (peak, 300 mg dose) *; 66–131 (peak, 900 mg dose) * | >146 | <10–15 | recommended | ++ | [93] |
| Itraconazole | 0.7–1.4 | <6 | 99.8 | required | nr | [12] |
| Levofloxacin | 0.83–36 | unclear | 24–38 | recommended for ICU/TB patients | +++ | [12,93] |
| Linezolid | 6–21 | >21 | 31 | recommended for ICU/TB patients | nr | [12,93] |
| Meropenem | 21–42 | >145 | ~2 | recommended for ICU/TB patients | +++ | [12,93] |
| Moxifloxacin | 3–12 | unclear | 50 | recommended for ICU/TB patients | +++ | [12,93] |
| Ofloxacin | 2–28 | unclear | 32 | recommended for ICU patients | + | [12] |
| Oxacillin | 1–5 | >411 | 94.2 +/− 2.1 | recommended for ICU patients | nr | [90] |
| Piperacillin | 155–310 (Css) | >1000 | 51.7 | recommended for ICU patients | nr | [90] |
| Rifampicin | 10–29 (Peak) * | >67 | 86.1–88.9 | recommended for ICU patients | nr | [12] |
| Sulfamethoxazole | unclear | 395–592 | 70 | neither recommended nor discouraged | +++ | [12] |
| Ticarcillin | ~843 | 45 | recommended for ICU patients | nr | [12] | |
| Tigecycline | 0.1–1 | 71–89 | recommended for ICU patients | nr | [12] | |
| Tobramycin | <4 (trough); 10–21 (peak) | >4 (through); >26 (peak); | <10 | required | +++ | [12] |
| Vancomycin | 3–7 (trough); 14–28 (peak) | >7 (trough); >55 (peak) | 55 | required | nr | [12] |
| Voriconazole | 1–6 (trough) | 14–17 | 58 | required | +++ | [12] |
* Two hours post-dose; ICU, intensive care unit; Css, concentration at steady state; +++, quantifiable within the range of effective concentrations (biofluid); ++, semi-quantifiable (water/other matrix); +, qualitative report; nr, not reported.
Publisher’s Note: MDPI stays neutral with regard to jurisdictional claims in published maps and institutional affiliations. |
© 2022 by the authors. Licensee MDPI, Basel, Switzerland. This article is an open access article distributed under the terms and conditions of the Creative Commons Attribution (CC BY) license (https://creativecommons.org/licenses/by/4.0/).
Share and Cite
MDPI and ACS Style
Fornasaro, S.; Cialla-May, D.; Sergo, V.; Bonifacio, A. The Role of Surface Enhanced Raman Scattering for Therapeutic Drug Monitoring of Antimicrobial Agents. Chemosensors 2022, 10, 128. https://doi.org/10.3390/chemosensors10040128
AMA Style
Fornasaro S, Cialla-May D, Sergo V, Bonifacio A. The Role of Surface Enhanced Raman Scattering for Therapeutic Drug Monitoring of Antimicrobial Agents. Chemosensors. 2022; 10(4):128. https://doi.org/10.3390/chemosensors10040128
Chicago/Turabian StyleFornasaro, Stefano, Dana Cialla-May, Valter Sergo, and Alois Bonifacio. 2022. "The Role of Surface Enhanced Raman Scattering for Therapeutic Drug Monitoring of Antimicrobial Agents" Chemosensors 10, no. 4: 128. https://doi.org/10.3390/chemosensors10040128
Note that from the first issue of 2016, this journal uses article numbers instead of page numbers. See further details here.