
Design and Characterization of a Microwave Transducer for Gas Sensing Applications


1
Department of Engineering, University of Messina, 98158 Messina, Italy
2
School of Electrical Engineering, Georgia Institute of Technology, Atlanta, GA 30332, USA
3
Department of Biomedical and Dental Sciences and Morphofunctional Imaging, University of Messina, 98125 Messina, Italy
*
Author to whom correspondence should be addressed.
Chemosensors 2022, 10(4), 127; https://doi.org/10.3390/chemosensors10040127
Submission received: 11 February 2022
/
Revised: 19 March 2022
/
Accepted: 25 March 2022
/
Published: 29 March 2022
(This article belongs to the Special Issue Gas Sensors: Simulation, Modeling, and Characterization)
Abstract
:Gas sensors have wide applications in several fields, spanning diverse areas such as environmental monitoring, healthcare, defense, and the evaluation of personal and occupational exposure to hazardous chemicals. Different typologies of gas sensors have been proposed over the years, such as optical, electrochemical, and metal oxide gas sensors. In this paper, a relatively new typology of gas sensors is explored: the microwave gas sensor. It consists of a combination of a microwave transducer with a nanostructured sensing material deposited on an interdigitated capacitor (IDC). The device is designed and fabricated on a Rogers substrate (RO4003C) using microstrip technology, and investigated as a microwave transducer over the frequency range from 1 GHz to 6 GHz by measuring the scattering (S) parameters in response to gas adsorption and desorption. The sensing material is based on a nano-powder of barium titanate oxalate with a coating of urea (BaTiO(C2O4)2/CO(NH2)2). It is deposited on the IDC surface by drop coating, thus creating a sensing film. The developed prototype has been tested toward different oxygen (O2) concentrations and exhibits a sensitivity of 28 kHz/%O2. Special attention has been devoted to the measurement process. Besides the canonical short-open-load-thru (SOLT) calibration of the measured S-parameters, a thru-reflect-line (TRL) calibration has been performed in order to get rid of the parasitic electromagnetic (EM) contributions of the board connectors and the feedlines, thus moving the measurement reference planes to the edges of the IDC.
1. Introduction
Nanotechnology has witnessed tremendous progress, especially in recent years because of its wide applications. This technology provides the opportunity to manipulate and organize matter systematically at the nanometric scale. In this field, special attention has been devoted to the development of new nanostructured materials with features and properties sometimes quite distinct from the corresponding bulk materials. In general, nanostructured materials may be defined as those materials whose structural elements (clusters, crystallites or molecules) have dimensions in the range from 1 nm to 100 nm. Their special structure makes them more advantageous to specific applications.
Nanostructured materials are used in many scientific areas such as chemistry, biology, medicine, and engineering. However, a common thread in these areas is represented by sensors and, in general, by sensing applications. Biosensors based on nanostructured material have been widely used for the identification of viral pathogens [1,2]. More recently, nanomaterial-based sensors have been employed for the detection of severe acute respiratory syndrome coronavirus 2 (SARS-CoV-2), the virus responsible for the coronavirus disease 2019 (COVID-19) that has caused a global pandemic [3]. Because of their porous structure, nanostructured materials have been successfully used for gas detection, involving several typologies including electrochemical gas sensors [4], metal oxide (MOX) gas sensors [5,6,7,8] and microwave gas sensors [9,10].
The main advantage of the use of nanomaterials over the more common bulk materials is that the surface-to-volume ratio significantly increases for the adsorbed target gas. This leads to improved sensitivity, reduced power consumption, and reduced operating temperature. Moreover, the sensor response as well as recovery times are usually faster using nanomaterials. MOX sensors are today the predominant solid-state gas detecting devices for environmental, healthcare, and industrial applications [5,6,7,8].
A relatively new frontier of gas sensors is represented by microwave gas sensors. They are usually characterized by a propagative structure (e.g., a microwave planar resonator) surrounded by a sensing film, often in the form of a nanostructured material. The sensing principle is based on the propagation and reflection of electromagnetic (EM) waves into the sensitive material. When exposed to the gas target, the gas molecules interact with the sensing material surface and this may cause a change in the sensing material complex permittivity defined as follows:
The real part εr′ represents the energy stored in the material and is often referred to as dielectric constant. The imaginary part εr″, also known as dielectric loss factor, is related to the material conductivity [11,12]. After gas interaction with the sensing material, a conductivity change (i.e., a change in the imaginary part of the complex permittivity) may vary the amplitude of the reflected/transmitted signal. On the other hand, a resonance frequency shift is linked to a change in the real part of the complex permittivity [12].
Since the propagation characteristics of the EM wave are related to the chemical and physical properties of the propagation medium (i.e., the sensing material), the gas molecules adsorbed on the material surface affect the measured reflection and transmission scattering (S-) parameters. In particular, variations in both modulus and phase of the S-parameters are observed due to gas adsorption and desorption on the film surface. Such variations can be easily quantified and related to the target gas to be characterized. More details on the microwave transduction principle for gas sensing applications, the nanomaterials used, the propagation structures, and the signal analysis can be found in [12].
Microwave gas sensors have several advantages over the other competing technologies: they can work at ambient temperature with fast response and recovery times, the fabrication processes are the same as those used for manufacturing conventional printed circuit boards, and they are considered low-power devices. Moreover, since they work in the microwave frequency range, they are inherently compatible with wireless technology. They can be easily integrated into electronic boards and/or coupled to antennas thus making wireless sensor nodes. Several advances are described in the literature in which a microwave gas sensor is combined with an antenna with the aim of developing a low-cost and reliable wireless sensor node [13,14,15,16,17,18].
In the past decade, several microwave-based gas sensors have been proposed. In [19], a planar capacitor working in microwave range is covered by a nanostructured sensing material and explored as a sensor for harmful gases to monitor environmental pollution. In [9], Bailly et al. used a microstrip interdigital capacitor surrounded by a sensing layer of titanium dioxide (TiO2) nanoparticles for the detection of ammonia concentration in the range from 100 ppm to 500 ppm. More recently, Sadabadi et al. proposed a reconfigurable platform for toxic gas detection based on a microwave ring resonator [10]. Microwave transducers have been employed for the detection of oxygen [20,21], humidity [13,22], ammonia [23], and volatile organic compounds [24].
In this work, a microwave transducer is explored as a gas sensor by depositing a nanostructured sensing material on its surface. A two-port interdigital capacitor (IDC) is employed for this purpose. It is designed using microstrip technology for operation in the frequency range from 1 GHz to 6 GHz. After the IDC design and fabrication, a nano-powder of barium titanate oxalate (BaTiO(C2O4)2) with a coating of urea (CO(NH2)2) is deposited by drop-coating on the IDC surface to prepare the sensing film. The combination of IDC and the sensing material (referred to as the device under test or DUT) is finally tested in a controlled atmosphere as an oxygen sensor. By using a fully automatic gas bottle controlled-flow system, the fabricated device is subjected to a binary gas mixture made by nitrogen (N2) and oxygen (O2) with different concentrations, from 0% O2 (100% N2) to 100% O2 (0% N2). The response of the microwave device in terms of scattering parameters is measured and evaluated using a vector network analyzer (VNA).
The innovation in this paper involves special attention devoted to the sensor response measurement process. Before carrying out the tests on the DUT, the VNA needs to be calibrated thereby allowing subtraction of the contributions associated with the cables, connectors, and feedlines. To do so, besides the conventional short-open-load-thru (SOLT) standards, in this research custom thru-reflect-line (TRL) standards are designed and fabricated based on the IDC template. The calibration process then involves two steps. First, the VNA is calibrated using the commercial SOLT calibration standards, which establishes the reference plane at the apertures of the coaxial connectors to be connected to the DUT. Next, the S-parameters of the TRL standards are measured using SOLT calibration, and the offline post-processing of these parameters results in an improved SOLT + TRL (henceforth referred to as TRL) calibration. The proposed TRL standards enable improvement of the measurement accuracy by moving the measurement reference planes from the coaxial connector interface to the edges of the studied IDC structure. Thus, unlike the conventional SOLT calibration, the TRL calibration compensates for the effects of the connector transitions between coaxial and microstrip lines and the length of the microstrip feed lines connected to the DUT.
The article is organized as follows. Section 2 is divided into four subsections: the first part is devoted to the description of the design and fabrication of the microwave device (i.e., the IDC); the TRL calibration and the developed standards are briefly described in the second subsection; the details of the nanostructured material are provided in the third subsection, and finally the measurement setup is presented in the last subsection. The tests involving exposure to O2 gas, and the measured results, subjected to TRL calibration, are reported and discussed in Section 3, while conclusive remarks are presented in Section 4.
2. Materials and Methods
In this section the design and fabrication of the studied IDC are presented. This design has been previously used as a sensing element of a sensor-integrated patch antenna [13,25] but the sensing performance of the IDC without the antenna has not been characterized. In this paper, TRL calibration is used to characterize the IDC as a microwave transducer for O2 detection without the effect of the connecting transmission lines, connectors and the antenna. Unlike the integrated antenna sensor described in [13] where only the reflected wave is considered, the prototype proposed in this paper is a two-port device wherein both reflected and transmitted EM waves are considered for the device characterization. In this section a detailed description of the design and fabrication of the TRL standards and the microwave measurement setup is presented. The synthesis of the sensing material and its deposition on the microwave transducer is described. The application of TRL calibration to the measured S-parameters of the IDC is discussed in Section 3.
2.1. Microwave Transducer Design and Fabrication
The IDC has been designed using a multi-finger configuration based on the connection in parallel of ten fingers with a length and width of 11.5 mm and 0.5 mm, respectively, and a spacing of 0.5 mm. The substrate selected in this project is Rogers RO4003C characterized by a thickness of 1.52 mm, a dielectric constant εr = 3.38, and a loss tangent tan δ = 0.0027. A sketch of the IDC design is depicted in Figure 1a. Two microstrip lines acting as feedlines for the two-port signals to the IDC are included. Their width is selected considering the substrate parameters (i.e., thickness and dielectric constant) in order to have a line impedance of 50 Ω. The overall dimensions of the prototype are 25 mm × 25 mm × 1.52 mm. Due to a symmetrical network (i.e., S11 = S22 and S21 = S12), only S11 and S21 will be considered in the final DUT measurements. However, all the four S-parameters are considered in measuring the TRL standards.
The device is fabricated employing the LPKF Protomat s103 rapid prototyping milling machine. After fabrication, the board is burnished and two coaxial SMA connectors are soldered at the end of the two feedlines as input and output ports. This allows the connection of the device to the vector network analyzer for tests and measurements. A photo of the final prototype is shown in Figure 1b.
2.2. TRL Calibration Standards
In microwave engineering, before performing measurements on the DUT, the vector network analyzer needs to be calibrated in order to get rid of systematic errors such as effects of the cables, non-ideal loads, frequency dispersion etc. This SOLT calibration, performed using well-characterized, verified and validated commercial coaxial transmission line and load standards, shifts the reference planes to the coaxial connector interfaces at the two edges of the printed circuit board. Often, it is desirable to move the measurement reference planes further down to the edges of the DUT (e.g., the IDC). In these cases, a TRL calibration can be applied to increase the calibration accuracy.
While SOLT calibration is based on well-defined coaxial reference standards, on the other hand, the TRL calibration involves design and measurement of DUT-specific standards in the microstrip or other non-standard transmission line medium containing the DUT. While the SOLT calibration is useful to remove the contributions of the coaxial cables, the TRL calibration is used to move the measurement reference planes from the coaxial interface to the microstrip interface on the printed circuit board. This additional calibration using the TRL standards removes the effects of coaxial connector transitions and microstrip feedlines. This is the reason why TRL calibration is especially useful for on-wafer measurements. On the other hand, the TRL calibration method suffers from some disadvantages as well. At higher frequencies (usually above 6 GHz), the measurement accuracy can be strongly dependent on the repeatability and quality of the employed TRL standards. In order to reach a higher accuracy, it is needed to rigorously consider the non-ideality of the standards, like fringe EM fields, temperature stability of the dielectric substrate, and mechanical tolerances of the printed conductors and the boards.
In this activity, calibration is carried out using both SOLT and TRL standards. The former are commercially available standards (Agilent 85052 mechanical calibration kit), whereas the latter are developed on purpose based on the IDC design template. The idea of using both standards is to remove the effects of coaxial cables, connector transitions and the microstrip feedlines, and move the measurement planes to the edges of the IDC. The SOLT calibration is performed by connecting the commercial standards to the VNA and following the standard calibration procedure recommended by the manufacturer. On the other hand, the TRL calibration is performed “offline” by using the Scikit-rf tool [26] to process the SOLT-calibrated measurements with the TRL standards. Scikit-rf is a Python package designed for microwave engineering applications. It allows basic operations on microwave networks (e.g., reading/writing Touchstone files, de-embedding operations, interpolations, plotting, etc.,) as well as advanced ones like VNA calibration, vector fitting, and the extraction of statistical network properties. Moreover, Scikit-rf is capable of directly communicating with VNAs [26]. Among all the features provided by Scikit-rf, we utilize the offline TRL calibration. The term “offline” refers to the fact that the calibration is not made onboard the VNA but rather performed on a computer by using the calibration algorithms provided by Scikit-rf.
As suggested by the name, the TRL calibration involves three standards: the “thru”, the “reflect”, and the “line”. There are no stringent rules for the design of these standards [27,28]. A brief description of the common rules is reported below.
- Thru standard: it includes the two feed lines connected together without the DUT in the middle.
- Reflect standard: it can be made by using either an open or a short in order to obtain 180° phase shift. Usually, an open standard is recommended at lower frequencies.
- Line standard: it is a microstrip line that should be designed with an electrical length between 20° and 160° in the frequency range of interest. It is recommended to have at least 20° at the minimum operating frequency and 160° at the higher frequency limit. If it is not possible to cover the entire frequency range with a single line standard, multiple line standards can be employed to perform the TRL calibration.
The custom-made TRL standards employed in this work are designed to be used in the frequency range from 1 GHz to 6 GHz. They are intended to move the measurement reference planes to the IDC edges. For this reason, their geometry is selected starting from the IDC design and their design is optimized considering the operating frequency range and the rules described above. Moreover, the same substrate material that is used for the IDC fabrication (i.e., Rogers RO4003C) should be employed for the TRL standards as well. The design of the TRL standards is conducted by using CST Studio (Student Edition) software. The three standards are then fabricated and characterized using the VNA.
A picture of the developed TRL standards is shown in Figure 2. As reflect, an “open” standard is preferred for two reasons: (1) It is easier to fabricate since it is not necessary to include vias in the board; (2) the IDC working frequency is not very high and the open circuit fringing effects can be considered negligible.
A comparison of simulations and measurements of the TRL standards in terms of S-parameters is depicted in Figure 3. Good agreement can be observed in the frequency range from 1 GHz to 5 GHz. Therefore, this range is considered for the IDC calibration. It is noted that the simulated results overlap in the symmetrical S-parameters whereas slight differences exist in the measured symmetry of the S-parameters due to imperfections at the coax-microstrip junctions. The line standard offers a phase difference (lag) between 20° and 160° in the frequency range from 1 GHz to 5 GHz. The simulation results do not include the effects of the coaxial-microstrip transitions at the edges of the board, and therefore discrepancies can be observed at the higher frequencies (above 5 GHz), especially in the phase of the Line standard. The isolation between the ports (Figure 3b) is better than 60 dB. The simulation results are not used in the TRL calibration. Only the S-parameter measurements of the standards are utilized.
2.3. Sensing Material Synthesis and Deposition
A nano-powder of barium titanate oxalate with a coating of urea (BaTiO(C2O4)2/CO(NH2)2) is deposited on the IDC surface by drop coating. The synthesis of this sensing material is similar to that described in [13,29,30]. First, barium chloride (BaCl2) is mixed with water (300 mL) at 60 °C. The obtained composite is then stirred for a few minutes in order to obtain a stable BaCl2 solution, which is defined as Solution A. A second solution is made by mixing 300 mL of water (60 °C) with oxalic acid (H2C2O4). Later, after its solubilization, titanium tetrachloride (TiCl4) is added to the compound, thus making the so-called Solution B. The two solutions are then stirred at 60 °C for one hour, leading to the creation of intermediate barium titanate (BaTiO(C2O4)2). The obtained composite is then filtered, cleaned, and placed inside a muffle furnace for 12 h at 80 °C. The precipitate is dispersed in a solution of urea with a ratio of 1:3 and mixed for half an hour. The formed BaTiO(C2O4)2/CO(NH2)2 is filtered, washed with water, and dried once again in the oven at 80 °C for 12 h.
The final product looks like white powder. The scanning electron microscopy (SEM) reveals the presence of nanoparticle agglomerates with a maximum size of 5 µm. Such structures have a spherical shape and appear to be formed by primary grains of nanometric size. The presence of these grains is revealed by the transmission electron microscopy (TEM) analysis. In particular, the TEM analysis highlights that each grain is made by an inner core of barium titanate in crystalline form and an external amorphous coating of urea with a thickness of 4 ± 1 nm. Further details on the sensing material synthesis and on its structural characterization are available in [13].
The synthesized sensing material is finally suspended in water and deposited on the IDC surface by drop coating. Only the material between the fingers is left (with a thickness of approximately 17 μm), whereas the material in excess is removed. The resultant device (i.e., IDC + sensing material) is dried and then tested in a controlled gas atmosphere. Further details on the measurement setup and the obtained results are reported in Section 2.4 and Section 3, respectively.
2.4. Measurement Setup
The prototype IDC sample is placed inside a three-dimensional (3D)-printed test chamber, whose small volume (about 40 cm3) ensures rapid gas evacuation. The chamber is designed with an inner cylindrical shape to avoid turbulence effects and dead volumes during the measurement. The chamber is also characterized by some holes for potential connections; two of them are used for connection of the gas inlet and outlet pipes, other two apertures are used for connection of the two-port DUT to the instrument through the RF cables. A picture of the test chamber is shown in Figure 4a.
The combination of IDC + sensing material (i.e., the DUT) is tested with two gas mixtures: a reference and a target. The reference line is made by pure nitrogen (N2), while the target line contains a binary gas mixture composed of a variable concentration of O2 (from 0% to 100%) and N2. The gas control system is fully automated and consists of certified gas bottles and mass flow controllers. They allow the selection of the preferred gas mixture in order to get a controlled atmosphere inside the testing chamber. Therefore, the gas control system allows selecting the gas mixture, setting the concentration value for each gas, and controlling/monitoring the gas flow.
A picture of the experimental measurement setup is shown in Figure 4b. It consists of the gas control system, the measurement chamber holding the sample, the Agilent 8753ES VNA, and a desktop computer used for real-time measurement acquisition and recording.
3. Results
The IDC combined with the sensing material is tested using different concentrations of oxygen, from 0% (pure N2) to 100% (no N2 inside the test chamber) in six different steps. Measurements were made by alternating the target line (N2 + O2) with the reference line (N2 only) and the sensor exhibited a good reversibility since the response reached its baseline every time the reference line was connected to the test chamber. For each oxygen set-point, the device response is evaluated in terms of S-parameter responses. In particular, the S11 and S21 parameters are acquired in order to examine how the changes in oxygen concentration relate to response changes in the resonant frequency, the quality (Q) factor, and the amplitude at resonance.
It is reemphasized that while the SOLT calibration is performed onboard the VNA, the TRL calibration is performed as a post-processing operation by means of the Scikit-rf tool [25], previously described. The acquired S-parameters are processed by the Scikit-rf algorithm in conjunction with the measured S-parameters of the TRL standards (Figure 3). Noise is reduced by smoothing the acquired data points. As an output of the TRL algorithm, we get the DUT S-parameters without the contribution of connectors, transitions, and feedlines.
The proposed device is tested in the frequency range from 1 GHz to 6 GHz. In this interval, the IDC exhibits several resonant dips. Among these dips, we focus on the 4.4 GHz dip (see Figure 5) since it exhibits a good compromise between Q factor and amplitude. Moreover, it is within the band 1 GHz–5 GHz, in which the calibration standards are most effective (see Figure 3). For this reason, the 4.4 GHz dip is selected for examining the accuracy of TRL calibration toward various oxygen concentrations.
In the frequency range from 4.2 GHz to 4.6 GHz both S11 and S21 magnitudes display a dip, as shown in Figure 5a,b. It may be noted that both dips are affected by the oxygen content inside the test chamber. In particular, as the concentration increases, the resonant frequency undergoes a slight shift toward lower frequencies, and, at the same time, the dip amplitude decreases, as detailed in Figure 5c,d. A possible explanation to this behavior is that the O2 molecules, once adsorbed on the surface of the sensing material, interact with it, thus affecting both the real (εr′) and imaginary parts (εr″) of the complex permittivity. This results in a change of the dip amplitude and in a variation of the resonant frequency.
Even if it is not evident, the Q factor associated with the dips is affected too. To better highlight and quantify such variations, in Figure 6 we plot the change of the resonant frequency (fr), the Q factor, and the dip amplitude (A) as functions of the oxygen concentration (O2 %), for both S11 and S21 responses. The Q factor is calculated as the ratio between the resonant frequency and the half power bandwidth [31]. The resonant frequency is the frequency at which the S-parameter magnitude reaches a minimum value (A); while the half-power bandwidth is the frequency range at which the magnitude of the S-parameter is below the threshold of A + 3 dB. For these three resonant parameter features investigated in this work (i.e., fr, Q, and A), the sensor response can be considered linear with a good approximation. For the sake of completeness, the residual sum of squares, the adjusted R2, the line intercept, and slope along with their standard errors are reported in Table 1.
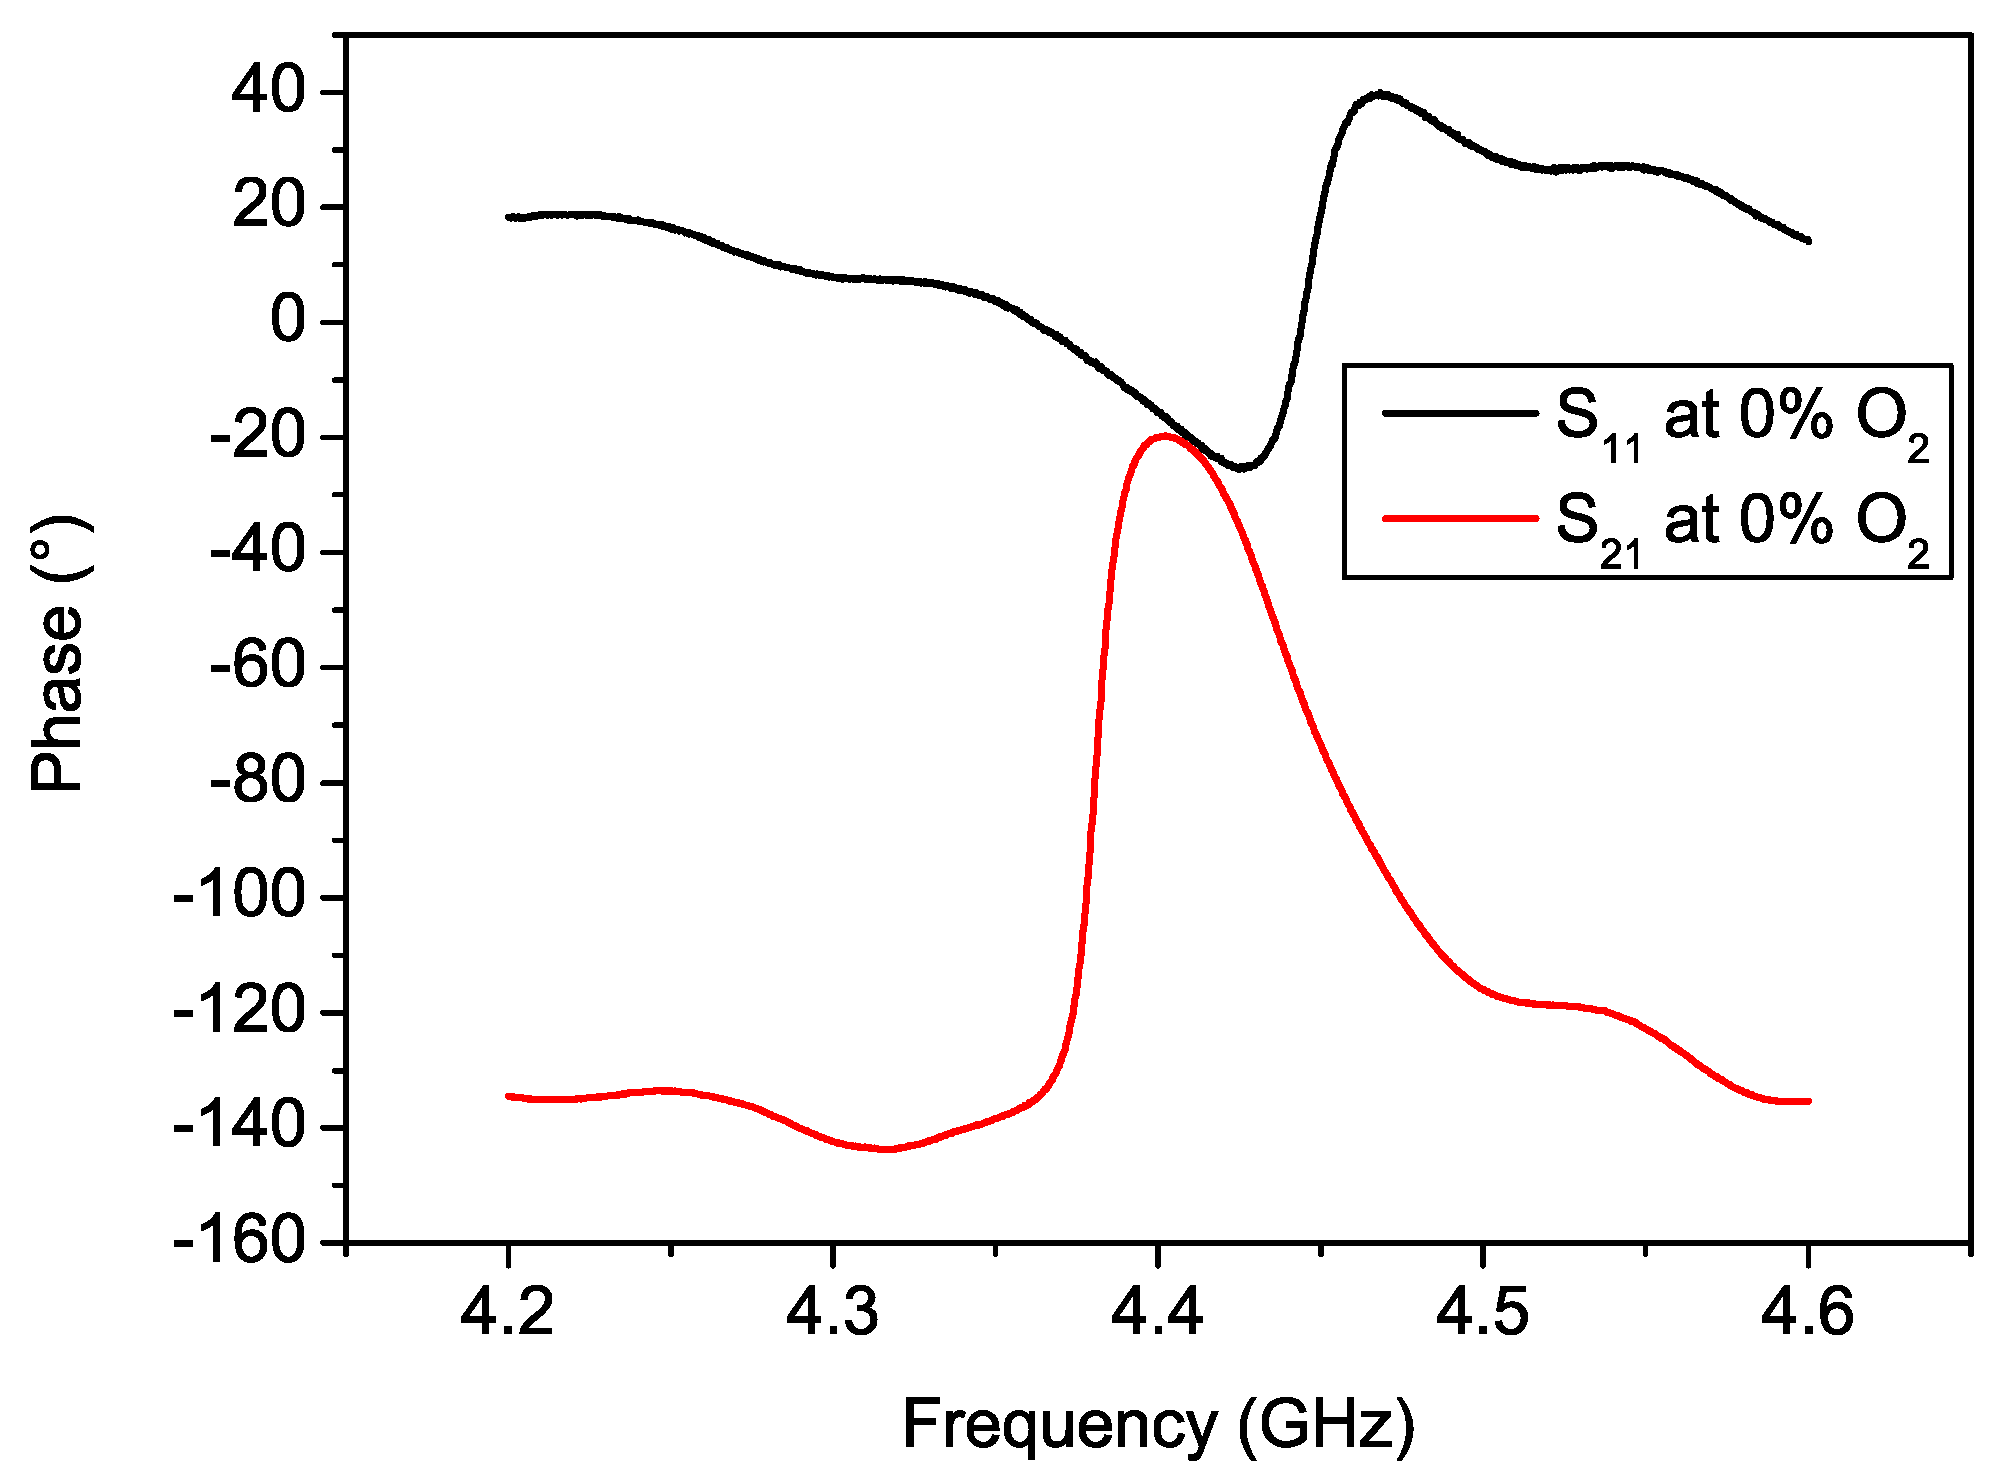
For microwave gas sensors the resonant frequency provides an attractive feature for tracking gas detection [22,23]. In order to investigate the validity of resonance, we plot the phase of both S11 and S21 as a function of frequency in Figure 7, using the response for 0% O2 for illustration. At resonance, the phase of S11 goes through zero and that of S21 reaches a maximum. Due to the damping losses and frequency dispersion of the sensor material, the S11 phase does not go through the ideal 180° phase shift and the resonant frequencies of S11 and S21 are slightly displaced. Nonetheless, the resonant behavior is quite evident.
Using the resonance frequency variation depicted in the calibration plots of Figure 6, we calculate a sensitivity of 28.0 kHz/%O2 for the S11 dip, and 23.6 kHz/%O2 for the S21 dip. On the other hand, the dip amplitude could be used instead [32,33] as a gas tracker. In this case, the sensor proposed has a sensitivity of 0.0031 dB/%O2 and 0.0043 dB/%O2 for S11 and S21, respectively.
4. Conclusions
In this paper, a microwave interdigitated capacitor coated with a sensitive nanomaterial is exploited as a gas sensor. It consists of a combination of a microwave propagative structure, i.e., an IDC, and a sensitive layer of barium titanate oxalate with a coating of urea. The device is tested in a controlled environment employing a fully automated gas control system characterized by certified gas bottles and mass flow controllers. The developed prototype is subjected to a binary mixture of O2 and N2, in which the O2 concentration is varied from 0% to 100% in six equally spaced steps. The device is sensitive to the oxygen variations, as demonstrated by the response changes observed in the resonant dip at about 4.4 GHz. In particular, the resonant frequency, the Q factor, and the dip amplitude in both S11 and S21 are computed for each O2 concentration set-point. A linear trend (R2 > 0.9) is observed for the selected resonant parameters and the sensitivity toward O2 is evaluated for each of them. It is worth noting that no saturation effects are recorded and the device exhibits a constant sensitivity and linear response in the entire measurement range of the oxygen concentrations explored.
Special attention is devoted to the TRL calibration process in this paper. Besides the conventional SOLT calibration, an offline TRL calibration is also carried out as a post-processing operation, compensating the effects of the board connectors, transitions, and the feedlines by moving the measurement reference planes to the edges of the IDC. The developed IDC microwave device could be potentially integrated into an antenna for a wireless node as demonstrated in [13].
As a future work, we are planning to extend the sensor characterization by evaluating its selectivity toward other gases and the potential effects of relative humidity changes and temperature drifts.
Author Contributions
Conceptualization, K.N.; methodology, K.N. and N.D.; formal analysis, G.G. and K.N.; investigation, G.G. and G.C.; data curation, G.G. and G.C.; writing—original draft preparation, G.G.; writing—review and editing, G.G., K.N., G.C. and N.D.; supervision, K.N. and N.D. All authors have read and agreed to the published version of the manuscript.
Funding
This research received no external funding.
Institutional Review Board Statement
Not applicable.
Informed Consent Statement
Not applicable.
Data Availability Statement
Not applicable.
Conflicts of Interest
The authors declare no conflict of interest.
References
- Mokhtarzadeh, A.; Eivazzadeh-Keihan, R.; Pashazadeh, P.; Hejazi, M.; Gharaatifar, N.; Hasanzadeh, M.; Baradaran, B.; de la Guardia, M. Nanomaterial-Based Biosensors for Detection of Pathogenic Virus. TrAC Trends Anal. Chem. 2017, 97, 445–457. [Google Scholar] [CrossRef]
- Castillo-Henríquez, L.; Brenes-Acuña, M.; Castro-Rojas, A.; Cordero-Salmerón, R.; Lopretti-Correa, M.; Vega-Baudrit, J.R. Biosensors for the Detection of Bacterial and Viral Clinical Pathogens. Sensors 2020, 20, 6926. [Google Scholar] [CrossRef] [PubMed]
- Bisht, A.; Mishra, A.; Bisht, H.; Tripathi, R.M. Nanomaterial Based Biosensors for Detection of Viruses Including SARS-CoV-2: A Review. J. Anal. Test. 2021, 5, 327–340. [Google Scholar] [CrossRef]
- Power, A.C.; Gorey, B.; Chandra, S.; Chapman, J. Carbon Nanomaterials and Their Application to Electrochemical Sensors: A Review. Nanotechnol. Rev. 2018, 7, 19–41. [Google Scholar] [CrossRef]
- Amiri, V.; Roshan, H.; Mirzaei, A.; Neri, G.; Ayesh, A.I. Nanostructured Metal Oxide-Based Acetone Gas Sensors: A Review. Sensors 2020, 20, 3096. [Google Scholar] [CrossRef] [PubMed]
- Mirzaei, A.; Kim, H.W.; Kim, S.S.; Neri, G. Nanostructured Semiconducting Metal Oxide Gas Sensors for Acetaldehyde Detection. Chemosensors 2019, 7, 56. [Google Scholar] [CrossRef] [Green Version]
- Navale, S.; Shahbaz, M.; Majhi, S.M.; Mirzaei, A.; Kim, H.W.; Kim, S.S. CuxO Nanostructure-Based Gas Sensors for H2S Detection: An Overview. Chemosensors 2021, 9, 127. [Google Scholar] [CrossRef]
- Marzorati, D.; Mainardi, L.; Sedda, G.; Gasparri, R.; Spaggiari, L.; Cerveri, P. MOS Sensors Array for the Discrimination of Lung Cancer and At-Risk Subjects with Exhaled Breath Analysis. Chemosensors 2021, 9, 209. [Google Scholar] [CrossRef]
- Bailly, G.; Harrabi, A.; Rossignol, J.; Stuerga, D.; Pribetich, P. Microwave Gas Sensing with a Microstrip InterDigital Capacitor: Detection of NH3 with TiO2 Nanoparticles. Sens. Actuators B Chem. 2016, 236, 554–564. [Google Scholar] [CrossRef]
- Sadabadi, H.; Bostani, A.; Esmaeili, A.S. Reconfigurable Modular Platform for Prolonged Sensing of Toxic Gases in Particle Polluted Environments. Chemosensors 2021, 9, 328. [Google Scholar] [CrossRef]
- Hallikainen, M. Microwave dielectric properties of materials. In Encyclopedia of Remote Sensing; Springer: New York, NY, USA, 2014; pp. 364–374. [Google Scholar]
- Li, F.; Zheng, Y.; Hua, C.; Jian, J. Gas Sensing by Microwave Transduction: Review of Progress and Challenges. Front. Mater. 2019, 6, 101. [Google Scholar] [CrossRef]
- Gugliandolo, G.; Naishadham, K.; Neri, G.; Fernicola, V.C.; Donato, N. A Novel Sensor-Integrated Aperture Coupled Microwave Patch Resonator for Humidity Detection. IEEE Trans. Instrum. Meas. 2021, 70, 9506611. [Google Scholar] [CrossRef]
- Lee, H.; Naishadham, K.; Tentzeris, M.M.; Shaker, G. A Novel Highly-Sensitive Antenna-Based “Smart Skin” Gas Sensor Utilizing Carbon Nanotubes and Inkjet Printing. In Proceedings of the 2011 IEEE International Symposium on Antennas and Propagation (APSURSI), Spokane, WA, USA, 3–8 July 2011; pp. 1593–1596. [Google Scholar]
- Lee, H.; Shaker, G.; Naishadham, K.; Song, X.; McKinley, M.; Wagner, B.; Tentzeris, M. Carbon-Nanotube Loaded Antenna-Based Ammonia Gas Sensor. IEEE Trans. Microw. Theory Tech. 2011, 59, 2665–2673. [Google Scholar] [CrossRef] [Green Version]
- Naishadham, K.; Bekyarova, E.; Savi, P. Passive Nanotechnology Based Sensors for the Remote Detection of Environmental Pollutants Impacting Public Health. In Proceedings of the 2017 IEEE Sensors, Glasgow, UK, 29 October–1 November 2017; pp. 1–3. [Google Scholar]
- Naishadham, K. Design of a Graphene Loaded Slot Antenna with 100:1 Bandwidth for Wireless Sensor Applications. In Proceedings of the 2014 IEEE Antennas and Propagation Society International Symposium (APSURSI), Memphis, TN, USA, 6–11 July 2014; pp. 894–895. [Google Scholar]
- Naishadham, K. Design of a Compact Wideband Slot Antenna Using Parasitic Reactive Tuning. In Proceedings of the 2014 44th European Microwave Conference, Rome, Italy, 6–9 October 2014; pp. 45–48. [Google Scholar]
- Bahoumina, P.; Hallil, H.; Lachaud, J.L.; Rebiere, D.; Dejous, C.; Abdelghani, A.; Frigui, K.; Bila, S.; Baillargeat, D.; Zhang, Q.; et al. Chemical Gas Sensor Based on a Novel Capacitive Microwave Flexible Transducer and Composite Polymer Carbon Nanomaterials. In Proceedings of the 2017 Symposium on Design, Test, Integration and Packaging of MEMS/MOEMS (DTIP), Bordeaux, France, 29 May–1 June 2017; pp. 1–4. [Google Scholar]
- Marinković, Z.; Gugliandolo, G.; Latino, M.; Campobello, G.; Crupi, G.; Donato, N. Characterization and Neural Modeling of a Microwave Gas Sensor for Oxygen Detection Aimed at Healthcare Applications. Sensors 2020, 20, 7150. [Google Scholar] [CrossRef] [PubMed]
- Gugliandolo, G.; Latino, M.; Campobello, G.; Marinkovic, Z.; Crupi, G.; Donato, N. On the Gas Sensing Properties of Microwave Transducers. In Proceedings of the 2020 55th International Scientific Conference on Information, Communication and Energy Systems and Technologies (ICEST), Niš, Serbia, 10–12 September 2020; pp. 161–194. [Google Scholar]
- Gugliandolo, G.; Aloisio, D.; Campobello, G.; Crupi, G.; Donato, N. On the Design and Characterisation of a Microwave Microstrip Resonator for Gas Sensing Applications. ACTA IMEKO 2021, 10, 54. [Google Scholar] [CrossRef]
- Bogner, A.; Steiner, C.; Walter, S.; Kita, J.; Hagen, G.; Moos, R. Planar Microstrip Ring Resonators for Microwave-Based Gas Sensing: Design Aspects and Initial Transducers for Humidity and Ammonia Sensing. Sensors 2017, 17, 2422. [Google Scholar] [CrossRef] [PubMed]
- Mohammadi, S.; Zarifi, M.H. Differential Microwave Resonator Sensor for Real-Time Monitoring of Volatile Organic Compounds. IEEE Sens. J. 2021, 21, 6105–6114. [Google Scholar] [CrossRef]
- Gugliandolo, G.; Naishadham, K.; Donato, N.; Neri, G.; Fernicola, V. Sensor-Integrated Aperture Coupled Patch Antenna. In Proceedings of the 2019 IEEE International Symposium on Measurements & Networking (M&N), Catania, Italy, 8–10 July 2019; pp. 1–5. [Google Scholar]
- Arsenovic, A.; Hillairet, J.; Anderson, J.; Forsten, H.; Ries, V.; Eller, M.; Sauber, N.; Weikle, R.; Barnhart, W.; Forstmayr, F. Scikit-Rf: An Open Source Python Package for Microwave Network Creation, Analysis, and Calibration. IEEE Microw. Mag. 2022, 23, 98–105. [Google Scholar] [CrossRef]
- Copper Mountain Technologies. Fabricating and Using a PCB-Based TRL Pattern with a CMT VNA. Available online: https://coppermountaintech.com/wp-content/uploads/2018/05/Design-and-Fabrication-of-a-TRL-Calibration-Kit.pdf (accessed on 15 November 2021).
- Microwaves101, TRL Calibration. Available online: https://www.microwaves101.com/encyclopedias/trl-calibration (accessed on 15 November 2021).
- Zhang, X.; Xu, L.; Wang, Q. Electro-Rheological Effect of Barium Titanate Particles Coated with Urea and Suspended in Methyl Silicone Oil. J. China Univ. Min. Technol. 2007, 17, 578–581. [Google Scholar] [CrossRef]
- Wen, W.; Huang, X.; Yang, S.; Lu, K.; Sheng, P. The Giant Electrorheological Effect in Suspensions of Nanoparticles. Nat. Mater. 2003, 2, 727–730. [Google Scholar] [CrossRef] [PubMed]
- Pozar, D.M. Microwave Wngineering; John Wiley & Sons: Hoboken, NJ, USA, 2011. [Google Scholar]
- Rossignol, J.; Harrabi, A.; Stuerga, D.; Pribetich, P.; Bailly, G.; Leblois, T. Critical Influence of Dielectric Sensitive Material and Manufactured Process in Microwave Gas-Sensing: Application of Ammonia Detection with an Interdigital Sensor. ACS Omega 2020, 5, 11507–11514. [Google Scholar] [CrossRef] [PubMed]
- Bailly, G.; Harrabi, A.; Rossignol, J.; Domenichini, B.; Bellat, J.P.; Bezverkhyy, I.; Pribetich, P.; Stuerga, D. Influence of the Design in Microwave-Based Gas Sensors: Ammonia Detection with Titania Nanoparticles. Procedia Eng. 2016, 168, 264–267. [Google Scholar] [CrossRef]
Figure 1.
Microwave transducer prototype: (a) Sketch of the IDC with dimensions; (b) photo of the fabricated device.
Figure 1.
Microwave transducer prototype: (a) Sketch of the IDC with dimensions; (b) photo of the fabricated device.
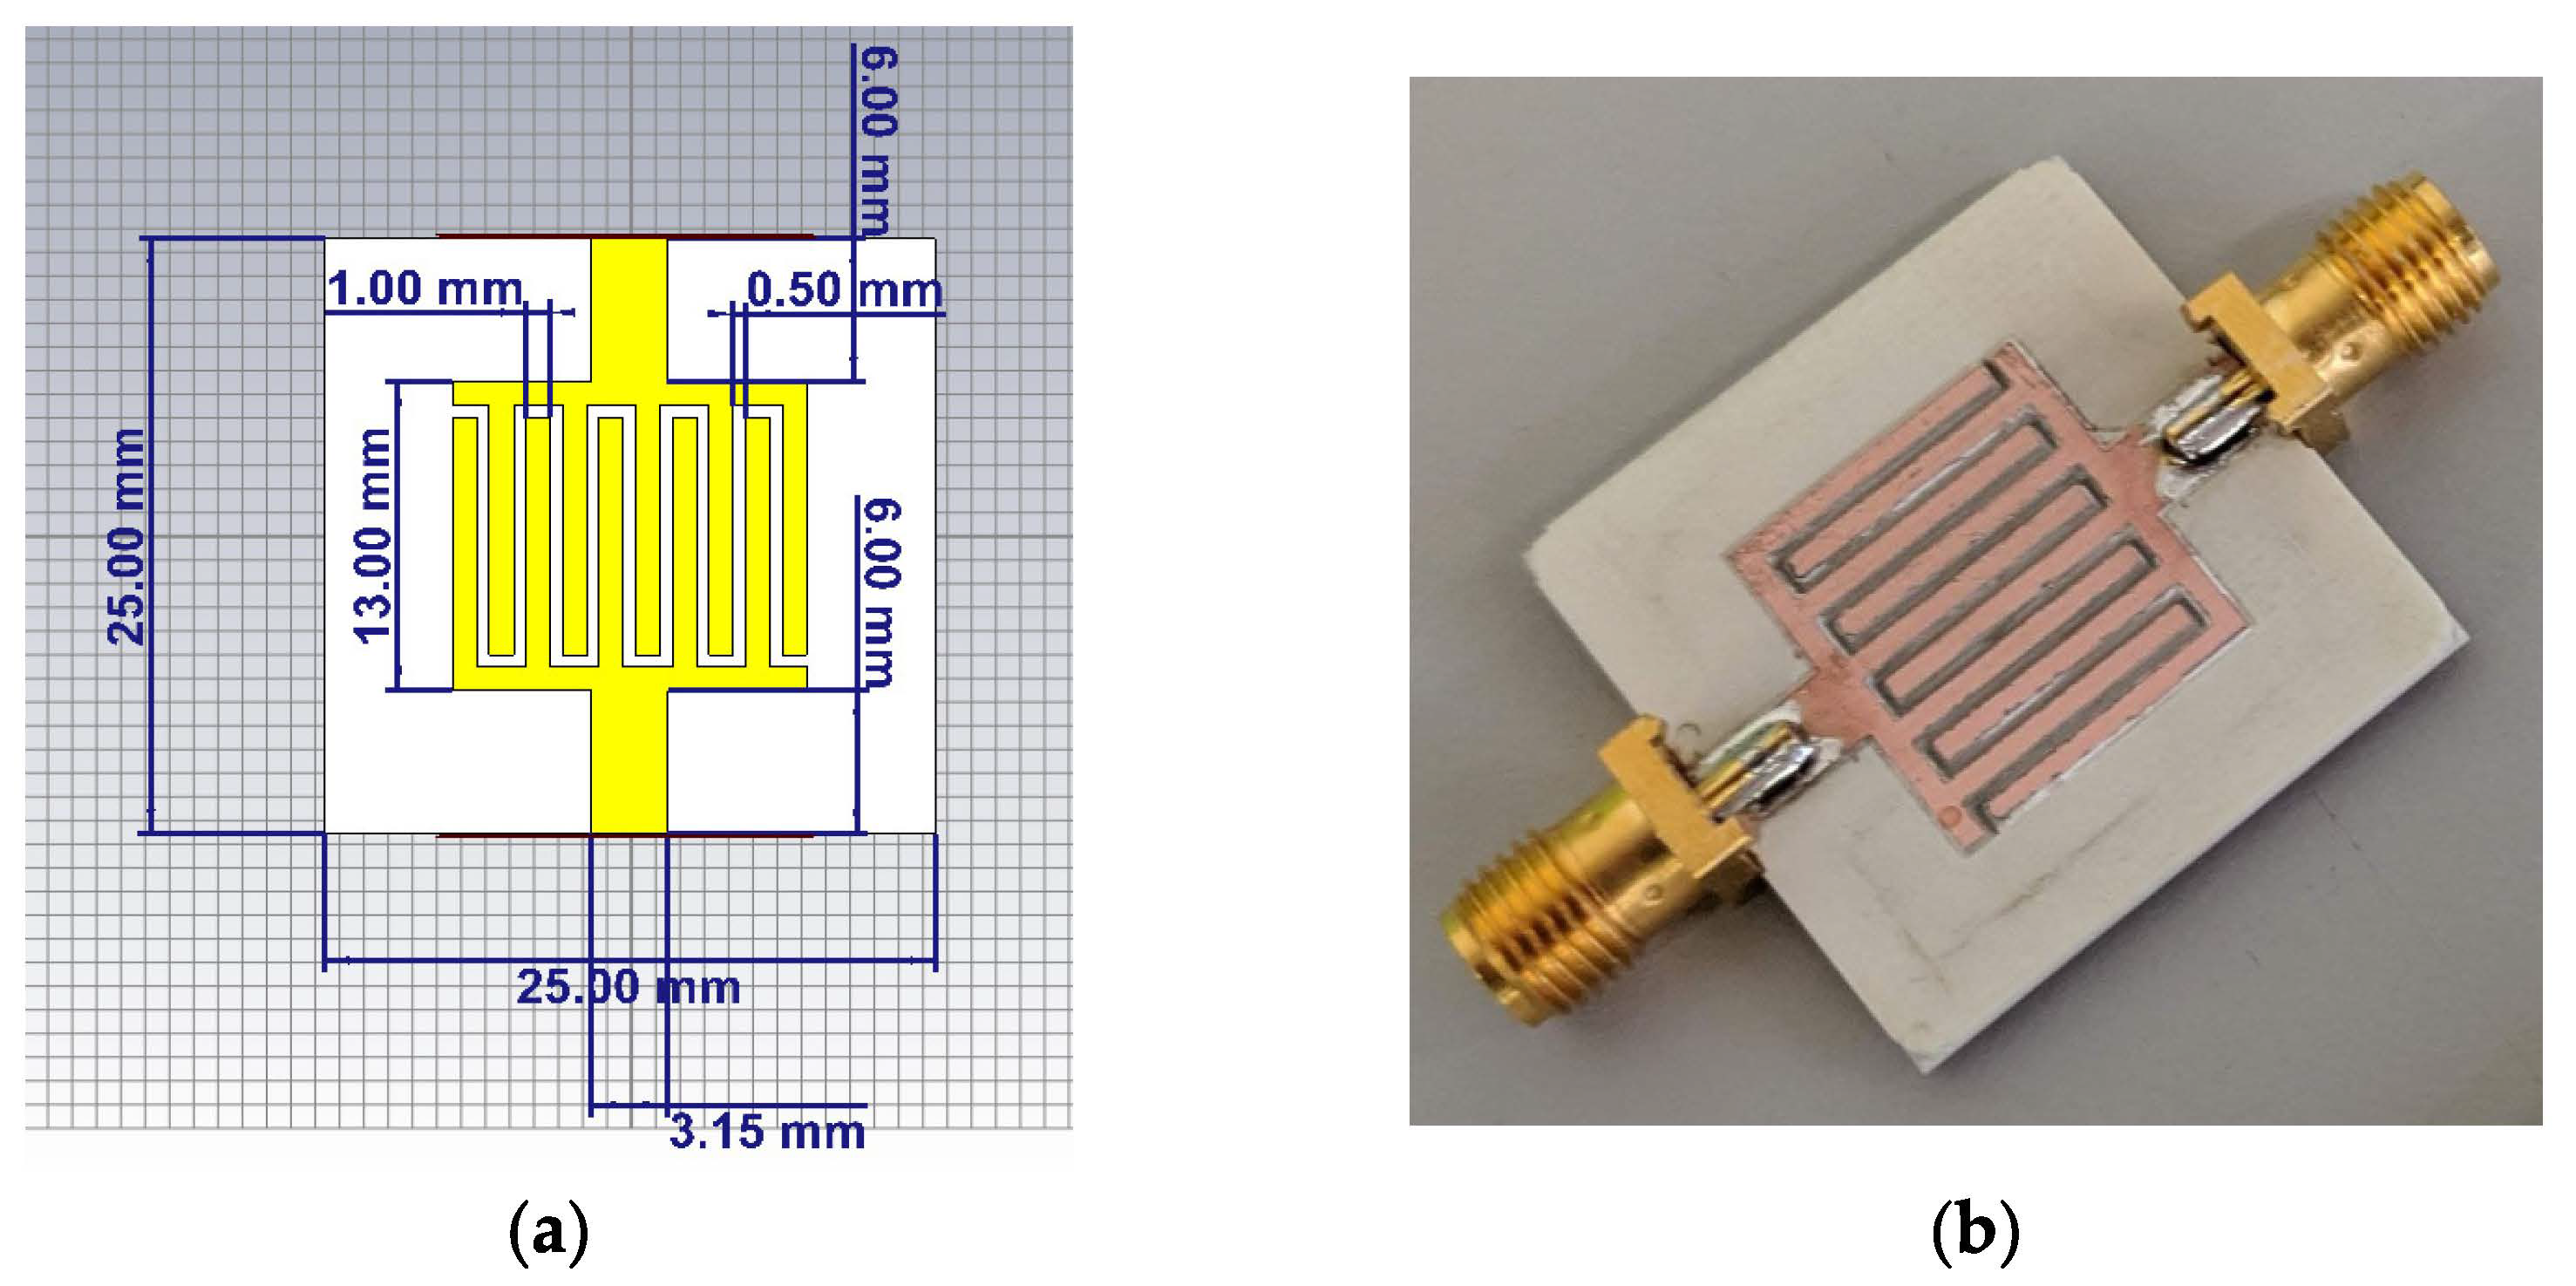
Figure 2.
Boards fabricated using the prototype PCB milling machine: the IDC device and the thru, reflect and line standards.
Figure 2.
Boards fabricated using the prototype PCB milling machine: the IDC device and the thru, reflect and line standards.
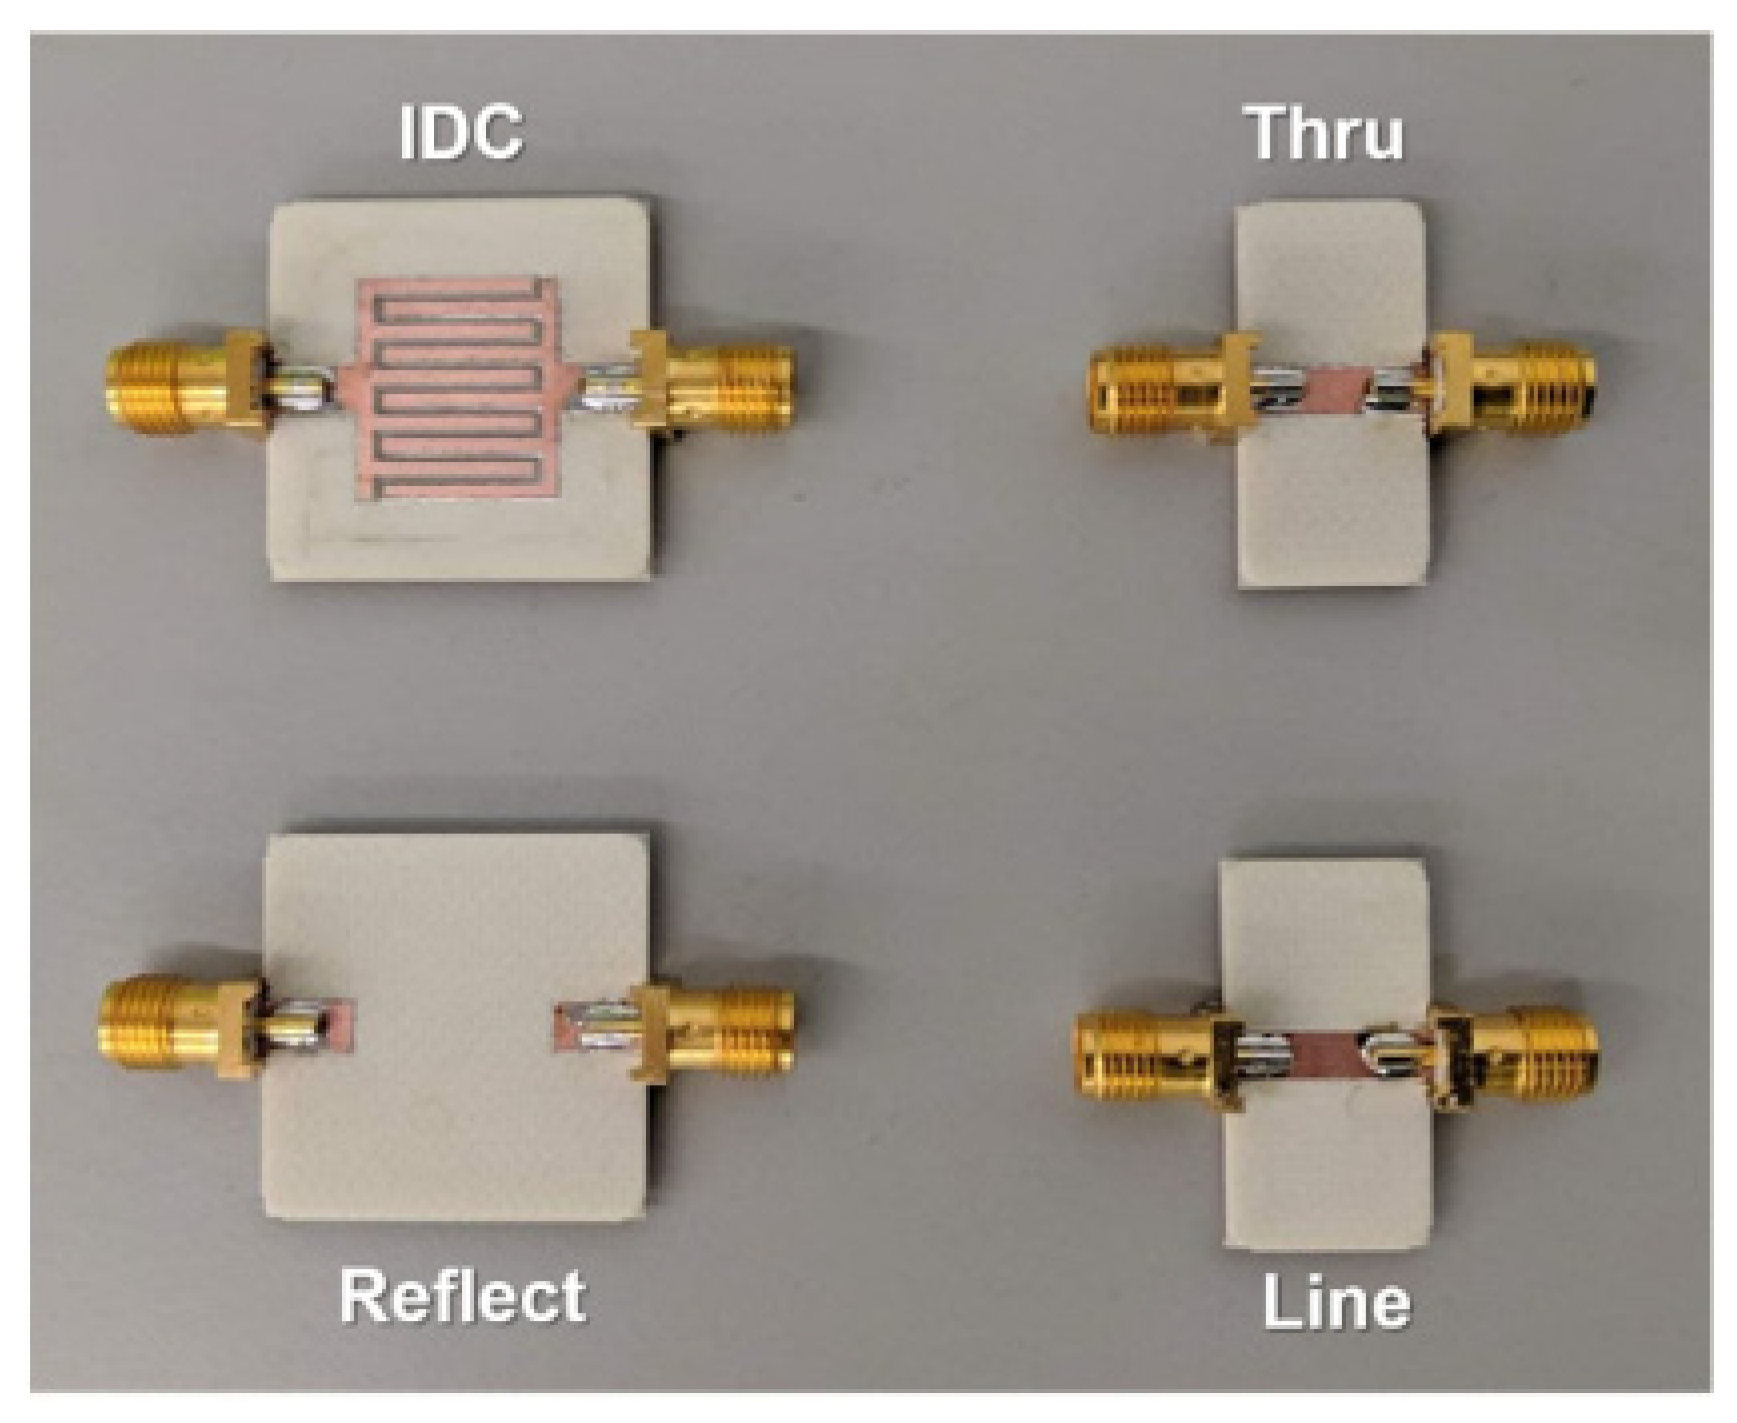
Figure 3.
Comparison between simulations and measurements of the S-parameters for the three TRL standards in the frequency range from 1 GHz to 6 GHz: (a) Thru standard (S-parameters magnitude comparison); (b) Reflect standard (S-parameters magnitude comparison); (c) Line standard (S-parameters magnitude comparison); and (d) Line standard (S21 phase comparison).
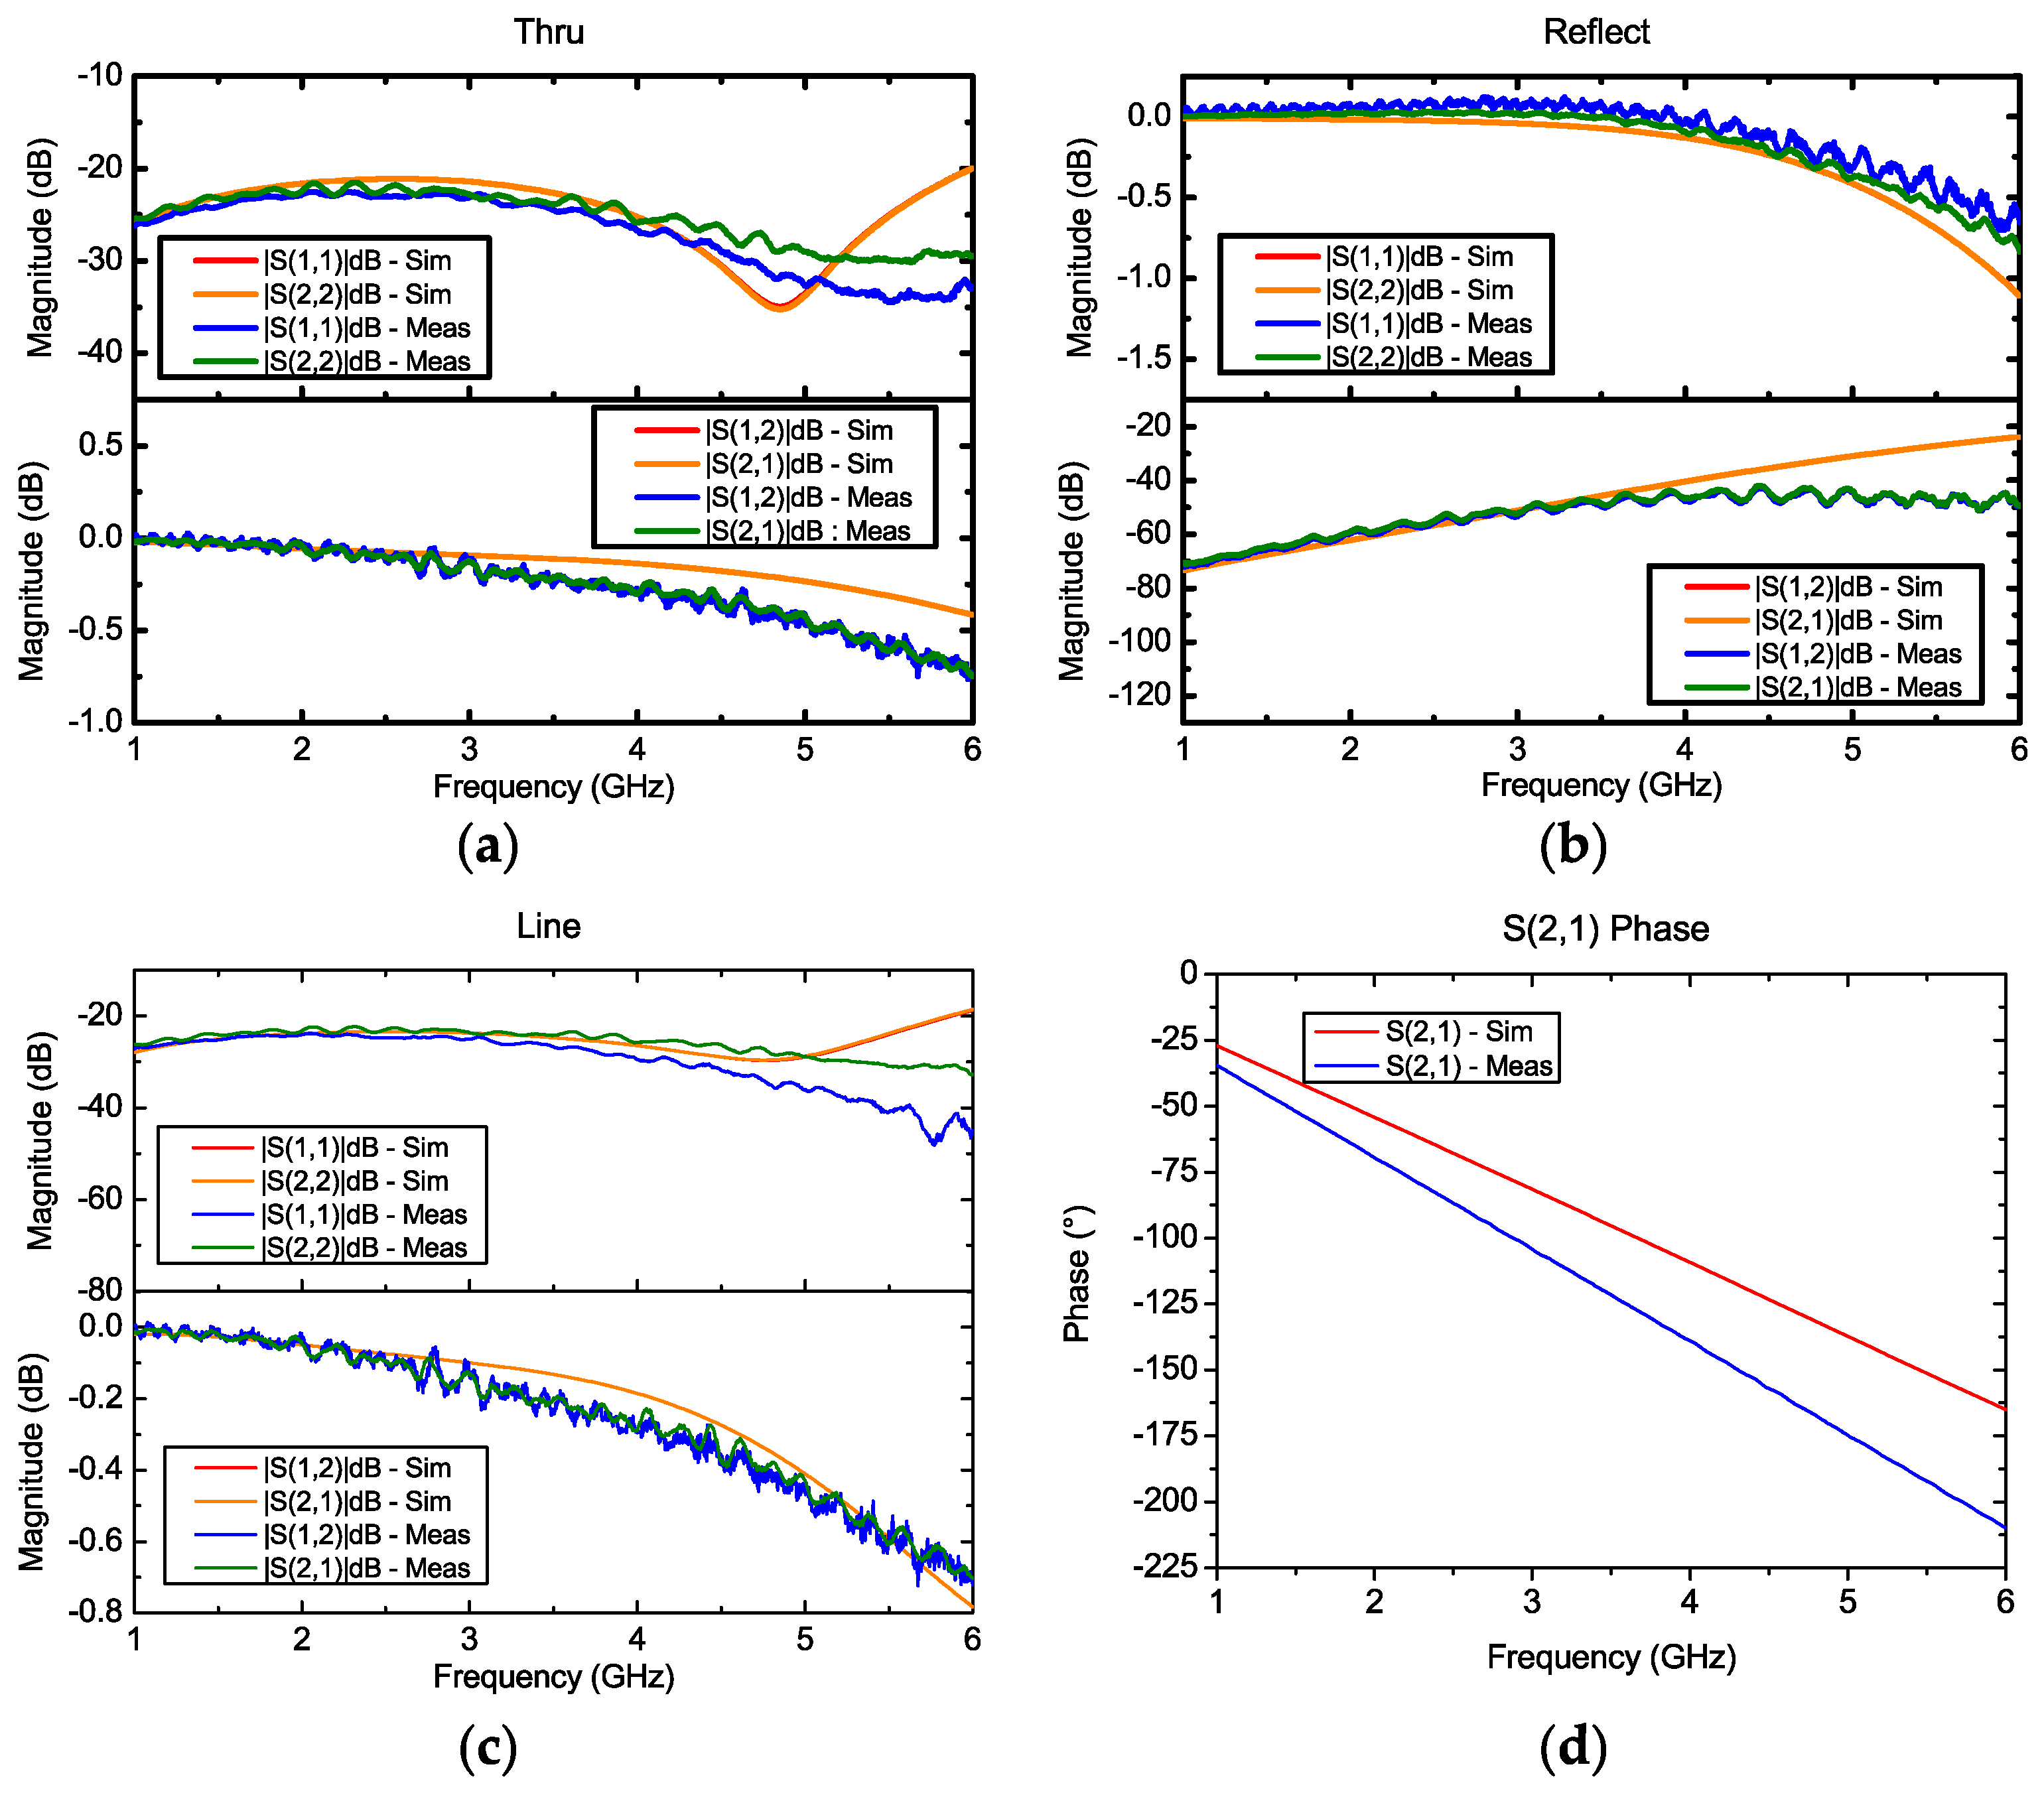
Figure 4.
(a) Test chamber containing the IDC covered by the sensing material. Two holes of the chamber are used for the inlet and outlet gas pipes, additional two holes are used for the RF cables connections, while the other two apertures are sealed with leak-proof plugs. (b) Picture of the experimental measurement setup.
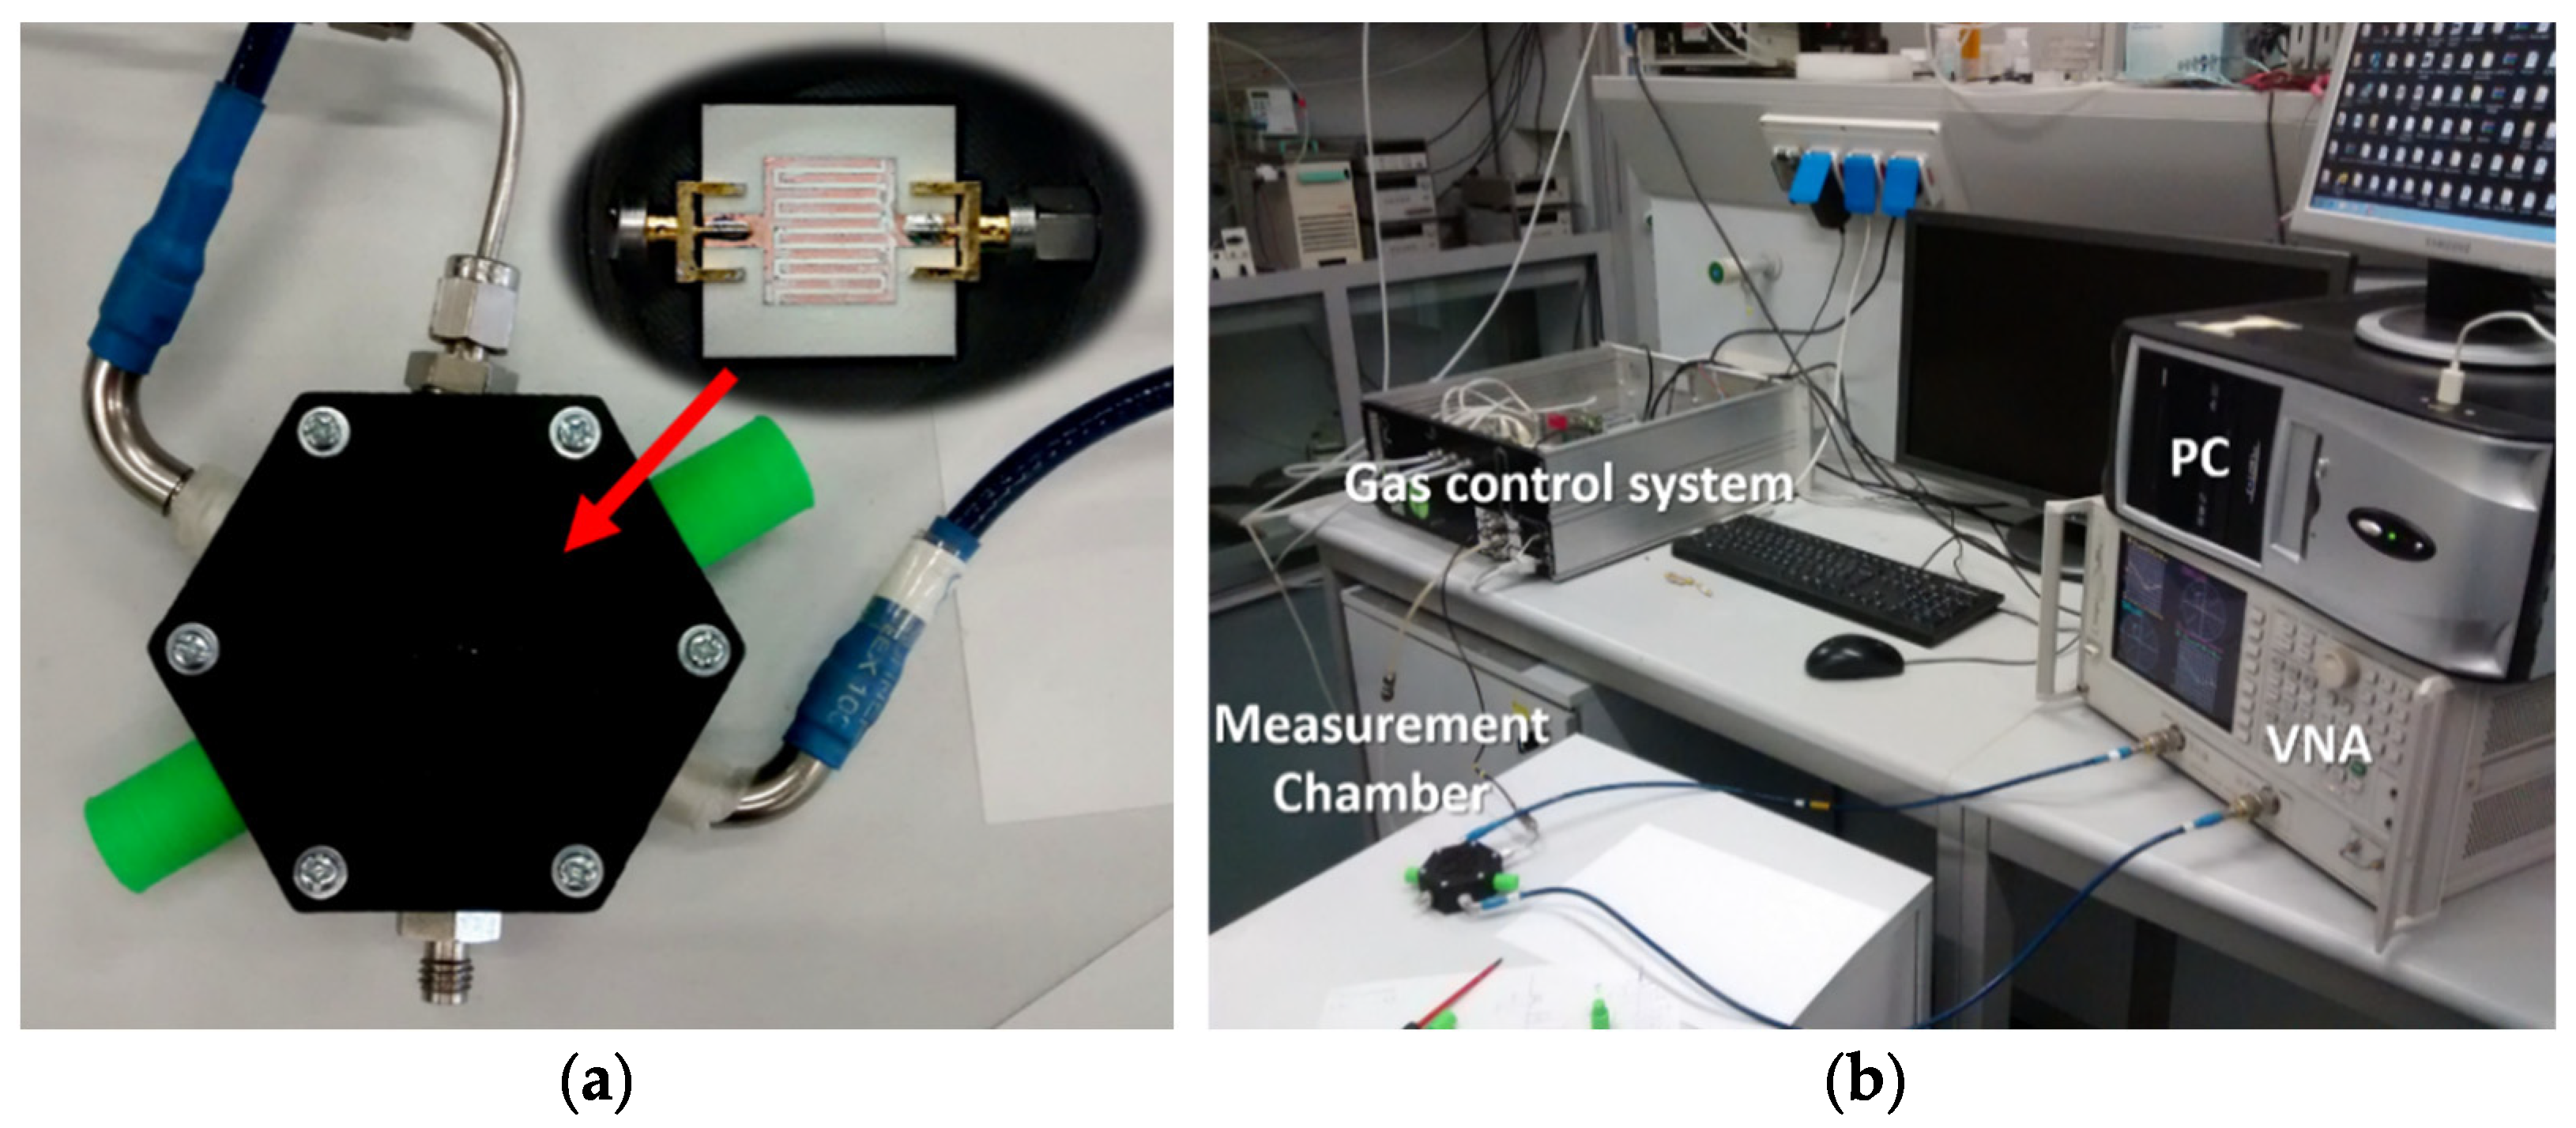
Figure 5.
Magnitude of S11 (a,c) and S21 (b,d) versus frequency for six different O2 concentrations, ranging from 0% O2 to 100% O2. The selected frequency range goes from 4.2 GHz to 4.6 GHz.
Figure 5.
Magnitude of S11 (a,c) and S21 (b,d) versus frequency for six different O2 concentrations, ranging from 0% O2 to 100% O2. The selected frequency range goes from 4.2 GHz to 4.6 GHz.
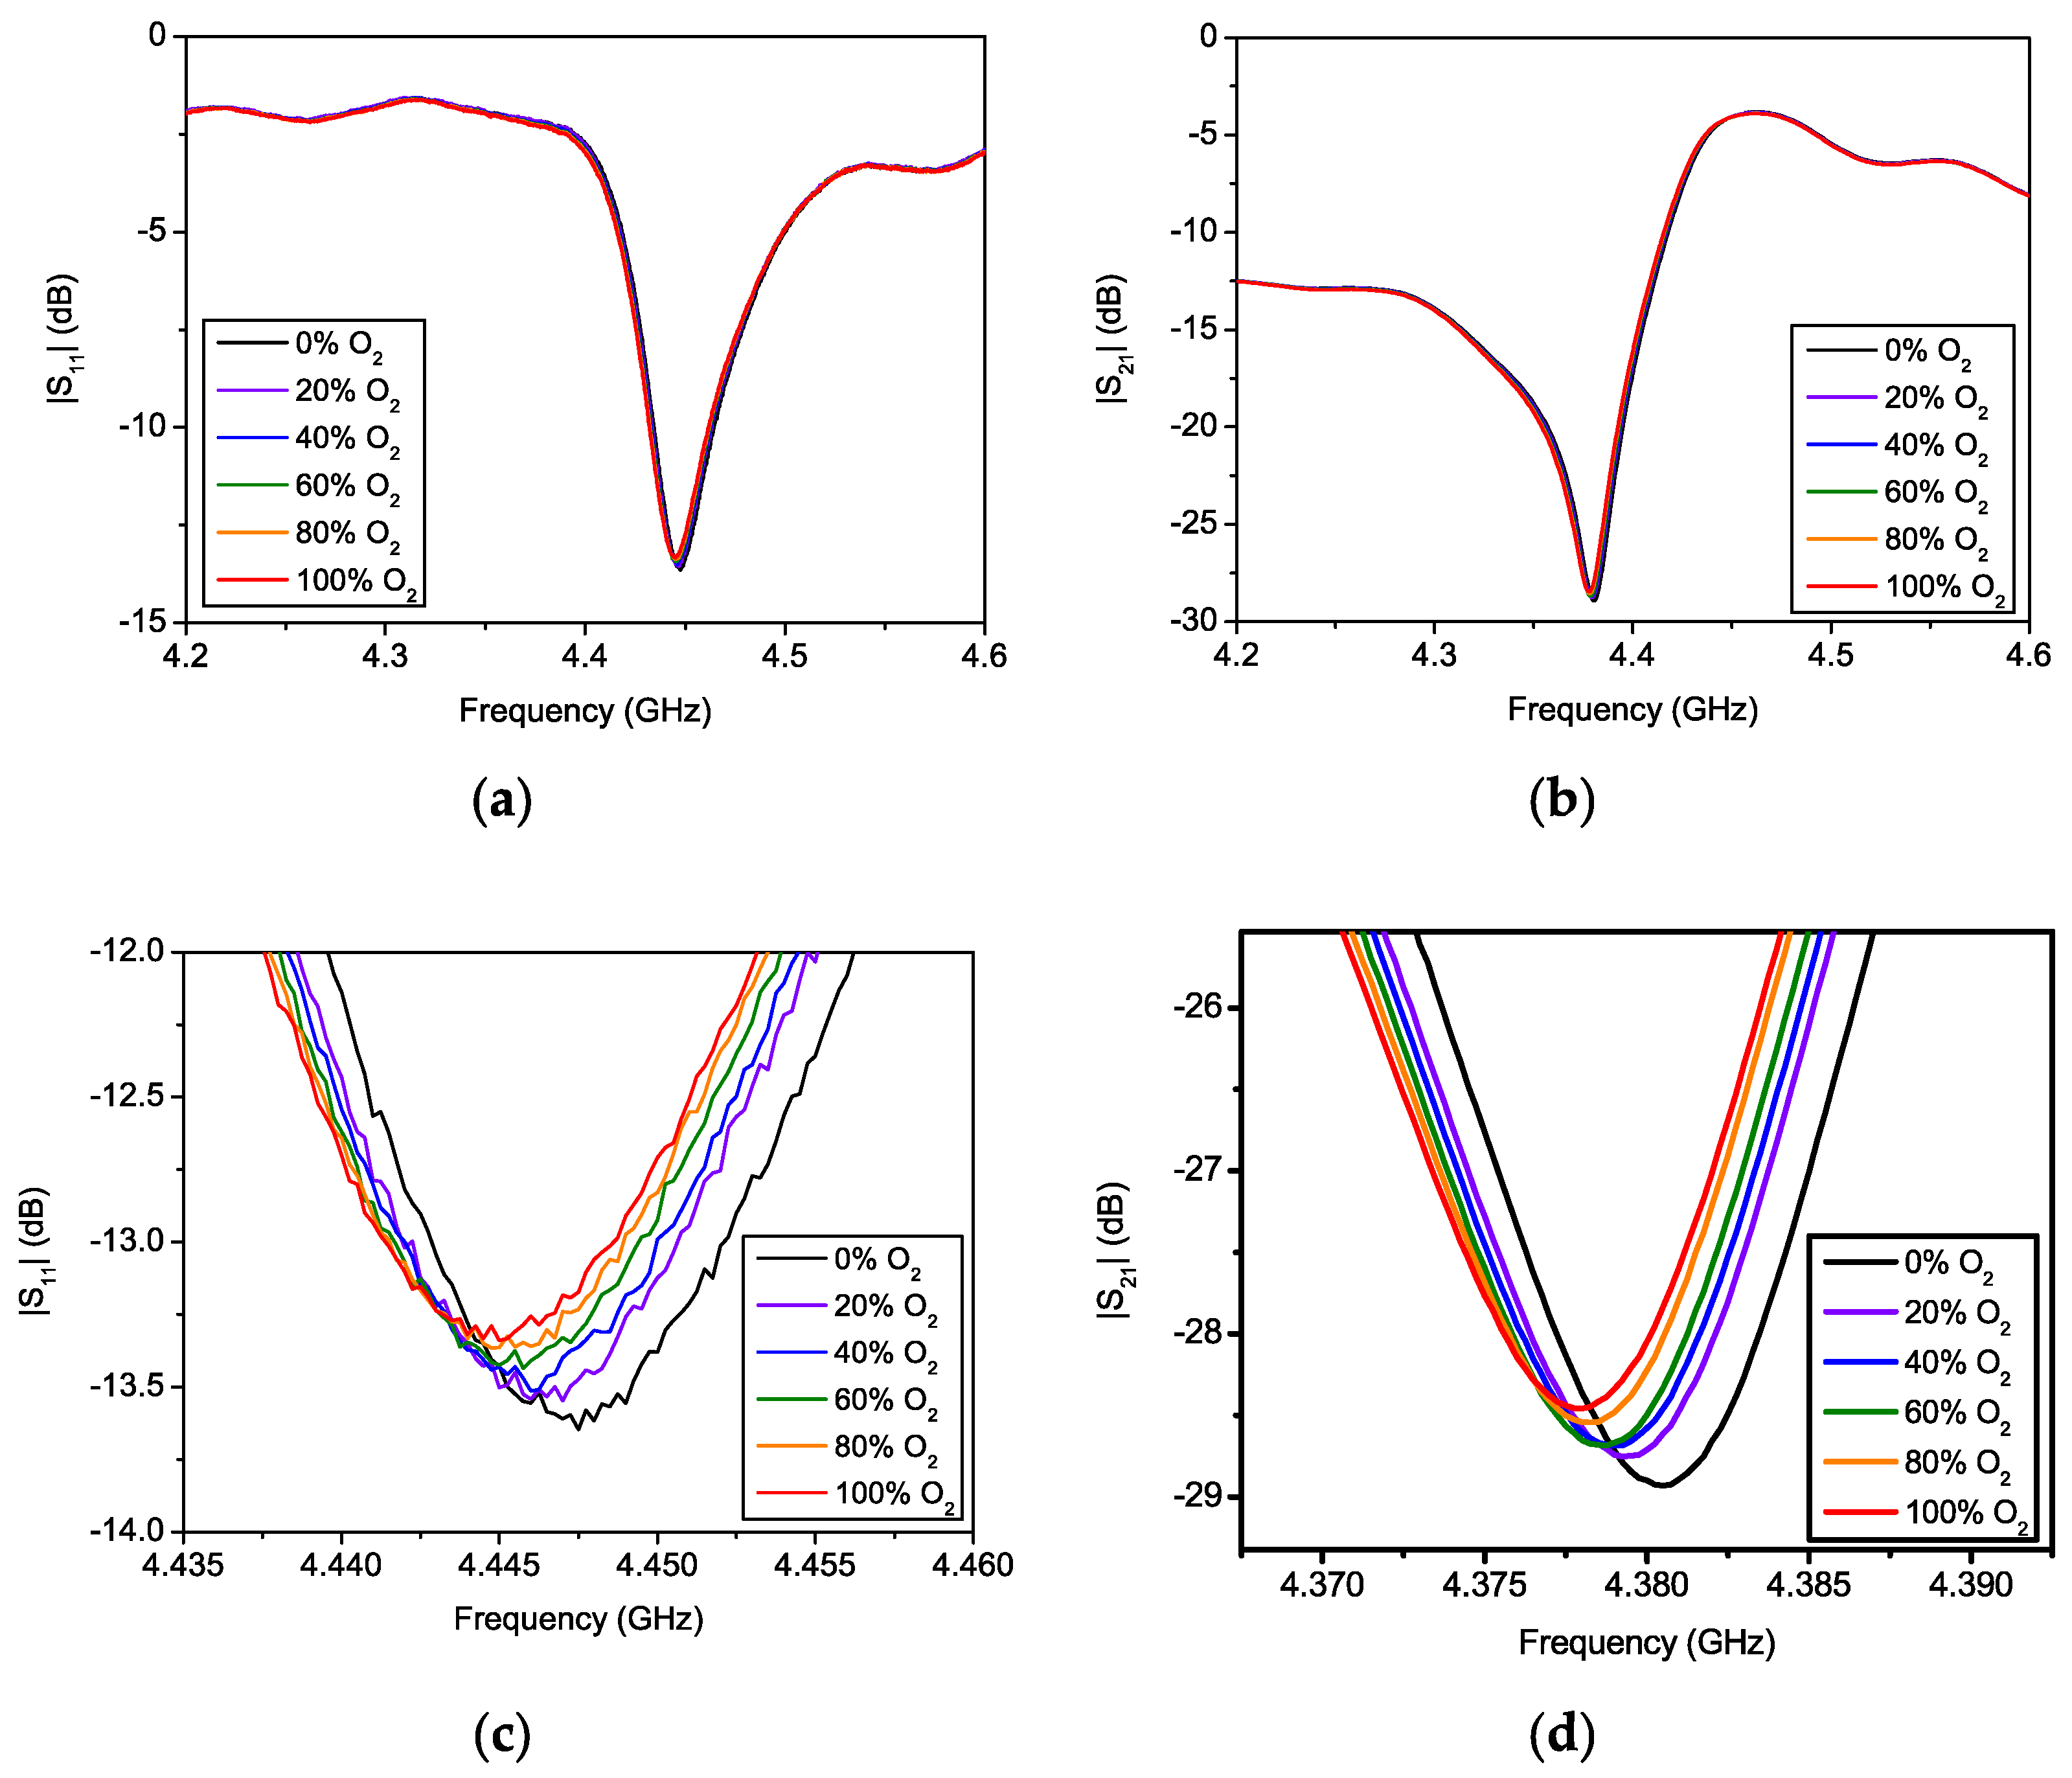
Figure 6.
Behavior of the resonant frequency, quality factor, and amplitude at the resonance for the studied sensor by considering six different O2 concentrations. The plotted trends refer to the dips observed at about 4.4 GHz in (a) |S11| and in (b) |S21| (b). A linear interpolation has been carried out on the acquired points with a R2 higher than 0.9.

Figure 7.
Phase behavior of S11 and S21 around the resonant frequency using 0% O2 concentration as an example.
Figure 7.
Phase behavior of S11 and S21 around the resonant frequency using 0% O2 concentration as an example.

Table 1.
Adjusted R2, residual sum of squares and coefficients (with standard errors) of the fitting carried out on the experimental measurements.
Table 1.
Adjusted R2, residual sum of squares and coefficients (with standard errors) of the fitting carried out on the experimental measurements.
| S11 | S21 | |||||
|---|---|---|---|---|---|---|
| fr | Q | A | fr | Q | A | |
| Adjusted R2 | 0.90 | 0.94 | 0.97 | 0.95 | 0.95 | 0.92 |
| Residual sum of squares | 4.92 × 10⁻⁷ GHz2 | 2.99 | 0.0015 dB2 | 1.66 × 10⁻⁷ GHz2 | 19.96 | 0.0085 dB2 |
| Intercept | 4.4474 GHz | 174.28 | −13.63 dB | 4.3802 GHz | 348.58 | −28.89 dB |
| Intercept standard error | 253.83 kHz | 0.63 | 0.014 dB | 147.312 kHz | 1.62 | 0.0334 dB |
| Slope | −28 kHz/%O2 | −0.092 | 0.0031 dB/O2 | −23.57 kHz/O2 | −0.25 | 0.0043 dB/O2 |
| Slope standard error | 4.19 kHz/%O2 | 0.010 | 2.32 × 10⁻⁴ dB/O2 | 2.43 kHz/%O2 | 0.0267 | 5.52 × 10⁻⁴ dB/O2 |
Publisher’s Note: MDPI stays neutral with regard to jurisdictional claims in published maps and institutional affiliations. |
© 2022 by the authors. Licensee MDPI, Basel, Switzerland. This article is an open access article distributed under the terms and conditions of the Creative Commons Attribution (CC BY) license (https://creativecommons.org/licenses/by/4.0/).
Share and Cite
MDPI and ACS Style
Gugliandolo, G.; Naishadham, K.; Crupi, G.; Donato, N. Design and Characterization of a Microwave Transducer for Gas Sensing Applications. Chemosensors 2022, 10, 127. https://doi.org/10.3390/chemosensors10040127
AMA Style
Gugliandolo G, Naishadham K, Crupi G, Donato N. Design and Characterization of a Microwave Transducer for Gas Sensing Applications. Chemosensors. 2022; 10(4):127. https://doi.org/10.3390/chemosensors10040127
Chicago/Turabian StyleGugliandolo, Giovanni, Krishna Naishadham, Giovanni Crupi, and Nicola Donato. 2022. "Design and Characterization of a Microwave Transducer for Gas Sensing Applications" Chemosensors 10, no. 4: 127. https://doi.org/10.3390/chemosensors10040127
Note that from the first issue of 2016, this journal uses article numbers instead of page numbers. See further details here.