
Spectroscopic Study of Phytosynthesized Ag Nanoparticles and Their Activity as SERS Substrate

 , , , , ,
Abstract
:1. Introduction
2. Materials and Methods
2.1. Synthesis of Ag NPs
2.2. Characterisation of Ag NPs
3. Results and Discussion
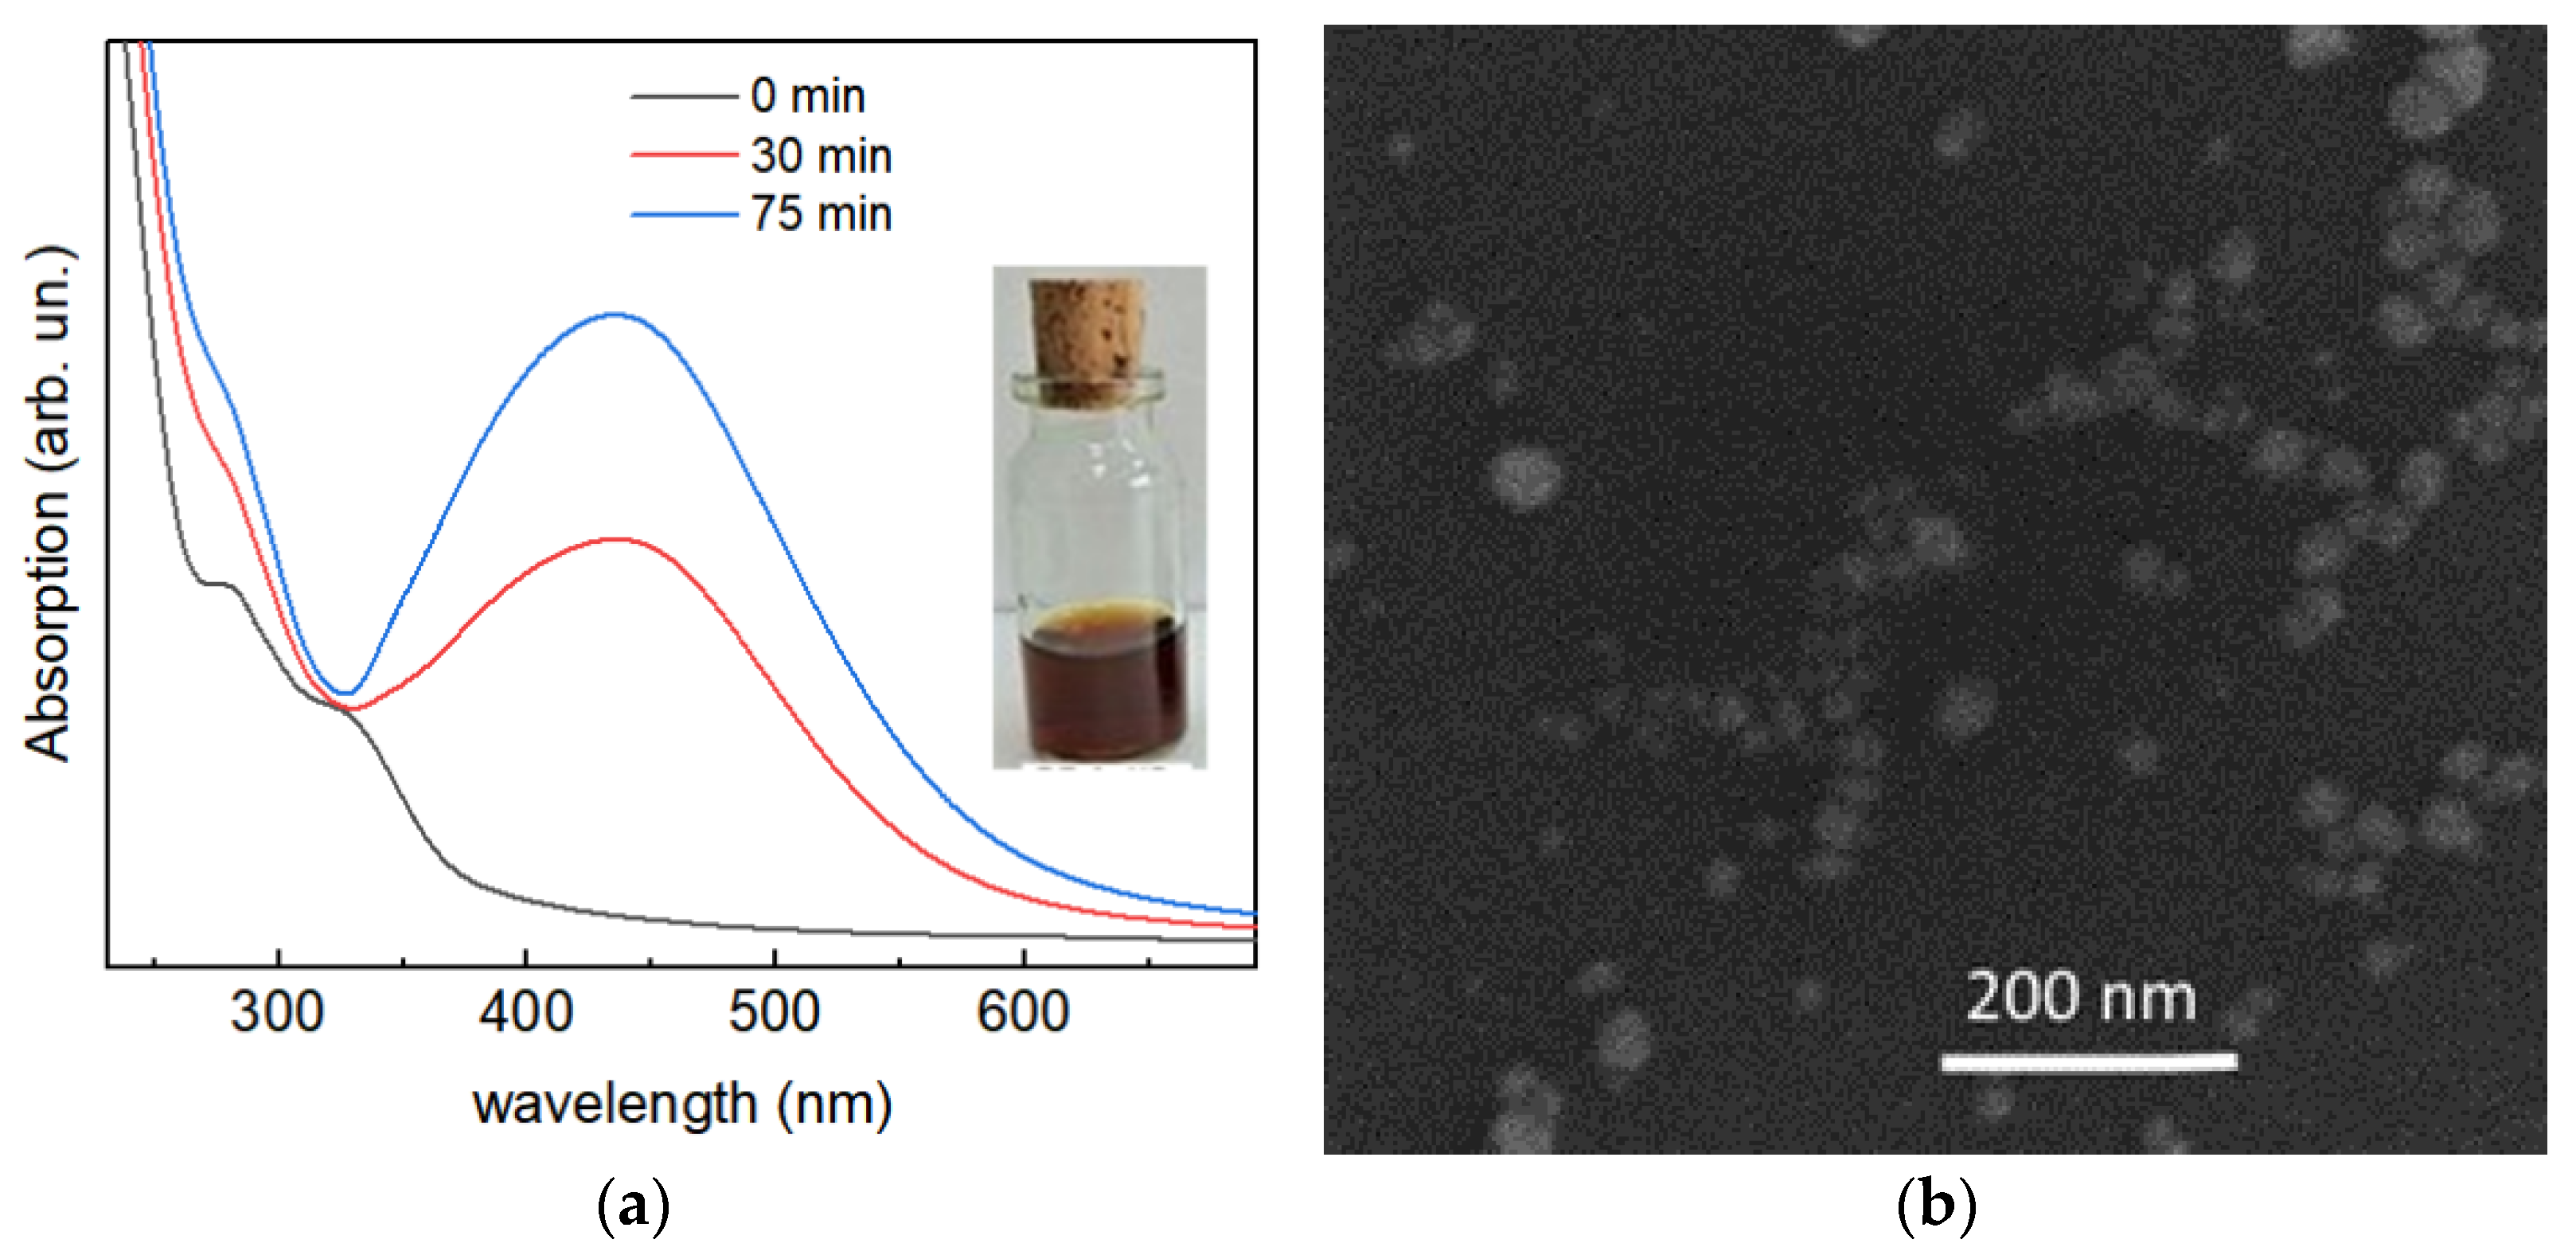
3.1. Confirmation of the Ag NP Formation
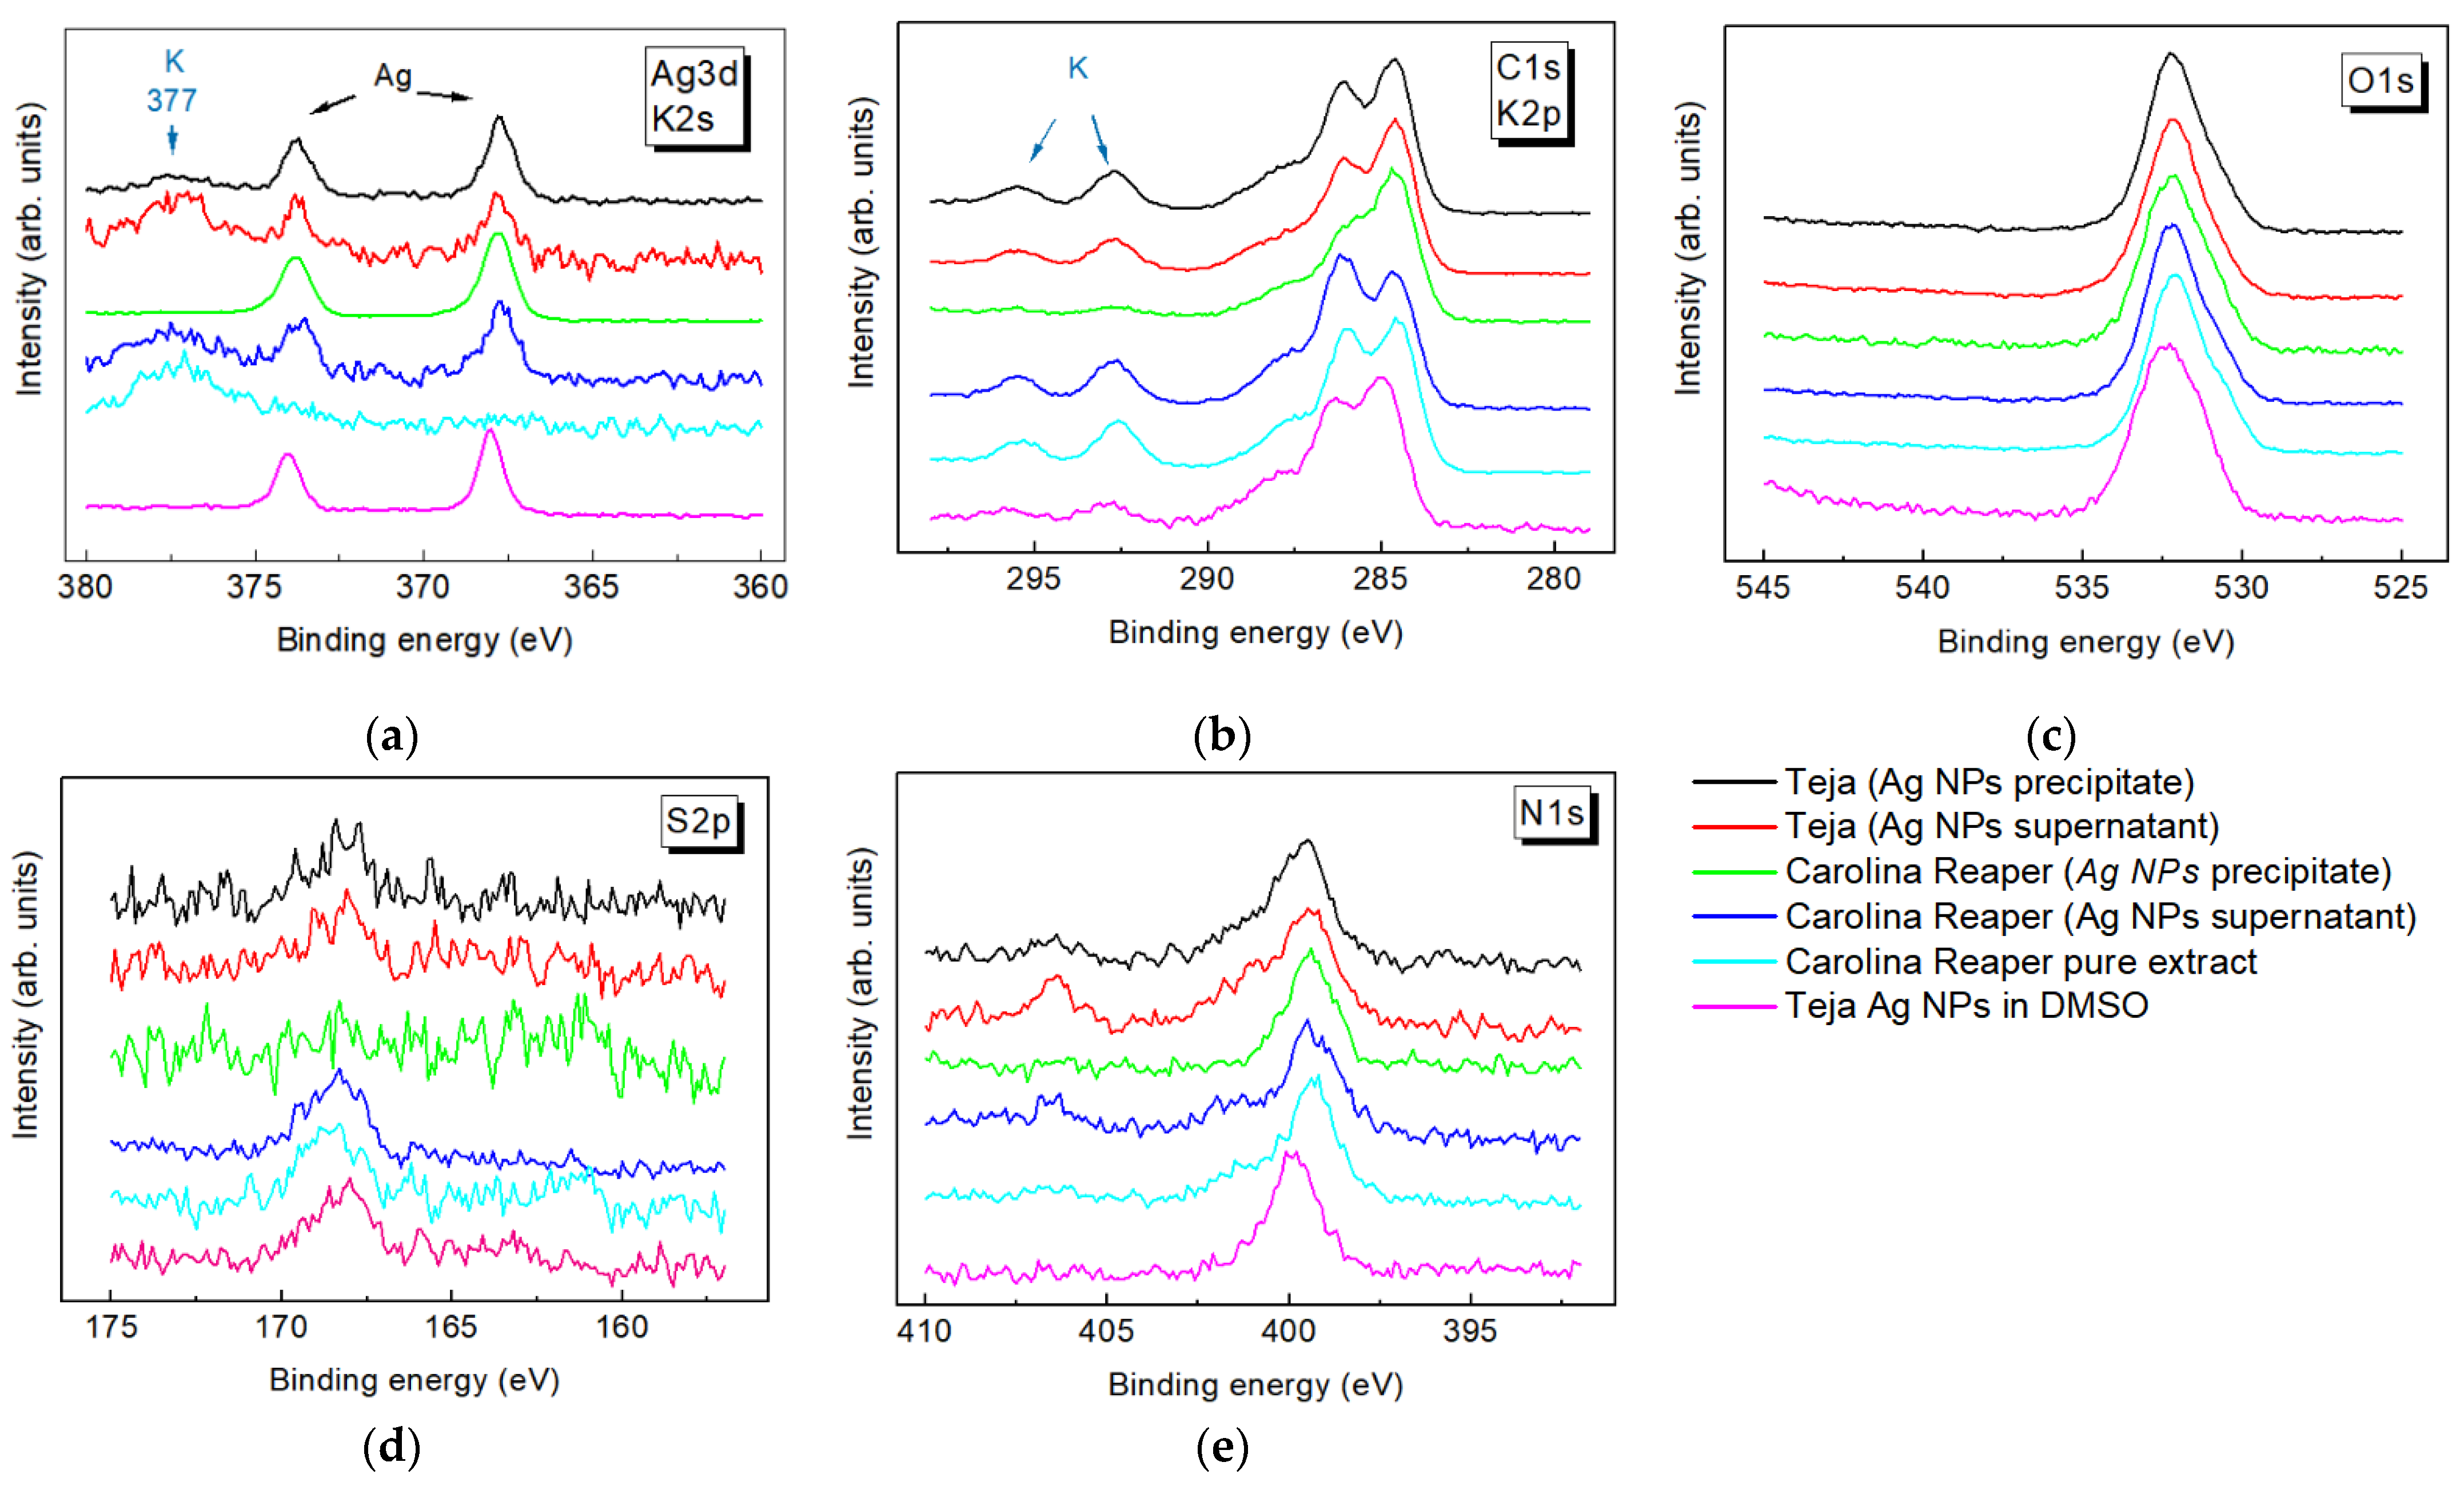
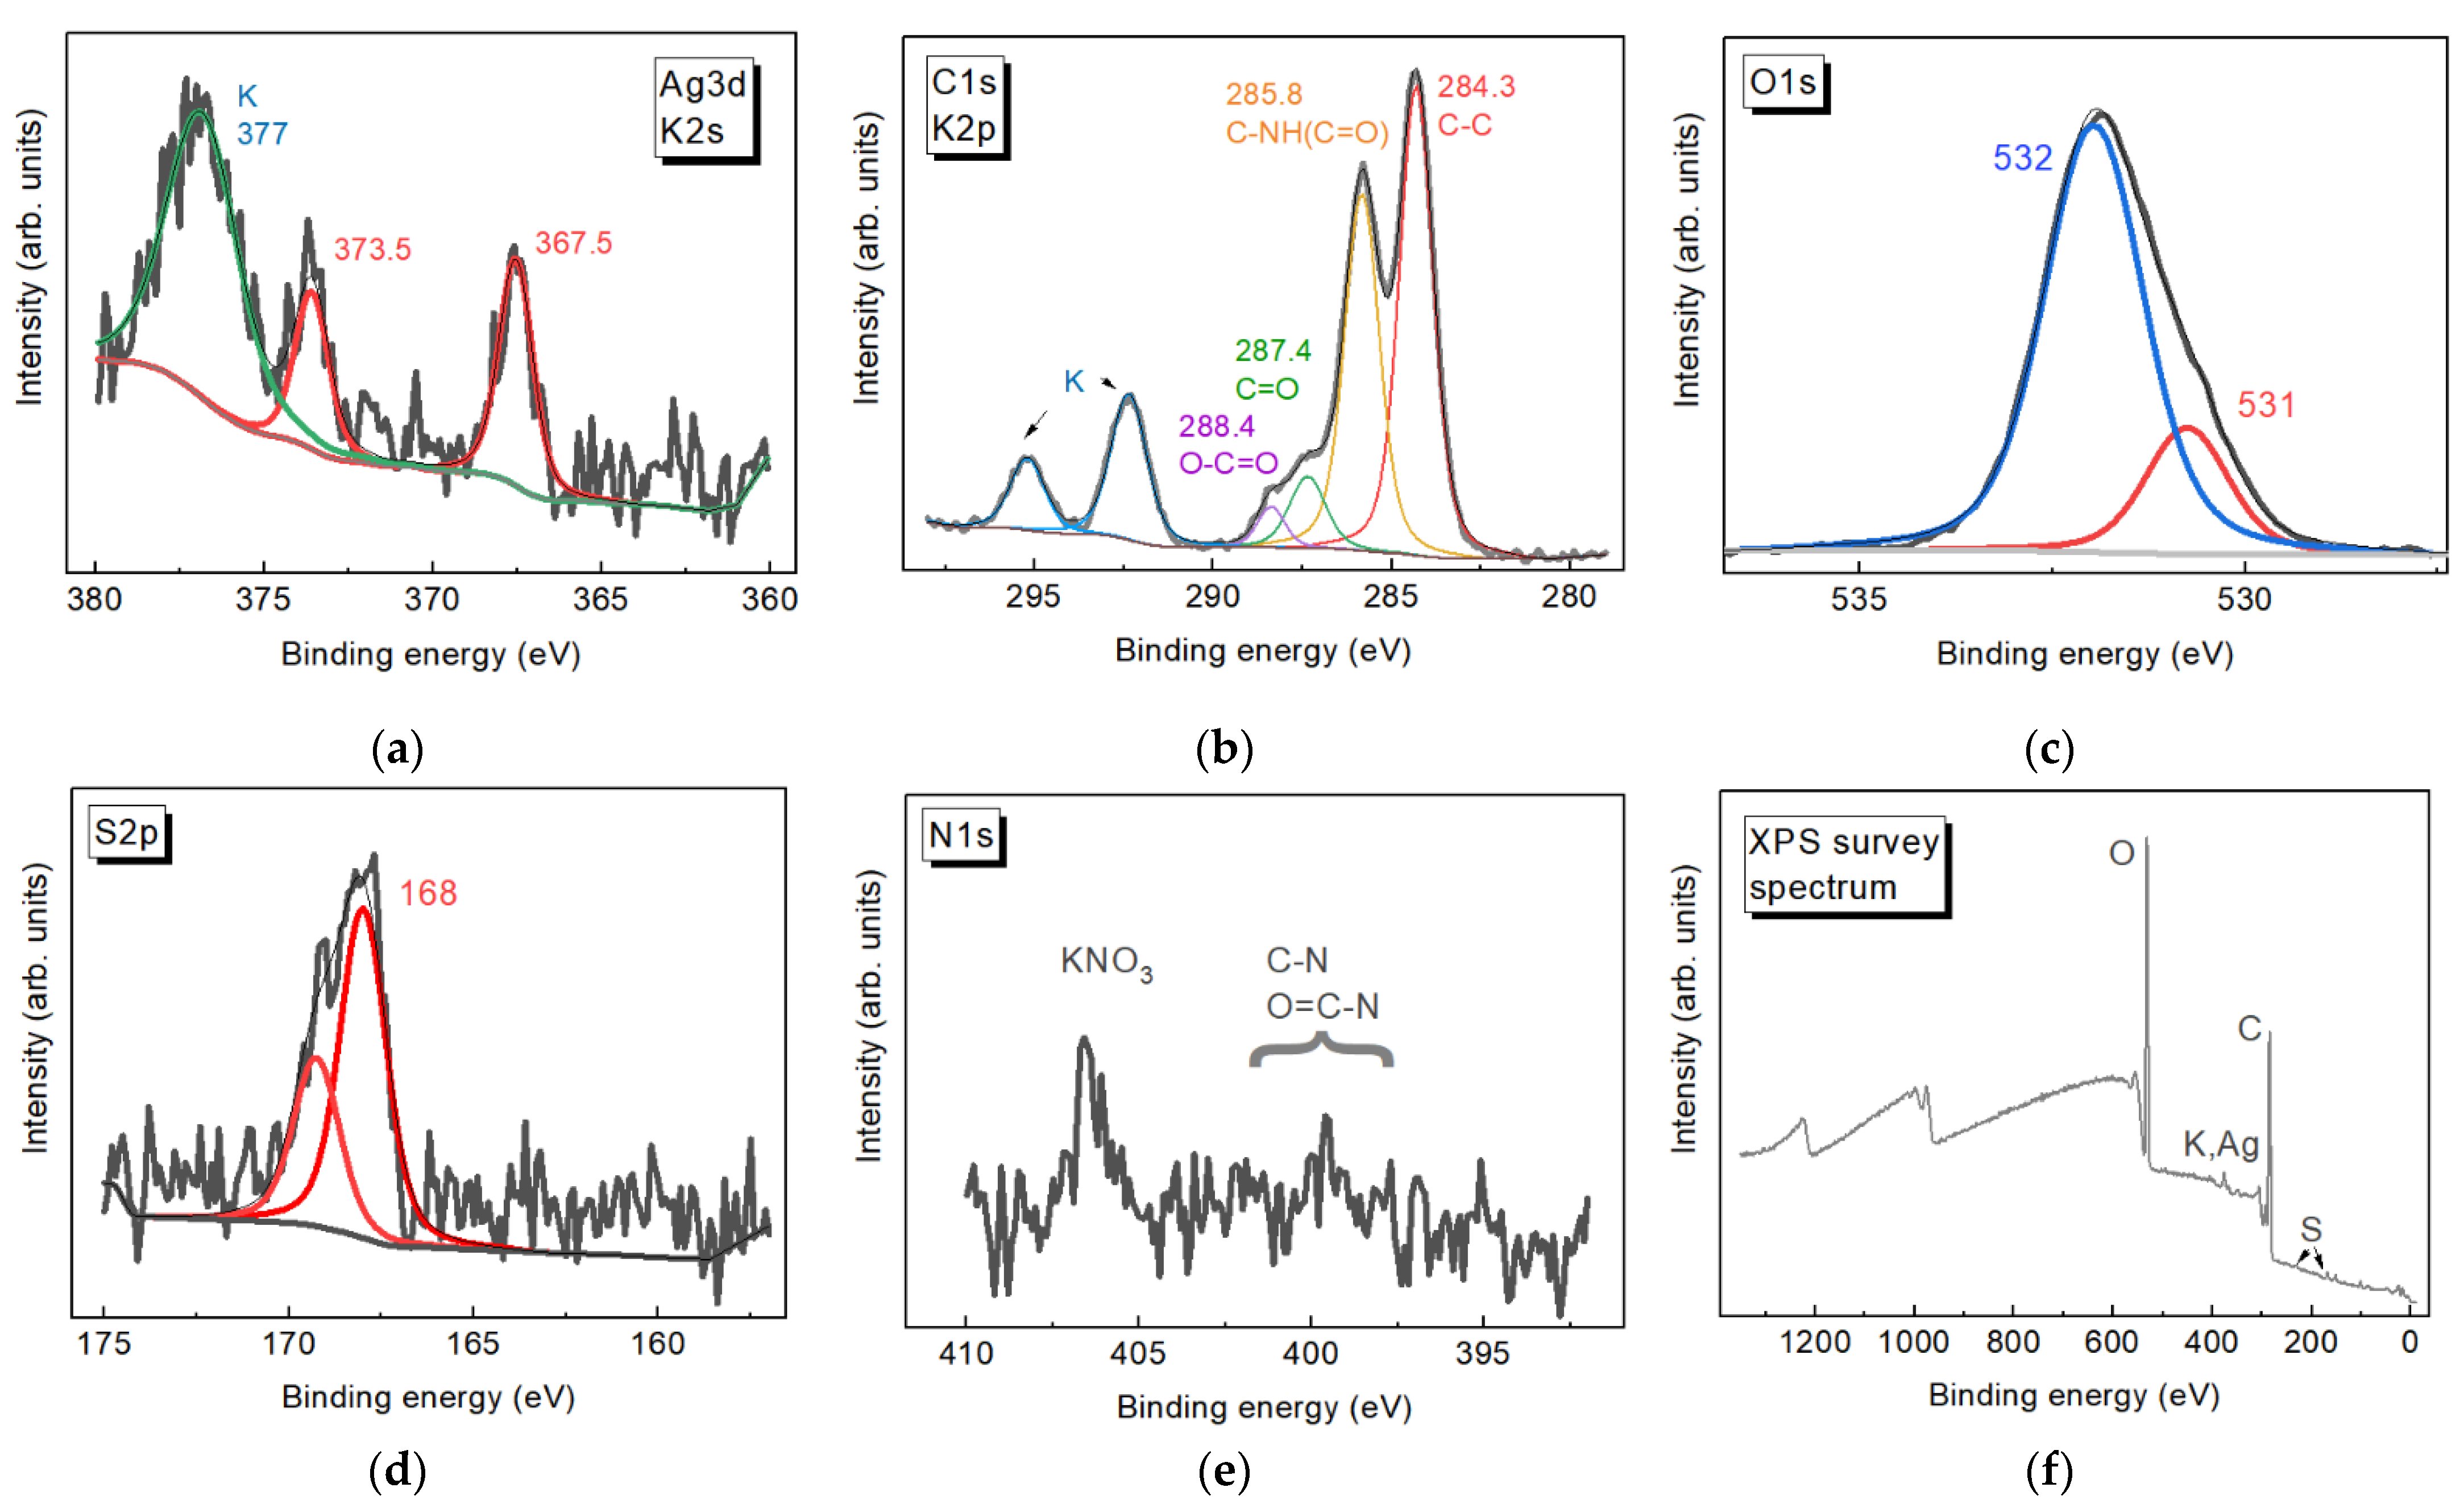
3.2. XPS
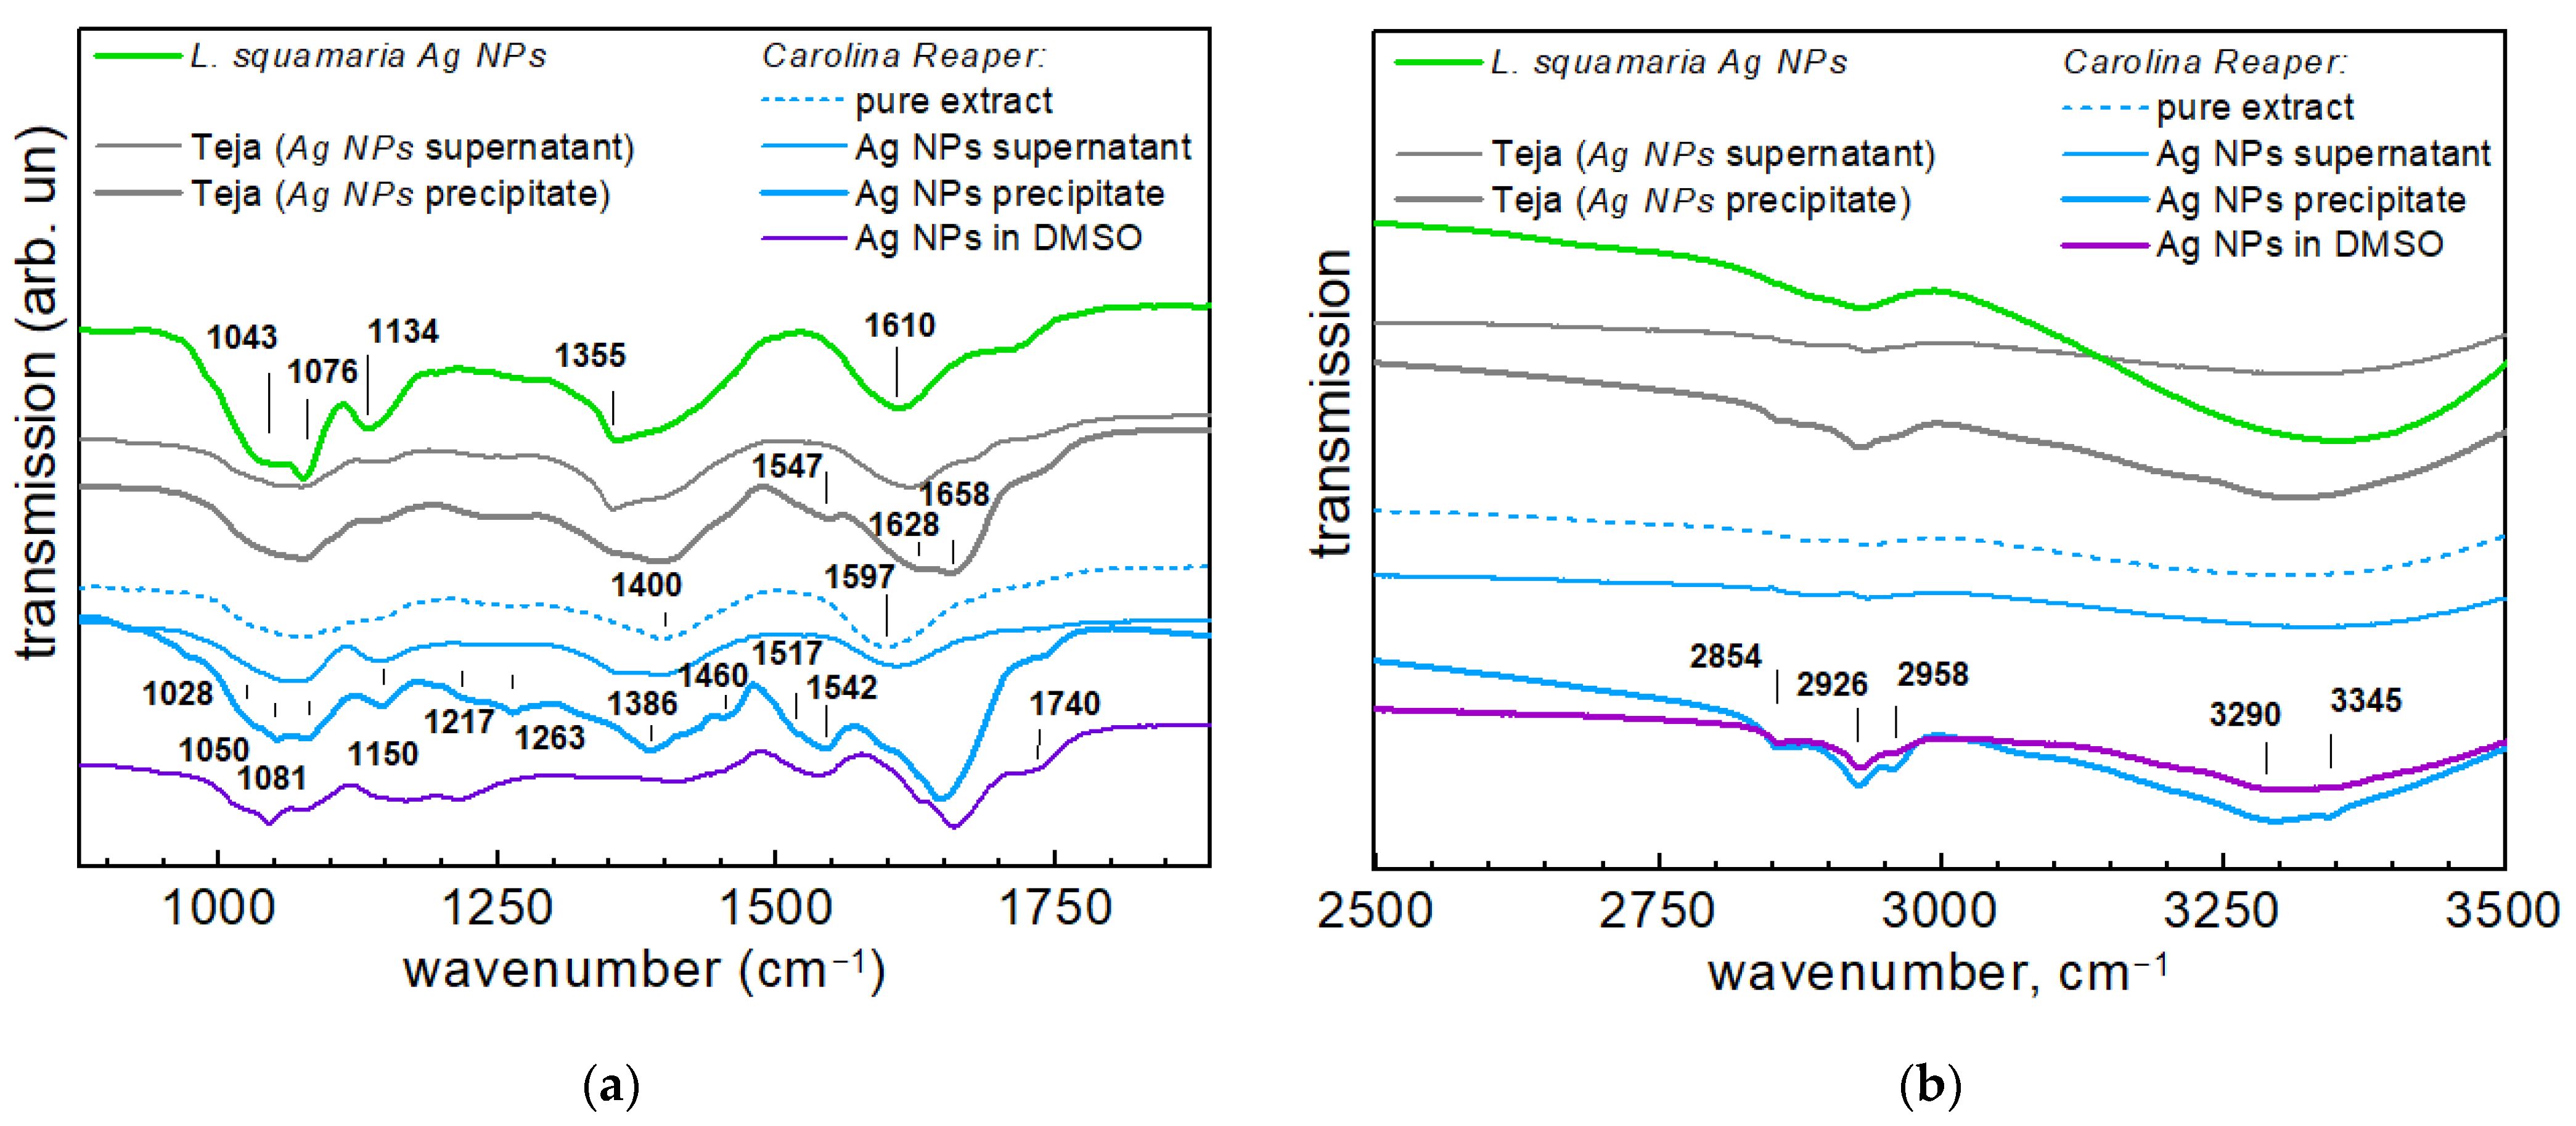
3.3. FTIR
3.4. SERS
4. Conclusions
Supplementary Materials
Author Contributions
Funding
Data Availability Statement
Acknowledgments
Conflicts of Interest
References
- Moisoiu, V.; Iancu, S.D.; Stefancu, A.; Moisoiu, T.; Pardini, B.; Dragomir, M.P.; Crisan, N.; Avram, L.; Crisan, D.; Andras, I.; et al. SERS liquid biopsy: An emerging tool for medical diagnosis. Colloids Surf. B Biointerfaces 2021, 208, 112064. [Google Scholar] [CrossRef] [PubMed]
- Wani, I.A.; Ahmad, T.; Khosla, A. Recent advances in anticancer and antimicrobial activity of silver nanoparticles synthesized using phytochemicals and organic polymers. Nanotechnology 2021, 32, 462001. [Google Scholar] [CrossRef] [PubMed]
- Vus, K.; Tarabara, U.; Danylenko, I.; Pirko, Y.; Krupodorova, T.; Yemets, A.; Blume, Y.; Turchenko, V.; Klymchuk, D.; Smertenko, P.; et al. Silver nanoparticles as inhibitors of insulin amyloid formation: A fluorescence study. J. Mol. Liq. 2021, 342, 117508. [Google Scholar] [CrossRef]
- Kobylinska, N.; Shakhovsky, A.; Khainakova, O.; Klymchuk, D.; Avdeeva, L.; Ratushnyak, Y.; Duplij, V.; Matvieieva, N. “Hairy” root extracts as source for “green” synthesis of silver nanoparticles and medical applications. RSC Adv. 2020, 10, 39434–39446. [Google Scholar] [CrossRef]
- Borovaya, M.; Horiunova, I.; Plokhovska, S.; Pushkarova, N.; Blume, Y.; Yemets, A. Institute Synthesis, Properties and Bioimaging Applications of Silver-Based Quantum Dots. Int. J. Mol. Sci. 2021, 22, 12202. [Google Scholar] [CrossRef]
- Orlando, A.; Franceschini, F.; Muscas, C.; Pidkova, S.; Bartoli, M.; Rovere, M.; Tagliaferro, A. A comprehensive review on Raman spectroscopy applications. Chemosensors 2021, 9, 262. [Google Scholar] [CrossRef]
- Strekal, N.; Maskevich, S. Plasmonic Gold and Silver Films: Selective Enhancement of Chromophore Raman Scattering or Plasmon-Assisted Fluorescence. In Reviews in Plasmonics; Springer: Cham, Switzerland, 2010; pp. 283–302. ISBN 978-1-4614-0883-3. [Google Scholar]
- Yeshchenko, O.A.; Golovynskyi, S.; Kudrya, V.Y.; Tomchuk, A.V.; Dmitruk, I.M.; Dmitruk, I.M.; Berezovska, N.I.; Teselko, P.O.; Zhou, T.; Xue, B.; et al. Laser-Induced Periodic Ag Surface Structure with Au Nanorods Plasmonic Nanocavity Metasurface for Strong Enhancement of Adenosine Nucleotide Label-Free Photoluminescence Imaging. ACS Omega 2020, 5, 14030–14039. [Google Scholar] [CrossRef]
- Metz, K.M.; Sanders, S.E.; Pender, J.P.; Dix, M.R.; Hinds, D.T.; Quinn, S.J.; Ward, A.D.; Duffy, P.; Cullen, R.J.; Colavita, P.E. Green Synthesis of Metal Nanoparticles via Natural Extracts: The Biogenic Nanoparticle Corona and Its Effects on Reactivity. ACS Sustain. Chem. Eng. 2015, 3, 1610–1617. [Google Scholar] [CrossRef] [Green Version]
- Alzharani, S.; Astudillo-calderón, S.; Pintos, B.; Pérez-urria, E.; Manzanera, J.A.; Martín, L.; Gomez-garay, A. Role of synthetic plant extracts on the production of silver-derived nanoparticles. Plants 2021, 10, 1671. [Google Scholar] [CrossRef]
- Kobylinska, N.; Klymchuk, D.; Shakhovsky, A.; Khainakova, O.; Ratushnyak, Y.; Duplij, V.; Matvieieva, N. Biosynthesis of magnetite and cobalt ferrite nanoparticles using extracts of “hairy” roots: Preparation, characterization, estimation for environmental remediation and biological application. RSC Adv. 2021, 11, 26974–26987. [Google Scholar] [CrossRef]
- Pirko, Y.; Borovaya, M.; Danylenko, I.; Kolomys, O.; Smertenko, P.; Lytvyn, O.; Roshchina, N.; Strelchuk, V.; Yemets, A.; Blume, Y. Eco-friendly Synthesis of Gold Nanoparticles Using Camellia sinensis Phytoextracts. Lett. Appl. NanoBioSci. 2021, 10, 2515–2524. [Google Scholar] [CrossRef]
- Borovaya, M.; Naumenko, A.; Horiunova, I.; Plokhovska, S.; Blume, Y.; Yemets, A. “Green” synthesis of Ag 2 S nanoparticles, study of their properties and bioimaging applications. Appl. Nanosci. 2020, 10, 4931–4940. [Google Scholar] [CrossRef]
- Palanco, M.E.; Mogensen, K.B.; Gühlke, M.; Heiner, Z.; Kneipp, J.; Kneipp, K. Templated green synthesis of plasmonic silver nanoparticles in onion epidermal cells suitable for surface-enhanced Raman and hyper-Raman scattering. Beilstein J. Nanotechnol. 2016, 7, 834–840. [Google Scholar] [CrossRef] [PubMed] [Green Version]
- Hyllested, J.A.; Palanco, M.E.; Hagen, N.; Mogensen, K.B.; Kneipp, K. Green preparation and spectroscopic characterization of plasmonic silver nanoparticles using fruits as reducing agents. Beilstein J. Nanotechnol. 2015, 6, 293–299. [Google Scholar] [CrossRef]
- Huang, J.; Lin, L.; Li, Q.; Sun, D.; Wang, Y.; Lu, Y.; He, N.; Yang, K.; Yang, X.; Wang, H.; et al. Continuous-flow biosynthesis of silver nanoparticles by lixivium of sundried cinnamomum camphora leaf in tubular microreactors. Ind. Eng. Chem. Res. 2008, 47, 6081–6090. [Google Scholar] [CrossRef]
- Smirnov, O.; Kalynovskyi, V.; Yumyna, Y.; Zelena, P.; Levenets, T.; Kovalenko, M.; Dzhagan, V.; Skoryk, M. Potency of phytosynthesised silver nanoparticles from Lathraea squmaria as anticandidal agent and emmer wheat seeds germination enhancer. Biologia 2022, in press. [Google Scholar]
- Smirnov, O.E.; Kalynovskyi, V.Y.; Yumyna, Y.M.; Zelena, P.P.; Skoryk, M.A.; Dzhagan, V.M.; Taran, N.Y. Green synthesis of silver nanoparticles usinG aqueous extract of hot chili pepper fruits and its antimicrobial activity against Pseudomonas aeruginosa. Ukr. Biochem. J. 2021, 93, 102–110. [Google Scholar] [CrossRef]
- Demydov, P.V.; Lopatynskyi, A.M.; Hudzenko, I.I.; Chegel, V.I. The approaches for localized surface plasmon resonance wavelength position tuning. Short review. Semicond. Phys. Quantum Electron. Optoelectron. 2021, 24, 304–311. [Google Scholar] [CrossRef]
- Smart, R.S.C.; Skinner, W.M.; Gerson, A.R. XPS of sulphide mineral surfaces: Metal-deficient, polysulphides, defects and elemental sulphur. Surf. Interface Anal. 1999, 28, 101–105. [Google Scholar] [CrossRef]
- Embuscado, M.E. Bioactives from Culinary Spices and Herbs: A Review. J. Food Bioact. 2019, 6, 68. [Google Scholar] [CrossRef]
- Materska, M.; Perucka, I. Antioxidant Activity of the Main Phenolic Compounds Isolated from Hot Pepper Fruit (Capsicum annuum L.). J. Agric. Food Chem. 2005, 53, 1750. [Google Scholar] [CrossRef] [PubMed]
- Troconis-Torres, I.G.; Rojas-López, M.; Hernández-Rodríguez, C.; Villa-Tanaca, L.; Maldonado-Mendoza, I.E.; Dorantes-Álvarez, L.; Tellez-Medina, D.; Jaramillo-Flores, M.E. Biochemical and molecular analysis of some commercial samples of chilli peppers from Mexico. J. Biomed. Biotechnol. 2012, 2012, 873090. [Google Scholar] [CrossRef] [PubMed]
- Malaník, M.; Daňková, I.; Pokorná, M.; Gazdová, M.; Dall’Acqua, S.; Šmejkal, K. Iridoid aglycones from the underground parts of Lathraea squamaria. Biochem. Syst. Ecol. 2019, 86, 103928. [Google Scholar] [CrossRef]
- Daňková, I.; Žemlička, M.; Švajdlenka, E.; Bartl, T.; Šmejkal, K. The chemotaxonomic significance of phenylethanoid glycosides of Lathraea squamaria L. (Orobanchaceae). Biochem. Syst. Ecol. 2016, 64, 53–56. [Google Scholar] [CrossRef]
- Swiatek, L.; Dombrowicz, E. Pharmacobotanical investigations on some species of the Scrophulariaceae family. Part V. Chemical constitutents in Lathraea squamaria L. Pol. J. Pharmacol. Pharm. 1976, 28, 105–109. [Google Scholar]
- Grabias, B.; Ofterdinger-Daegel, S.; Swiatek, L.; Kurowska, A. Iridoid glycosides from Lathraea squamaria. Phytochemisrry 1993, 32, 1489–1491. [Google Scholar] [CrossRef]
- Bokov, D.O.; Barkalova, V.E.; Suslikova, M.A.; Sokhin, D.M.; Kakhramanova, S.D.; Rendyuk, T.D.; Strelyaeva, A.V.; Antsyshkina, A.M.; Balobanova, N.P.; Prostodusheva, T.V.; et al. Lathraea squamaria L. (Orobanchaceae): A review of its botany, phytochemistry, traditional uses and pharmacology. Pharmacogn. J. 2020, 12, 667–673. [Google Scholar] [CrossRef]
- Schulz, H.; Baranska, M. Identification and quantification of valuable plant substances by IR and Raman spectroscopy. Vib. Spectrosc. 2007, 43, 13–25. [Google Scholar] [CrossRef]
- Türker-Kaya, S.; Huck, C.W. A review of mid-infrared and near-infrared imaging: Principles, concepts and applications in plant tissue analysis. Molecules 2017, 22, 168. [Google Scholar] [CrossRef] [Green Version]
- Ulaeto, S.B.; Mathew, G.M.; Pancrecious, J.K.; Nair, J.B.; Rajan, T.P.D.; Maiti, K.K.; Pai, B.C. Biogenic Ag Nanoparticles from Neem Extract: Their Structural Evaluation and Antimicrobial Effects against Pseudomonas nitroreducens and Aspergillus unguis (NII 08123). ACS Biomater. Sci. Eng. 2020, 6, 235–245. [Google Scholar] [CrossRef]
- Kumar, S.; Lahlali, R.; Liu, X.; Karunakaran, C. Infrared Spectroscopy Combined with Imaging: A New Developing Analytical Tool in Health and Plant Science. Appl. Spectrosc. Rev. 2016, 51, 466–483. [Google Scholar] [CrossRef]
- Kumar, V.A.; Nakajima, Y.; Uchida, T.; Hanajiri, T.; Maekawa, T. Synthesis of Nanoparticles Composed of Silver and Silver Chloride for a Plasmonic Photocatalyst Using an Extract from Needles of Pinus Densiflora. Mater. Lett. 2016, 176, 015002. [Google Scholar] [CrossRef]
- Zayed, M.F.; Eisa, W.H.; Shabaka, A.A. Malva parviflora extract assisted green synthesis of silver nanoparticles. Spectrochim. Acta-Part A Mol. Biomol. Spectrosc. 2012, 98, 423–428. [Google Scholar] [CrossRef]
- Singh, K.; Naidoo, Y.; Mocktar, C.; Baijnath, H. Biosynthesis of silver nanoparticles using Plumbago auriculata leaf and calyx extracts and evaluation of their antimicrobial activities. Adv. Nat. Sci. Nanosci. Nanotechnol. 2018, 9, 035004. [Google Scholar] [CrossRef]
- Yilmaz, M.; Turkdemir, H.; Kilic, M.A.; Bayram, E.; Cicek, A.; Mete, A.; Ulug, B. Biosynthesis of silver nanoparticles using leaves of Stevia rebaudiana. Mater. Chem. Phys. 2011, 130, 1195–1202. [Google Scholar] [CrossRef]
- Tanase, C.; Berta, L.; Coman, N.A.; Roşca, I.; Man, A.; Toma, F.; Mocan, A.; Nicolescu, A.; Jakab-Farkas, L.; Biró, D.; et al. Antibacterial and antioxidant potential of silver nanoparticles biosynthesized using the spruce bark extract. Nanomaterials 2019, 9, 1541. [Google Scholar] [CrossRef] [Green Version]
- Salayová, A.; Bedlovičová, Z.; Daneu, N.; Baláž, M.; Lukáčová Bujňáková, Z.; Balážová, L.; Tkáčiková, L. Green synthesis of silver nanoparticles with antibacterial activity using various medicinal plant extracts: Morphology and antibacterial efficacy. Nanomaterials 2021, 11, 1005. [Google Scholar] [CrossRef] [PubMed]
- Tanase, C.; Berta, L.; Coman, N.A.; Roșca, I.; Man, A.; Toma, F.; Mocan, A.; Jakab-Farkas, L.; Biró, D.; Mare, A. Investigation of in vitro antioxidant and antibacterial potential of silver nanoparticles obtained by biosynthesis using beech bark extract. Antioxidants 2019, 8, 459. [Google Scholar] [CrossRef] [Green Version]
- Florkiewicz, W.; Pluta, K.; Malina, D.; Rudnicka, K.; Zywicka, A.; Guigou, M.D.; Tyliszczak, B.; Sobczak-Kupiec, A. Investigation on Green Synthesis, Biocompatibility, and Antibacterial Activity of Silver Nanoparticles Prepared Using. Materials 2021, 14, 5028. [Google Scholar] [CrossRef]
- Huang, J.; Li, Q.; Sun, D.; Lu, Y.; Su, Y.; Yang, X.; Wang, H.; Wang, Y.; Shao, W.; He, N.; et al. Biosynthesis of silver and gold nanoparticles by novel sundried Cinnamomum camphora leaf. Nanotechnology 2007, 18, 105104. [Google Scholar] [CrossRef]
- Sreekanth, T.V.M.; Nagajyothi, P.C.; Muthuraman, P.; Enkhtaivan, G.; Vattikuti, S.V.P.; Tettey, C.O.; Kim, D.H.; Shim, J.; Yoo, K. Ultra-sonication-assisted silver nanoparticles using Panax ginseng root extract and their anti-cancer and antiviral activities. J. Photochem. Photobiol. B Biol. 2018, 188, 6–11. [Google Scholar] [CrossRef] [PubMed]
- Agressott, E.V.H.; Blätte, D.; Cunha, F.A.; Noronha, V.T.; Ciesielski, R.; Hartschuh, A.; De Paula, A.J.; Fechine, P.B.A.; Souza Filho, A.G.; Paschoal, A.R. Vibrational Spectroscopy and Morphological Studies on Protein-Capped Biosynthesized Silver Nanoparticles. ACS Omega 2020, 5, 386–393. [Google Scholar] [CrossRef] [PubMed]
- Stefancu, A.; Iancu, S.D.; Leopold, N. Selective Single Molecule SERRS of Cationic and Anionic Dyes by Cl-and Mg2+Adions: An Old New Idea. J. Phys. Chem. C 2021, 125, 12802–12810. [Google Scholar] [CrossRef]
- Fusco, Z.; Bo, R.; Wang, Y.; Motta, N.; Chen, H.; Tricoli, A. Self-assembly of Au nano-islands with tuneable organized disorder for highly sensitive SERS. J. Mater. Chem. C 2019, 7, 6308–6316. [Google Scholar] [CrossRef]
- Yukhymchuk, V.O.; Hreshchuk, O.M.; Dzhagan, V.M.; Matveevskaya, N.A.; Beynik, T.G.; Valakh, M.Y.; Sakhno, M.V.; Skoryk, M.A.; Lavoryk, S.R.; Rudko, G.Y.; et al. Experimental Studies and Modeling of “ Starlike ” Plasmonic Nanostructures for SERS Application. Phys. Status Solidi Basic Res. 2019, 256, 1800280. [Google Scholar] [CrossRef]
- Buja, O.M.; Gordan, O.D.; Leopold, N.; Morschhauser, A.; Nestler, J.; Zahn, D.R.T. Microfluidic Setup for On-Line SERS Monitoring Using Laser Induced Nanoparticle Spots as SERS Active Substrate. Beilstein J. Nanotechnol. 2017, 8, 237. [Google Scholar] [CrossRef] [PubMed] [Green Version]
- Gallucci, M.N.; Fraire, J.C.; Ferreyra Maillard, A.P.V.; Páez, P.L.; Aiassa Martínez, I.M.; Pannunzio Miner, E.V.; Coronado, E.A.; Dalmasso, P.R. Silver nanoparticles from leafy green extract of Belgian endive (Cichorium intybus L. var. sativus): Biosynthesis, characterization, and antibacterial activity. Mater. Lett. 2017, 197, 98–101. [Google Scholar] [CrossRef]
- Smilkov, K.; Gjorgieva Ackova, D.; Cvetkovski, A.; Geskovski, N.; Pejova, B.; Boev, B.; Makreski, P. First characterization of functionalized nanoparticles—Tandem of biosynthesized silver nanoparticles conjugated with piperine. Chem. Pap. 2021, 76, 1019–1030. [Google Scholar] [CrossRef]
- Milekhin, A.; Sveshnikova, L.; Duda, T.; Surovtsev, N.; Adichtchev, S.; Ding, L.; Zahn, D.R.T. Vibrational spectra of quantum dots formed by Langmuir–Blodgett technique. J. Vac. Sci. Technol. B Microelectron. Nanom. Struct. 2010, 28, C5E22. [Google Scholar] [CrossRef]
- Dzhagan, V.; Selyshchev, O.; Havryliuk, Y.; Mazur, N.; Raievska, O.; Stroyuk, O.; Kondratenko, S.; Litvinchuk, A.P.; Valakh, M.Y.; Zahn, D.R.T. Raman and X-ray photoelectron spectroscopic study of aqueous thiol-capped Ag-Zn-Sn-S nanocrystals. Materials 2021, 14, 3593. [Google Scholar] [CrossRef]

Publisher’s Note: MDPI stays neutral with regard to jurisdictional claims in published maps and institutional affiliations. |
© 2022 by the authors. Licensee MDPI, Basel, Switzerland. This article is an open access article distributed under the terms and conditions of the Creative Commons Attribution (CC BY) license (https://creativecommons.org/licenses/by/4.0/).
Share and Cite
Dzhagan, V.; Smirnov, O.; Kovalenko, M.; Mazur, N.; Hreshchuk, O.; Taran, N.; Plokhovska, S.; Pirko, Y.; Yemets, A.; Yukhymchuk, V.; et al. Spectroscopic Study of Phytosynthesized Ag Nanoparticles and Their Activity as SERS Substrate. Chemosensors 2022, 10, 129. https://doi.org/10.3390/chemosensors10040129
Dzhagan V, Smirnov O, Kovalenko M, Mazur N, Hreshchuk O, Taran N, Plokhovska S, Pirko Y, Yemets A, Yukhymchuk V, et al. Spectroscopic Study of Phytosynthesized Ag Nanoparticles and Their Activity as SERS Substrate. Chemosensors. 2022; 10(4):129. https://doi.org/10.3390/chemosensors10040129
Chicago/Turabian StyleDzhagan, Volodymyr, Oleksandr Smirnov, Mariia Kovalenko, Nazar Mazur, Oleksandr Hreshchuk, Nataliya Taran, Svitlana Plokhovska, Yaroslav Pirko, Alla Yemets, Volodymyr Yukhymchuk, and et al. 2022. "Spectroscopic Study of Phytosynthesized Ag Nanoparticles and Their Activity as SERS Substrate" Chemosensors 10, no. 4: 129. https://doi.org/10.3390/chemosensors10040129