Article

Accumulation of TIP2;2 Aquaporin during Dark Adaptation Is Partially PhyA Dependent in Roots of Arabidopsis Seedlings

1
Graduate School of Humanities and Sciences, Nara Women's University, Nara 630-8506, Japan
2
Faculty of Science, Nara Women's University, Nara 630-8506, Japan
3
Graduate School of Bioagricultural Sciences, Nagoya University, Nagoya 464-8601, Japan
*
Author to whom correspondence should be addressed.
Present address: NIPPON Funmatsu Yakuhin CO., Ltd, Osaka 541-0045, Japan
Present address: Graduate School of Information Science, Nagoya University, Nagoya 464-8601, Japan
§
Present address: Graduate School of Science, Kyoto University, Kyoto 606-8502, Japan;
Plants 2014, 3(1), 177-195; https://doi.org/10.3390/plants3010177
Submission received: 15 November 2013 / Revised: 2 February 2014 / Accepted: 21 February 2014 / Published: 5 March 2014
(This article belongs to the Special Issue Plant Light Signalling)

Abstract

:
Light regulates the expression and function of aquaporins, which are involved in water and solute transport. In Arabidopsis thaliana, mRNA levels of one of the aquaporin genes, TIP2;2, increase during dark adaptation and decrease under far-red light illumination, but the effects of light at the protein level and on the mechanism of light regulation remain unknown. Numerous studies have described the light regulation of aquaporin genes, but none have identified the regulatory mechanisms behind this regulation via specific photoreceptor signaling. In this paper, we focus on the role of phytochrome A (phyA) signaling in the regulation of the TIP2;2 protein. We generated Arabidopsis transgenic plants expressing a TIP2;2-GFP fusion protein driven by its own promoter, and showed several differences in TIP2;2 behavior between wild type and the phyA mutant. Fluorescence of TIP2;2-GFP protein in the endodermis of roots in the wild-type seedlings increased during dark adaptation, but not in the phyA mutant. The amount of the TIP2;2-GFP protein in wild-type seedlings decreased rapidly under far-red light illumination, and a delay in reduction of TIP2;2-GFP was observed in the phyA mutant. Our results imply that phyA, cooperating with other photoreceptors, modulates the level of TIP2;2 in Arabidopsis roots.

Graphical Abstract

1. Introduction

As a consequence of water absorption during development, vacuoles occupy more than 90% of the total volume of plant cells [1]. Vacuoles play multifaceted roles, including accumulation of useful substances, recycling of cell components, regulation of turgor pressure, sequestration of toxic ions, and detoxification of xenobiotics [2,3]. Furthermore, they have a space-filling function. Vacuolar transporters play essential roles in these functions [4]. One group of aquaporins, tonoplast intrinsic proteins (TIPs), serves as channels to pass water and small neutral molecules through the tonoplast [5,6,7]. TIP (TP25 in Phaseolus vulgaris) was the first aquaporin reported in plants [8]. In Arabidopsis thaliana, ten TIP members are classified into five subgroups, TIP1 to TIP5: these include three TIP1s, three TIP2s, two TIP3s, one TIP4;1 and one TIP5;1 [9]. In addition to water [10,11,12,13,14,15], TIPs are permeable to ammonia [16,17], urea [18], H2O2 [19] and glycerol [20]. For example, although both TIP1;1 and TIP2;1 are permeable to water [15] and urea [18], TIP1;1 is also permeable to H2O2 [19] and TIP2;1 is permeable to ammonia [16]. Therefore, each TIP member appears to allow permeation of specific substrate molecules and to play a specific physiological role. The diversity of physiological roles of TIPs is supported by earlier observations that different types of vacuoles contain distinct members of individual TIPs [21,22]. The tonoplast of storage vacuoles contains δ-TIP (presently TIP2), while the lytic vacuoles mainly contain γ-TIP (TIP1) [21]. Three types of TIPs, α-TIP (TIP3), TIP2, and sometimes TIP1, coexist in protein storage vacuoles of seeds [21]. The coexistence and distinct patterns of tissue- and organ-specific expression of TIP members have also been observed in roots and leaves of Arabidopsis using fluorescent reporters [23,24,25]. Thus, the expression of TIP isoforms is controlled by developmental cues associated with a specific vacuolar differentiation pattern [26].
External cues such as light and environmental stresses also regulate the expression of TIPs [14,27,28,29,30,31]. The expression of several TIP2 genes is affected by light: SunTIP7 and SunTIP20 in Helianthus leaves are up-regulated by light [28], while expression of others such as DIP in Antirrhinum cotyledons [32] and TIP2;2 in Arabidopsis roots [31] is increased during the dark period. The modulation of TIP2s’ expression by light is probably involved in light regulation of vacuolar functions. However, the mechanism of light regulation of TIP2 and its relationship with vacuolar functions have not been studied with respect to aspects of developmental regulation and stress responses.
The modification of vacuolar functions by increased levels of specific TIPs promotes water permeability in cells and growth of cells and organs. When tomato SlTIP2;2 is transiently expressed in mesophyll cells in Arabidopsis, water permeability of the protoplasts increases [33]. Over-expression of Panax ginseng PgTIP1 in Arabidopsis plants promotes the growth of leaves, roots and seeds [34]. Overexpression of NtTIP1;1 promotes regeneration, enlargement, and division of tobacco BY-2 cells [35]. Therefore, modulation of TIP expression during adaptation to light conditions is probably connected with regulation of water transport and growth in plants through the regulation of vacuolar functions.
Plants monitor light in the environment via multiple photoreceptors such as phytochromes, cryptochromes and phototropins [36,37]. The phytochrome (phy) family encodes red/far-red (FR) light photoreceptors, and Arabidopsis has five members, phyA through phyE [38]. Phytochromes generally mediate reversible red/FR light responses [36,39,40]. Furthermore, phyA mediates the very-low-fluence response to broad-spectrum light as a highly sensitive light “antenna” [40,41] as well as the high-irradiation response to FR light [42]. phyA is involved in the regulation of growth and development of not only aerial parts [39] but also roots, affecting root elongation [43], root hair formation [44], and red light-induced root phototropism [45]. One of our research interests is why and how light regulates the growth and development of roots underground.
Our previous study focusing on phyA regulation of gene expression in roots indicated that transcripts of several aquaporin genes including TIP1;1, TIP1;2 and TIP2;2 increase during dark adaptation and that phyA is involved in regulation of these genes [31]. One of the TIP genes strongly expressed in the roots [46], TIP2;2, was greatly upregulated during dark adaptation [31]. Light regulation of TIP2;2 expression could affect the growth and metabolism of roots as a consequence of modification of vacuolar function. However, the effects of light and phyA signaling on TIP2;2 protein levels have not been studied. In this paper, we focused on the roles of light and phyA signaling on the regulation of TIP2;2 protein. We generated transgenic Arabidopsis plants expressing a TIP2;2-GFP fusion protein driven by its own promoter, and compared tissue and cellular localization of TIP2;2-GFP in wild-type and phyA mutant cells. We also analyzed the protein levels in response to dark conditions and FR illumination and found several differences in gene expression and protein accumulation of TIP2;2 between wild-type and phyA mutant cells.

2. Results and Discussion

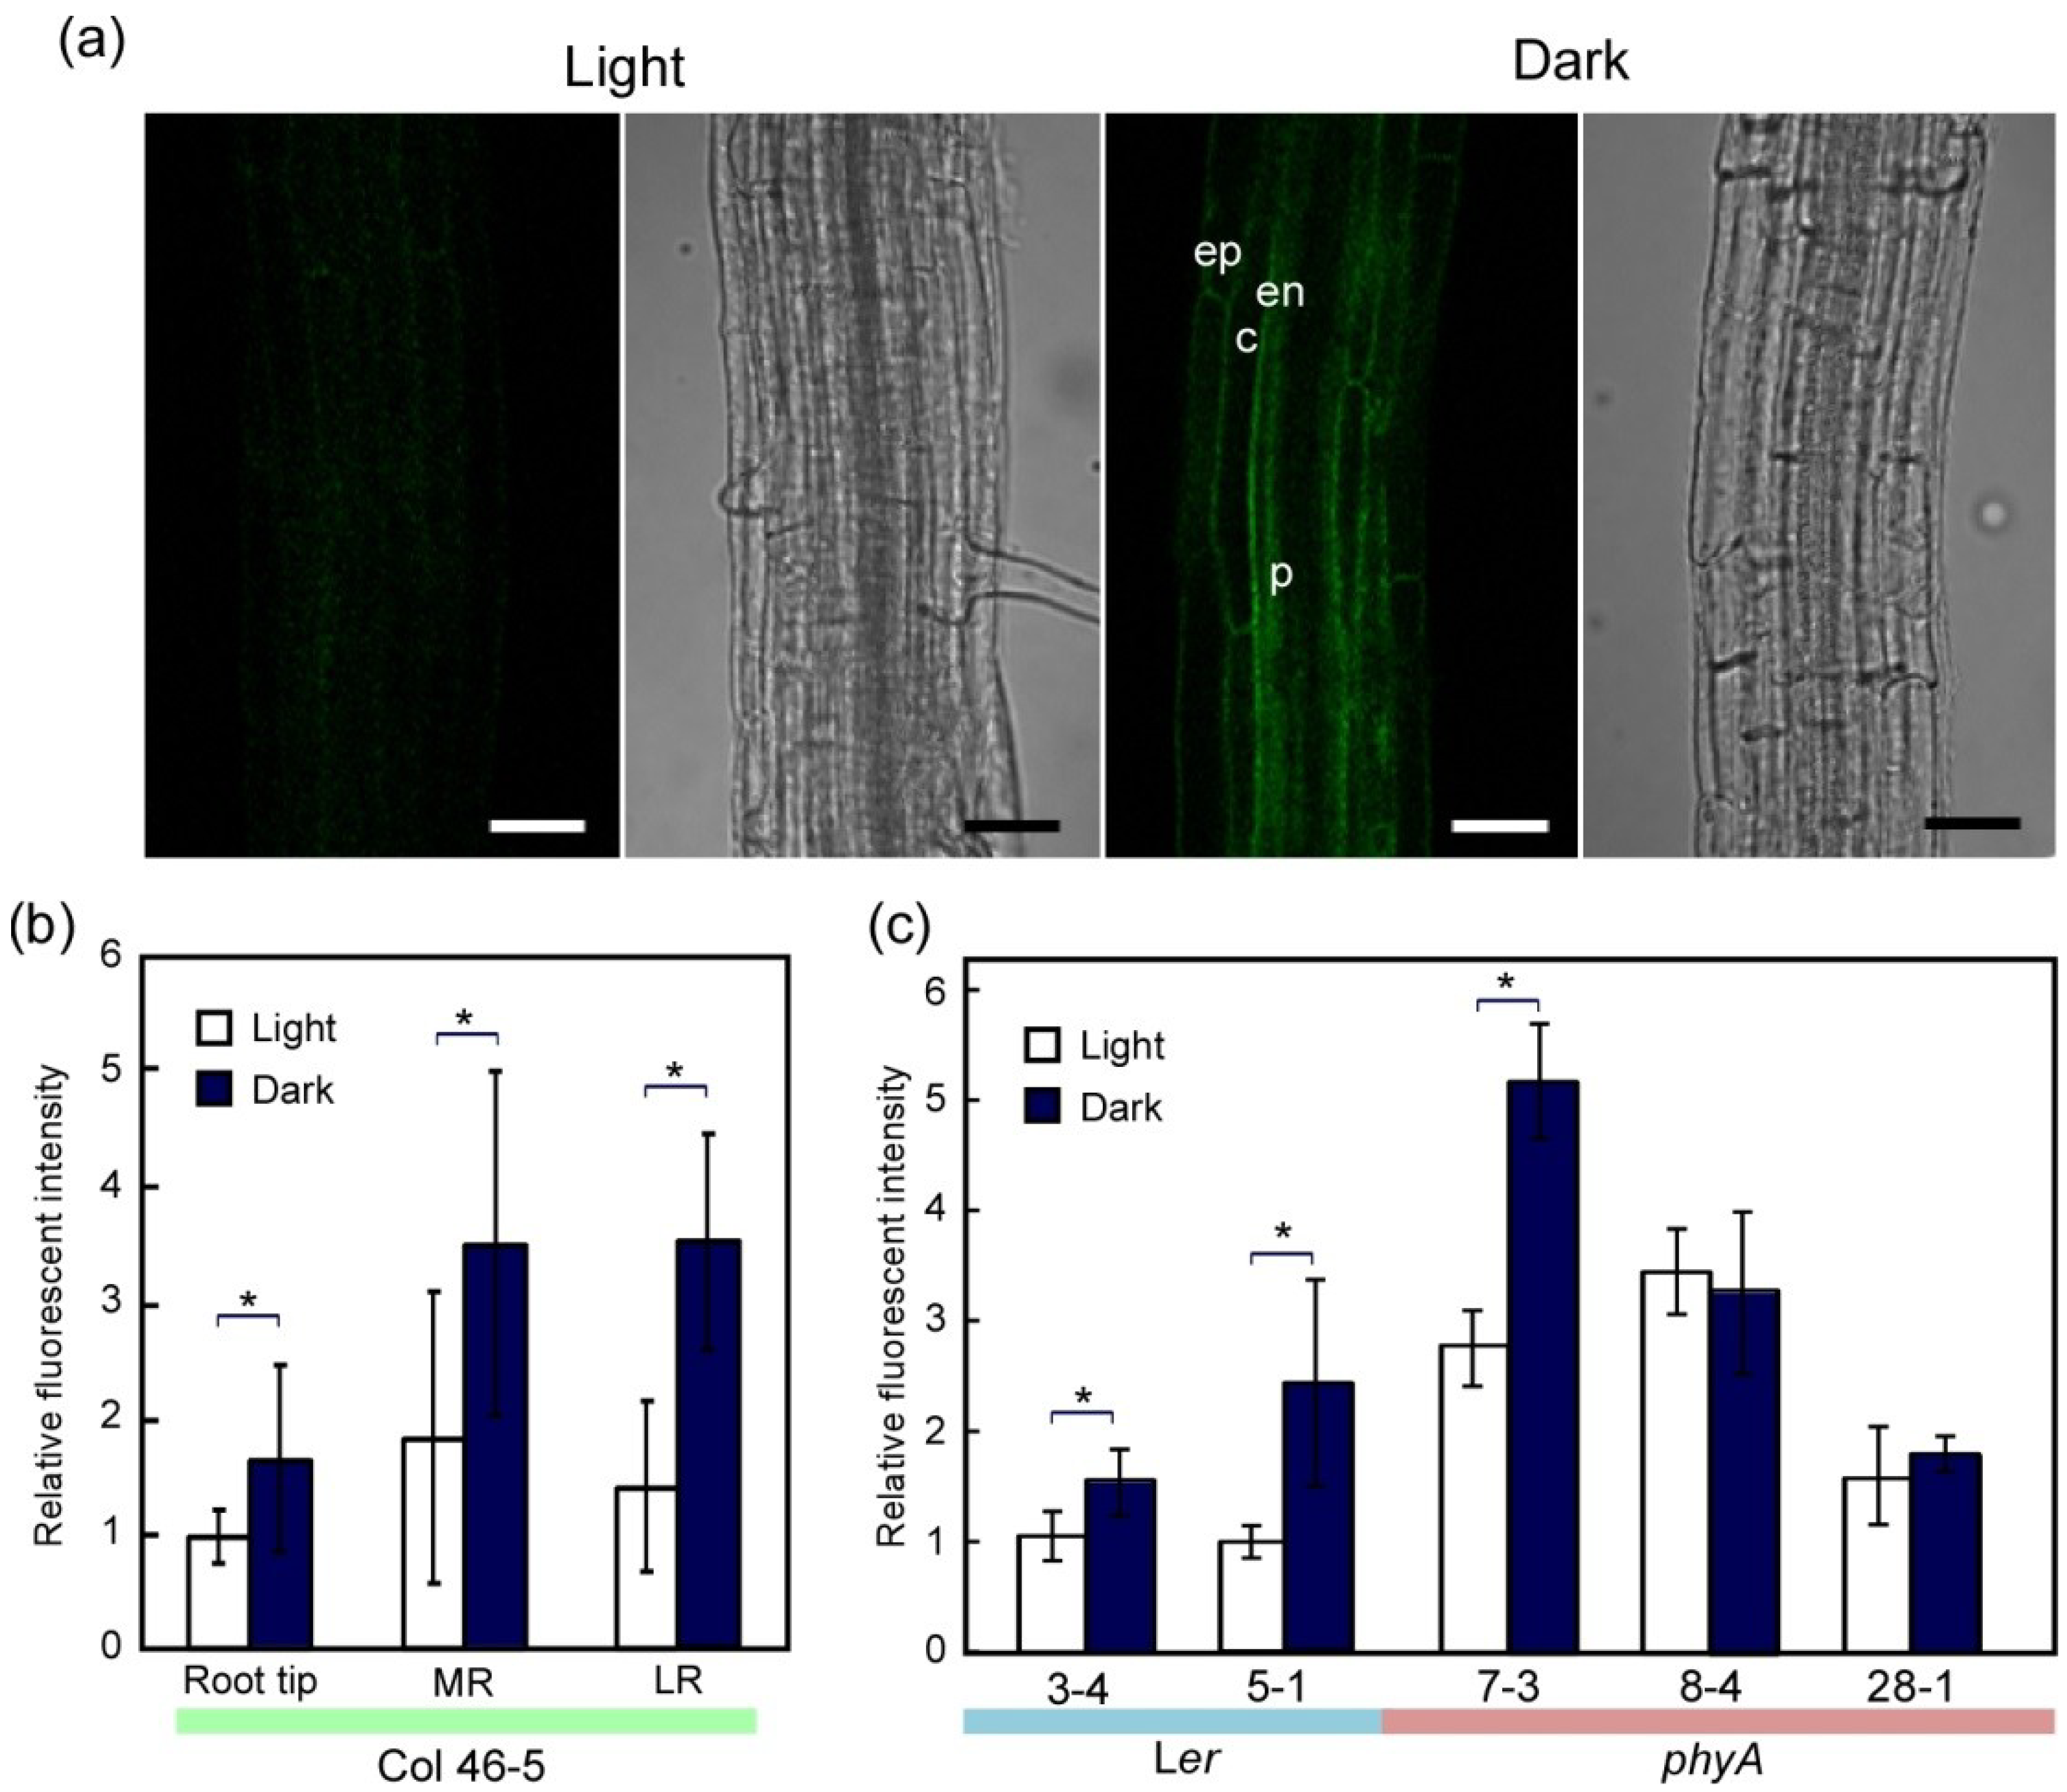
2.1. Effects of phyA Mutation on Fluorescent Intensity of TIP2;2-GFP under Light Conditions

In order to examine differences in protein levels of TIP2;2 under light and dark conditions, and between wild-type and phyA mutant, we generated transgenic Arabidopsis expressing a TIP2;2-GFP fusion gene driven by its own promoter (Supplementary Figure S1). RT-PCR and immunoblotting with anti-GFP antibodies confirmed that the TIP2;2-GFP fusion protein is expressed in the transgenic lines (Supplementary Figure S1). Using a confocal laser scanning microscope (LSM), GFP fluorescence was mainly observed on the tonoplast not the plasma membrane, in root cells of all lines (Supplementary Figure S1). Therefore, the exogenous TIP2;2-GFP might be correctly localized in the tonoplast in all transgenic lines. Approximately 1.9 kb of the 5' upstream region, which was used as the TIP2;2 promoter, contained 521 cis-elements based on searching an open database of cis-elements, PLACE (plant cis-acting regulatory DNA elements) [47]. Of these, 65 cis-elements are involved in light regulation (Supplementary Table S1), including the G-box, to which phytochrome interacting factors bind [48], and the conserved I-box sequence found upstream of many light-regulated genes [49]. Other cis-elements contained in the sequence were nine sugar-repressive elements [50], eight ABA-responsive elements [51] and 14 auxin-responsive elements [52] (Supplementary Table S1).

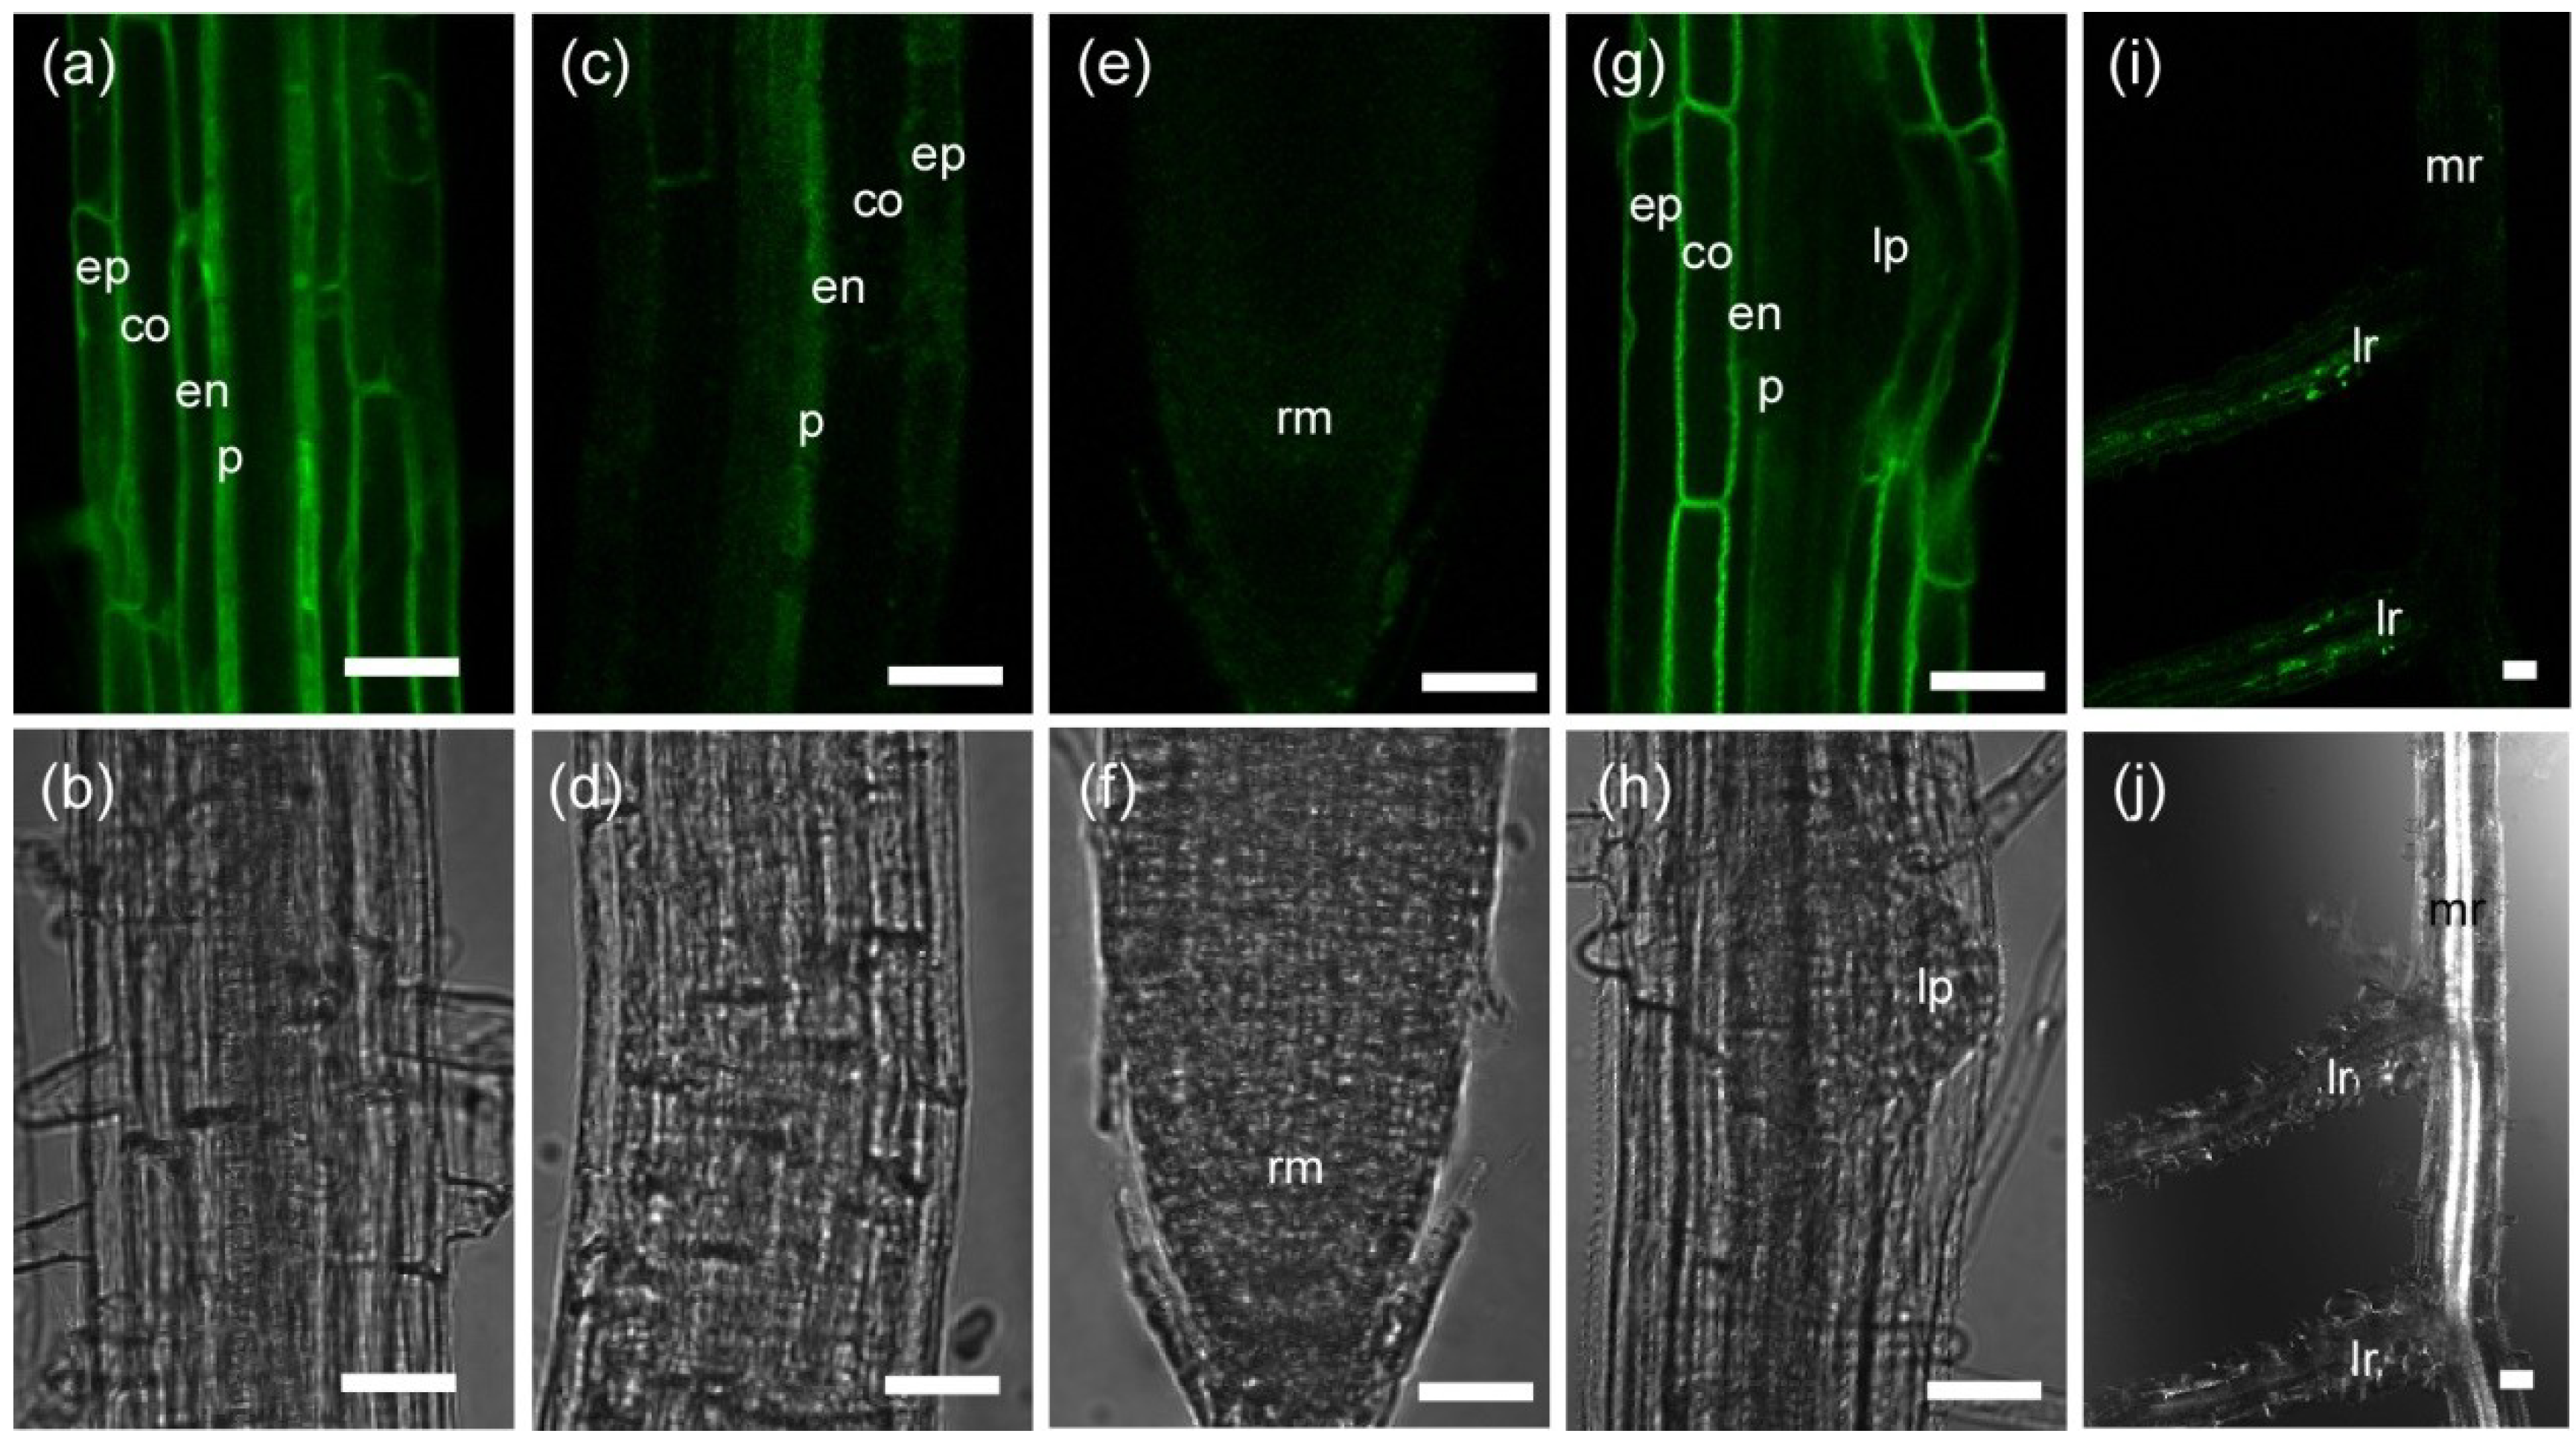
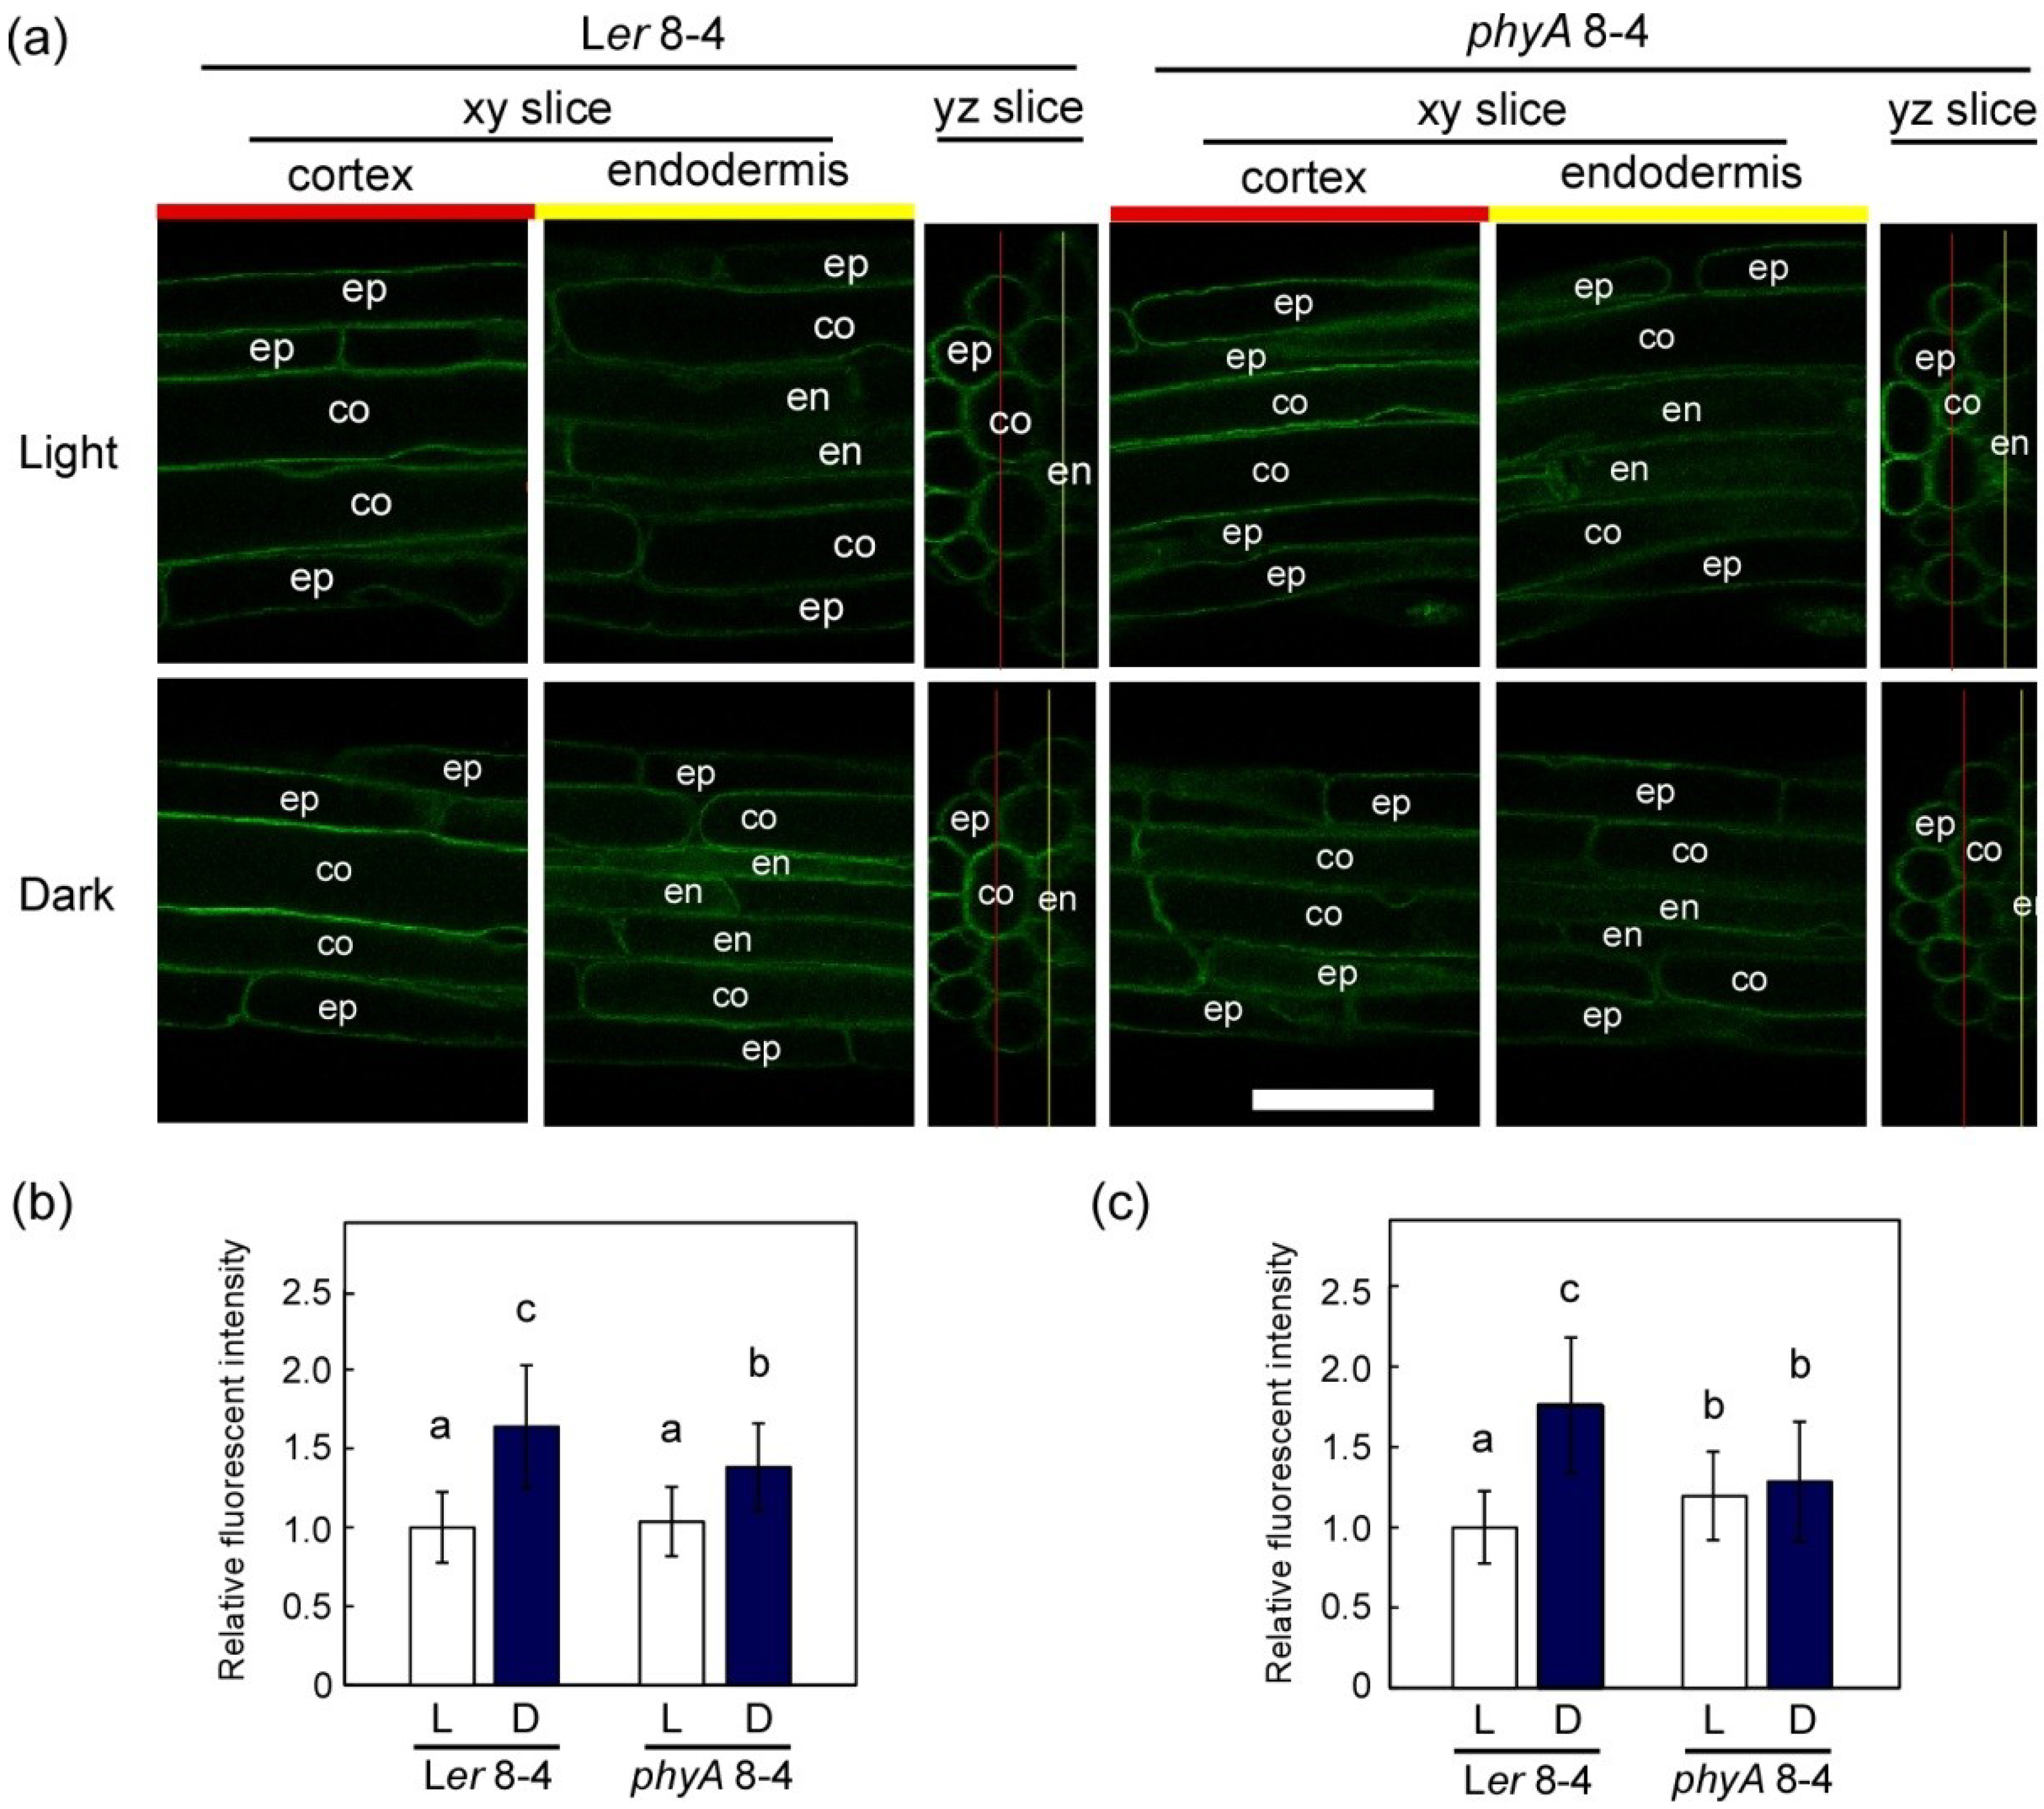
2.1.1. Tissue-Specific Localization of TIP2;2-GFP in the Wild Type and phyA Mutant

First, to examine differences between two ecotypes, Col and Ler, and between the wild type (Ler) and phyA mutant, we analyzed the tissue specificity of TIP2;2-GFP expression in roots of light-grown seedlings of Col, Ler and phyA lines. TIP2;2-GFP was detected in the pericycle, endodermis, cortex and epidermis of the mature region of the roots, but not in immature tissues such as the root apical meristem or the developing lateral root primordium (Figure 1).
Figure 1. Tissue-specific expression of TIP2;2-GFP in roots of Arabidopsis seedlings. Fluorescence (a,c,e,g,i) and transmitted light (b,d,f,h,j) images of roots of transgenic Col plants expressing a TIP2;2-GFP fusion protein driven by its own promoter. Seedlings were grown for 6 days (ah) or 11 days (i,j) in a 16 h light/8 h dark cycle. (ah) Mature region (a,b), border region of the elongation to mature zones (c,d), root tip (e,f), and lateral root primordium (g,h) of the primary root. (i,j) Growing lateral roots with bright fluorescence. co, cortical cell; en, endodermal cell; ep, epidermal cell; lp, lateral root primordium; lr, lateral root; mr, main root; p, pericycle cell; rm, root apical meristem. Bars, 50 µm.
Plants 03 00177 g001
The strongest fluorescence was detected in the mature region near the differentiation zone, and fluorescence weakened at a more basal region near the hypocotyl. Furthermore, a region of the growing lateral roots in the light-grown plants showed strong fluorescence (Figure 1i). Similar patterns were observed in the roots of all transgenic lines (3 Col, 3 Ler, and 4 phyA background-lines) except for slight differences in the timing of when the tissues began expression and in the fluorescent intensity of the inner tissues, as described below. In Col seedlings, TIP2;2-GFP was first expressed in the pericycle of the border region of the elongation to mature zones and expression expanded to the outer region (Figure 1c). However, in the seedlings with Ler and phyA backgrounds, TIP2;2-GFP was first expressed in the epidermis of the elongation zone (data not shown). This expression pattern resembled that in a previous study reporting that TIP2;2-YFP is first expressed in the cortex and epidermis and then expands to the pericycle during development [23]; these observations of TIP2;2-YFP transgenic plants in the Col background differ from ours in that TIP2;2-GFP expression in Col roots started in the pericycle and expanded to the epidermis. This difference may be due to the length of the promoter: Gattolin et al. [23] used approximately 1.4 kb of the upstream region of the TIP2;2 gene as its own promoter, and we used about 1.9 kb. Based on a PLACE database search [47], there are about 160 possible cis-elements (Supplementary Table S1), including some involved in light and hormone regulation, in the approximately 550 bp of the upstream region that we included and Gattolin et al. [23] did not. Furthermore, based on the differing expression patterns of TIP2;2-GFP in the Ler and Col backgrounds, the upstream region we used may contain some elements differing between ecotypes. However, additional experiments are necessary to clarify the cause of different tissue-specific localization of the fusion protein between ecotypes, or in our TIP2;2-GFP lines and their TIP2;2-YFP lines.

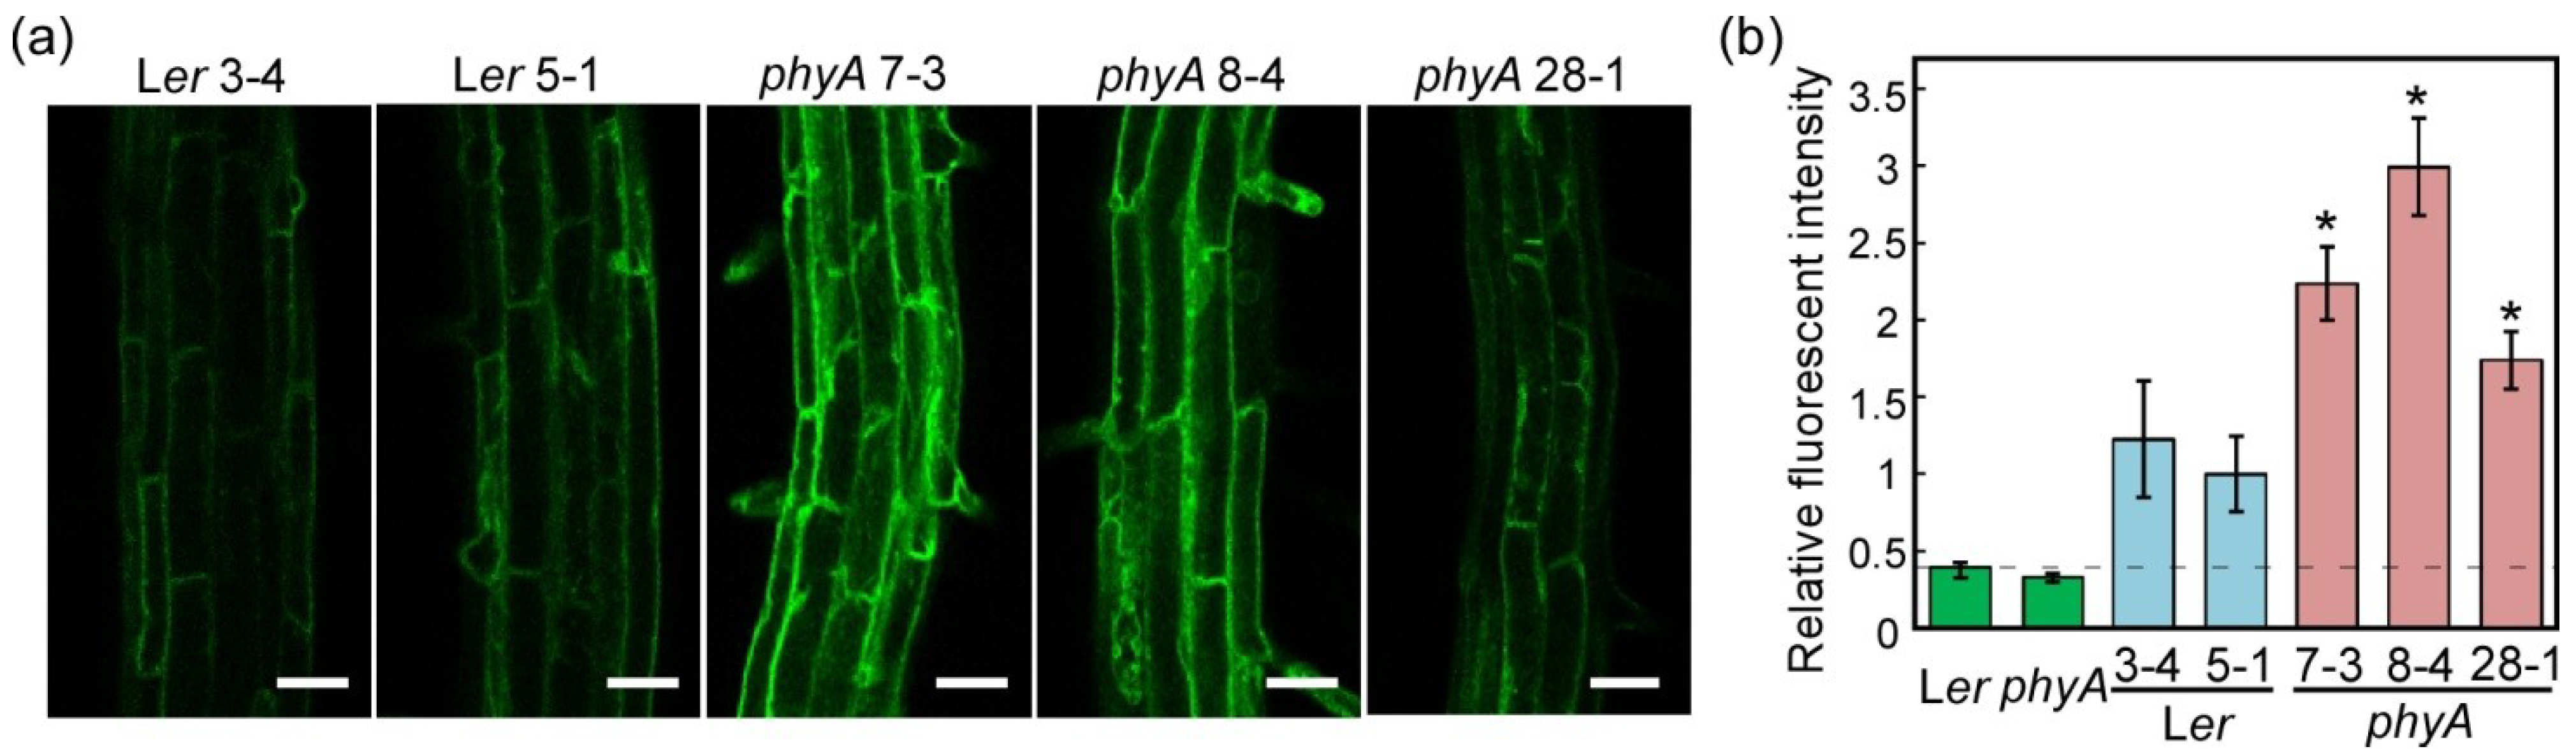
2.1.2. Fluorescence of TIP2;2-GFP in Light-Grown Wild-Type and phyA Mutant Plants

Next, we examined the effects of the phyA mutation on TIP2;2-GFP expression. In the roots of light-grown seedlings, the fluorescent intensity of three TIP2;2-GFP/phyA lines was higher than that of two TIP2;2-GFP/Ler lines (Figure 2). This difference in fluorescent intensity was consistent with immunoblotting results (Figure 3a) and other experiments of fluorescent intensity (Figure 4).
Figure 2. Relative fluorescent intensity in the roots of transgenic Arabidopsis expressing a TIP2;2-GFP fusion gene in plants of wild-type (Ler) and phyA mutant background. (a) Differing fluorescent intensity of TIP2;2-GFP in the roots of light-grown Ler and phyA mutant plants. Plants were grown on MS-agar medium for seven days in a 16 h light/8 h dark cycle. All images were acquired at approximately 5 mm from the root tip by LSM under the same conditions on the same day. Brightness and contrast of images were not modified. Bars, 50 µm; (b) Relative fluorescent intensity in the roots of light-grown Ler and phyA seedlings expressing a TIP2;2-GFP fusion gene. Relative fluorescent intensity is shown as the fold difference relative to the mean intensity of the Ler5-1 line. Results are means ± SD of five independent plants. Asterisks indicate statistical differences when compared with Ler5-1 using Welch’s t-test (* p < 0.05).
Plants 03 00177 g002
Figure 3. Light-dependent changes in aquaporin abundance in roots of Ler seedlings and phyA mutants during dark adaptation and FR illumination. Aliquots of solubilized crude membrane proteins were immunoblotted with anti-GFP and anti-γ-VM23 (TIP1) antibodies. After detection of TIP2;2-GFP, the same blot was used for TIP1 detection. The background lines were Ler and phyA, and transgenic plants are identified by line number (e.g., Ler3-4). (a) Immunoblots of TIP2;2-GFP in the roots of 7-day light-grown seedlings; (b) Diagrams of growth conditions. Seedlings were grown under 12 h irradiation with white light for three days and were then grown continuously in the light (12L12D, L) or dark (D) for another three days. Dark-adapted seedlings were illuminated by FR light for 1, 2 and 6 h; (c) Immunoblots of TIP2;2-GFP during dark adaptation and FR illumination. Growth conditions are shown in (b).
Plants 03 00177 g003
We randomly selected TIP2;2-GFP transgenic lines in the Ler and phyA backgrounds, but phyA lines showed a tendency to be brighter than Ler lines. To evaluate positional effects due to the insertion region of the transgene, we crossed the brightest line, TIP2;2-GFP/phyA8-4, with wild type (Ler) and observed the fluorescent intensity of the progeny. The segregation ratio of the F2 lines was PHYA: phyA = 3:1 (Table 1, χ2 = 0.00456) and phyA tip2;2-gfp: other phenotypes = 1:15 (χ2 = 1.54). The segregation ratio of the F2 lines obtained by backcrossing TIP2;2-GFP/phyA8-4 to phyA-201 was phyA tip2;2-gfp: phyA TIP2;2-GFP+ = 1:3 (χ2 = 1.75). Therefore, insertion of the TIP2;2-GFP transgene in TIP2;2-GFP/phyA8-4 can be considered a single locus unlinked to the phyA locus. Under stereoscopic observation, all of the plants with intense green fluorescence had the phyA phenotype. More than 60% of the F2 progeny with the wild-type phenotype displayed clear or detectable green fluorescence. We selected homozygote lines of TIP2;2-GFP and PHYA from the F3 progeny, and named one of the lines TIP2;2-GFP/Ler8-4.
Figure 4. Increase in TIP2;2-GFP protein levels during dark adaptation. (a) Fluorescent images of TIP2;2-GFP in the roots of light- and dark-grown TIP2;2-GFP/Col46-5 plants. Seedlings grown for seven days in the light were then grown continuously in the light or dark for another four days. Black and white bars, 50 µm; (b) Relative fluorescent intensity of TIP2;2-GFP in the main roots and lateral roots of light- and dark-grown TIP2;2-GFP/Col46-5 plants. The main roots and lateral roots of seven plants were scanned and the brightness of the GFP fluorescence was quantified. Average values for each root were plotted. Scanned areas: Root tip, area approximately 0.5 to 1.2 mm from the root tip of the main root; MR, area approximately 5 to 10 mm from the root tip of the main root; LR, area approximately 0.4 to 1 mm from the root tip of the young lateral root (approximately 0.6 to 1.2 mm long). Asterisks indicate statistical differences found using the Mann-Whitney U-test (* p < 0.05); (c) Comparison of TIP2;2-GFP signals in the roots of light- and dark-grown TIP2;2-GFP transgenic plants with a Ler or phyA background. Seedlings grown for four days in the light were then grown continuously in the light or dark for three days. The central regions, which contain the central cylinder and protoxylem, of main roots were scanned at approximately 5 mm from the root tip and the brightness of the GFP fluorescence was quantified. Results are means ± SD of seven independent plants. Asterisks indicate statistical differences found using Student’s t-test (* p < 0.05).
Plants 03 00177 g004
Table 1. Segregation ratios of wild-type and phyA mutated F2 progeny from TIP2;2-GFP/phyA8-4 plants crossed with Ler plants or phyA-201 plants.
F2 plantNumber of plants classified with phyA mutation and fluorescent intensity *1χ2 values *2 Expected frequency
PHYAphyA
++++++
TIP2;2-GFP/
phyA 8-4 × Ler
0371821420.00456
[PHYA]: [phyA] = 3:1
1.54
[PHYA or GFP+]: [phyA gfp] = 15:1
TIP2;2-GFP/
phyA 8-4 ×phyA
00021831.75
[GFP+]:[gfp] = 3:1
*1 Fluorescent intensities of roots classified into strong (++), detectable (+) and undetectable (−) under stereoscopic observation; *2 All the calculated values of χ2 were less than the value for χ20.95 = 3.84 with one degree of freedom, suggesting that each expected frequency is acceptable.
We grew the TIP2;2-GFP/Ler8-4 and the TIP2;2-GFP/phyA8-4 lines in the light and observed them by LSM. In both lines, the fluorescent intensity of TIP2;2-GFP in the outer sliced images containing the epidermis and cortex of the roots was similar (Figure 5a,b). However, in the inner slices containing endodermis of the roots in light-grown plants, the fluorescent intensity of phyA8-4 was slightly higher than that of Ler8-4 (Figure 5a,c). The TIP2;2-GFP fluorescence of the roots of light-grown Ler8-4 plants tended to be weak in the endodermis, but strong in the epidermis and cortex (Figure 5a). Based on the results, we estimate that the differences in TIP2;2-GFP expression levels between Ler and phyA mutant backgrounds under light conditions (Figure 2, Figure 3 and Figure 4) is largely derived from the differences in the insertion sites of the TIP2;2-GFP genes. In the light-grown plants, differences in fluorescent intensity between Ler and phyA are thought to be limited to the inner region of roots (Figure 5).

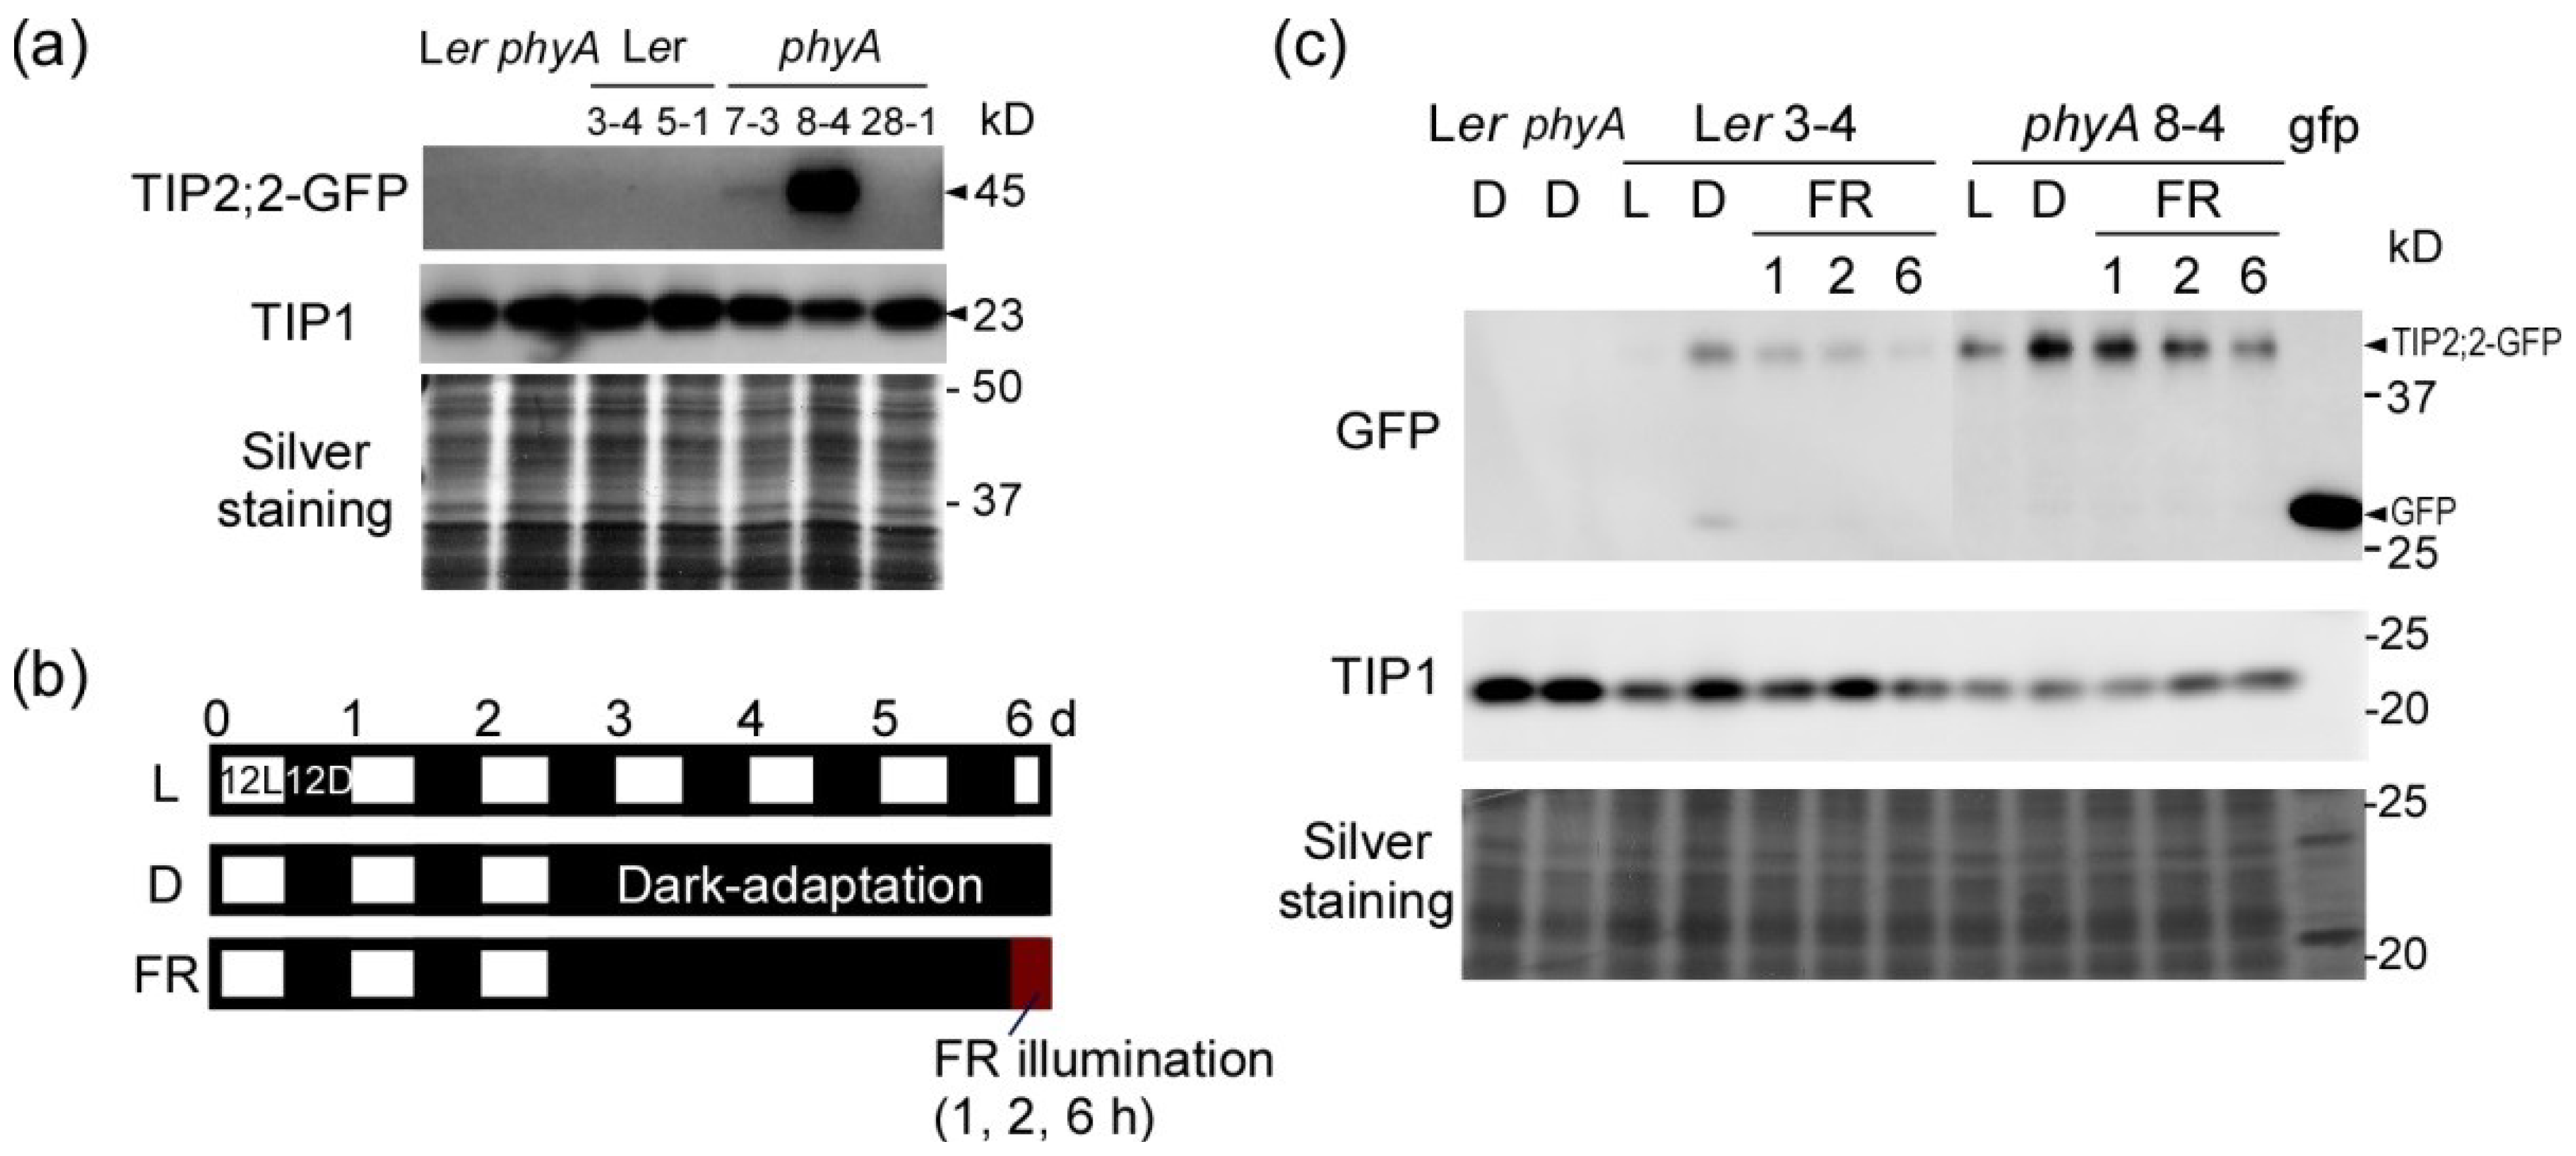
2.2. Dark-Induced Increase in TIP2;2-GFP

Next, we examined the effects of dark adaptation on TIP2;2-GFP expression. In the TIP2;2-GFP/Ler lines, the amount of TIP2;2-GFP protein increased during dark adaptation (Figure 3). The increase in amounts of TIP2;2-GFP is consistent with the fluorescent intensity of TIP2;2-GFP in the Ler and Col lines (Figure 4). An increase in protein levels during dark adaptation was also observed in the TIP2;2-GFP/phyA lines, although the increase was low in TIP2;2-GFP/phyA8-4 (Figure 3). This tendency of each phyA line roughly matched the results from image analysis, but the TIP2;2-GFP fluorescence in the center region of phyA8-4 roots hardly changed during dark adaptation (Figure 4c). TIP1 also slightly increased during dark adaptation in Ler but not phyA (Figure 3c).
Because the increase in TIP2;2-GFP fluorescence during dark adaptation differed among independent phyA lines, we analyzed the TIP2;2-GFP fluorescence of phyA8-4 and its progeny Ler8-4 in detail. In both lines, fluorescent intensity of TIP2;2-GFP in the outer sliced images containing the epidermis and cortex of the roots increased during dark adaptation (Figure 5a,b). The increase in Ler8-4 was higher than in phyA8-4. In the inner slices containing the endodermis of the roots, the fluorescent intensity increased during dark adaptation of Ler8-4, but not phyA8-4 (Figure 5c). Strong TIP2;2-GFP fluorescence in the endodermal cells of dark-adapted Ler8-4 plants was more frequently observed than in light-grown plants (Figure 5a). Furthermore, in the TIP2;2-GFP/Col lines, stronger fluorescence was observed in the endodermal cells of dark-adapted roots (Figure 4a).
Figure 5. Comparison of TIP2;2-GFP protein levels in epidermal, cortical and endodermal cells between Ler and phyA mutant during dark adaptation. Seedlings grown for three days in the light were then grown continuously in the light or the dark for another three days. The insertion sites of TIP2;2-GFP transgenes in the genomes of both Ler8-4 and phyA8-4 lines were identical. (a) Fluorescent images of TIP2;2-GFP in outer (epidermis-cortex) and inner (epidermis-endodermis) optical sections of the roots of light- and dark-grown TIP2;2-GFP transgenic plants with a Ler or phyA background. Transverse sections (yz slices) were digitally reconstituted using multiple longitudinal optical sections (xy slices). The red and yellow lines in each yz image indicate the positions of the two xy longitudinal images beside it. The main roots were scanned at approximately 5 mm from the root tip. Bar, 50 µm; (b,c) Comparison of TIP2;2-GFP signals in the roots of light- and dark-grown TIP2;2-GFP transgenic plants with a Ler or phyA background. The brightness of the GFP fluorescence of each image of epidermis-cortex (b) and epidermis-endodermis (c) slices was quantified. Results are means ± SD of three independent plants. Different letters indicate statistical differences found using Scheffe’s F test (p < 0.05).
Plants 03 00177 g005
Lack of a dark-adapted increase in TIP2;2-GFP in the endodermal cells of the phyA mutant suggests that phyA signaling is involved in the mechanism leading to this change. Although it is not clear why an increase in TIP2;2-GFP in endodermal cells is more phyA-dependent than in the cortex and epidermis, this light response in the endodermal cells might be important for regulating water and solute transport in the roots because the endodermal tissues generally act as an efficient barrier to ions moving through the apoplast [53] and the site where transport of solutes is regulated [54,55].
In the dark-adapted plants, weak GFP fluorescence was also detected in the lumen of the vacuole (Figure 5a). This is consistent with low levels of proteins that had the same size as a GFP monomer (approximately 27 kD) also being detected in the dark-adapted plants (Figure 3c). Conversely, in the light, this presumed GFP monomer was not detected. Vacuolar GFP is rapidly degraded in the light [56], suggesting that tonoplast aquaporins taken up into vacuoles are also degraded at a constant speed in the light, and their degradation is slowed down in the dark. This behavior may lead to a dark-induced increase in the amount of aquaporins.

2.3. PhyA Regulation of Aquaporins

PhyA is the sole photoreceptor to respond to continuous FR light in Arabidopsis [57]. To confirm phyA regulation of the TIP2;2 protein, we compared the changes in protein levels in the roots of Ler and a phyA mutant under FR illumination. In the roots of the Ler lines, the amount of TIP2;2-GFP protein decreased 1 h after FR illumination, and further decreased by 6 h (Figure 3c). In phyA roots, the amount of TIP2;2-GFP slightly decreased at 1 h after FR illumination, and stayed at relatively high levels at 2 and 6 h after FR illumination. These different patterns of protein levels in Ler and phyA as well as the lack of a dark-adapted increase in TIP2;2-GFP in the phyA mutant suggest that phyA signaling is partly involved in the reduction in TIP2;2-GFP in the light. Further studies are required to clarify the direct and indirect roles of phyA in regulation of the TIP2;2 abundance.
Modification of the rates of transcription [31] and translation, as well as degradation, of the protein might be involved in this rapid drop in TIP2;2-GFP 1 h after FR illumination (Figure 3c). In the phyA mutant, the observed slower rate of decrease suggests the involvement of phyA in the early phases of FR illumination. In later phases, TIP2;2-GFP levels were similar to those in the light, suggesting that other factors are also involved in this process. The involvement of other factors are also indicated by fluorescent analysis of epidermal and cortical cells, in which the phyA mutant showed a dark-induced increase in TIP2;2-GFP (Figure 5b) and by immunoblots using crude membrane proteins from whole roots (Figure 3c). The results indicate that a light-responsive mechanism to decrease the amount of TIP2;2 functions normally in wild-type plants, but this function is weakened in the phyA mutant. In the vacuolar lumen, all proteins seem to be more rapidly degraded in the light than in the dark [56]. It is not known how tonoplast proteins are degraded, or whether the degradation mechanisms of both the proteins in the vacuolar lumen and in the tonoplast are similar. Further analysis of the mechanisms behind the sudden drop in TIP2;2-GFP in the early phase of FR exposure may provide insight into tonoplast protein degradation systems in both the dark and light.

2.4. Why TIP2;2 Increases during Dark Adaptation

One of the mechanisms responsible for the increase in amount of TIP2;2 protein in the dark is transcriptional regulation of the gene. In addition to numerous cis-elements in light regulation, multiple potential sugar-repressive elements [50] are included in the TIP2;2 promoter (Supplementary Table S1). Furthermore, the TIP2;2 gene is induced by decreasing the sucrose concentration in the medium [31]. Thus, decreasing the amount of sucrose or photosynthetic products during a long dark period could cause an increase in aquaporin gene expression. Aquaporins can transport small neutral molecules as well as water [6]. It is thought that limited energy in the dark and degradation of various macromolecules [58] brings about the necessity of transporting toxic ammonia/ammonium either to the vacuole for isolation or to other subcellular compartments for production of other dark-required compounds. With respect to the pKa of 9.24 for the deprotonation of ammonium to ammonia and the cytosolic pH of 7.0 to 7.5, approximately 1% of the total cytoplasmic ammonia/ammonium is present in an uncharged form [16]. The uncharged form of ammonia can be passively transported by TIP2 subfamily of aquaporins, TIP2;1 and TIP2;3, from the cytosol to the vacuole [16]. The ammonia diffusing across the tonoplast subsequently binds a proton to form ammonium, which is trapped in the acidic vacuolar lumen.
TIP2;2 is quite similar to TIP2;1 and TIP2;3, which transport water, urea, and ammonia [15,16,18], thus suggesting that TIP2;2 also transports these molecules. The increase in the amount of TIP2;2-GFP during dark adaptation may compensate for the lowering transport efficiency of aquaporins. Increased aquaporins might facilitate efficient water and solute transport across the membranes, even if the driving forces such as osmotic and hydrostatic pressure gradients are lowered. The passive transport of ammonia by aquaporins is dependent on the pH gradient between the cytosol and the vacuolar lumen, which is mainly generated by two proton pumps [4]. The long dark condition without photosynthesis could lower the activities of proton pumps, and thus lower the pH-dependent transport of ammonia by aquaporins as well as other transporters whose transport is dependent on a chemical and/or electrical gradient between both sides of the tonoplast. Water transport by aquaporins is also correlated with solute transport because the osmotic pressure gradient is one of the driving forces of water movement [59].
Vacuoles can be classified by the type of TIP found in the tonoplast and TIP2;2 is a type of δ-TIP, which is generally in the tonoplast of storage vacuoles [4]. Because TIP2;2 is also one of the major aquaporins in Arabidopsis roots [46], it probably plays an important role in light-grown plants. The increase in TIP2;2 during dark adaptation suggests that vacuolar function is modified by light and that the physiological function of TIP2;2-containing vacuoles may be altered during long dark periods.
Alternatively, TIP2;2, in concert with other aquaporins, may facilitate water flow from the epidermis to the xylem in the central cylinder of roots. Intriguingly, TIP2;2-YFP and TIP2;3-YFP are present in the rows of pericycle cells that form the xylem poles [23]. We did not examine the fluorescent intensity of pericycle cells or the location of fluorescent cells, although several pericycle cells displayed clear fluorescence (Figure 4 and Figure 5). The increase in TIP2;2 in the endodermal cells during dark adaptation is also associated with the important role of transport of water and solutes into the central cylinder. Further analysis of the mechanism of light regulation of aquaporins should lead to a better understanding of the tissue- and cell-specific roles of TIP2;2 in both the light and dark.

3. Experimental

3.1. Plant Material and Growth Conditions

Arabidopsis thaliana Ler (NW20) and phyA-201 (N6219) lines were obtained from the NASC (Nottingham Arabidopsis Stock Centre, Loughborough, UK), and Col-0 (J58) was obtained from the SASSC (Sendai Arabidopsis Seed Stock Center, Sendai, Japan). Seeds were surface-sterilized and sown on the surface of Murashige and Skoog (MS) medium containing 1% agar and 1% sucrose in square styrene plastic cases (90 × 70 × 23 mm). Approximately 20 seeds (for fluorescent intensity analysis) or 300 seeds (for protein extraction) per case were sown in two rows. After vernalization at 4 °C for two days, seeds were cultured vertically at 22 °C under 12 or 16 h illumination (12L12D or 16L8D photoperiods) with cool white fluorescent light of 15 W/m2. FR light was provided by a light-emitting diode (LED; 730 nm, 6.2 W/m2; MIL-IF18; Sanyo, Tokyo, Japan) with MIL-U200 frames and a MIL-C1000T controller system. Fluence rates were measured with a model LI-250 radiometer (Li-Cor, Lincoln, NE, USA). Roots of the plants under dark adaptation were harvested using a glove box in total darkness, as described previously [31]. Sampling tubes containing roots were wrapped in aluminum foil before withdrawing them from the glove box, and were immediately frozen in liquid nitrogen. Frozen roots were stored at −80 °C.

3.2. Fluorescent Intensity Analysis

GFP fluorescence intensity was measured using a C1siR confocal LSM (Nikon Instruments, Tokyo, Japan). Fresh roots excised from seedlings were immediately immersed in Arabidopsis hydroponic medium [60] on slides and were observed by LSM. To image GFP, the 488 nm line was used for excitation, and emission was detected at 515/30 nm. For semiquantitative measurement of fluorescence intensity, the laser, pinhole and gain settings of the LSM were kept identical among treatments. The fluorescence intensity of each digital image was analyzed using EZ-C1 software [61] as shown in Supplementary Figure S2. Images were assembled using Photoshop software [62].

3.3. Protein Preparation

Frozen roots (100–200 mg) were crushed with a Multi-beads Shocker cell disruptor (Yasui Kikai, Osaka, Japan), after which 7 µL mg−1 root of cold extraction buffer (100 mM Tris-HCl (pH 8.0), 300 mM NaCl, 20 mM EDTA, 20% (w/v) glycerol, 5 mM dithiothreitol (DTT) and 1× Complete Protease Inhibitor Cocktail (Roche Applied Science, Tokyo, Japan)) was immediately added, and the mixture was homogenized with the Multi-beads Shocker at 4 °C. The homogenate was strained through a filtration apparatus and centrifuged at 10,000 rpm for 10 min at 4 °C. The supernatant was recovered and centrifuged again at 100,000× g for 30 min at 4 °C. The pellet was used as the microsomal membrane fraction. The pellet was resuspended in 0.2 µL mg−1 root extraction buffer. After protein concentrations were determined, each microsomal membrane fraction was frozen in liquid nitrogen and stored at −80 °C. Protein concentrations of the soluble and membrane protein samples were determined using a Bio-Rad protein assay kit (Bio-Rad, Tokyo, Japan) with γ-globulin as a standard.

3.4. Immunoblotting

Each microsomal membrane fraction was mixed with an equal volume of 2× SDS-PAGE sample buffer and incubated for 10 min at 70 °C. SDS-PAGE in 9% and 12% (w/v) polyacrylamide gels containing 0.1% SDS was carried out by the method of Laemmli (1970). For immunoblotting, proteins in polyacrylamide gels were transferred to a Clear Blot P polyvinylidene difluoride membrane (ATTO, Tokyo, Japan) with a semidry blotting apparatus using standard procedures. The membrane was blocked with 2% (w/v) ECL Advance Blocking Agent (GE Healthcare, Tokyo, Japan) in TBS-T buffer (20 mM Tris-HCl (pH 7.6), 0.14 M NaCl, 0.1% (v/v) Tween 20) overnight at 4 °C. The membrane was incubated with the appropriate primary antibody for 1 h at 20 °C. Concentrations of antibodies were: 1:500 dilution of anti-GFP antibody (Clontech A.v. peptide antibody, polyclonal; Takara-Bio, Shiga, Japan) and 1:10,000 dilution of anti-TIP1 antibody (γVM23, [63]). After washing for 15 min and another three times for 5 min with TBS-T, blots were incubated with secondary antibody, a 1:100,000 dilution of ECL anti-rabbit IgG, horseradish peroxidase-linked species specific whole antibody (from donkey, NA934V, GE Healthcare, Tokyo, Japan) for 1 h at 20 °C. After washing as described above, antibody conjugates were detected using an ECL Advance chemiluminescent reagent (GE Healthcare, Tokyo, Japan) according to the manufacturer’s instructions. Chemiluminescence images were acquired using a LAS-3000 luminescent imaging system (Fujifilm, Tokyo, Japan), and were quantitated using MultiGauge software [64]. After detection, each immunoblot was stripped of probe according to Kaufmann and Kellner [65], and reprobed using an anti-TIP1 antibody. All protein samples used for immunoblotting were electrophoresed on other gels and gels were stained by standard procedures with silver or Coomassie brilliant blue R-250.

3.5. Generation of TIP2;2-GFP Transgenic Lines

In order to generate a TIP2;2 promoter::TIP2;2::sGFP construct (TIP2;2-GFP), a 2.9-kb genomic region containing the TIP2;2 gene and a 1.9 kb upstream region was PCR amplified from the genomic DNA of Col-0 using primers TIP2;2-1190F and TIP2;2-4035R (Supplementary Table S2). PCR products were cloned into vector ENTR/D-TOPO (Invitrogen, Tokyo, Japan) before recombination into the destination vector pGWB404 using Gateway technology [66]. Correct in-frame GFP insertion was verified by DNA sequencing. The construct was introduced into Agrobacterium tumefaciens GV3101 before transformation of Arabidopsis Col-0, Ler, and phyA-201 plants by floral dipping [67]. Transgenic plants were either selected on kanamycin or identified by GFP fluorescence of roots under an M165 FC fluorescence stereomicroscope (Leica Microsystems, Tokyo, Japan). From 15,000 seeds of Col and 5000 seeds each of Ler and phyA, 119 Col, 24 Ler and 30 phyA kanamycin-resistant T1 plants were selected. More than 10 independent T2 plants were further selected. The transgenic lines showing 100% kanamycin resistance were observed under a confocal LSM. F1, F2, and F3 progeny of TIP2;2-GFP/phyA 8-4 crossed to Ler were selected by the hypocotyl phenotype of the seedlings grown under FR illumination for five days [68] in addition to GFP fluorescence and kanamycin resistance.

3.6. Protoplast Preparation

Roots of six-day-old seedlings (Col-0, TIP2;2-GFP-46-5 and TIP2;2-GFP-40) were cut longitudinally with a razor while immersed in a few drops of Arabidopsis hydroponic medium (0.015 M NaH2PO4, 2.6 mM Na2HPO4, 1.5 mM MgSO4, 0.03 M KNO3, 0.14 mM Fe(III) EDTA, 0.02 M Ca(NO3)2, 0.1 mM MnSO4, 0.3 mM H3BO3, 0.01 mM ZnSO4, 9.6 µM CuSO4, 0.24 µM (NH4)6Mo7O24, 1.2 µM CoC12 [60]) on a slide. Root tissues were transferred to a sample tube, and were incubated in 0.2 mL protoplast enzyme solution [2% (w/v) cellulase Onozuka RS (Yakult Pharmaceutical, Tokyo, Japan), 0.1% (w/v) macerozyme R-10 (Yakult Pharmaceutical, Tokyo, Japan), 0.03% (w/v) pectolyase Y23 (Kikkoman, Tokyo, Japan), 20 mM MES-KOH (pH 5.5), 2 mM DTT, 0.39 M sorbitol] at 22 °C for 60 to 90 min [69]. Enzyme solution was then gently removed and protoplasts were washed twice in 0.5 mL washing solution (0.4 M sorbitol in Arabidopsis hydroponic medium). Gravitated protoplasts were gently suspended in 20 µL of washing solution and were observed under a confocal LSM.

3.7. RT-PCR

Roots of two-month-old plants (Col-0, TIP2;2-GFP-46-5 and TIP2;2-GFP-40) were excised and immediately immersed in Ambion RNAlater reagent (Applied Biosystems, Tokyo, Japan). The immersed roots were kept at 4 °C overnight. Fixed tissues were removed from the reagent, immediately frozen in liquid nitrogen, and stored at −80 °C. Frozen samples were crushed using the Multi-beads Shocker and total RNA was isolated using an RNeasy Plant Mini Kit (Qiagen, Tokyo, Japan). After treatment with RNase-free DNase I (Invitrogen, Tokyo, Japan), a 1 µg aliquot of total RNA was reverse transcribed using 200 U PrimeScript II RTase (Takara Bio, Otsu, Japan). cDNA was amplified by PCR using Ex Taq polymerase (Takara Bio) and primers TIP2;2cDNA-1F and TIP2;2-sGFP-976R (Supplementary Table S2). TIP2;2-sGFP-1266R was also used. PCR of TIP2;2-GFP was performed as follows: 94 °C for 9 min; 32 cycles at 94 °C for 30 s, 57.3 °C for 30 s, and 72 °C for 1 min; then 72 °C for 10 min. Expression levels of Actin-8 (At1g49240) were also examined as an internal control. PCR of Actin-8 was performed under the same conditions as for TIP2;2-GFP except for annealing temperature (55 °C), extension time (30 s), and primers (ACT8F and ACT8R, Supplementary Table S2).

4. Conclusions

In this paper, we presented evidence for the involvement of a phyA signaling pathway in light regulation of aquaporin TIP2;2. We also proposed that phyA signaling directly or indirectly influences the tissue-specific localization of TIP2;2-GFP and/or functional modification of the tonoplast. These modifications to the amount and localization of TIP2;2 during dark adaptation and FR illumination could change the permeability to water and some solutes via the tonoplast of root cells. During a long dark period, various slow-acting cellular processes allow survival. TIP2;2 may play a role in such processes in the roots of dark-adapted plants. The findings in this paper provide a basis to clarify the mechanisms regulating water and solute transport based on a plant’s light environment.

Supplementary Files

Supplementary File 1

Acknowledgments

We would like to thank R. Nagai and M. Tango, NWU, for technical assistance with this study. We are grateful to A. Sakai and M. Araki, NWU, for helpful advice and use of equipment for analyzing aquaporin expression. We thank T. Nakagawa, Shimane Univ., for providing a Gateway binary vector, and M. Murai, NARCT, for helpful advice on protoplast preparation. This work was supported by a Nara Women’s University Intramural Grant for Project Research to K.S.-N. and a Grant-in-Aid for Challenging Exploratory Research (KAKENHI 24657032) to K.S.-N.

Author Contributions

Yumi Uenishi and Ayako Tsuchihira generated a TIP2;2-GFP construct and transgenic lines with Col background. Kayo Hashimoto generated transgenic lines with Ler and phyA backgrounds. Yumi Uenishi carried out fluorescent observation with Col, and Yukari Nakabayashi did with Ler and phyA lines. Yumi Uenishi, Mari Takusagawa and Kumi Sato-Nara carried out immunoblot analysis and data analysis. Masayoshi Maeshima promoted this work by exactly the right instructions, especially, for immunoblot analysis of microsomal membrane fraction. Kumi Sato-Nara wrote the paper with Yumi Uenishi, Ayako Tsuchihira and Masayoshi Maeshima, and supervised all work.

Conflicts of Interest

The authors declare no conflict of interest.

References

  1. Taiz, L. The plant vacuole. J. Exp. Biol. 1992, 172, 113–122. [Google Scholar]
  2. Marty, F. Plant vacuoles. Plant Cell 1999, 11, 587–600. [Google Scholar]
  3. Frigerio, L.; Hinz, G.; Robinson, D.G. Multiple vacuoles in plant cells: Rule or exception? Traffic 2008, 9, 1564–1570. [Google Scholar] [CrossRef]
  4. Martinoia, E.; Maeshima, M.; Neuhaus, H.E. Vacuolar transporters and their essential role in plant metabolism. J. Exp. Bot. 2007, 58, 83–102. [Google Scholar] [CrossRef]
  5. Maurel, C. Plant aquaporins: Novel functions and regulation properties. FEBS Lett. 2007, 581, 2227–2236. [Google Scholar] [CrossRef]
  6. Katsuhara, M.; Hanba, Y.T.; Shiratake, K.; Maeshima, M. Review: Expanding roles of plant aquaporins in plasma membranes and cell organelles. Funct. Plant Biol. 2008, 35, 1–14. [Google Scholar] [CrossRef]
  7. Maurel, C.; Santoni, V.; Luu, D.T.; Wudick, M.M.; Verdoucq, L. The cellular dynamics of plant aquaporin expression and functions. Curr. Opin. Plant Biol. 2009, 12, 690–698. [Google Scholar] [CrossRef]
  8. Johnson, K.D.; Herman, E.M.; Chrispeels, M.J. An abundant, highly conserved tonoplast protein in seeds. Plant Physiol. 1989, 91, 1006–1013. [Google Scholar] [CrossRef]
  9. Johanson, U.; Karlsson, M.; Johansson, I.; Gustavsson, S.; Sjövall, S.; Fraysse, L.; Weig, A.R.; Kjellbom, P. The complete set of genes encoding major intrinsic proteins in Arabidopsis provides a framework for a new nomenclature for major intrinsic proteins in plants. Plant Physiol. 2001, 126, 1358–1369. [Google Scholar] [CrossRef]
  10. Maurel, C.; Reizer, J.; Schroeder, J.I.; Chrispeels, M.J. The vacuolar membrane protein γ-TIP creates water specific channels in Xenopus oocytes. EMBO J. 1993, 12, 2241–2247. [Google Scholar]
  11. Kaldenhoff, R.; Fischer, M. Functional aquaporin diversity in plants. Biochim. Biophys. Acta 2006, 1758, 1134–1141. [Google Scholar] [CrossRef]
  12. Maurel, C.; Kado, R.T.; Guern, J.; Chrispeels, M.J. Phosphorylation regulates the water channel activity of the seed-specific aquaporin α-TIP. EMBO J. 1995, 14, 3028–3035. [Google Scholar]
  13. Leitão, L.; Prista, C.; Moura, T.F.; Loureiro-Dias, M.C.; Soveral, G. Grapevine aquaporins: Gating of a tonoplast intrinsic protein (TIP2;1) by cytosolic pH. PLoS One 2012, 7, e33219. [Google Scholar]
  14. Vera-Estrella, R.; Barkla, B.J.; Bohnert, H.J.; Pantoja, O. Novel regulation of aquaporins during osmotic stress. Plant Physiol. 2004, 135, 2318–2329. [Google Scholar] [CrossRef]
  15. Daniels, M.J.; Chaumont, F.; Mirkov, T.E.; Chrispeels, M.J. Characterization of a new vacuolar membrane aquaporin sensitive to mercury at a unique site. Plant Cell 1996, 8, 587–599. [Google Scholar]
  16. Loqué, D.; Ludewig, U.; Yuan, L.; von Wirén, N. Tonoplast intrinsic proteins AtTIP2;1 and AtTIP2;3 facilitate NH3 transport into the vacuole. Plant Physiol. 2005, 137, 671–680. [Google Scholar] [CrossRef]
  17. Jahn, T.P.; Møller, A.L.; Zeuthen, T.; Holm, L.M.; Klaerke, D.A.; Mohsin, B.; Kühlbrandt, W.; Schjoerring, J.K. Aquaporin homologues in plants and mammals transport ammonia. FEBS Lett. 2004, 574, 31–36. [Google Scholar] [CrossRef]
  18. Liu, L.H.; Ludewig, U.; Gassert, B.; Frommer, W.B.; von Wirén, N. Urea transport by nitrogen-regulated tonoplast intrinsic proteins in Arabidopsis. Plant Physiol. 2003, 133, 1220–1228. [Google Scholar] [CrossRef]
  19. Bienert, G.P.; Moller, A.L.; Kristiansen, K.A.; Schulz, A.; Moller, I.M.; Schjoerring, J.K.; Jahn, T.P. Specific aquaporins facilitate the diffusion of hydrogen peroxide across membranes. J. Biol. Chem. 2007, 282, 1183–1192. [Google Scholar] [CrossRef]
  20. Gerbeau, P.; Güçlü, J.; Ripoche, P.; Maurel, C. Aquaporin Nt-TIPa can account for the high permeability of tobacco cell vacuolar membrane to small neutral solutes. Plant J. 1999, 18, 577–587. [Google Scholar] [CrossRef]
  21. Jauh, G.Y.; Phillips, T.E.; Rogers, J.C. Tonoplast intrinsic protein isoforms as markers for vacuolar functions. Plant Cell 1999, 11, 1867–1882. [Google Scholar]
  22. Maeshima, M.; Hara-Nishimura, I.; Takeuchi, Y.; Nishimura, M. Accumulation of vacuolar H+-pyrophosphatase and H+-ATPase during reformation of the central vacuole in germinating pumpkin seeds. Plant Physiol. 1994, 106, 61–69. [Google Scholar]
  23. Gattolin, S.; Sorieul, M.; Hunter, P.R.; Khonsari, R.H.; Frigerio, L. In vivo imaging of the tonoplast intrinsic protein family in Arabidopsis roots. BMC Plant Biol. 2009, 9. [Google Scholar] [CrossRef]
  24. Gattolin, S.; Sorieul, M.; Frigerio, L. Mapping of tonoplast intrinsic proteins in maturing and germinating Arabidopsis seeds reveals dual localization of embryonic TIPs to the tonoplast and plasma membrane. Mol. Plant 2011, 4, 180–189. [Google Scholar] [CrossRef]
  25. Hunter, P.R.; Craddock, C.P.; di Benedetto, S.; Roberts, L.M.; Frigerio, L. Fluorescent reporter proteins for the tonoplast and the vacuolar lumen identify a single vacuolar compartment in Arabidopsis cells. Plant Physiol. 2007, 145, 1371–1382. [Google Scholar]
  26. Wudick, M.M.; Luu, D.T.; Maurel, C. A look inside: Localization patterns and functions of intracellular plant aquaporins. New Phytol. 2009, 184, 289–302. [Google Scholar] [CrossRef]
  27. Suga, S.; Komatsu, S.; Maeshima, M. Aquaporin isoforms responsive to salt and water stresses and phytohormones in radish seedlings. Plant Cell Physiol. 2002, 43, 1229–1237. [Google Scholar] [CrossRef]
  28. Maurel, C.; Javot, H.; Lauvergeat, V.; Gerbeau, P.; Tournaire, C.; Santoni, V.; Heyes, J. Molecular physiology of aquaporins in plants. Int. Rev. Cytol. 2002, 215, 105–148. [Google Scholar] [CrossRef]
  29. Kim, H.S.; Yu, Y.; Snesrud, E.C.; Moy, L.P.; Linford, L.D.; Haas, B.J.; Nierman, W.C.; Quackenbush, J. Transcriptional divergence of the duplicated oxidative stress-responsive genes in the Arabidopsis genome. Plant J. 2005, 41, 212–220. [Google Scholar]
  30. Liu, F.; Vantoai, T.; Moy, L.P.; Bock, G.; Linford, L.D.; Quackenbush, J. Global transcription profiling reveals comprehensive insights into hypoxic response in Arabidopsis. Plant Physiol. 2005, 137, 1115–1129. [Google Scholar] [CrossRef]
  31. Sato-Nara, K.; Nagasaka, A.; Yamashita, H.; Ishida, J.; Enju, A.; Seki, M.; Shinozaki, K.; Suzuki, H. Identification of genes regulated by dark adaptation and far-red light illumination in roots of Arabidopsis thaliana. Plant Cell Environ. 2004, 27, 1387–1394. [Google Scholar] [CrossRef]
  32. Culianez-Macia, F.A.; Martin, C. DIP: A member of the MIP family of membrane proteins that is expressed in mature seeds and dark-grown seedlings of Antirrhinum majus. Plant J. 1993, 4, 717–725. [Google Scholar]
  33. Sade, N.; Vinocur, B.J.; Diber, A.; Shatil, A.; Ronen, G.; Nissan, H.; Wallach, R.; Karchi, H.; Moshelion, M. Improving plant stress tolerance and yield production: Is the tonoplast aquaporin SlTIP2;2 a key to isohydric to anisohydric conversion? New Phytol. 2009, 181, 651–661. [Google Scholar] [CrossRef]
  34. Lin, W.L.; Peng, Y.H.; Li, G.W.; Arora, R.; Tang, Z.C.; Su, W.A.; Cai, W.M. Isolation and functional characterization of PgTIP1 a hormone-autotrophic cells-specific tonoplast aquaporin in ginseng. J. Exp. Bot. 2007, 58, 947–956. [Google Scholar] [CrossRef]
  35. Okubo-Kurihara, E.; Sano, T.; Higaki, T.; Kutsuna, N.; Hasezawa, S. Acceleration of vacuolar regeneration and cell growth by overexpression of an aquaporin NtTIP1;1 in tobacco BY-2 cells. Plant Cell Physiol. 2009, 50, 151–160. [Google Scholar] [CrossRef]
  36. Whitelam, G.C.; Halliday, K.J. Light and Plant Development; Blackwell Publisher Ltd.: Oxford, UK, 2007. [Google Scholar]
  37. Van Buskirk, E.K.; Decker, P.V.; Chen, M. Photobodies in light signaling. Plant Physiol. 2012, 158, 52–60. [Google Scholar] [CrossRef]
  38. Clack, T.; Mathews, S.; Sharrock, R.A. The phytochrome apoprotein family in Arabidopsis is encoded by five genes: The sequences and expression of PHYD and PHYE. Plant Mol. Biol. 1994, 25, 413–427. [Google Scholar] [CrossRef]
  39. Kami, C.; Lorrain, S.; Hornitschek, P.; Fankhauser, C. Light-regulated plant growth and development. Curr. Top. Dev. Biol. 2010, 91, 29–66. [Google Scholar] [CrossRef]
  40. Franklin, K.A.; Quail, P.H. Phytochrome functions in Arabidopsis development. J. Exp. Bot. 2010, 61, 11–24. [Google Scholar] [CrossRef]
  41. Botto, J.F.; Sánchez, R.A.; Whitelam, G.C.; Casal, J.J. Phytochrome A mediates the promotion of seed germination by very low fluences of light and canopy shade light in Arabidopsis. Plant Physiol. 1996, 110, 439–444. [Google Scholar]
  42. Hennig, L.; Büche, C.; Schäfer, E. Degradation of phytochrome A and the high irradiance response in Arabidopsis: A kinetic analysis. Plant Cell Environ. 2000, 23, 727–734. [Google Scholar]
  43. Correll, M.J.; Kiss, J.Z. The roles of phytochromes in elongation and gravitropism of roots. Plant Cell Physiol. 2005, 46, 317–323. [Google Scholar] [CrossRef]
  44. De Simone, S.; Oka, Y.; Inoue, Y. Effect of light on root hair formation in Arabidopsis thaliana phytochrome-deficient mutants. J. Plant Res. 2000, 113, 63–69. [Google Scholar] [CrossRef]
  45. Kiss, J.Z.; Mullen, J.L.; Correll, M.J.; Hangarter, R.P. Phytochromes A and B mediate red-light-induced positive phototropism in roots. Plant Physiol. 2003, 131, 1411–1417. [Google Scholar] [CrossRef]
  46. Boursiac, Y.; Chen, S.; Luu, D.T.; Sorieul, M.; van den Dries, N.; Maurel, C. Early effects of salinity on water transport in Arabidopsis roots. Molecular and cellular features of aquaporin expression. Plant Physiol. 2005, 139, 790–805. [Google Scholar] [CrossRef]
  47. Higo, K.; Ugawa, Y.; Iwamoto, M.; Korenaga, T. Plant cis-acting regulatory DNA elements (PLACE) database: 1999. Nucleic Acids Res. 1999, 27, 297–300. [Google Scholar] [CrossRef]
  48. Castillon, A.; Shen, H.; Huq, E. Phytochrome Interacting Factors: Central players in phytochrome-mediated light signaling networks. Trends Plant Sci. 2007, 12, 514–521. [Google Scholar] [CrossRef]
  49. Terzaghi, W.B.; Cashmore, A.R. Light-regulated transcription. Annu. Rev. Plant Physiol. Plant Mol. Biol. 1995, 46, 445–474. [Google Scholar] [CrossRef]
  50. Tatematsu, K.; Ward, S.; Leyser, O.; Kamiya, Y.; Nambara, E. Identification of cis-elements that regulate gene expression during initiation of axillary bud outgrowth in Arabidopsis. Plant Physiol. 2005, 138, 757–766. [Google Scholar] [CrossRef]
  51. Choi, H.; Hong, J.; Ha, J.; Kang, J.; Kim, S.Y. ABFs, a family of ABA-responsive element binding factors. J. Biol. Chem. 2000, 275, 1723–1730. [Google Scholar] [CrossRef]
  52. Ulmasov, T.; Hagen, G.; Guilfoyle, T.J. Dimerization and DNA binding of auxin response factors. Plant J. 1999, 19, 309–319. [Google Scholar] [CrossRef]
  53. Steudle, E. Water uptake by roots: Effects of water deficit. J. Exp. Bot. 2000, 51, 1531–1542. [Google Scholar] [CrossRef]
  54. Neuhäuser, B.; Dynowski, M.; Mayer, M.; Ludewig, U. Regulation of NH4+ transport by essential cross talk between AMT monomers through the carboxyl tails. Plant Physiol. 2007, 143, 1651–1659. [Google Scholar] [CrossRef]
  55. Vitart, V.; Baxter, I.; Doerner, P.; Harper, J.F. Evidence for a role in growth and salt resistance of a plasma membrane H+-ATPase in the root endodermis. Plant J. 2001, 27, 191–201. [Google Scholar] [CrossRef]
  56. Tamura, K.; Shimada, T.; Ono, E.; Tanaka, Y.; Nagatani, A.; Higashi, S.I.; Watanabe, M.; Nishimura, M.; Hara-Nishimura, I. Why green fluorescent fusion proteins have not been observed in the vacuoles of higher plants. Plant J. 2003, 35, 545–555. [Google Scholar] [CrossRef]
  57. Deng, X.W.; Quail, P.H. Signalling in light-controlled development. Semin. Cell Dev. Biol. 1999, 10, 121–129. [Google Scholar] [CrossRef]
  58. Buchanan-Wollaston, V.; Page, T.; Harrison, E.; Breeze, E.; Lim, P.O.; Nam, H.G.; Lin, J.F.; Wu, S.H.; Swidzinski, J.; Ishizaki, K.; et al. Comparative transcriptome analysis reveals significant differences in gene expression and signalling pathways between developmental and dark/starvation-induced senescence in Arabidopsis. Plant J. 2005, 42, 567–585. [Google Scholar] [CrossRef]
  59. Maurel, C. Aquaporins and water permeability of plant membranes. Annu. Rev. Plant Physiol. Plant Mol. Biol. 1997, 48, 399–429. [Google Scholar] [CrossRef]
  60. Naito, S.; Hirai, M.Y.; Chino, M.; Komeda, Y. Expression of a soybean (Glycine max [L.] Merr.) seed storage protein gene in transgenic Arabidopsis thaliana and its response to nutritional stress and to abscisic acid mutations. Plant Physiol. 1994, 104, 497–503. [Google Scholar]
  61. EZ-C1 software, version 3.80, Nikon: Tokyo, Japan, 2007.
  62. Photoshop CS5 extended software, version 12.1, Adobe Systems: San Jose, CA, USA, 2011.
  63. Maeshima, M. Characterization of the major integral protein of vacuolar membrane. Plant Physiol. 1992, 98, 1248–1254. [Google Scholar] [CrossRef]
  64. MultiGauge software, version 3.0, Fujifilm: Tokyo, Japan, 2004.
  65. Kaufmann, S.H.; Kellner, U. Erasure of western blots after autoradiographic or chemiluminescent detection. In Immunochemical Protocols: Methods in Molecular Biology; Pound, J.D., Ed.; Humanna Press: Totowa, NJ, USA, 1998; Volumr 80, pp. 223–235. [Google Scholar]
  66. Nakagawa, T.; Kurose, T.; Hino, T.; Tanaka, K.; Kawamukai, M.; Niwa, Y.; Toyooka, K.; Matsuoka, K.; Jinbo, T.; Kimura, T. Development of series of gateway binary vectors, pGWBs, for realizing efficient construction of fusion genes for plant transformation. J. Biosci. Bioeng. 2007, 104, 34–41. [Google Scholar] [CrossRef]
  67. Clough, S.J.; Bent, A.F. Floral dip: A simplified method for Agrobacterium-mediated transformation of Arabidopsis thaliana. Plant J. 1998, 16, 735–743. [Google Scholar] [CrossRef]
  68. Nagatani, A.; Reed, J.W.; Chory, J. Isolation and initial characterization of Arabidopsis mutants that are deficient in phytochrome A. Plant Physiol. 1993, 102, 269–277. [Google Scholar] [CrossRef]
  69. Suga, S.; Murai, M.; Kuwagata, T.; Maeshima, M. Differences in aquaporin levels among cell types of radish and measurement of osmotic water permeability of individual protoplasts. Plant Cell Physiol. 2003, 44, 277–286. [Google Scholar] [CrossRef]

